Weekly market review
A technical look at weekly trends in core markets.
This weekly report is free and provides a recap of the action in the core markets for the past week. For a deeper dive into market analysis, projections, elliott wave counts, technical reviews, and opportunities, check out the daily updates and videos. A 7-day free trial will give you access to my work.
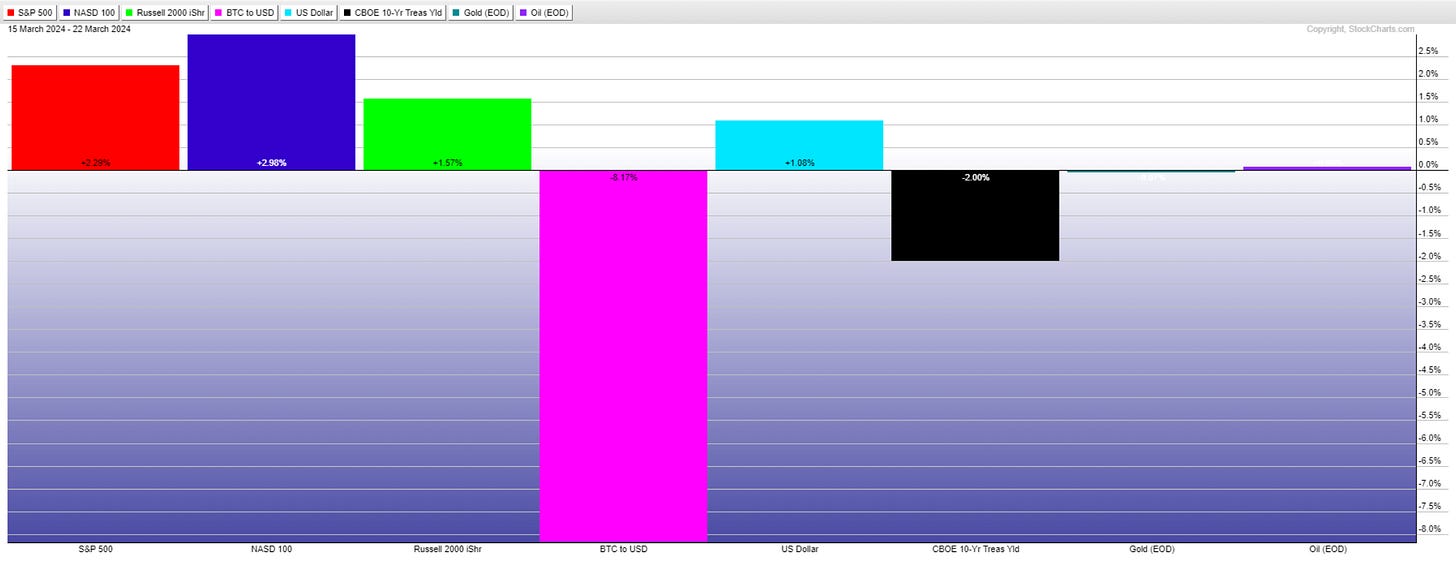
Market performance for this week is below.
BTC has some ground this week correcting, but remains best performing asset this year. With treasury yields pulling back we can see the Russell gaining along with SPX and NDX. Gold and Oil has little to say, while USD showed a bit of muscle.
Sentiment
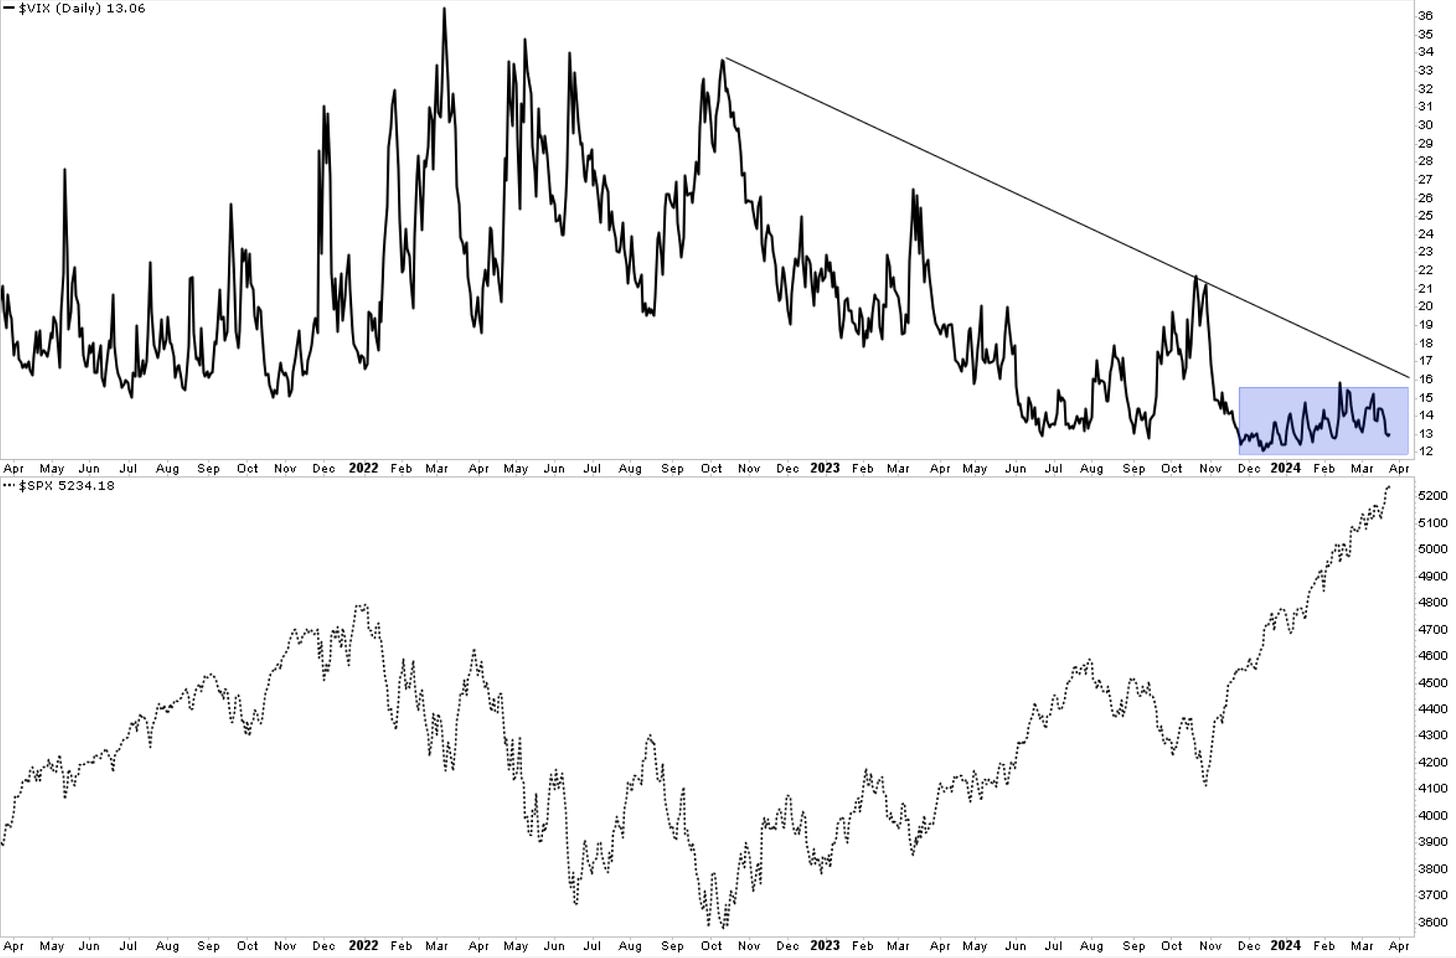
After a minor trip to 15, the volatility compressed once again and is back near the lows. You could say complacency, but you could also say trending markets have low volatility. At some point, this will change; for now, all those puts continue to expire worthless. That’s insurance business for you.
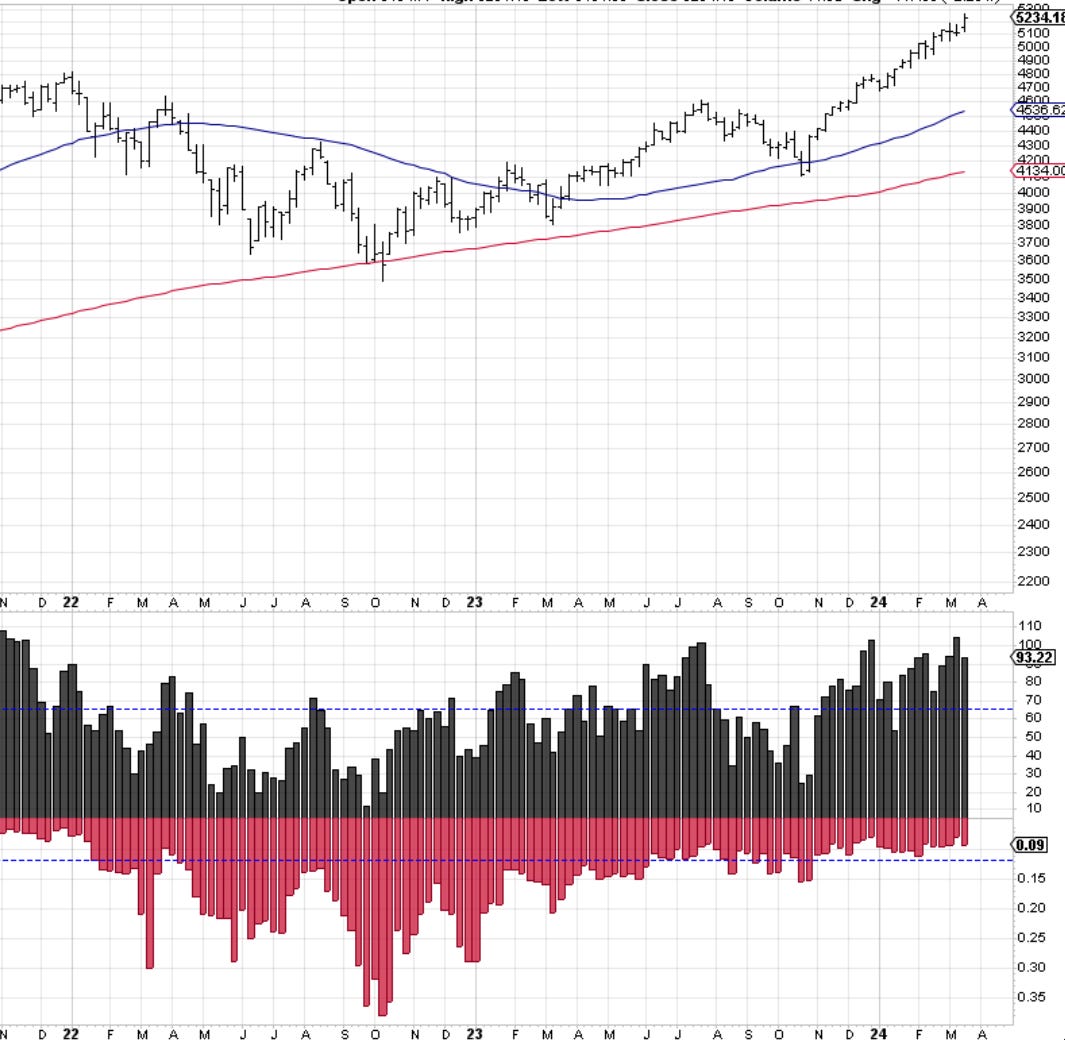
For the last three weeks, the bull-bear spread has lowered, as investors are becoming a bit more cautious about this rally. From a contrarian perspective, I guess they should be very bullish as we would get near a top. It looks like the opposite is happening. What if they’re right?
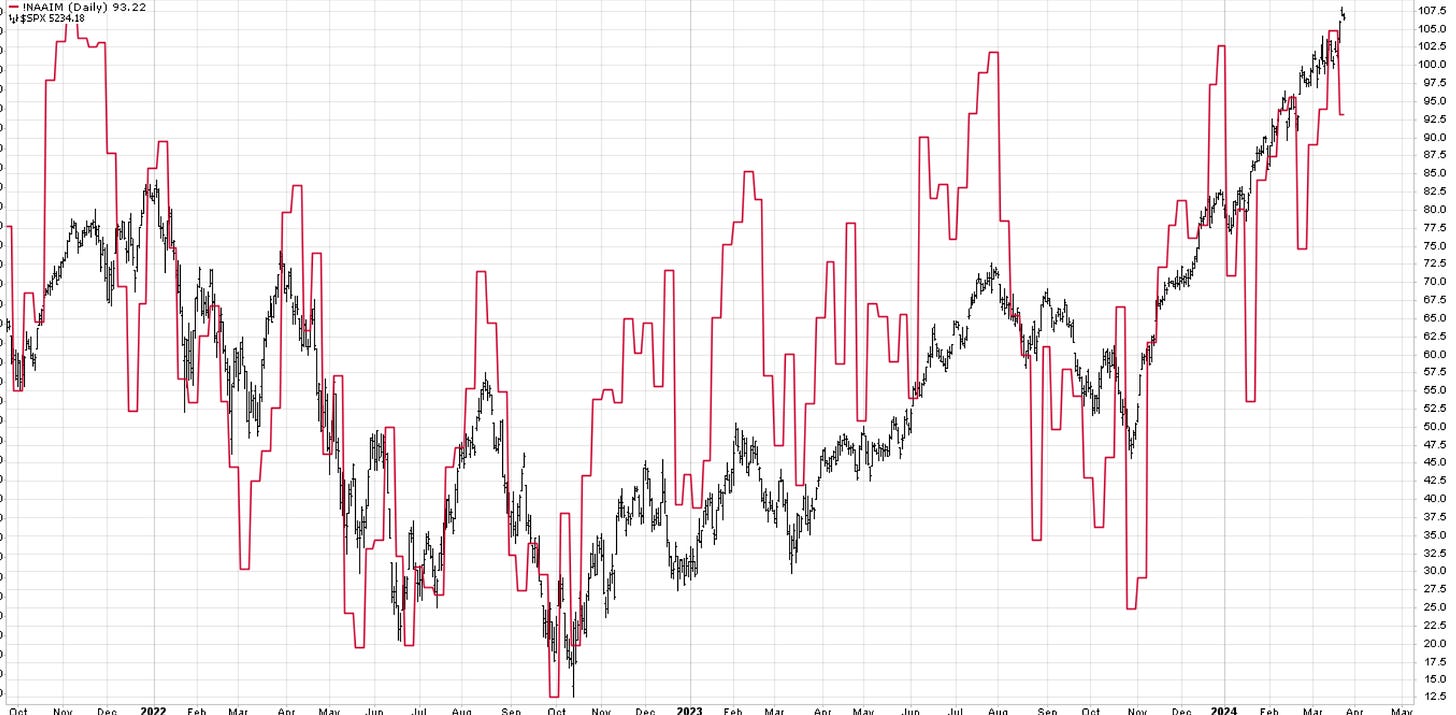
Investment managers reduced exposure slightly this week but remain 93% invested, with markets closing the week at all-time highs. There is nothing to see here just yet. Last week was a bit of an outlier with the market stalling, maybe that’s why they dropped a bit.
The red line is the percentage allocation. Here, you can see the swings overlayed on the Sp500 price.
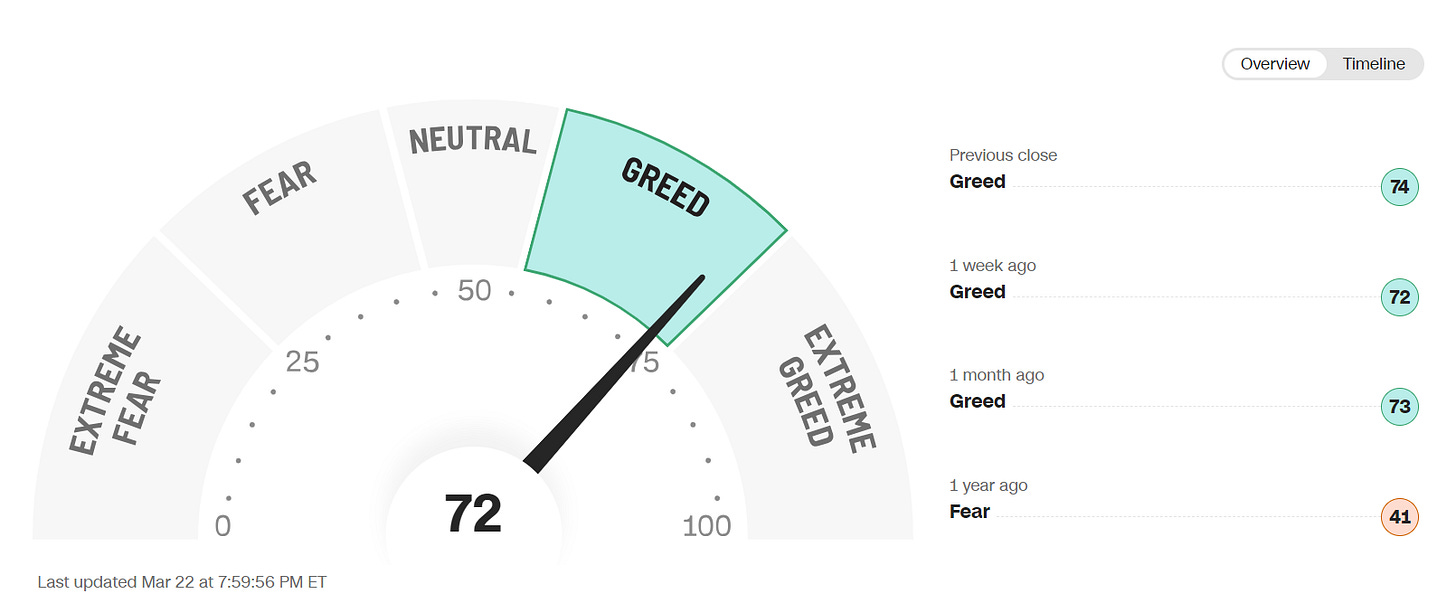
The sentiment section would not be complete without the CNN gauge of Fear vs. Greed.
This is a very slight increase from last week; I am surprised we’re not in extreme greed mode yet. Could suggest there is more to go in this trend.
Cycles
Note: cycles refer to time projections only not price projections.
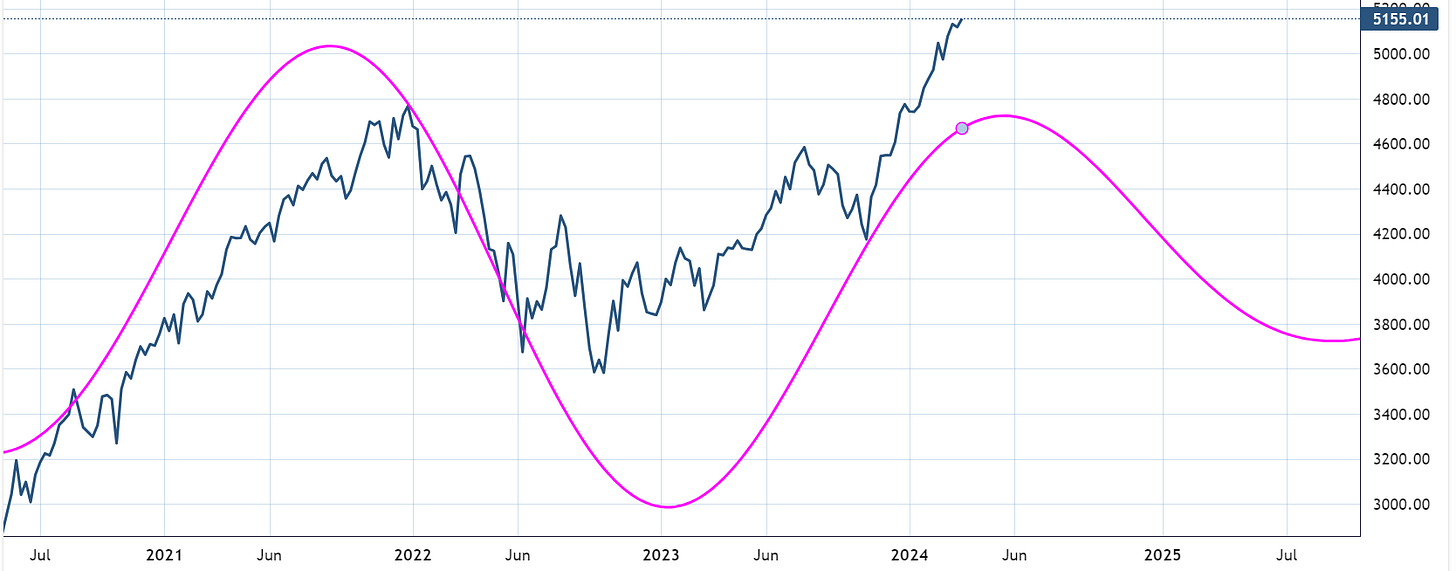
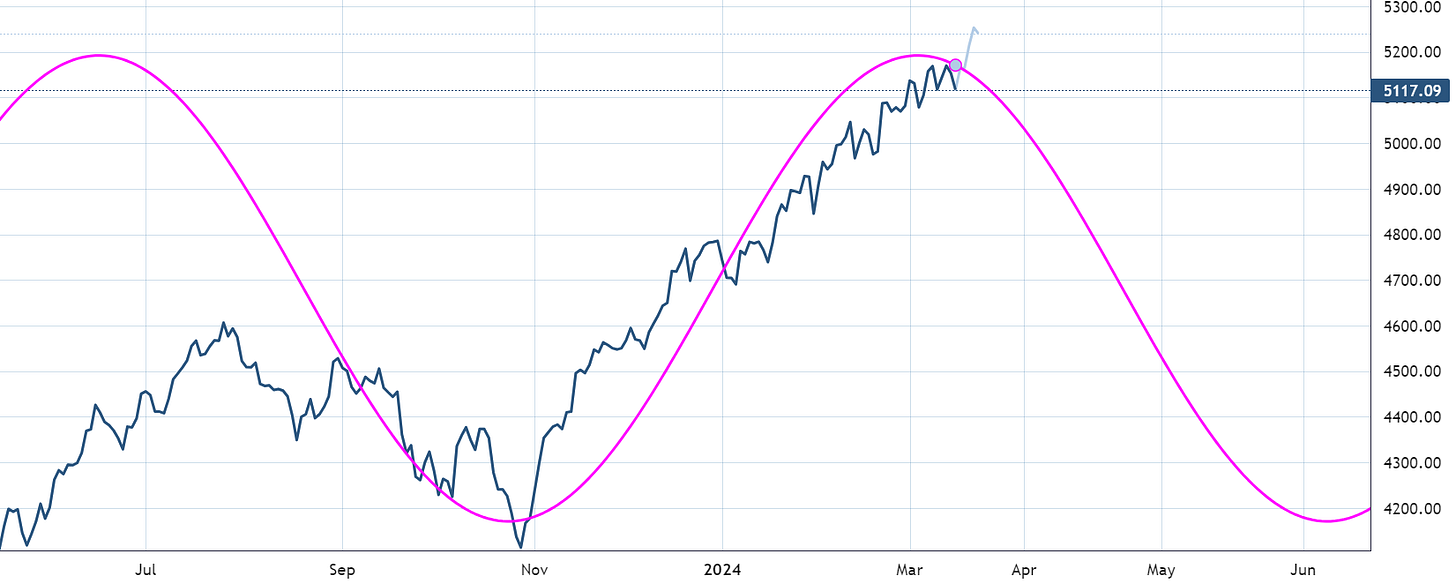
SP500 . A weekly composite model of 177,141 and 118 days is getting near the top towards the end of May. I will be monitoring this as it aligns better with the daily below.
no response yet from the 180-day cycle sequence. Continues to point towards a less performant market into June.
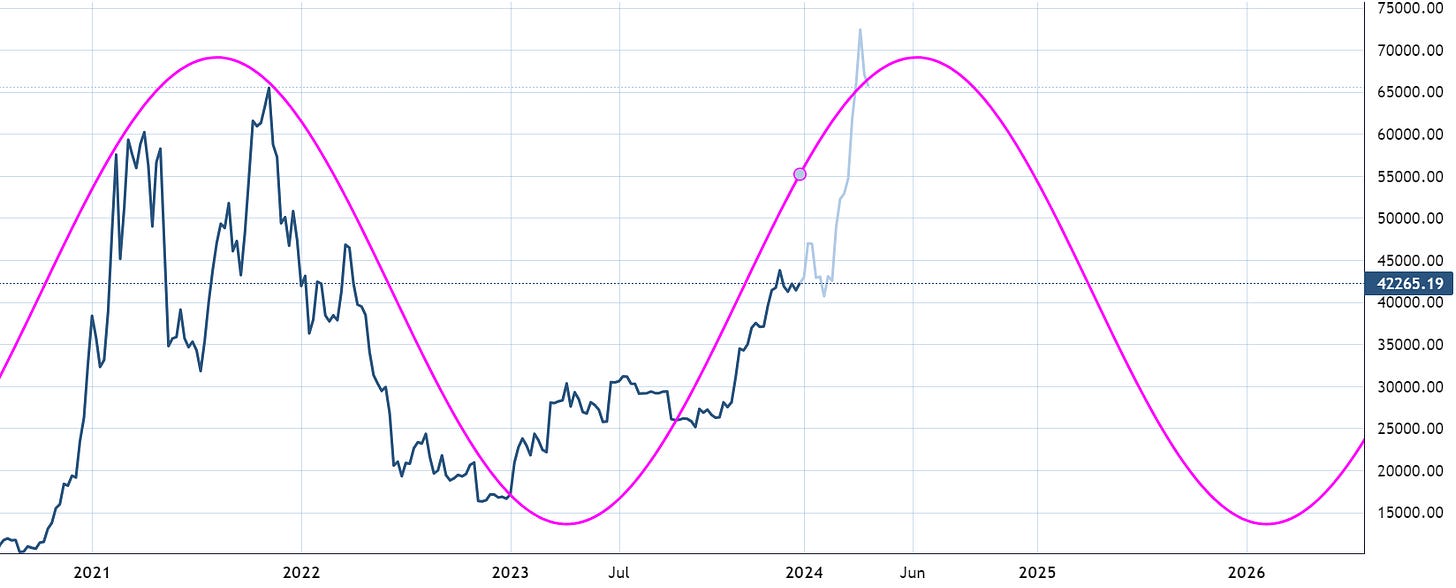
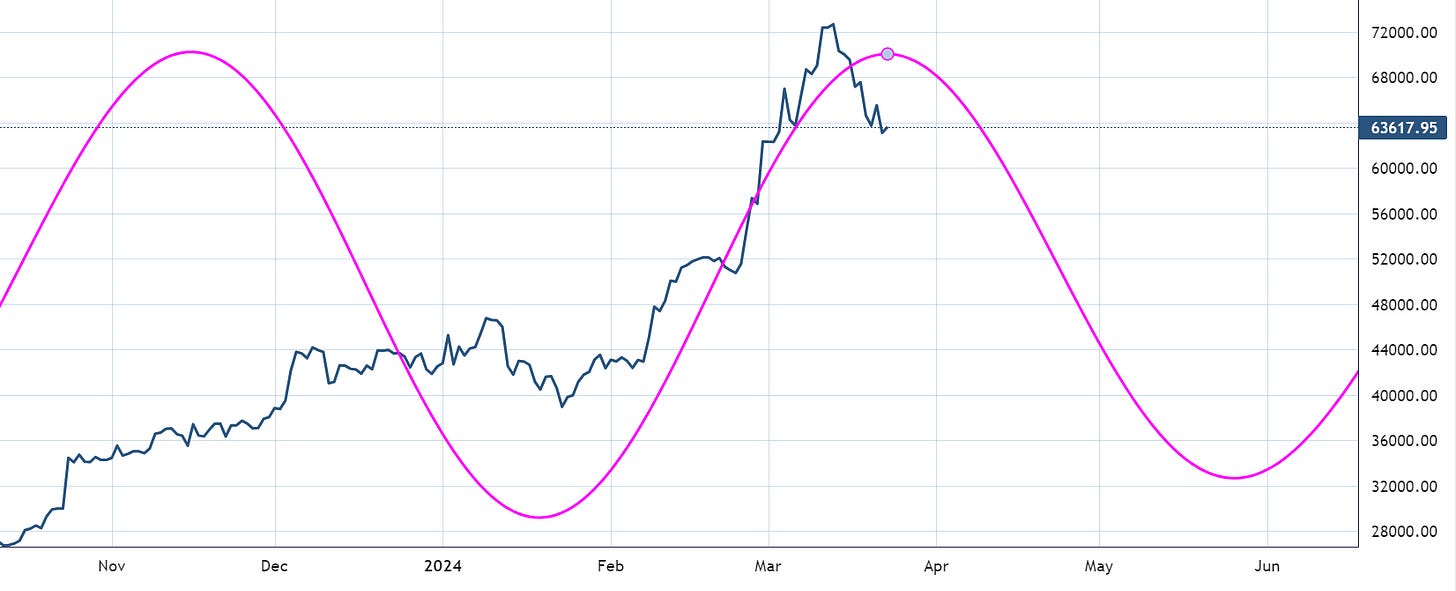
BTCUSD weekly cycles of about 172 weeks show topping approaching in June.
last week - The daily cycles suggest a bit of caution near term. Probably, the chunk of the move was already made, and a corrective-sideways period is becoming more likely.
Update - BTC has been starting to ease off as this 120-143 day cycles has been hinting.
Seasonality
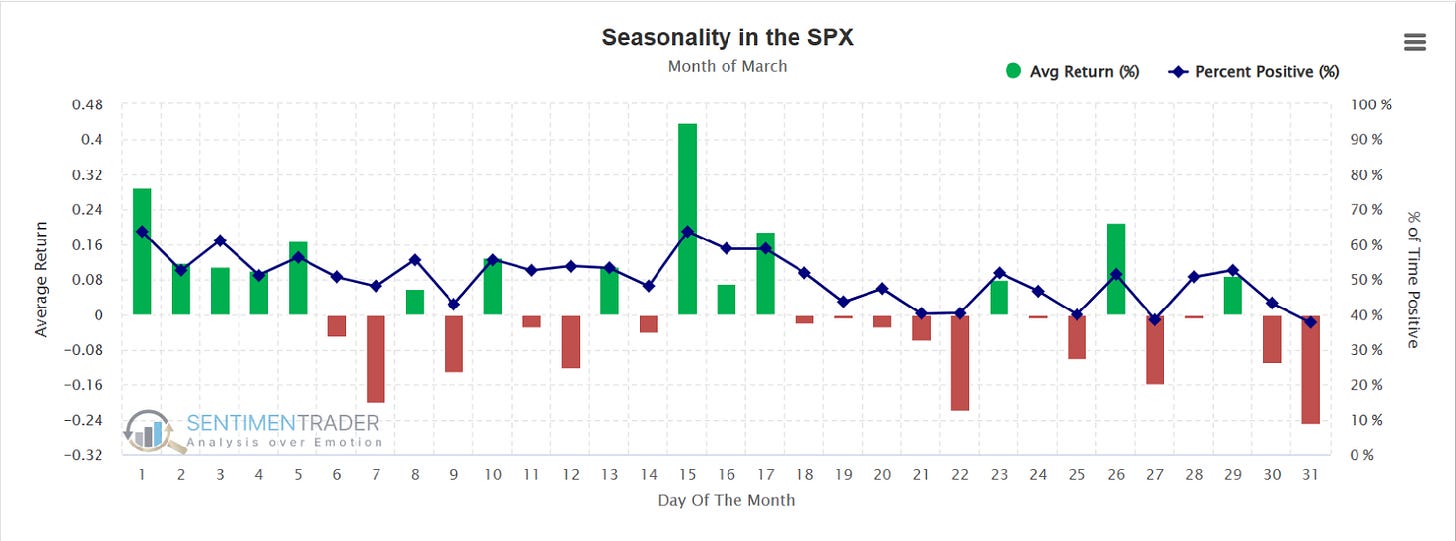
SP500. Here is the daily price action for March. The first half of the month tends to be more positive, followed by some weakness later on.
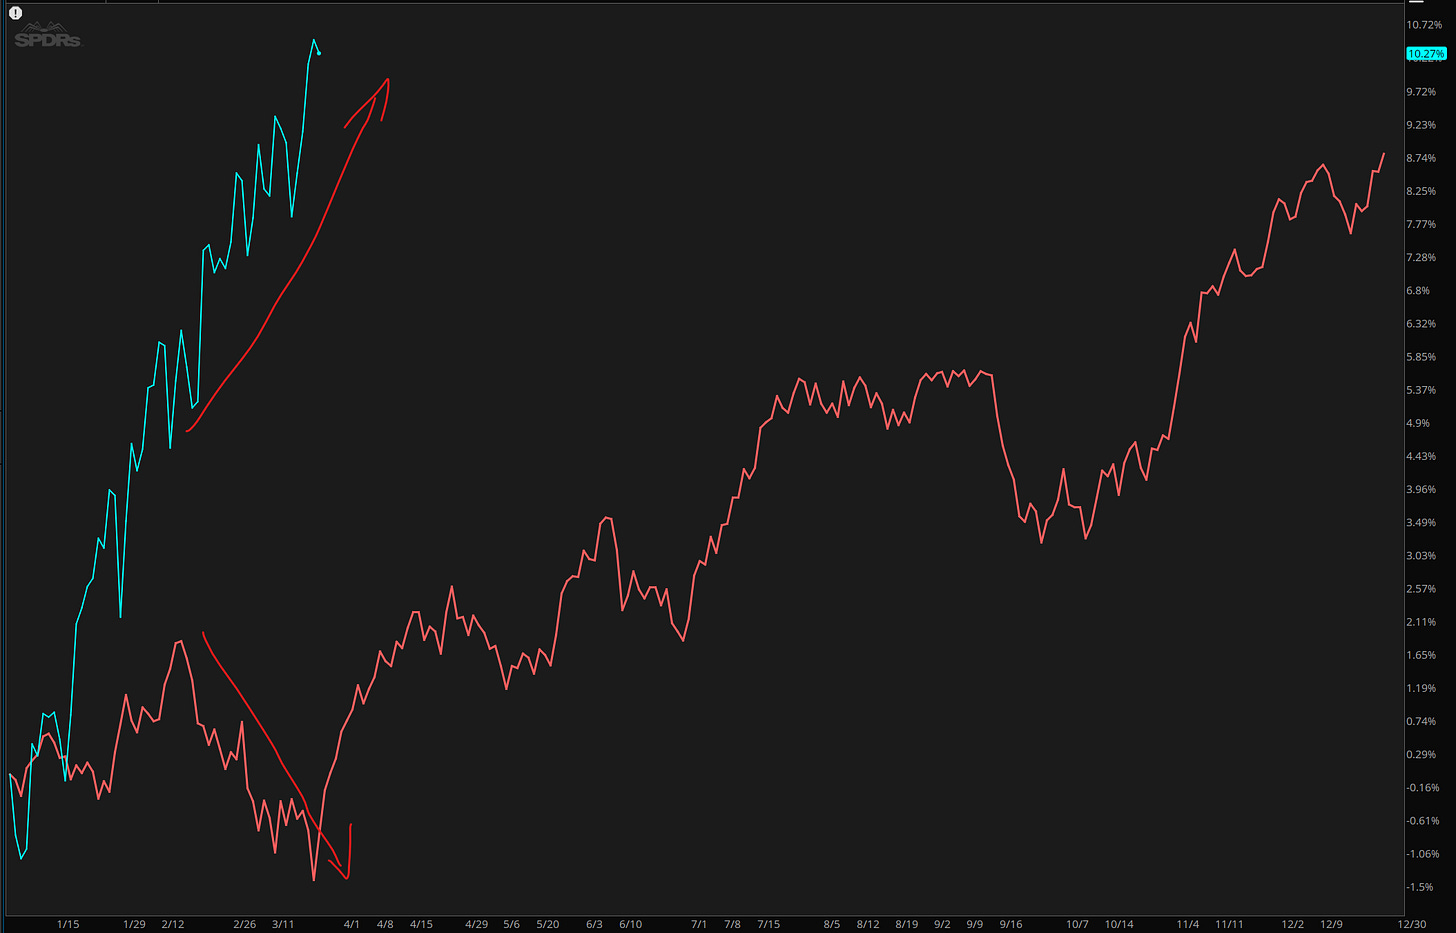
Seasonality ran out of time. I guess we still have a week when damage could occur, but so far this year, it has not mattered one bit.
Price
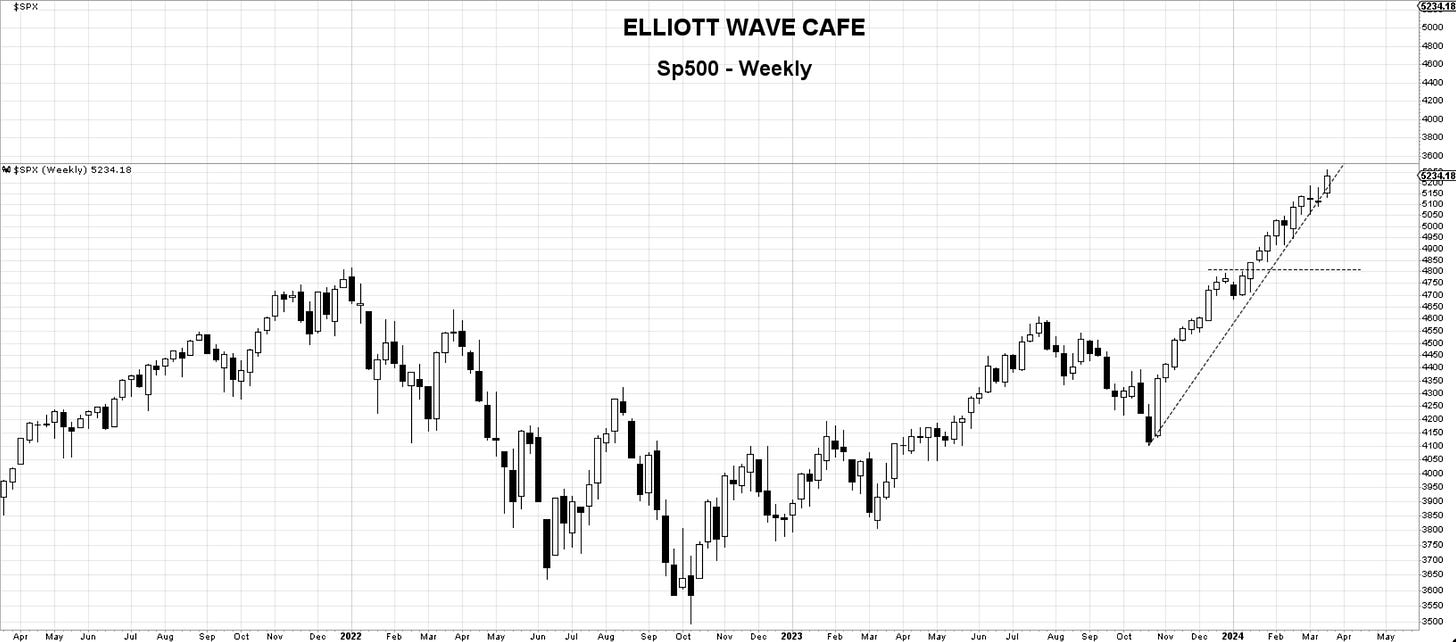
SP500. The uptrend was not violated, and markets turned higher once again, staging a weekly close at new all-time highs. At this moment, only a move below 5,091, last week's low, will be seen as a signal for further corrective action. 5150 is also quite important on a weekly closing basis. For those following the trend, the levels mentioned are good defensive lines.
we’re keeping this on display to remind us of magazine covers. March 11th 2024.
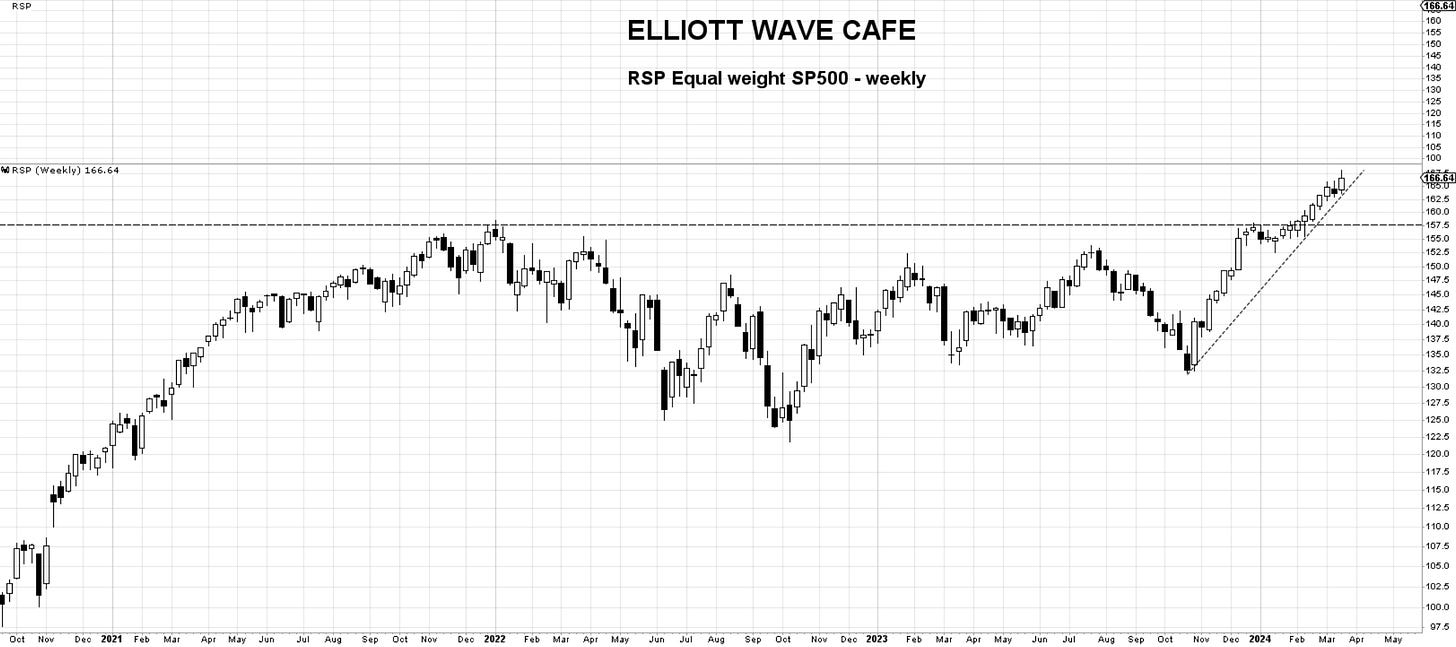
RSP - equal weight SP500. We have not lost last week’s lows and moved higher instead. This confirms a lot more participation from the broader market. Until you lose 162.5 one has to remain focused on higher prices. No evidence of price rejection yet.
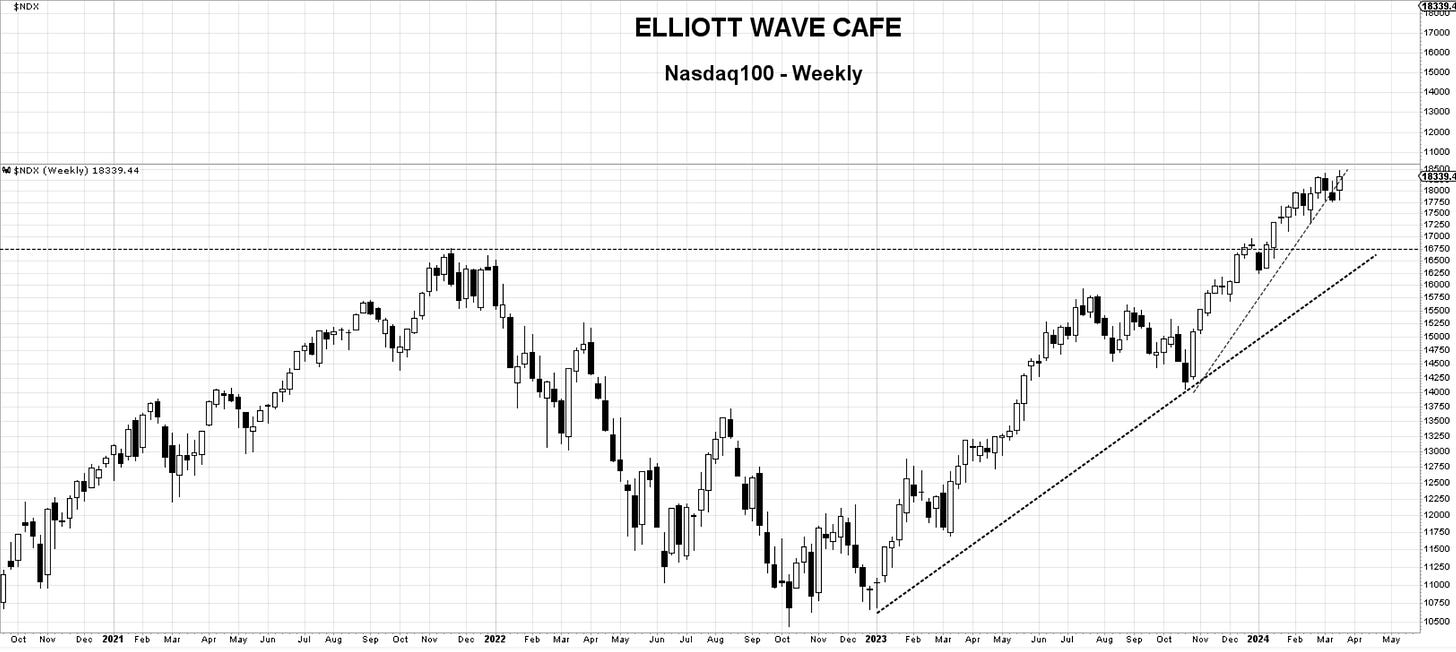
Nasdaq100. last week -We have now closed below the trendline and near the candle's lows. Bears are in control for now, and initial expectations are for a continuation toward 17,300. This week’s high should not be re-taken. If it is, get out of the way. As simple as that.
Update: Last week’s high was taken, suggesting a resumption of the uptrend. The last six weeks were not that directional in Nasdaq, but this week’s close gives encouragement once again. If we lose 17,750, the correction will likely extend.
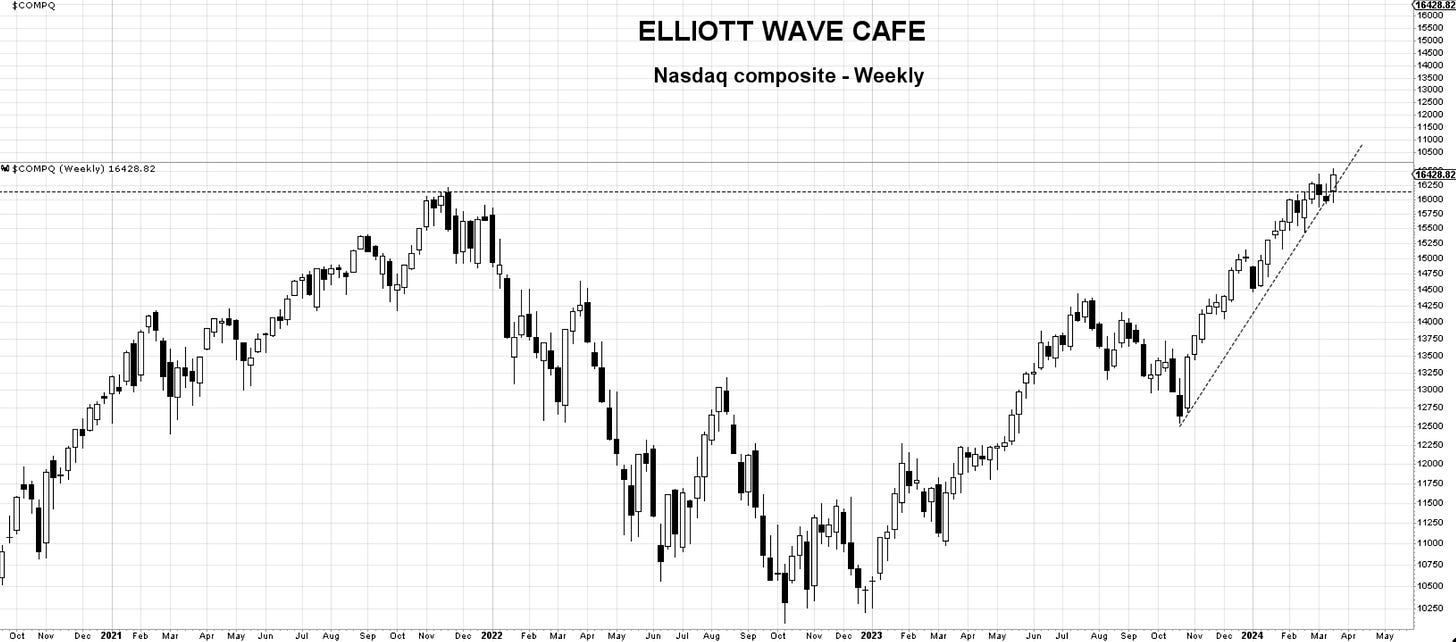
Nasdaq composite: Last week - we have not fully lost this uptrend just yet, but this close is bearish. Expect 15,600.
Update: No further selloff took place, and instead, we made a weekly closing high. Can’t argue with this close until we get back below 15,920.
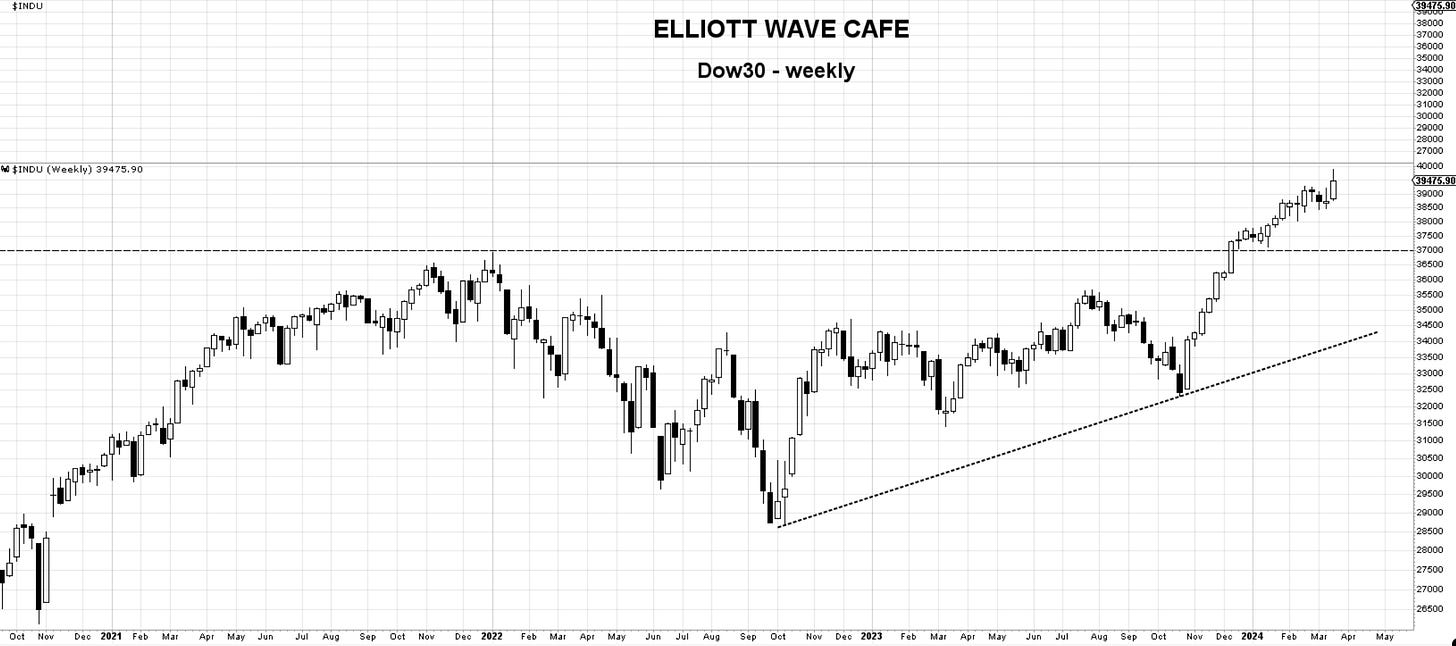
Dow Jones 30 - After spending the last three weeks hinting at a corrective pullback, all we got was backing and filling and a move to close to new all-time highs. Unless we lose 38,500 there is nothing to do here from a bearish perspective but observe. For trend followers that would be the line in the sand.
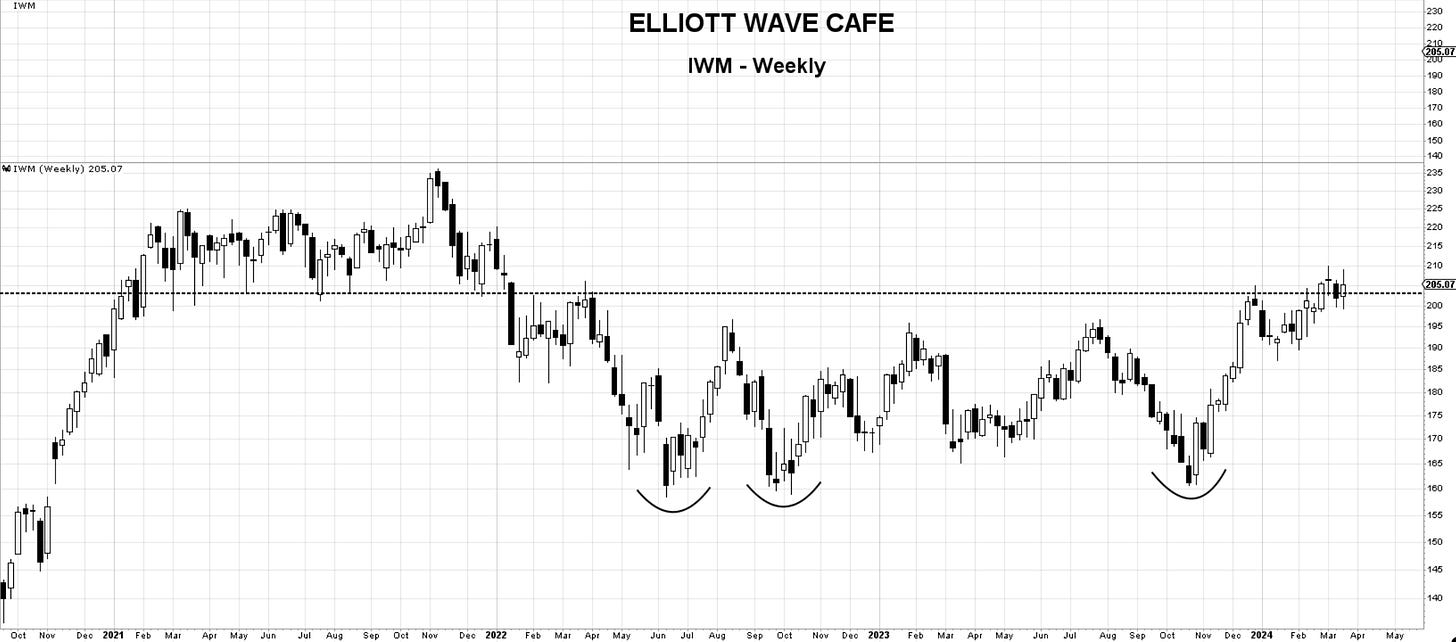
IWM—small caps. I did not like last week’s close but we had no continuation or deterioration. Clearly, the bears have failed to carry this lower. This week’s close is not as strong but it is above the 200 mark I am watching. If we can clear 208 I would say time to press longs. Even here, with a smaller starter position, could work, using 200 as a defense.
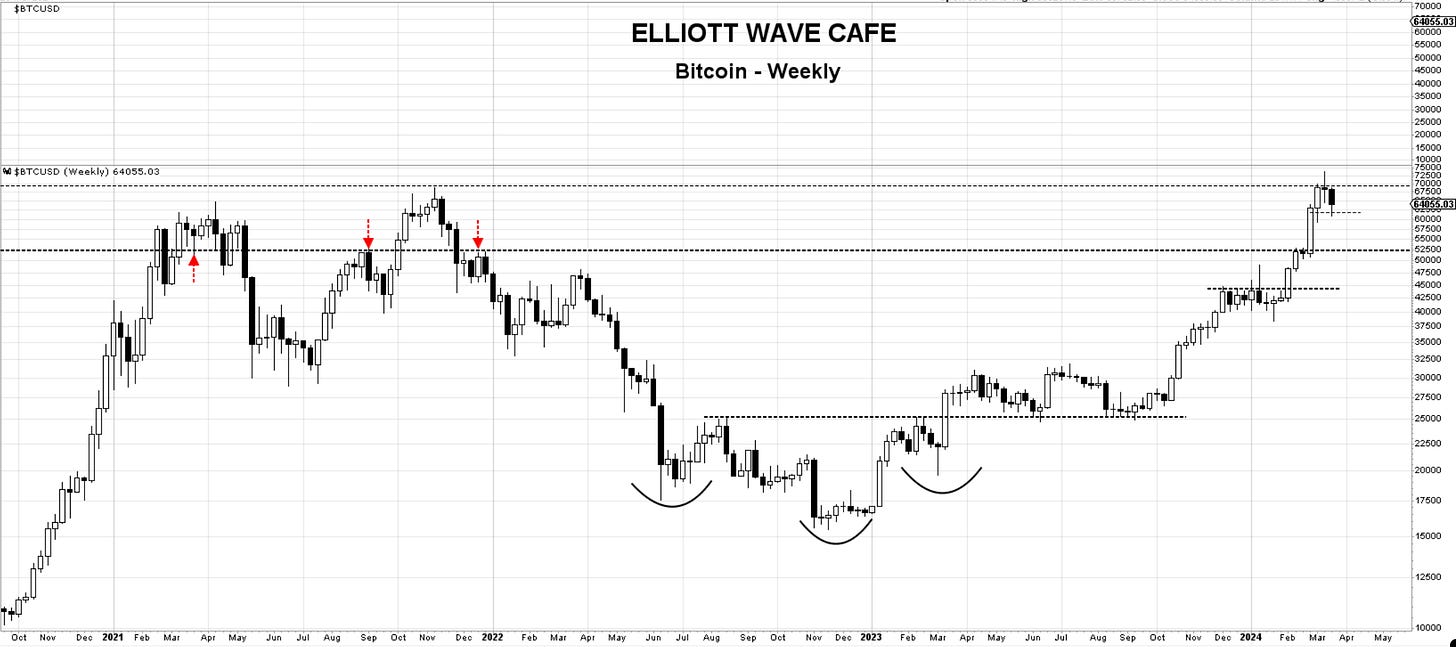
Bitcoin—last week We continued this week with a hunt for 74k. Let’s see how we close on Sunday, but if we get a doji, it’s likely we can continue to stall for a while, as shown in the cycle charts above. The overall trend remains bullish; just remember that traders will be persuaded to take profits seeing this behavior. 61k remains a good level to get bids working, in case we get down there. See the wave counts on daily notes for perspective.
Update: The move into 61k was quickly bought, and Bitcoin spiked back towards 68k. This week’s close, if it remains as is, is not that encouraging; however, the trend is higher, and I would continue to use dips into support levels as opportunities. If we lose the 60k zone, the next bids will likely be at the large 52k zone.
For daily coverage and wave counts consider joining Elliott Wave Cafe.
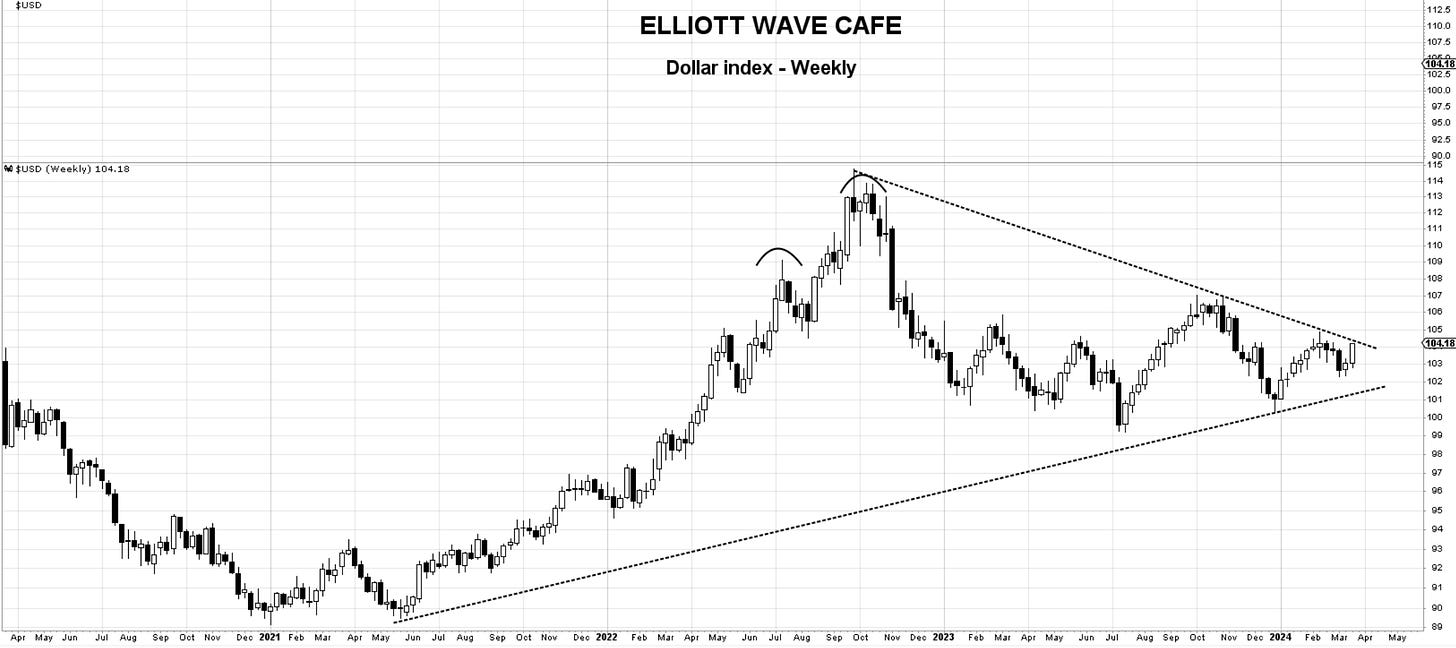
The US Dollar - Strong weekly close here in the dollar and close to taking out the important 105 level. It gave hints of wanting to break lower in the prior weeks but never lost the mentioned 101 level. The risk of breaking the trendline is now elevated and from a macro perspective, a strong USD can work against risk assets ( equities, btc).
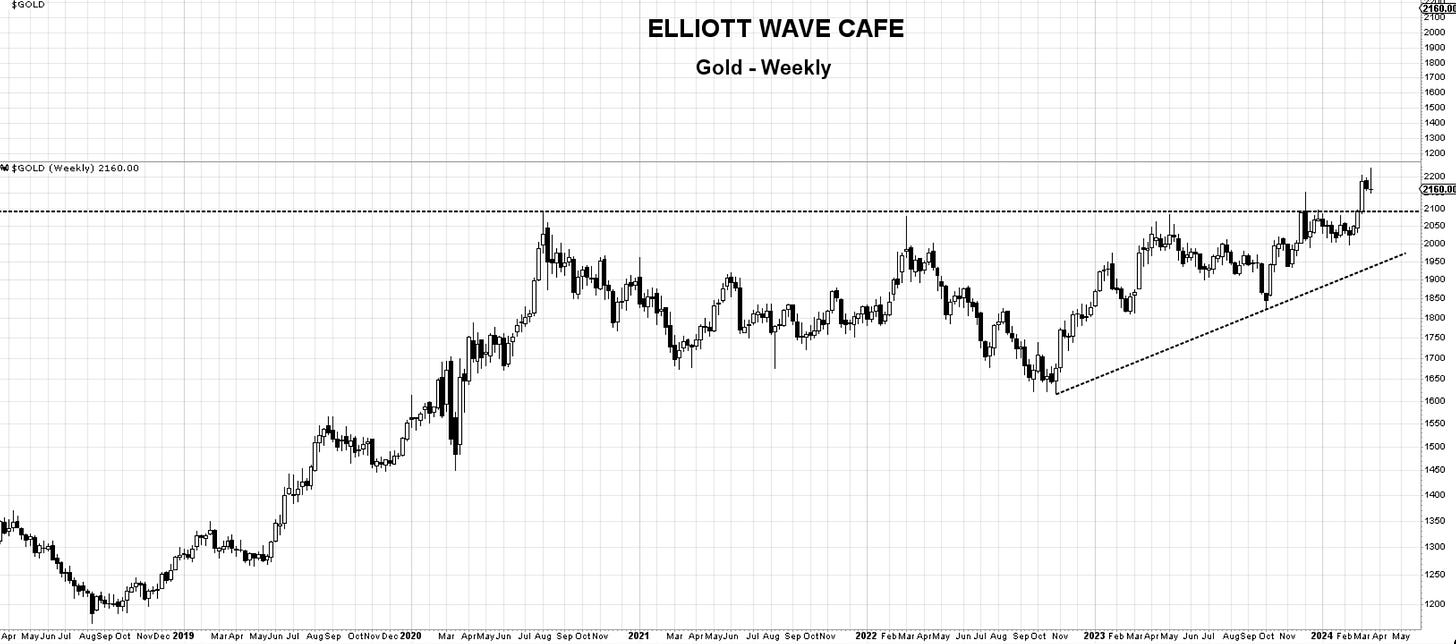
Gold—has reached 2225 but was not able to sustain a weekly close at the highs. A three-wave correction is now in focus for a test of 2100. Once there we would be looking for signs of bids. I will discuss this and the dollar connection next week in the videos.
OIL— never managed to break the 84 level although it tested it. There is a small weekly rejection from there but not enough of a reason to turn bearish unless one wants to try playing a range move back to 70. For me, it remains a “no trade zone” for now.
Thank you all for reading; I will see you next week. Leave a comment or suggestion below. Join our chat to discuss markets with fellow traders.
In the meantime, please consider subscribing and supporting EWCafe and read “The Daily Drip,” where I provide daily market updates, videos, and commentary on core markets.
Cris,
EWCafe
email: ewcafe@pm.me





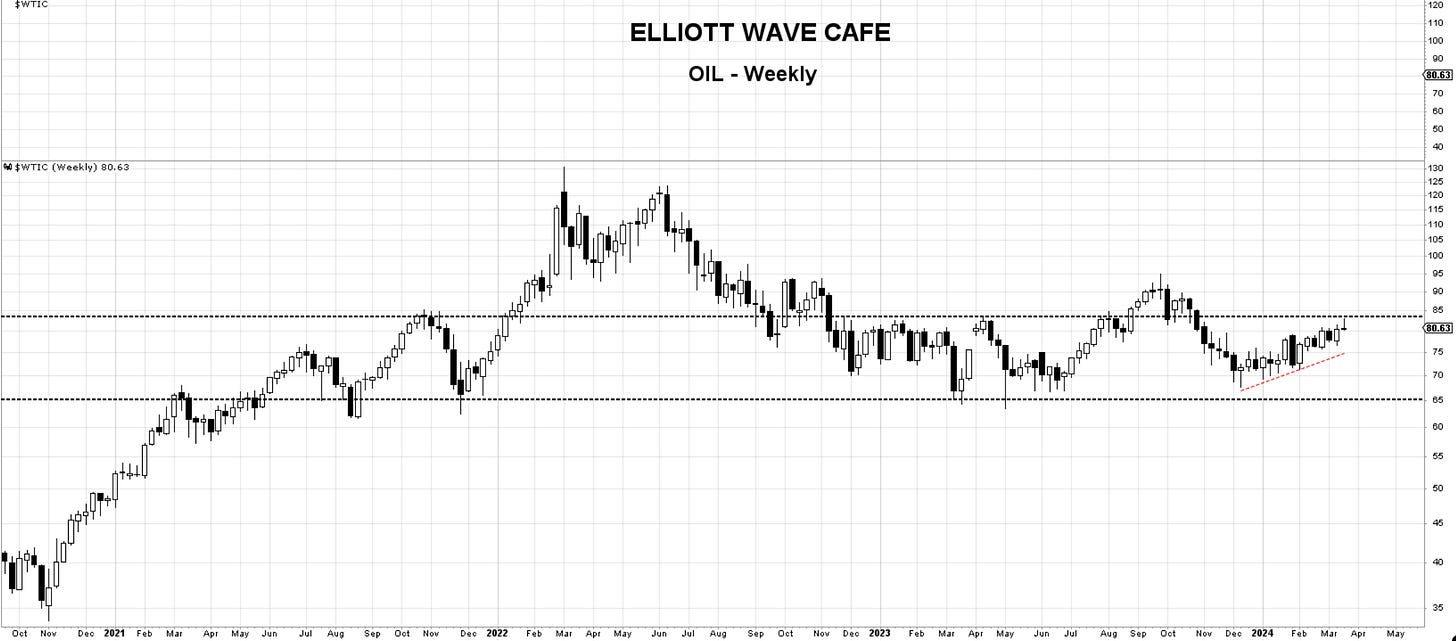
Oil looking sluggish, but I'm observing to see if it can still make momentum to prior highs in $90 zone.