
Weekly market review
A technical look at weekly trends in core markets.

This weekly report is free and provides a recap of the action in the core markets for the past week. Check out the daily updates and videos for a deeper dive into market analysis, projections, elliott wave counts, technical reviews, and opportunities. A 7-day free trial will give you access to my work.
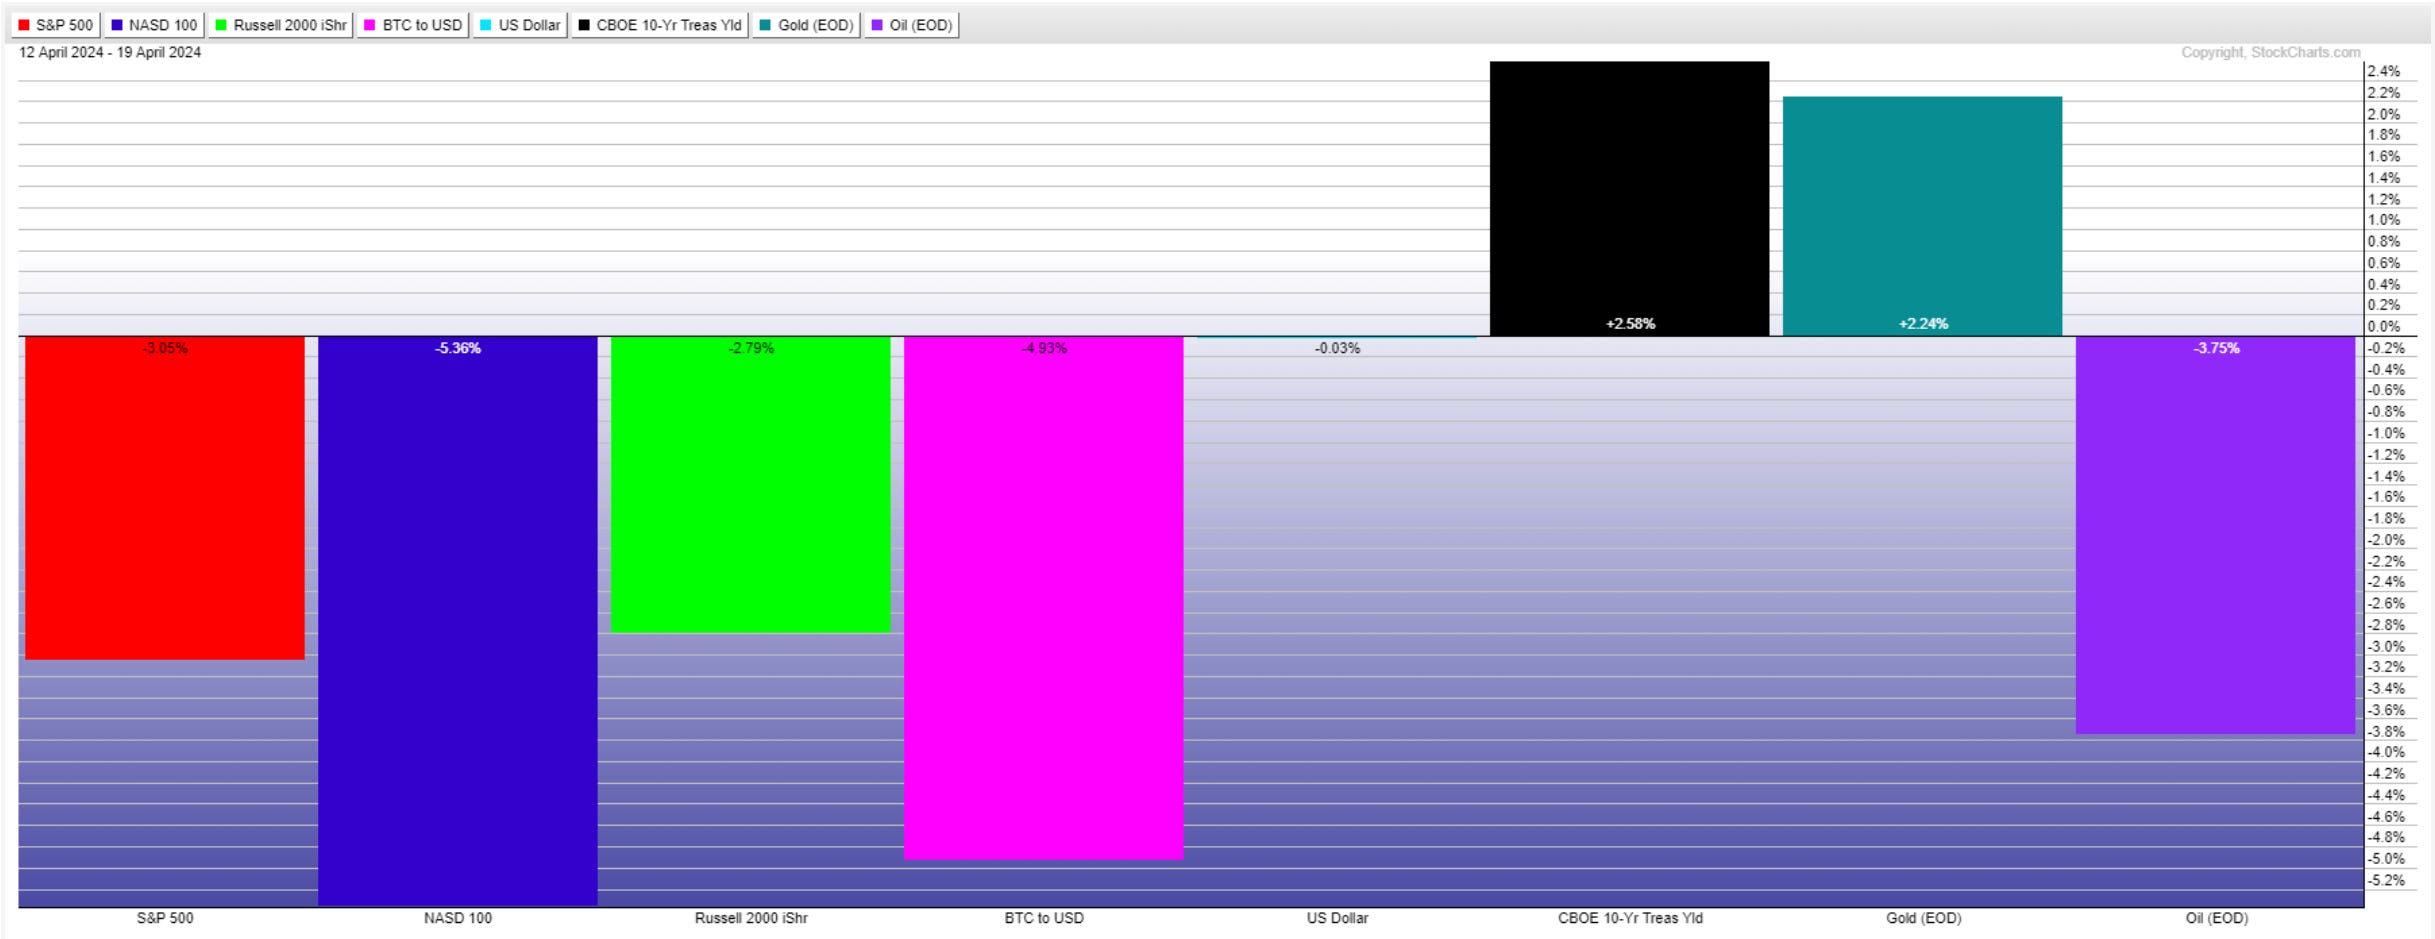
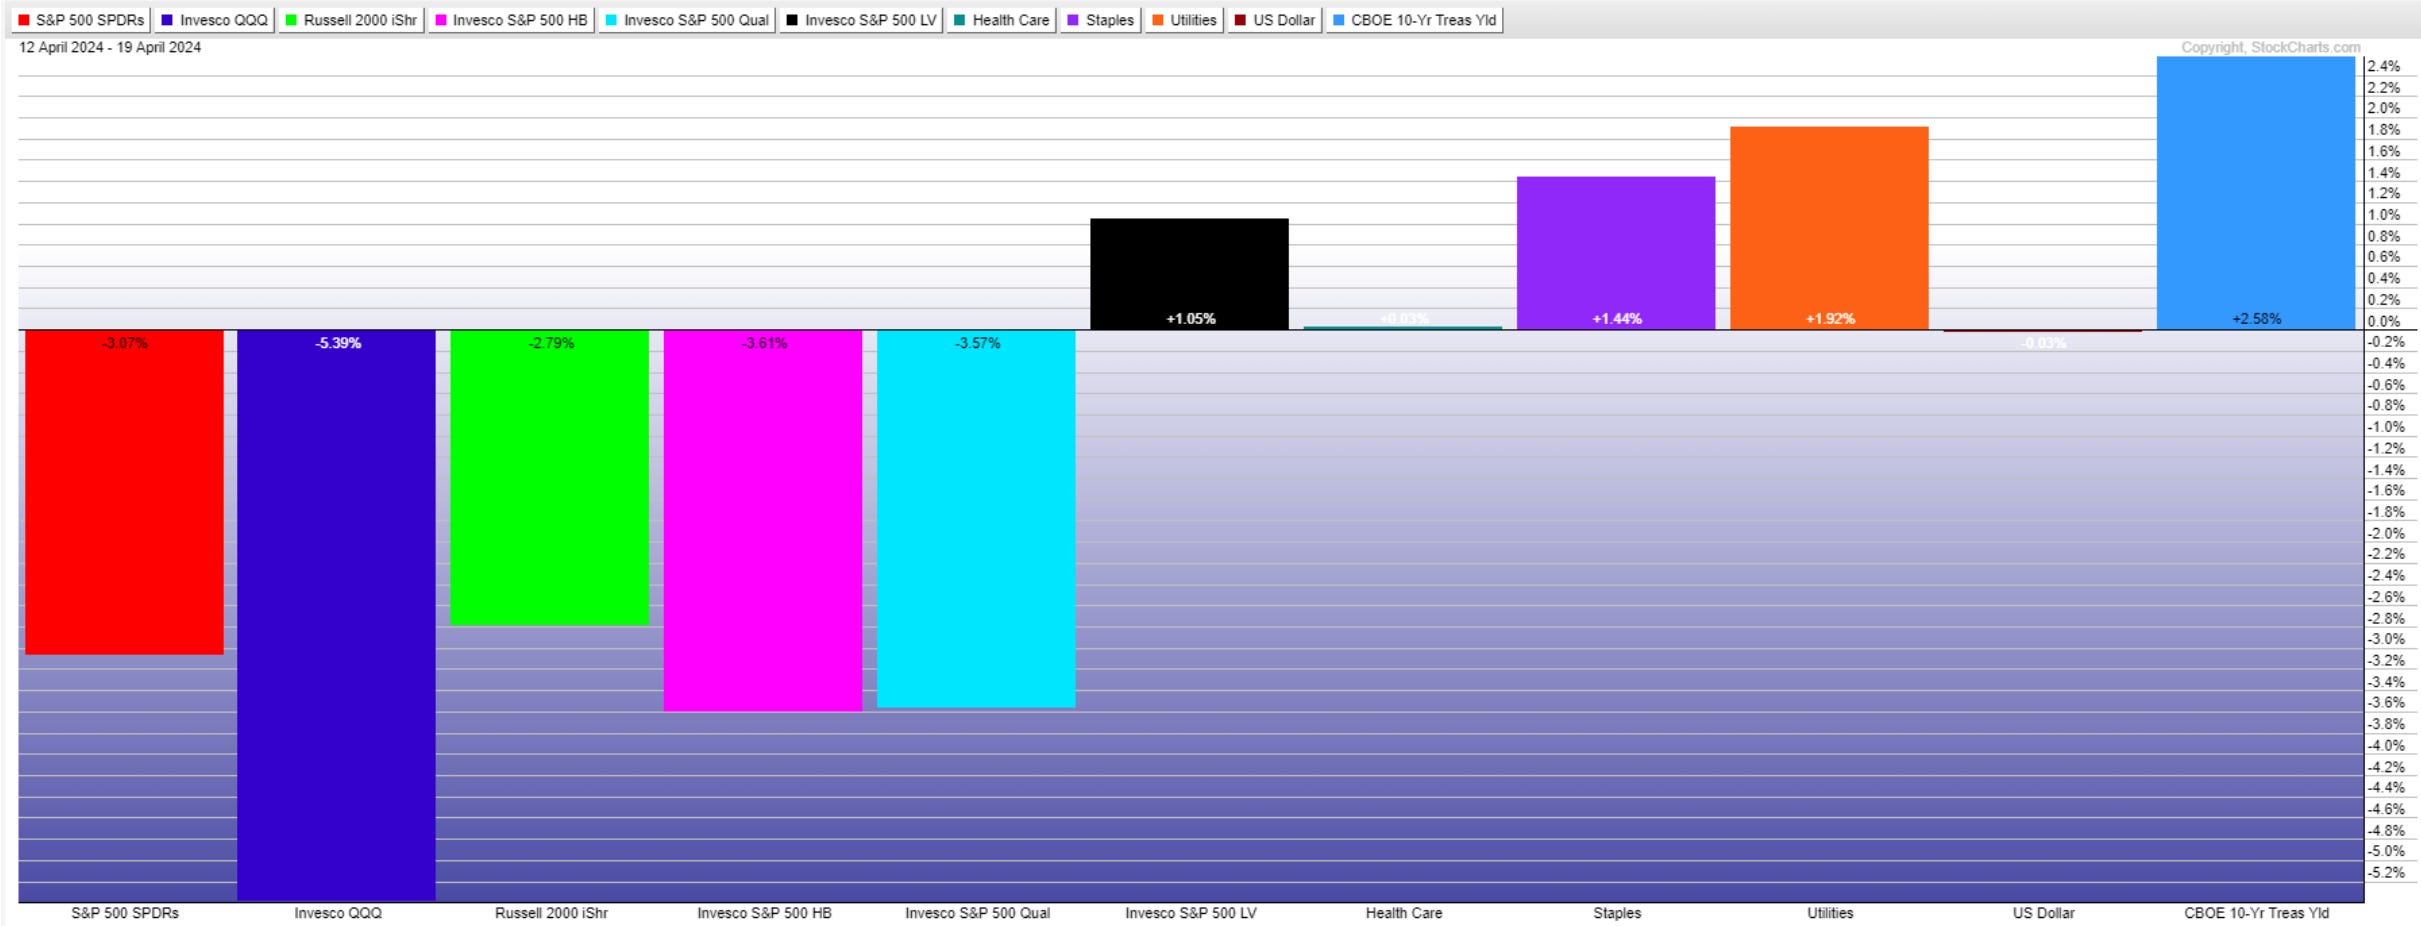
Market performance for this week is below.
Markets retreated into defensive mode for three weeks in a row. All-risk assets lost ground, while defensive sectors, utilities, staples, healthcare, and gold posted slight gains.
Sentiment
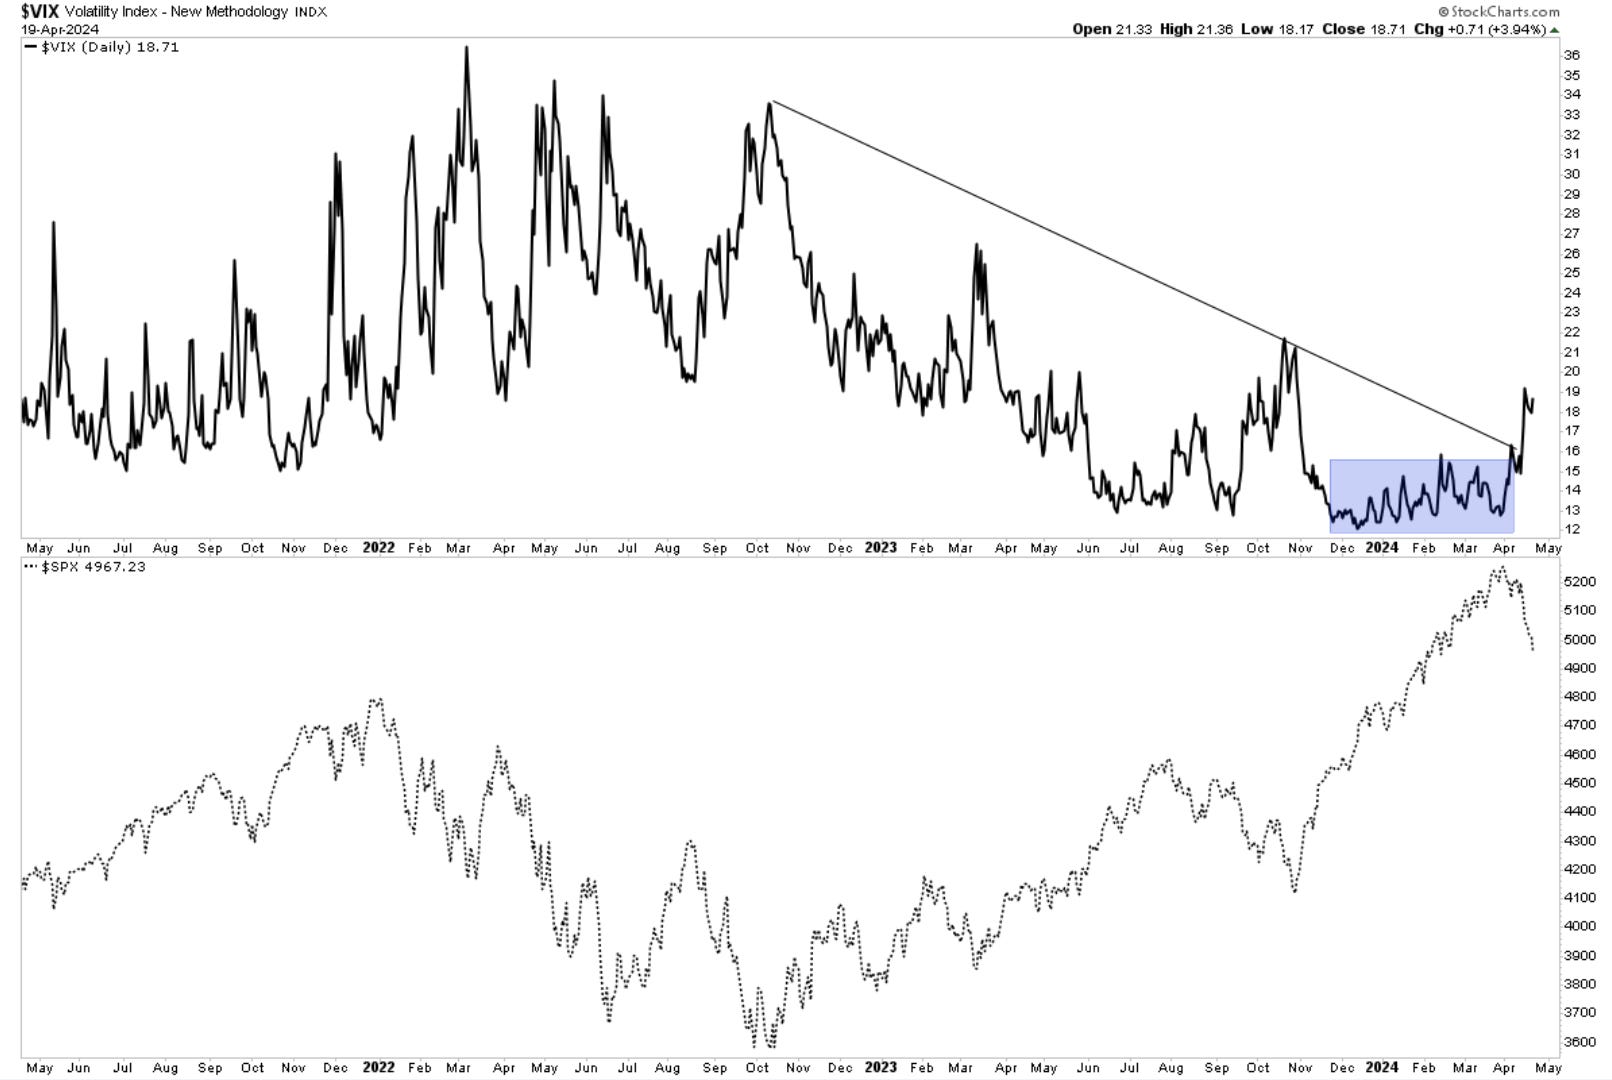
Volatility jumps to 19, telling traders and investors to be more aware of their overall risk exposure.
The bullish sentiment continues to correct in the AAII survey. The overall read is still tilted toward bulls but is likely to go negative this upcoming week. This could coincide with a near-term low in this correction.
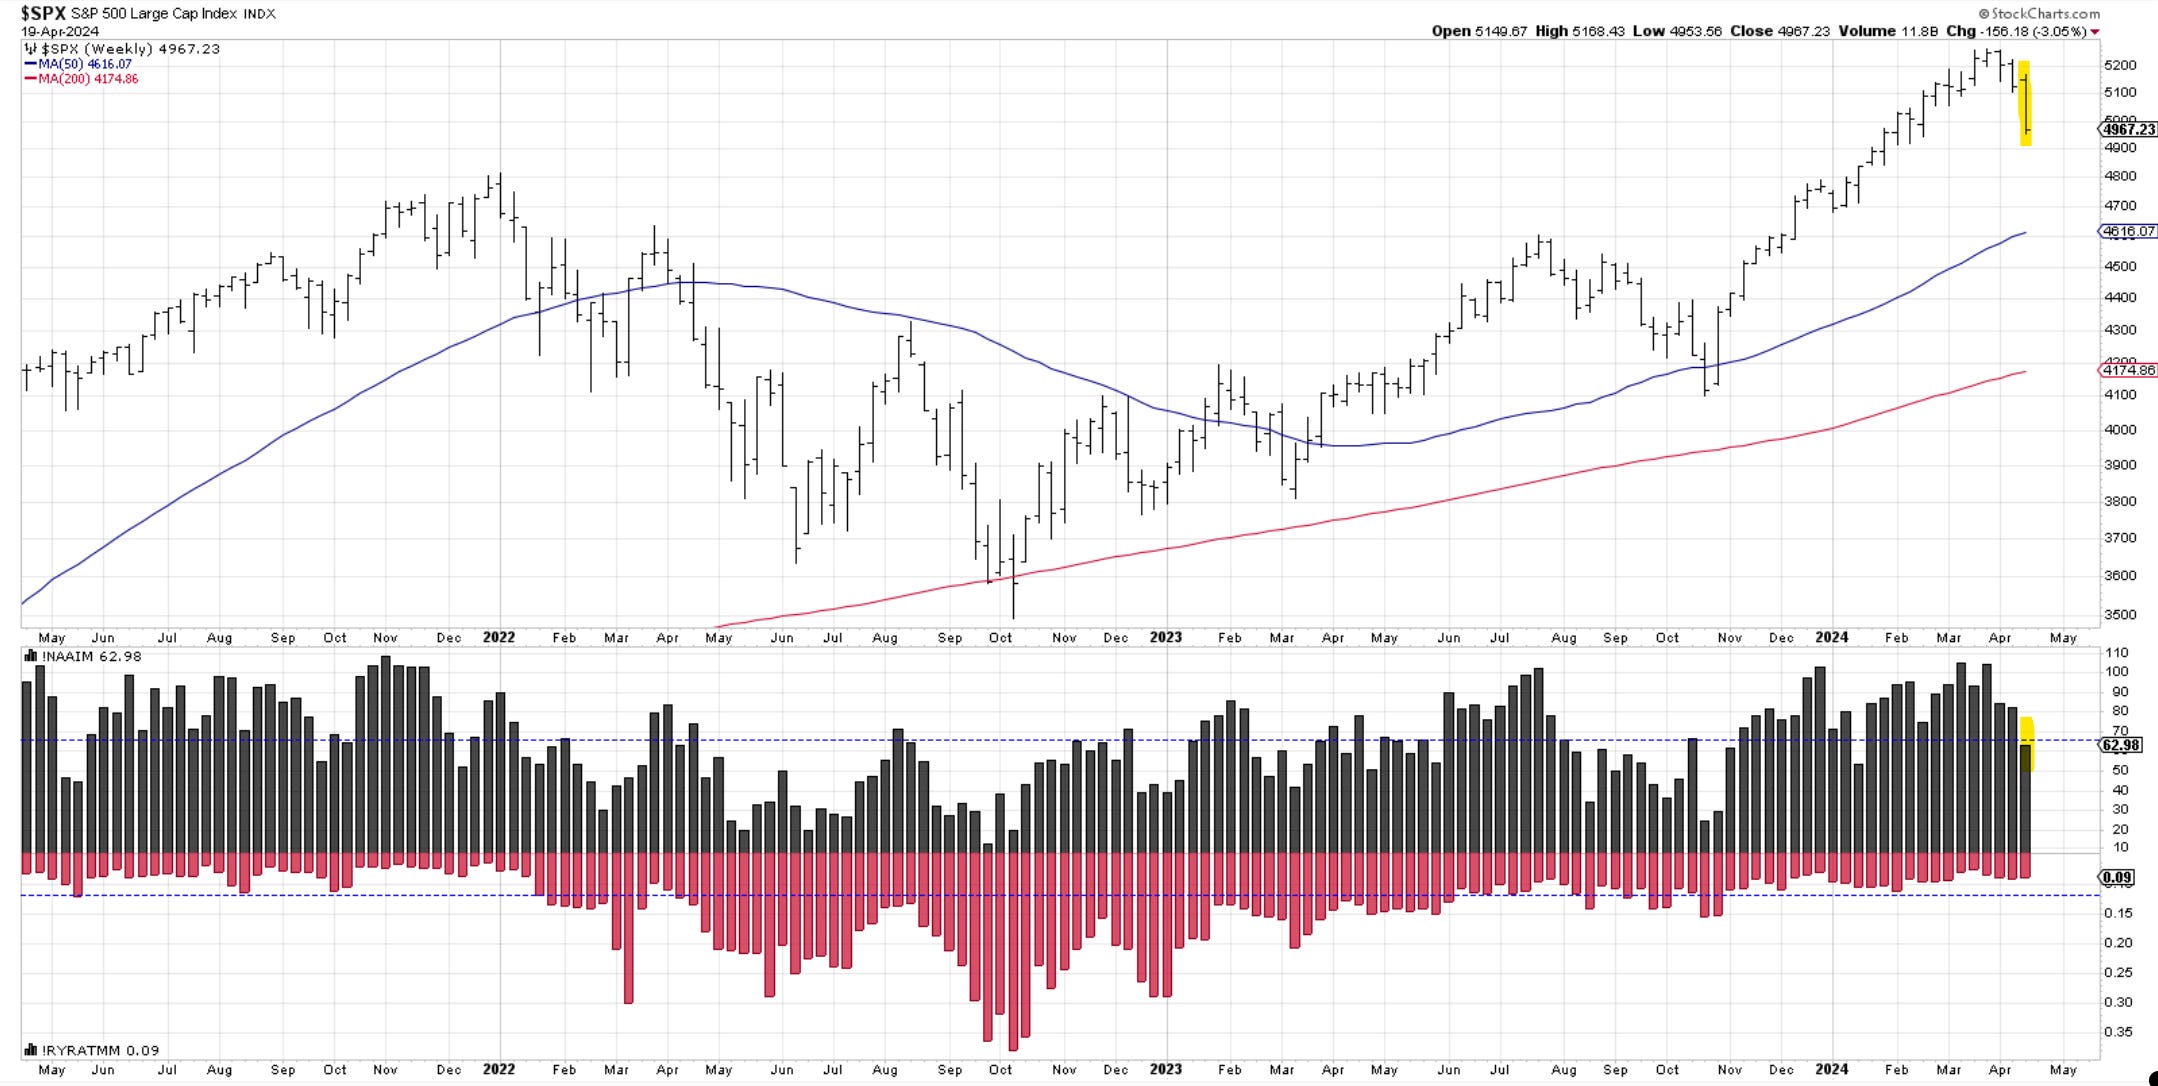
Investment managers further reduced long positions to 63% invested as the pullback continues. They’re playing defense here, which seems appropriate.
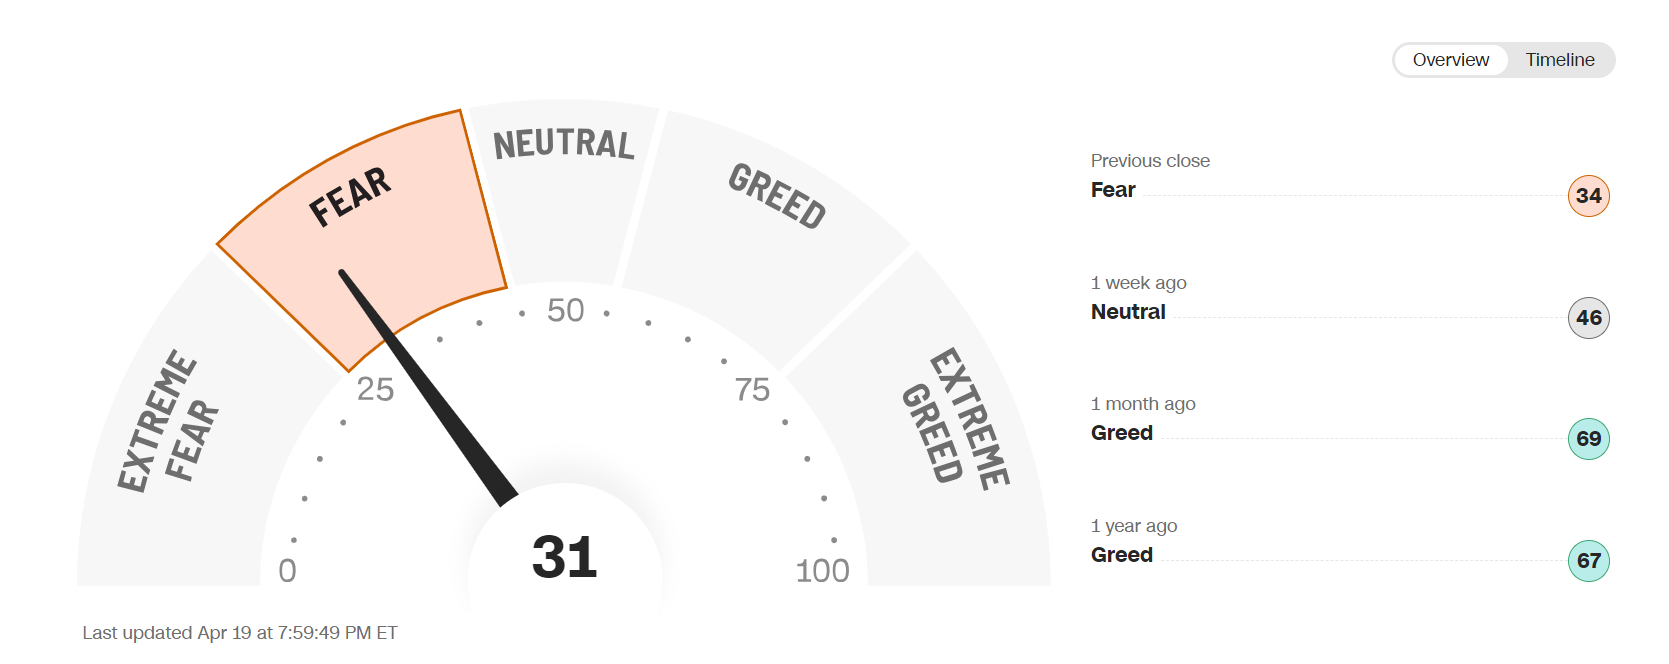
The sentiment section would not be complete without the CNN gauge of Fear vs. Greed.
I'm not surprised to see this dip into fear vs. neutral. There is nothing extreme yet, so there is psychological room for markets to continue selling.
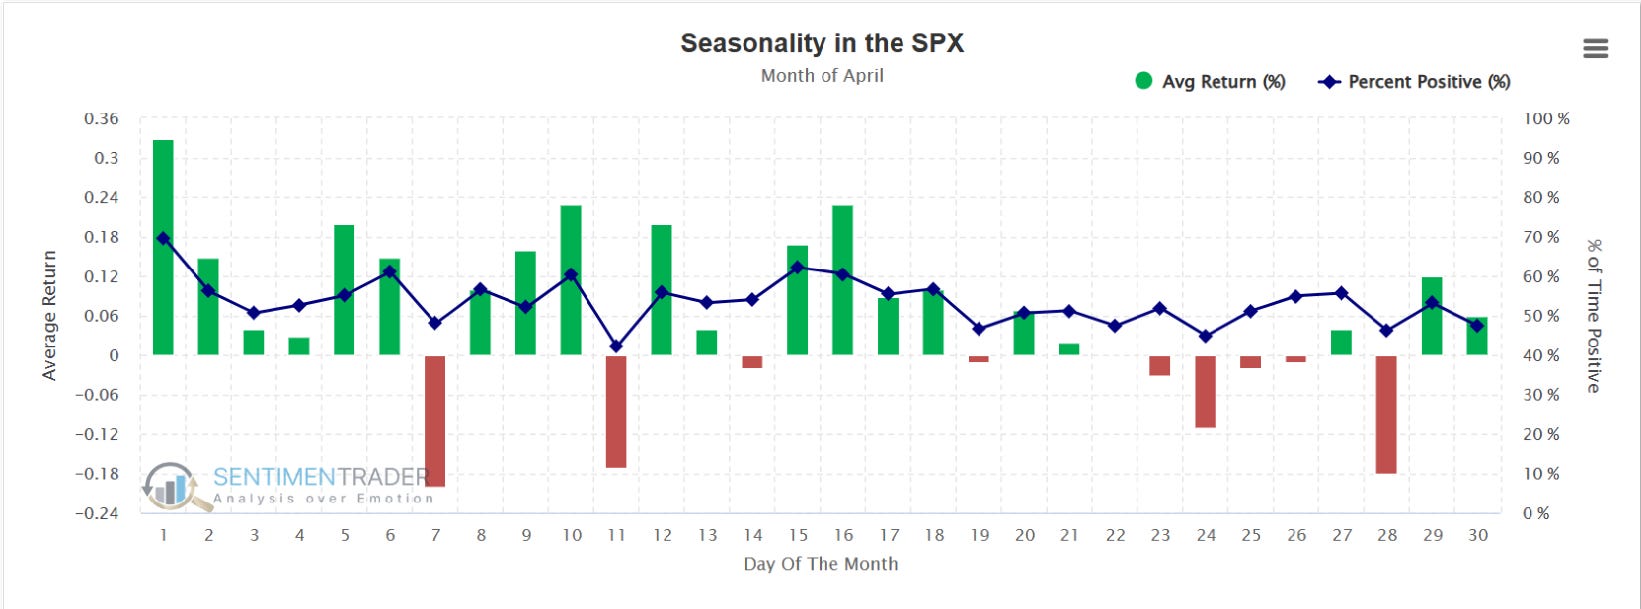
Seasonality
SP500. Here is the daily price action for April. Historically, April is a pretty decent month, especially in the first 20 days.
So far this year seasonality did not play along with historical tendencies.
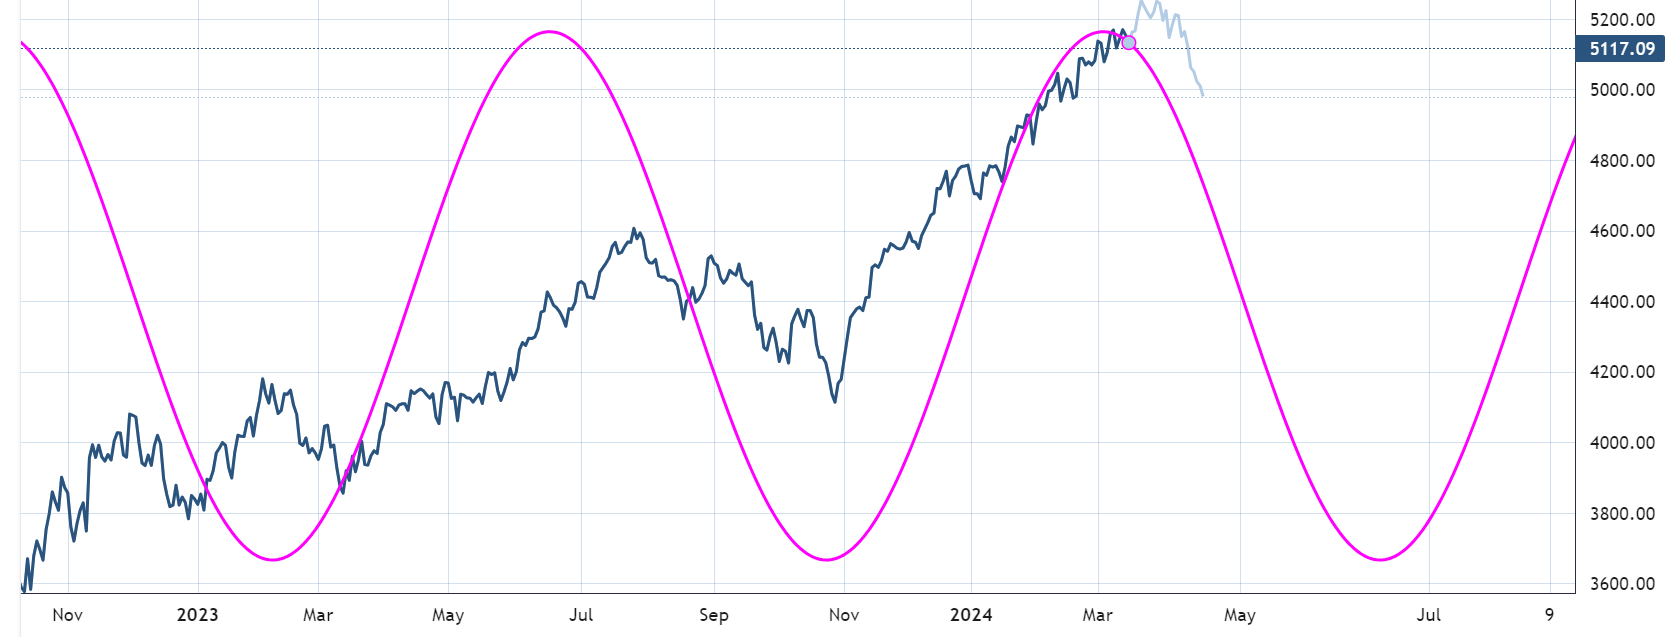
SP500 CYCLE
I presented this 179-day cycle in my work around mid-March. It has started to play out, and it is suggested that it could be extended until early June.
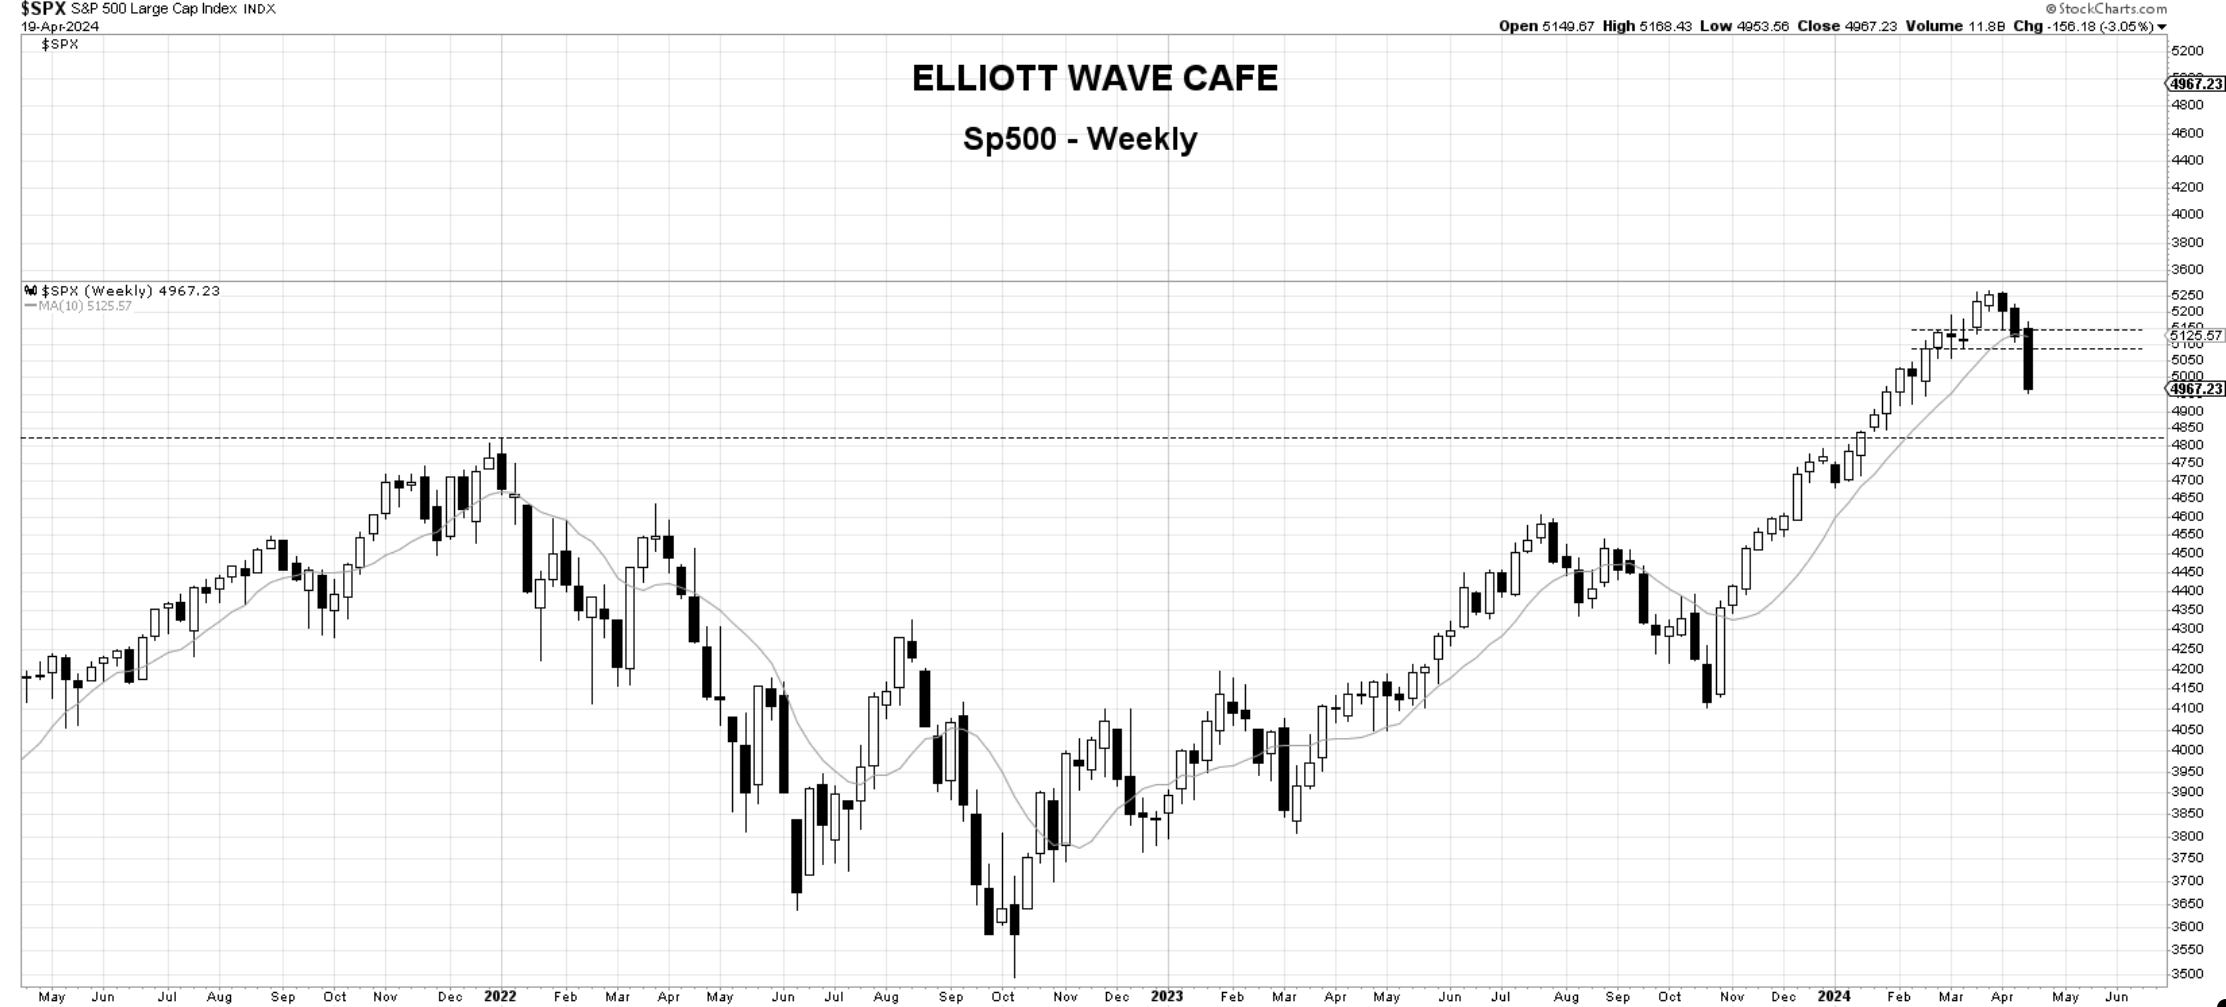
Price
SP500. The market did not give many chances for traders to debate the 10-week MA. It slashed through it in heavy volume as Wall Street sells on uptrend violation. Last week I warned about reducing exposure until signs appear that it is becoming safer to dip toes in the water. The message remains the same, and it is something I discuss daily in updates and videos - the correction needs to play out, and there is no point in trying to pick the low in it. The next obvious target is the highs from 2022 at 4818. As the market stabilizes, we will need to see accumulation come back in and read the price action on a daily basis with volume and percentage gains. It will inform us how to proceed.
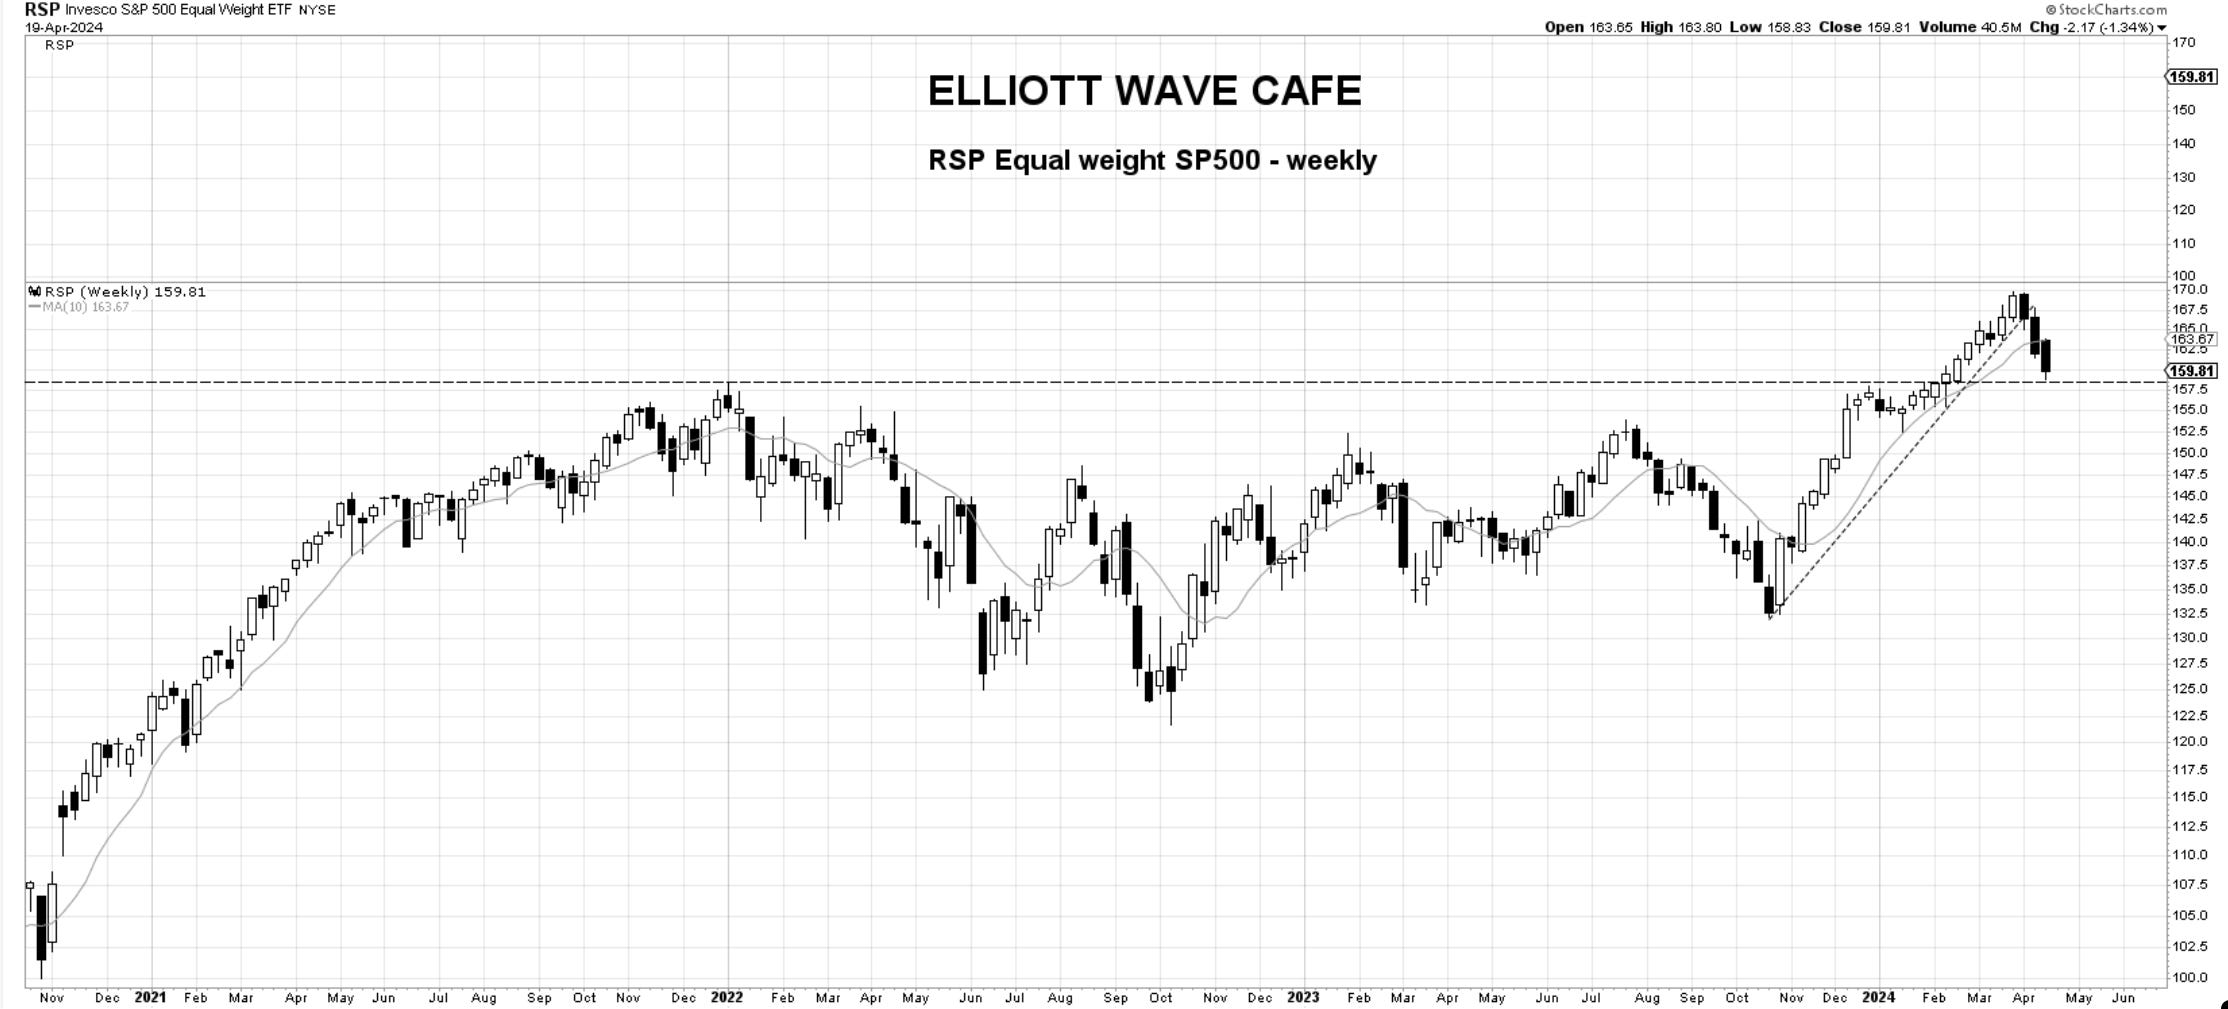
RSP—equal weight SP500.
The highs from January 2022 were 158.45. The low of this week was 158.83. As you can see below, we will start entering a large demand zone until the 150 zone. How we react from current levels will be interesting to watch over the next couple of weeks to see if demand comes in. Getting back above the 10-day MA would be a positive sign.
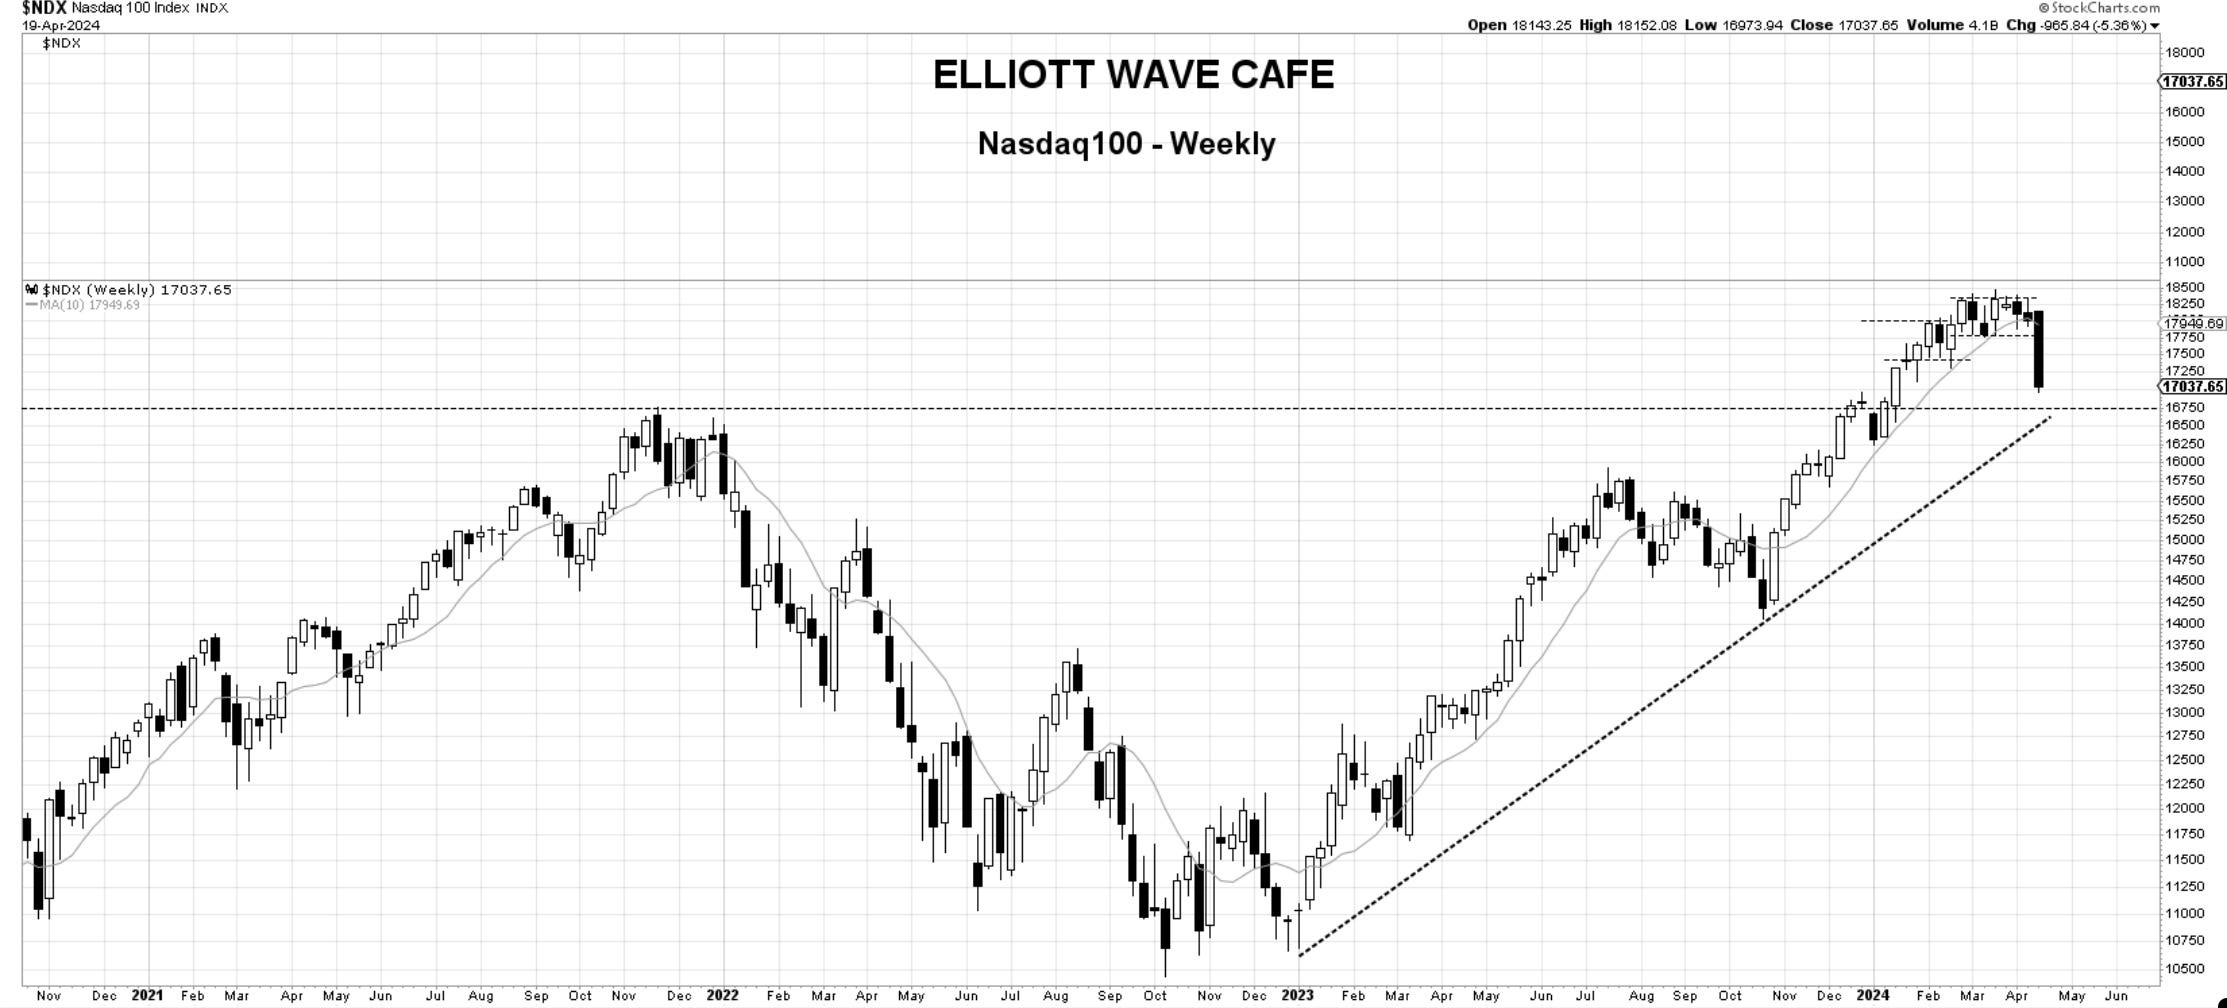
Nasdaq100.
I warned last week on the loss of 17,800 as the cutoff for keeping risk positions elevated. Once that level was lost, cutting long exposure was required. The highs in November 2021 were 16,764.85. This week's low is 16,973.94. We have roughly 200 points to go before we touch those old levels. We also broke out from there in January of this year, so there will be good memory and likely some demand along with short profit taking. Notice the trendline hitting about the same place. I will not make long calls until we see the reaction. I will be monitoring this within the daily updates and give the green signal once warranted.
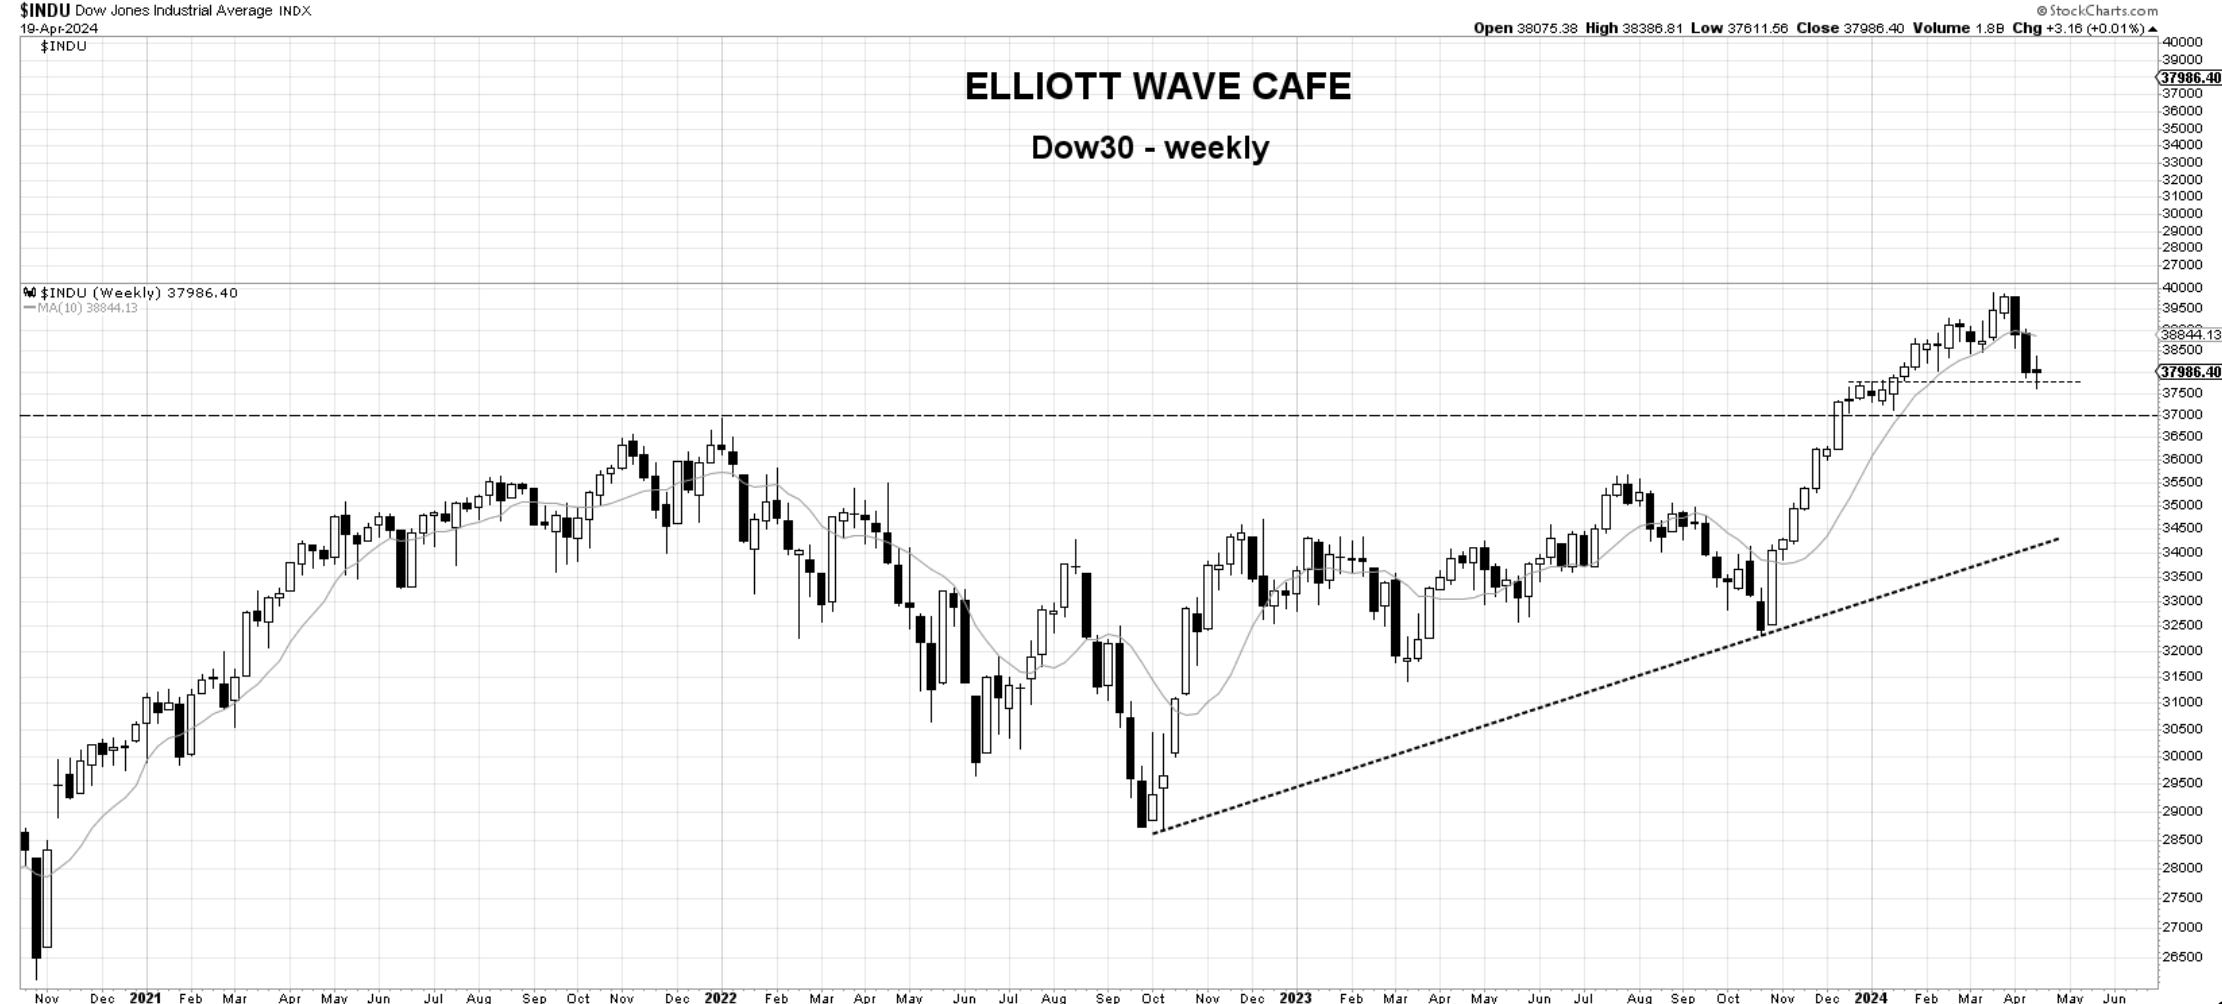
Dow Jones 30—The 37,800 level proves important for the Dow. We bottomed there last week and spent this week grinding around it. Although the largest damage was in the tech sector, the Dow survived better due to its elevated exposure to financials and healthcare, two sectors that maintained some relative strength.
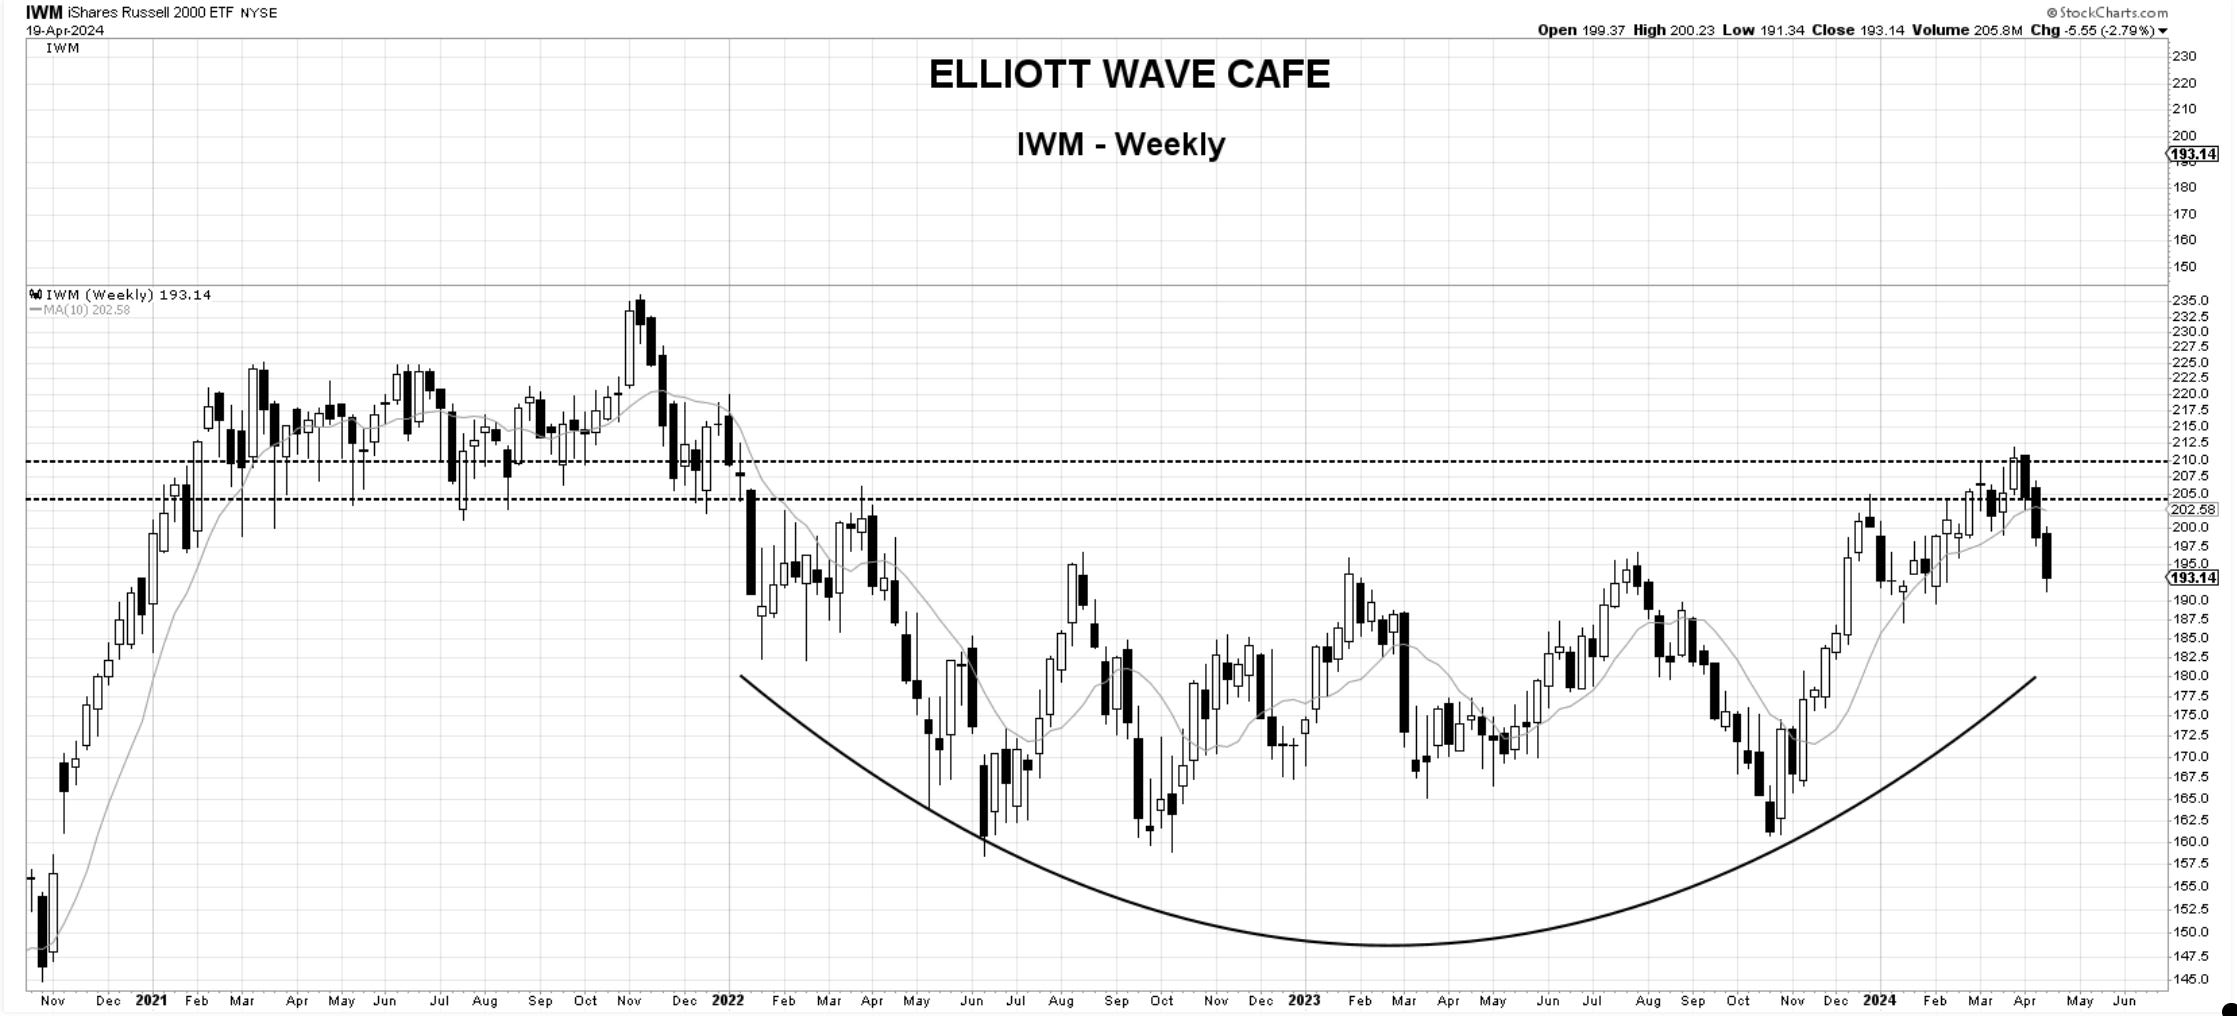
IWM—small caps. Small caps lost -2.79%, much better than the Nasdaq composite, which lost -5.52%. We’re in an area that provided resistance between August 2022 and July 2023, so I expect support to manifest itself fairly soon. It will take some time to work through this technical damage (possibly a flat), but if we do and get above 205 once again, things can get back on track. For now, it's best to observe and get a shop list ready to watch how stocks behave.
Bitcoin— has spent the last six weeks building a base near the all-time highs. There is no break in trend, with prices remaining above uptrending averages. We briefly dipped below 60k, only to retreat and leave a tail hanging on charts. Bitcoin has not really followed the selling pressure we’ve seen in equities. This relative strength is encouraging, and if we crack above 70k, chances are the larger higher trend resumes. A weekly close below 60k would certainly suggest a reduction in long exposure.
US Dollar - The dollar was stable this week just below that large 107 resistance. We seem to have broken the declining trendline, so one has to tread carefully with too much long-risk exposure. A USD reversal below 104, would signal upside failure and likely help reignite the risk-trade.
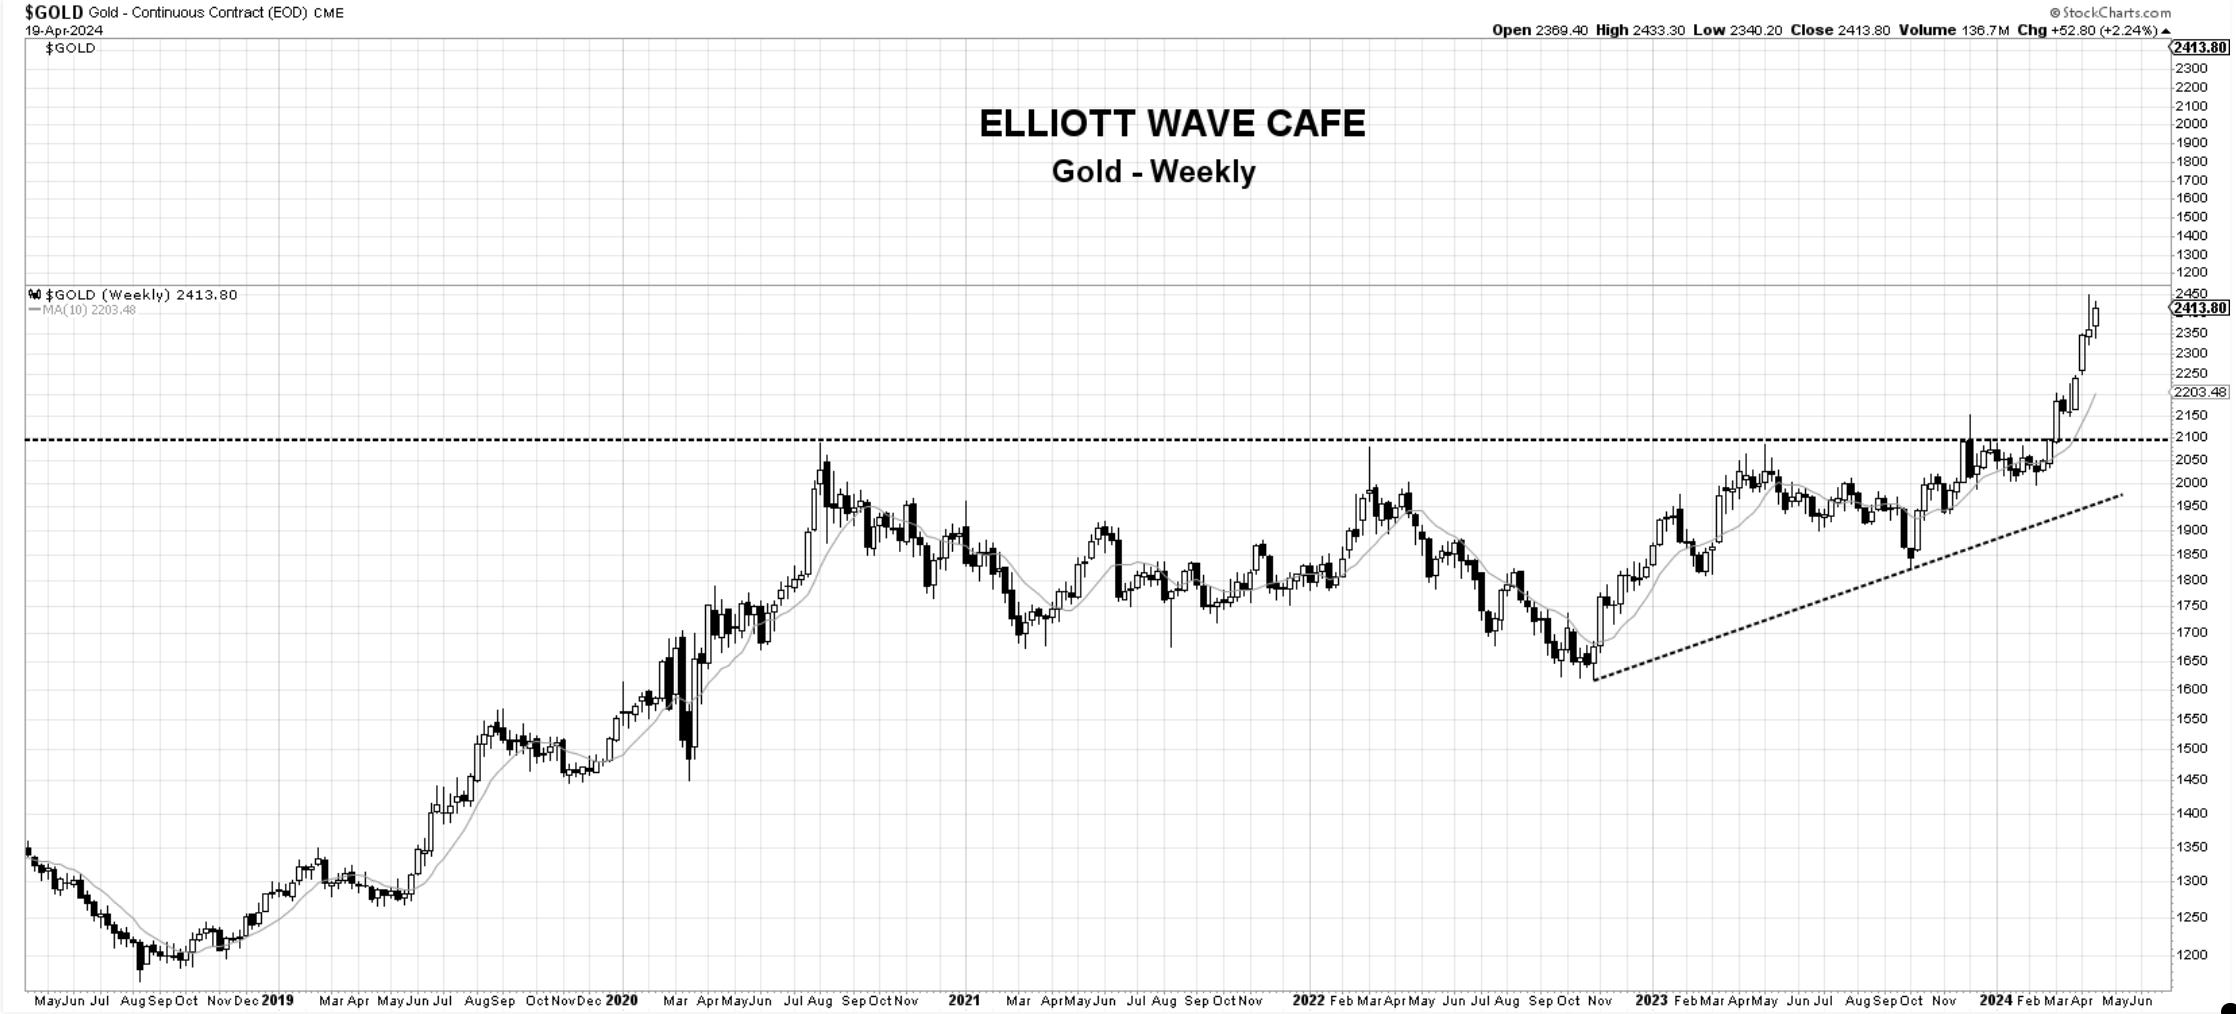
Gold— Gold remains with impressive gains since the breakout above 2100. From a trend perspective, there is no interruption, so keeping to the long side makes sense. For those enjoying paper gains, having a clear plan about what levels require position reduction is very important. It could be the previous week's lows, the break of a trendline, or losing a moving average, whatever it is, make sure you remain disciplined and take profits if the market signals a change in character.
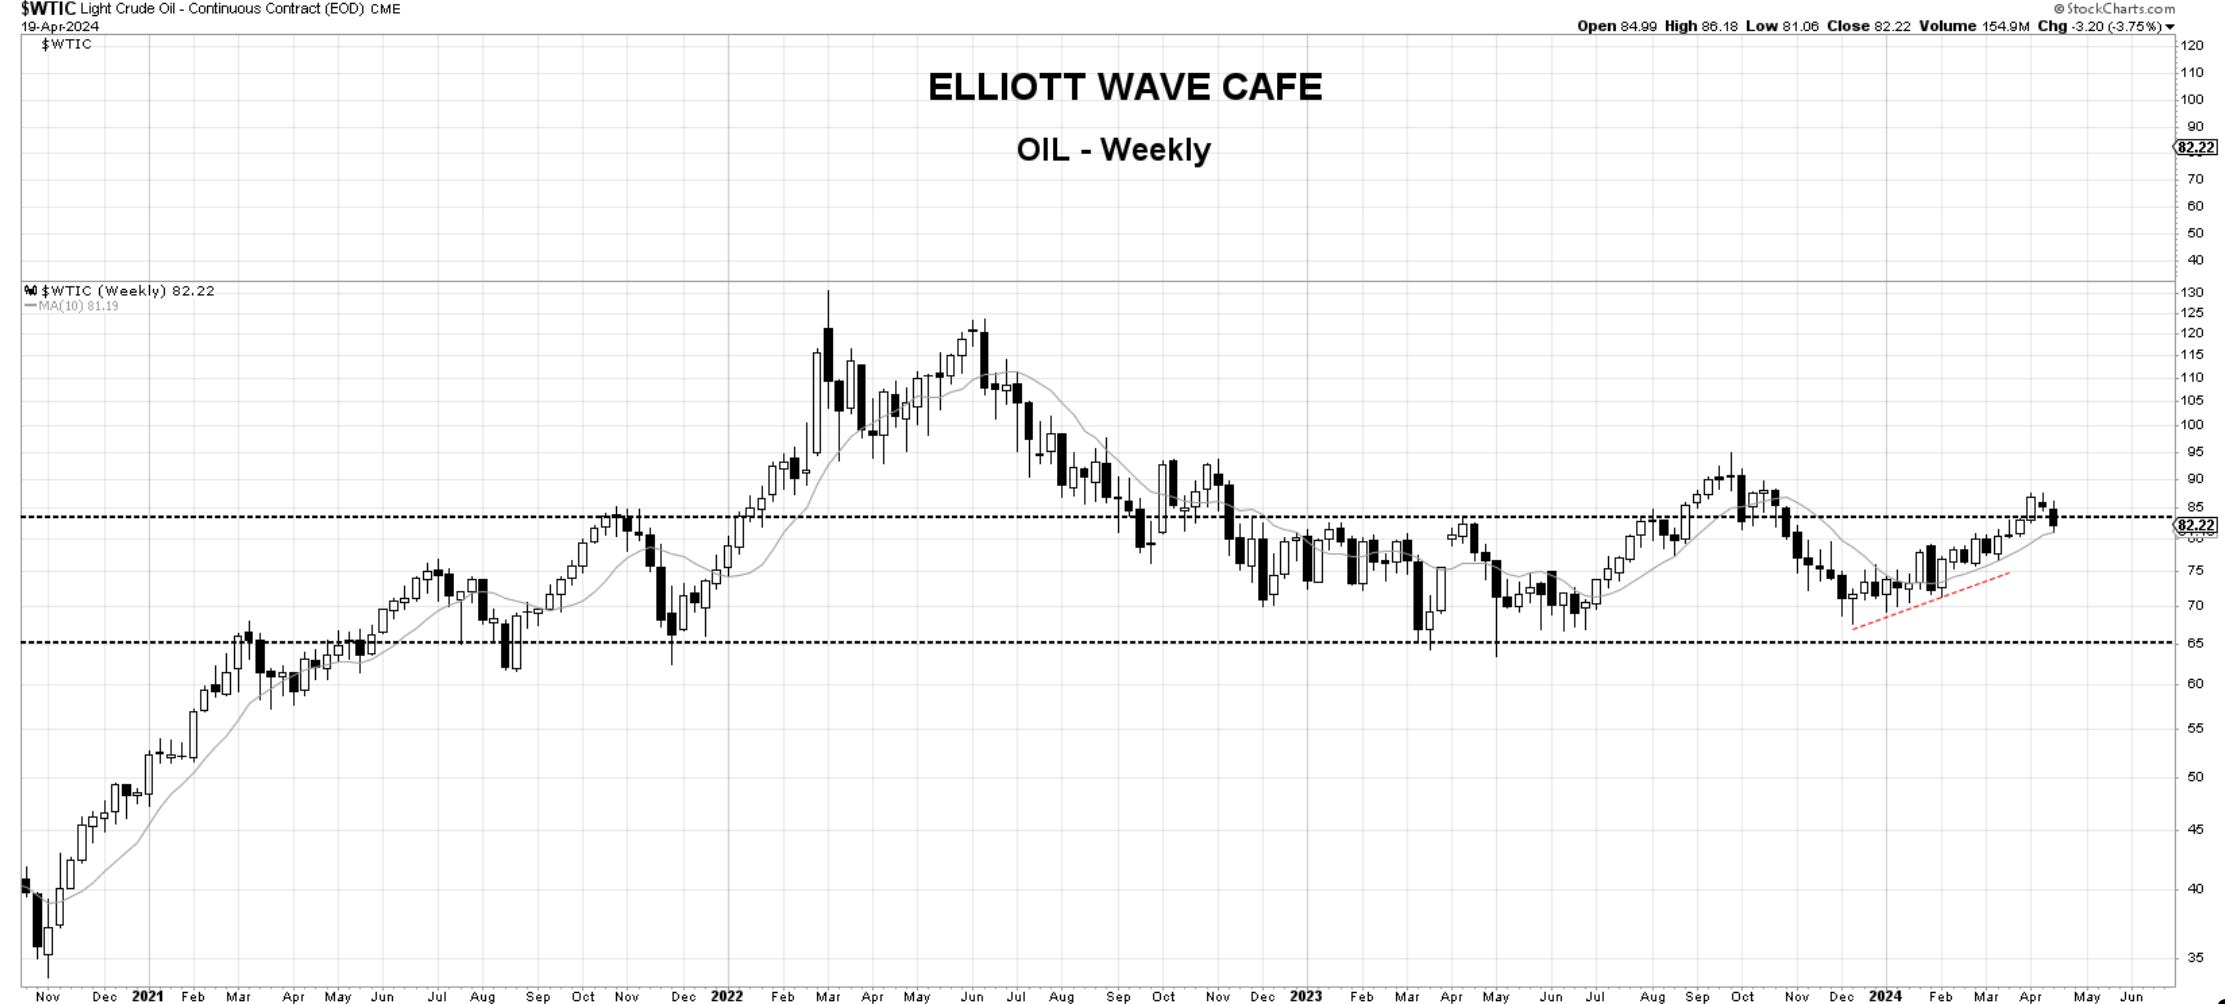
Oil—Oil failed to continue rallying above the 85 mark. We are right at the 10-week MA, which can possibly hold. If it doesn’t, we have a high chance of a return into the trading range between 70 and 80. If I had bought the break above 84 resistance, this would be the time I would reduce those positions.
Thank you all for reading; I will see you next week. Leave a comment or suggestion below. Join our chat to discuss markets with fellow traders.
In the meantime, please consider subscribing and supporting EWCafe and read “The Daily Drip,” where I provide daily market updates, videos, and commentary on core markets.
Cris,
EWCafe
email: ewcafe@pm.me