
Weekly market review
A technical look at weekly trends in core markets.

This weekly report is free. For those who want our daily written and video reports, check out our brand-new low-cost payment plans.
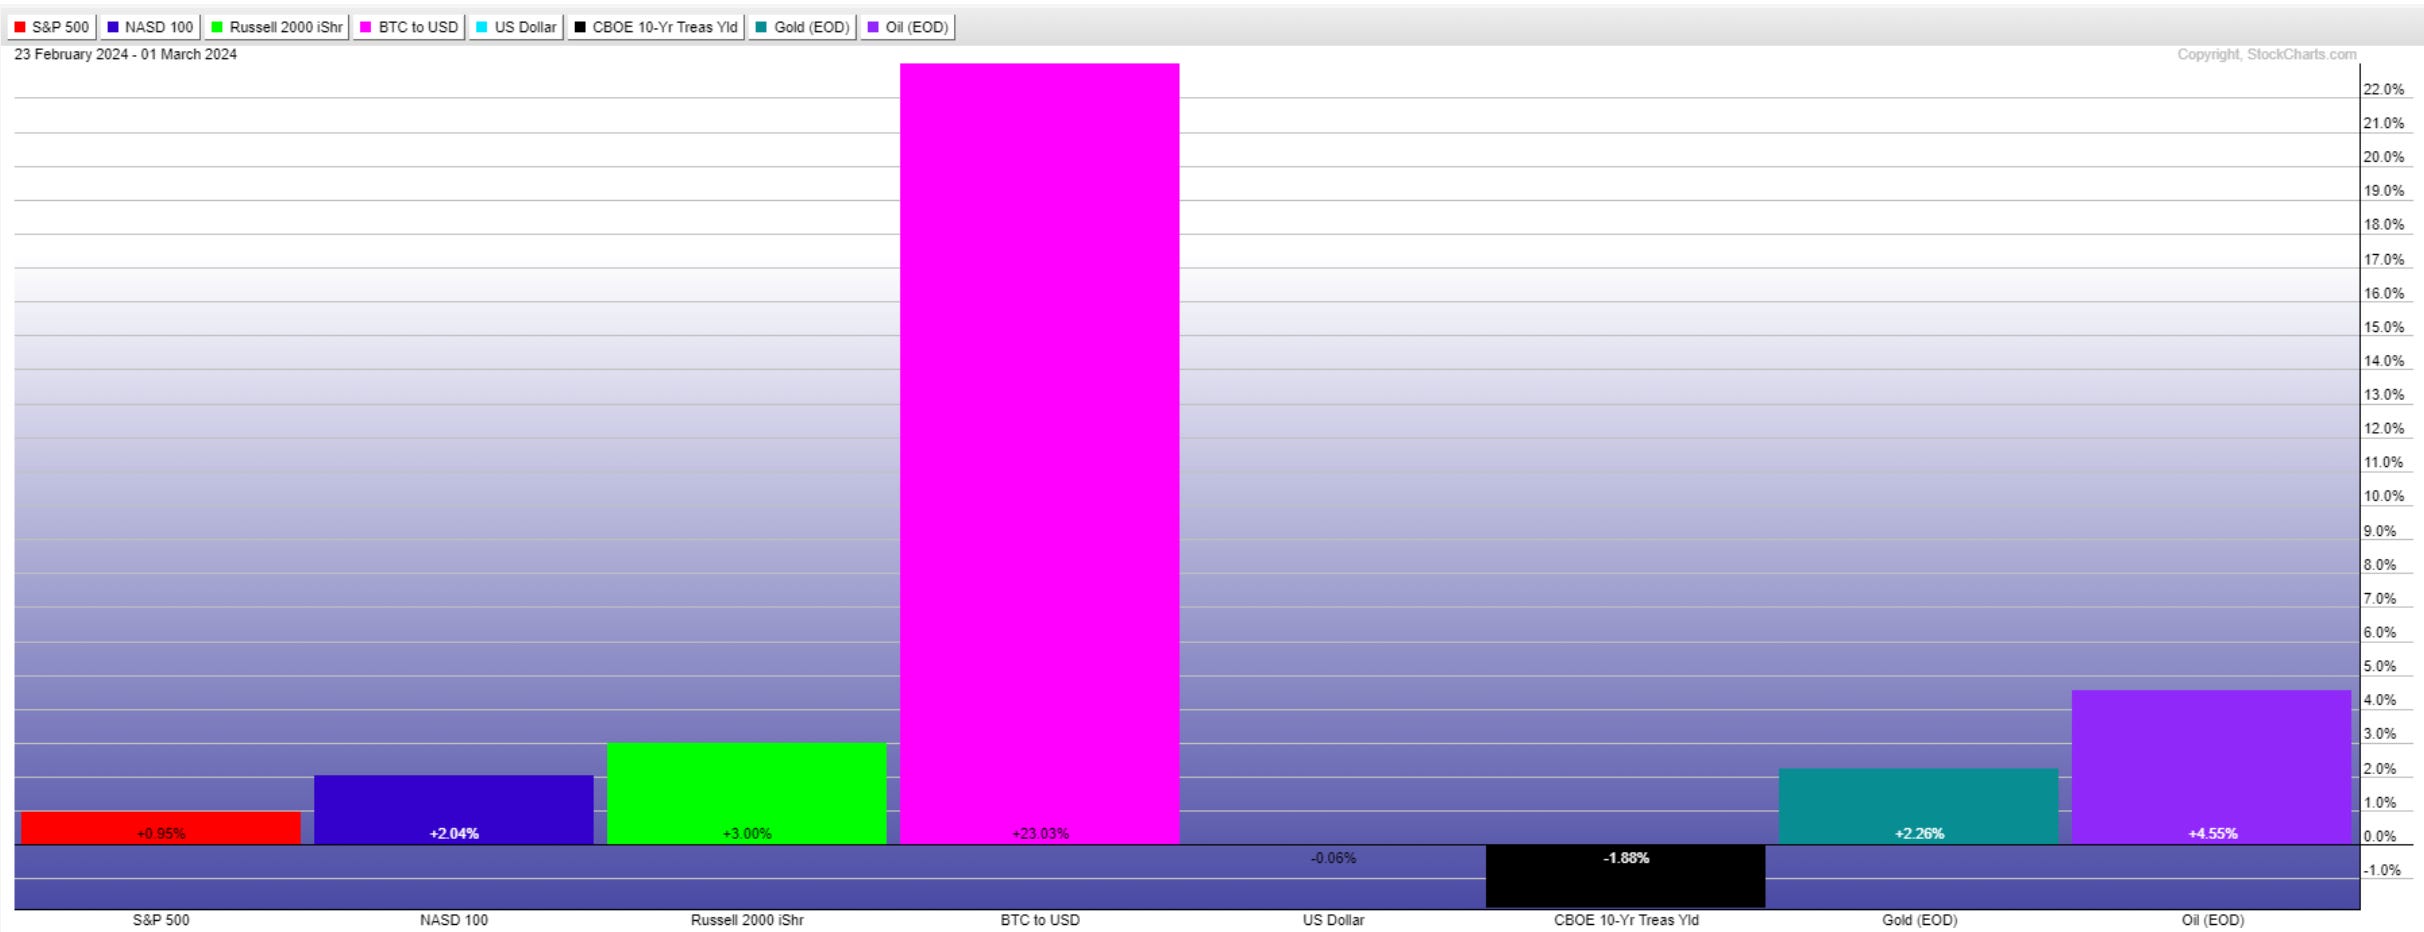
Market performance for the past week is below.
The outstanding performer this week is BTC at a whopping +23%. Oil broke out of a five-week consolidation and small caps have finally decided to accelerate higher. I have started recommending this area in the daily updates. Gold had a deecnt move Friday and it’s on radar for buy setups.
Sentiment
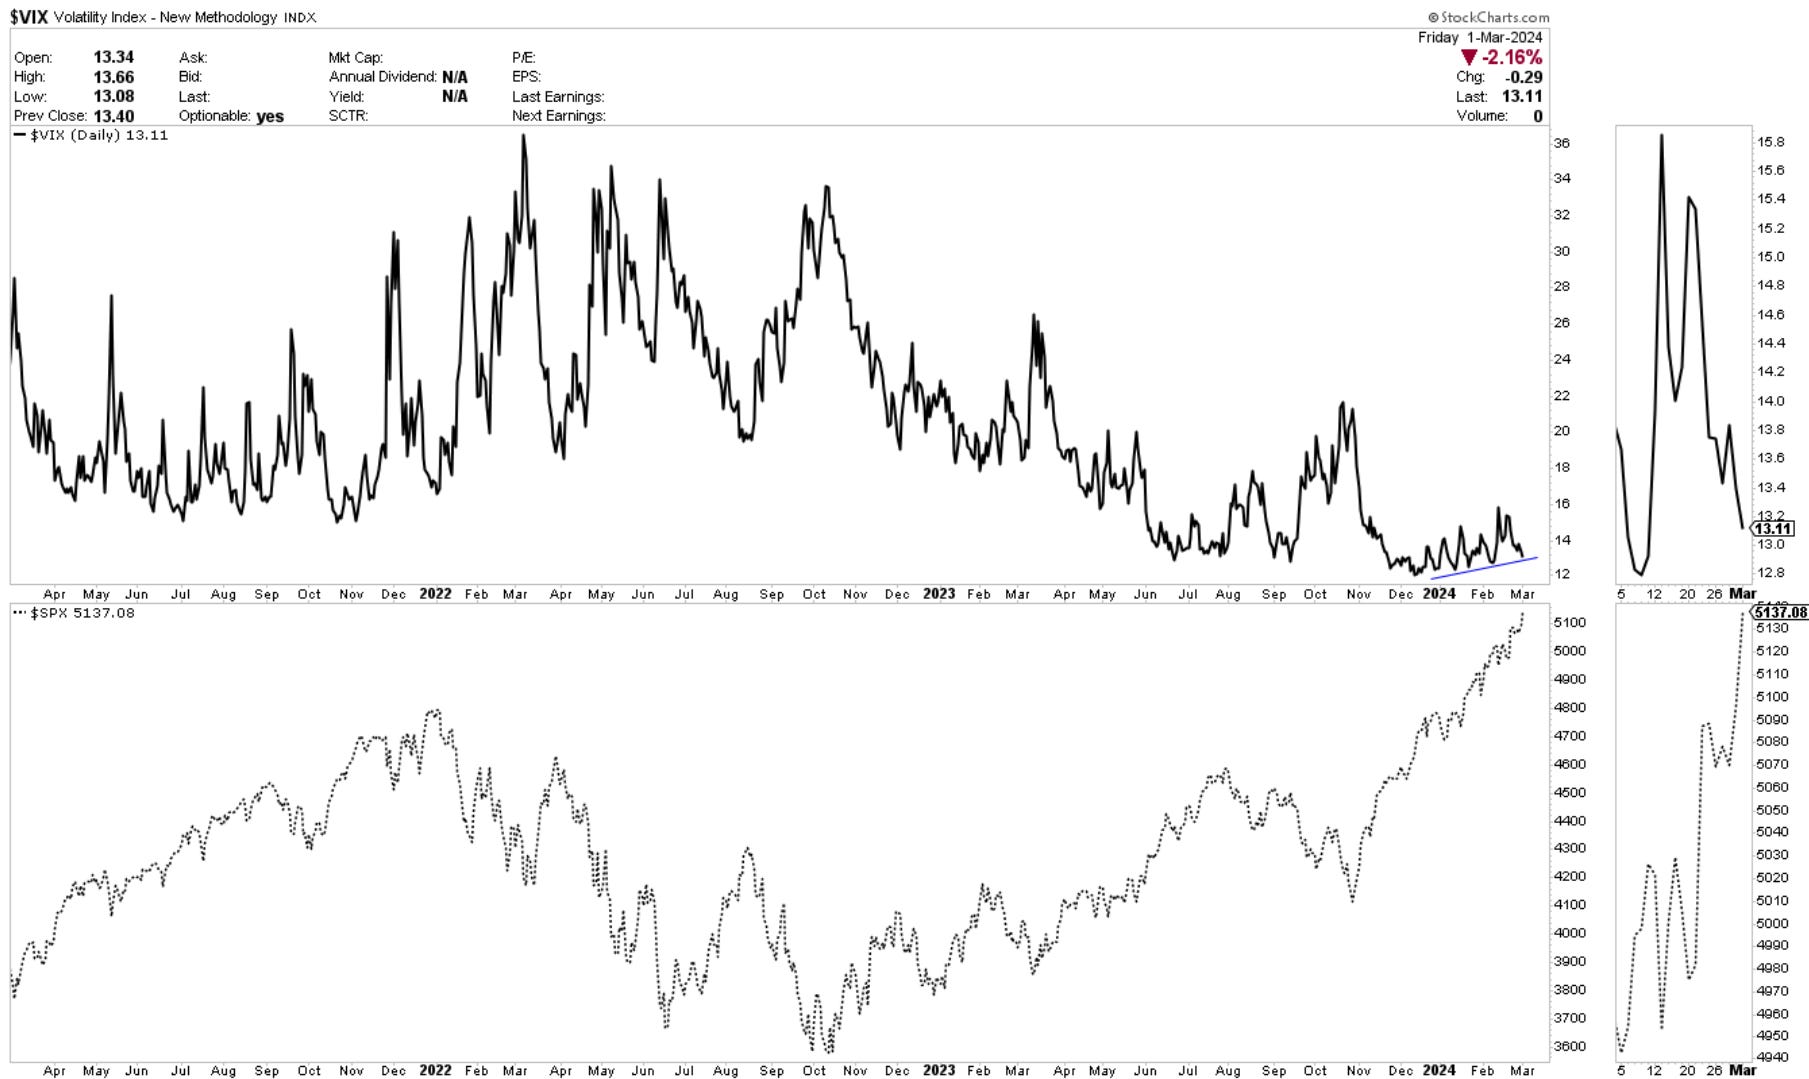
More selling of premium took place this week as the market is accelerating higher. We’re touching a small higher lows trendline, but overall the lack of fear continues. The major risk event of the month will be the CPI, will watch vix as we’re approaching that deadline.
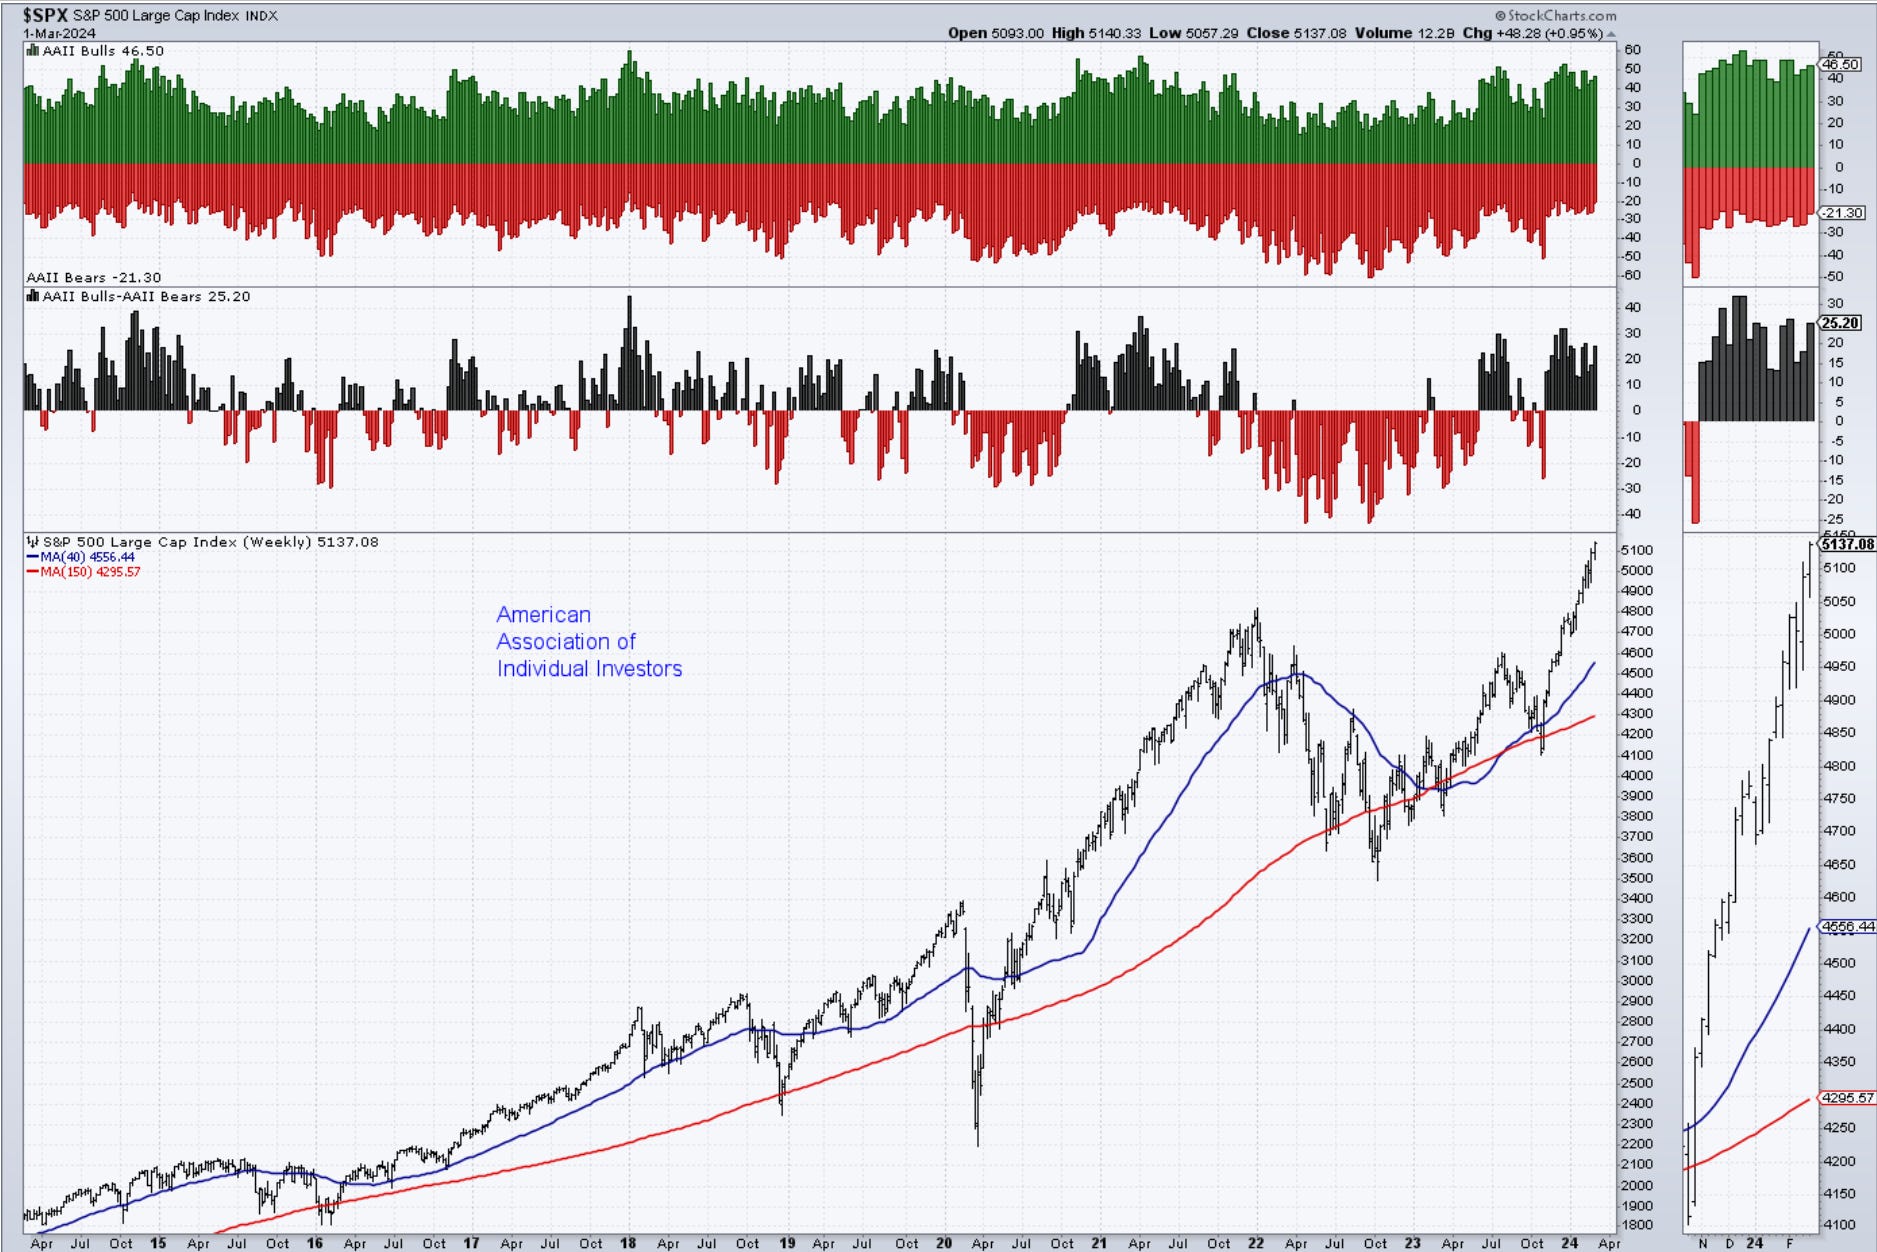
Bulls vs Bears spread has grown once again in favor of the former. It is consistent with depicting a bullish picture and has yet to decline or diverge in a significant manner. You could say there are frothier levels above to be reached before it becomes somewhat of a concern.
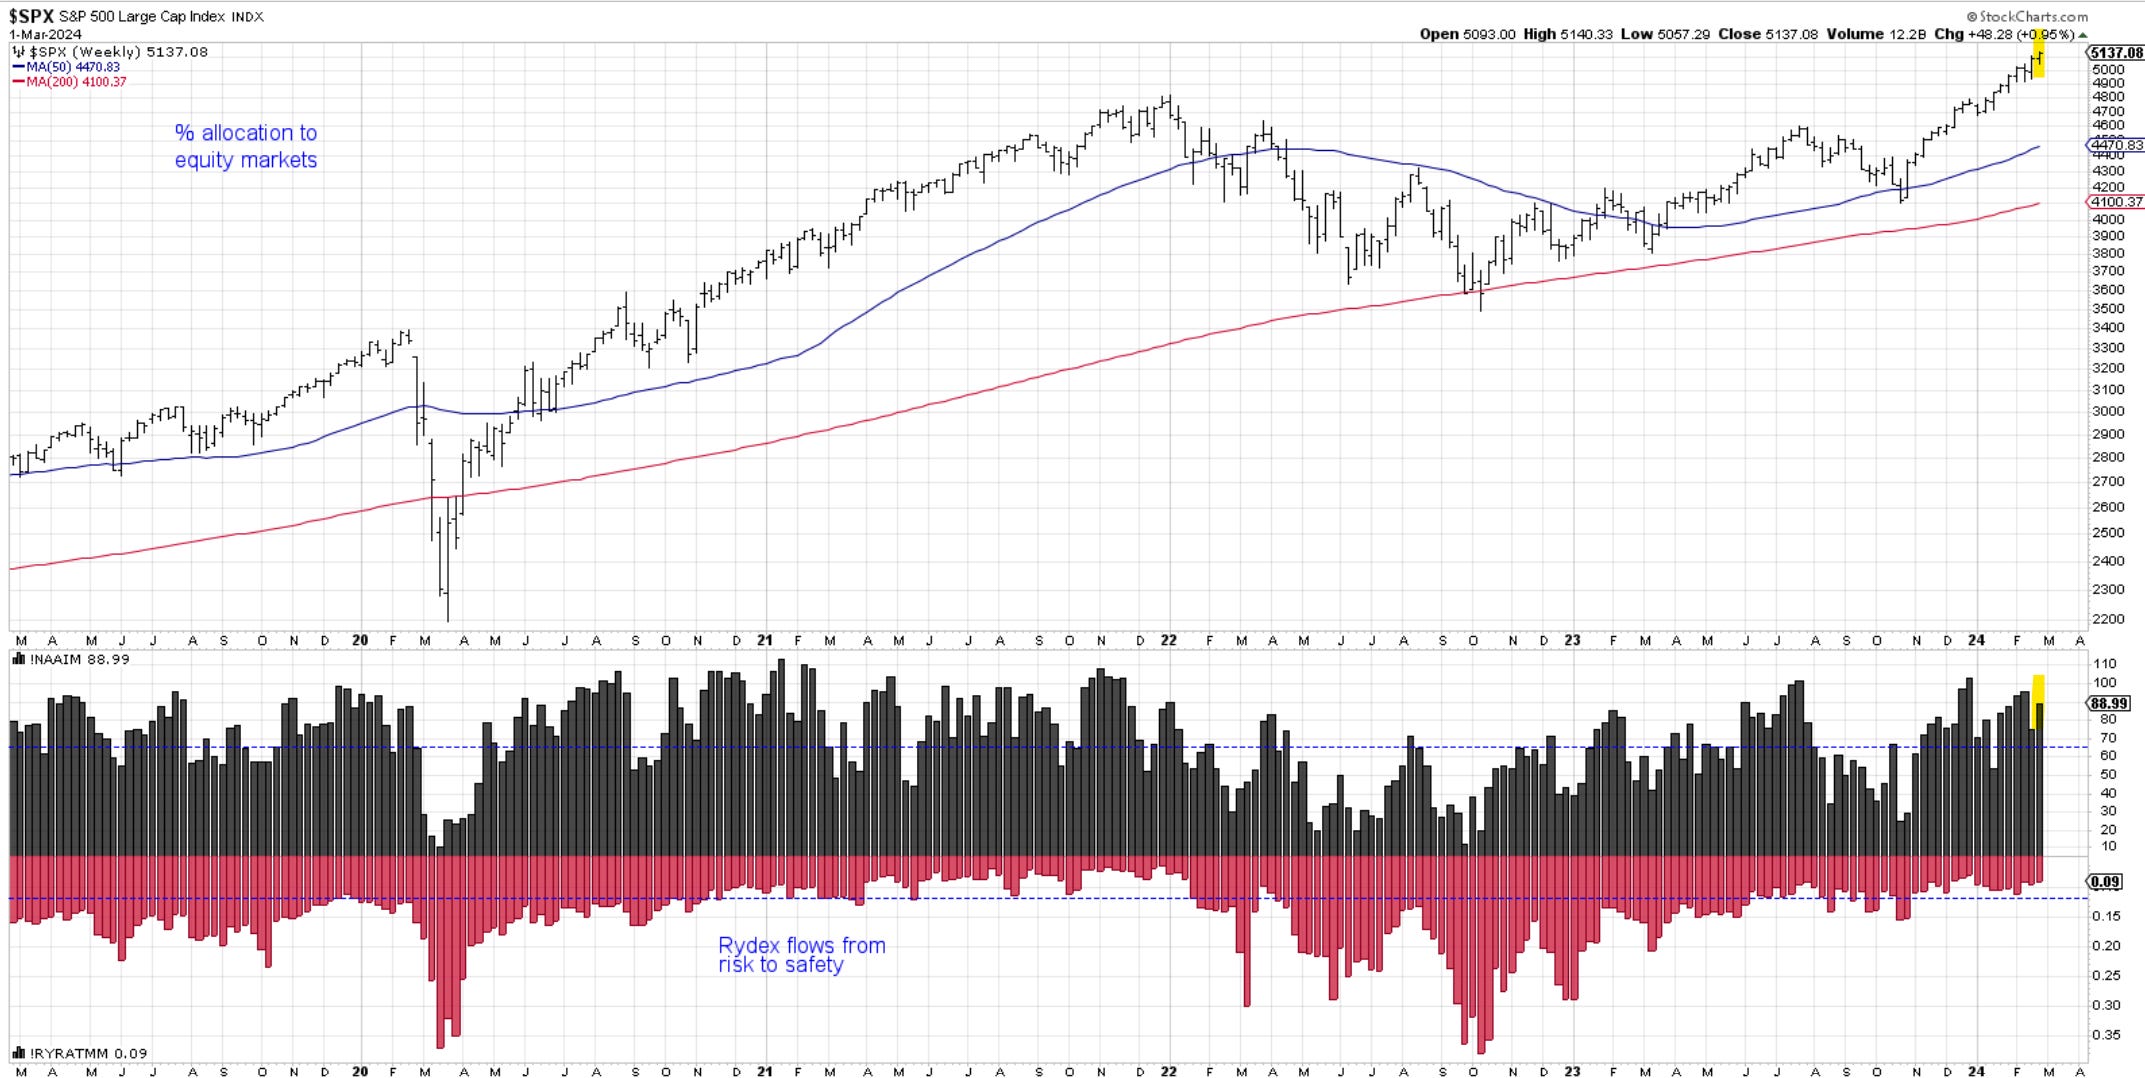
As mentioned last week, here come the investment managers chasing the market higher after the reduction last week. My read here is that they will continue to bid into mid-March.
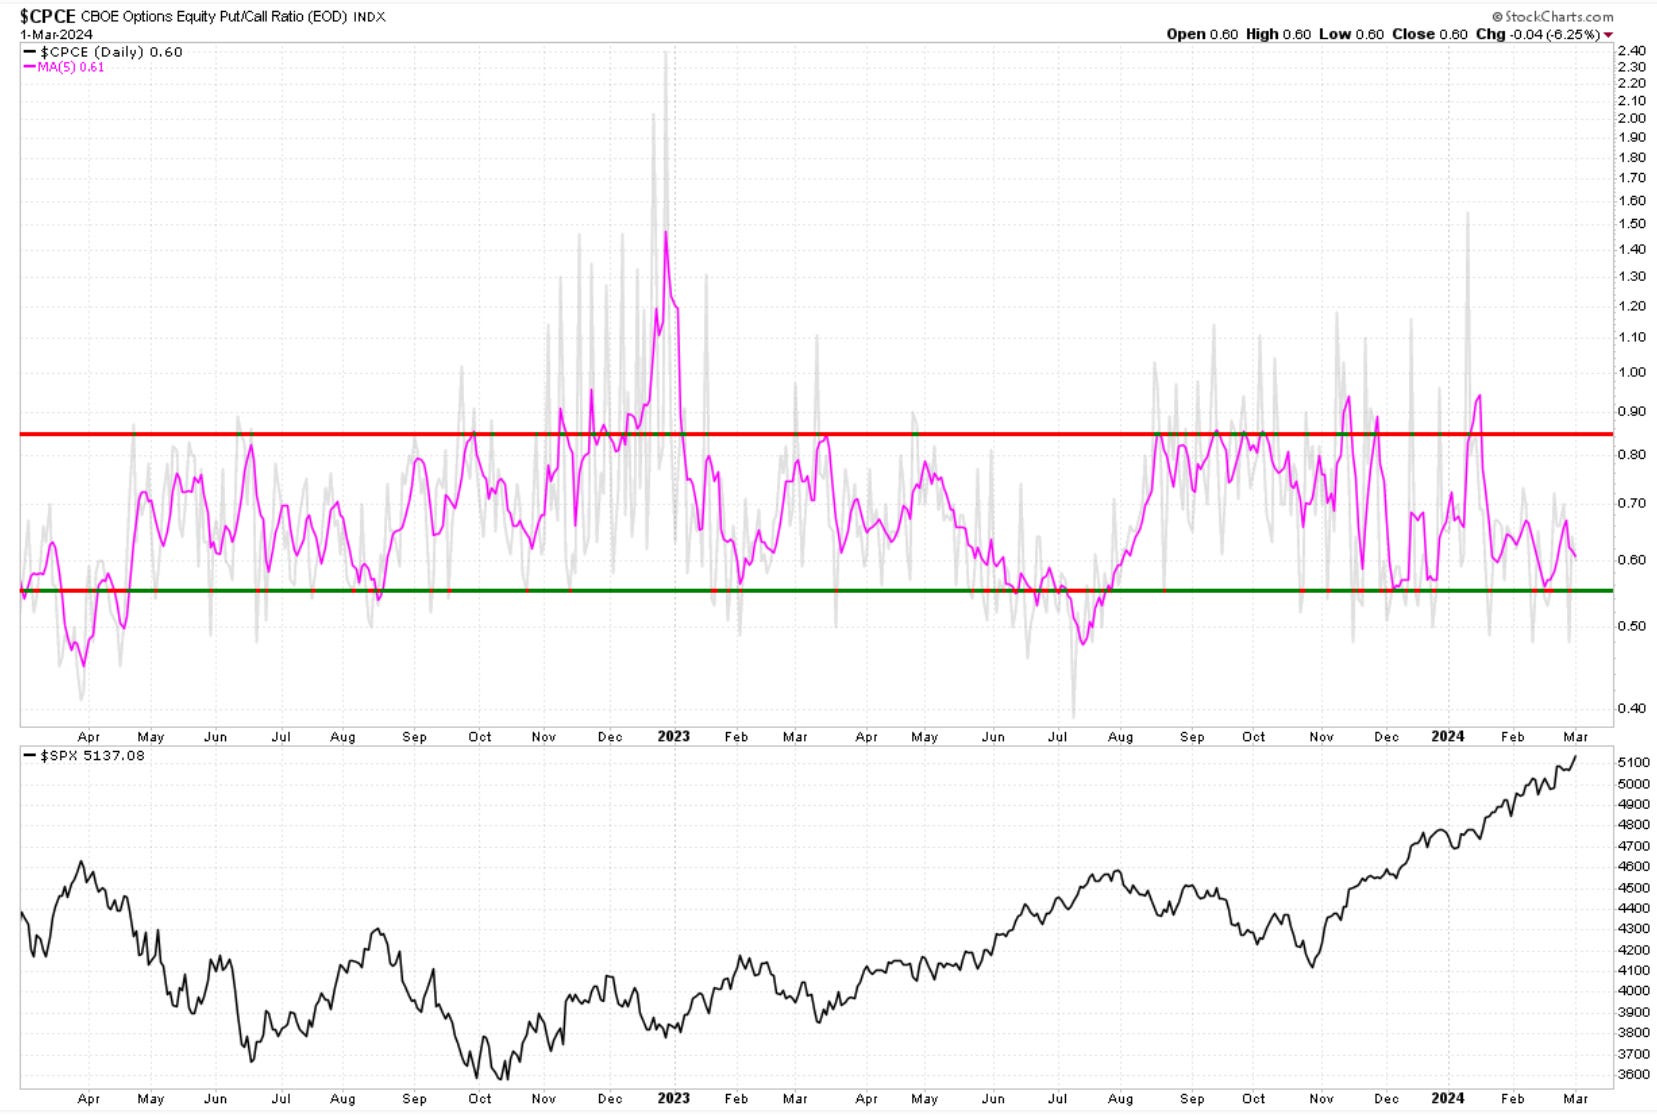
Options traders remain constant here with low and acceptable put buying. There is no significant read to form a contrarian approach. If we see this metric drop below 0.50 on a 5day average we can assume a top is getting closer. For now it’s balanced.
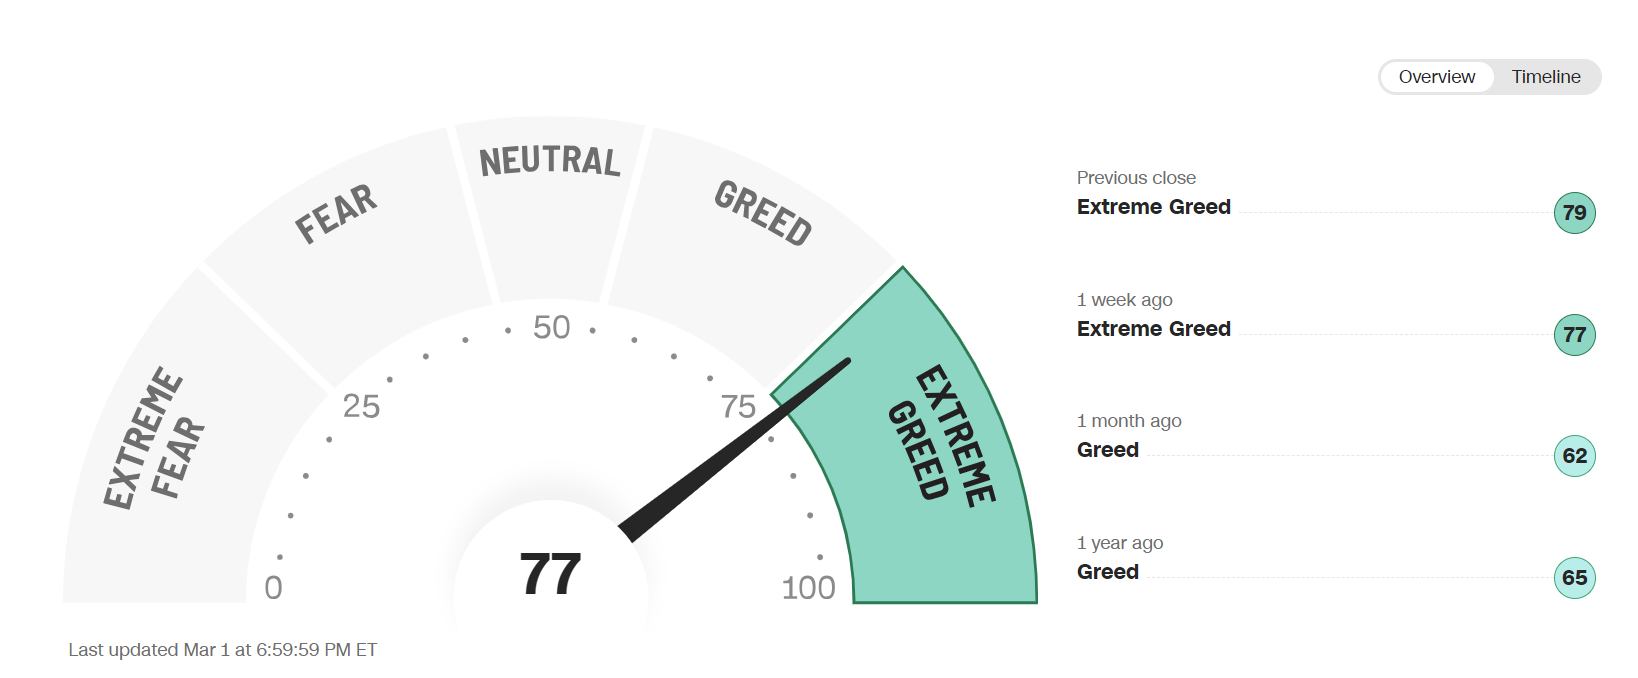
The sentiment section would not be complete without the CNN gauge of Fear vs Greed. Nothing to see here, traders are somewhat excited but not enough to warrant a red flag.
Cycles
Note: cycles refer to time projections only not price projections.
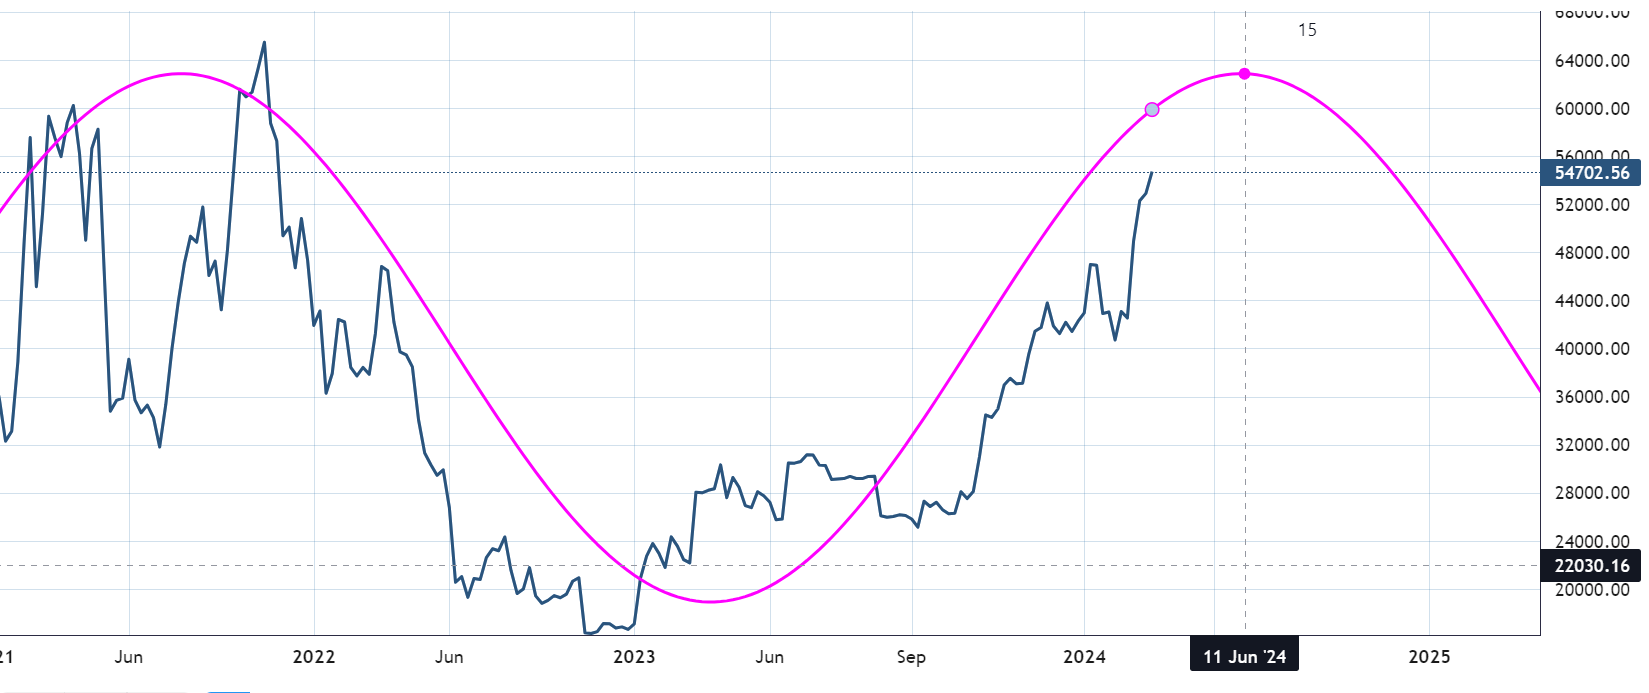
SP500 . The 180-day active weekly cycle continues to show we are still about 9 months away before a more significant peak is due. The daily cycles varies within this larger picture, I will discuss those next week in daily videos.
BTCUSD remains bullish with cycle topping projection about 3 months away.
Breadth
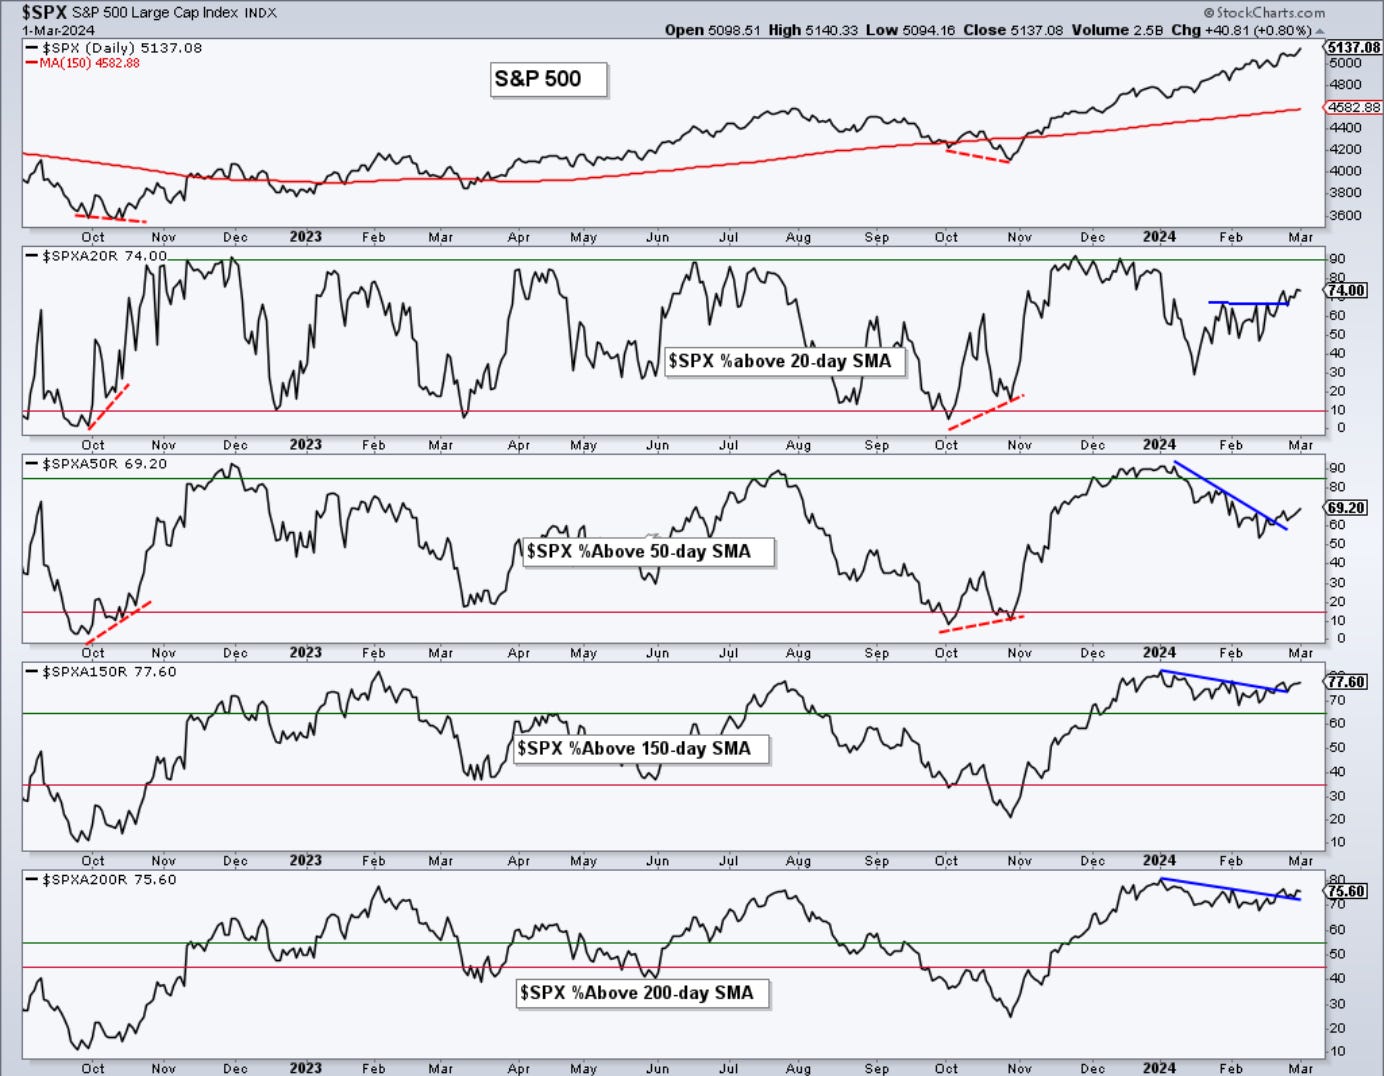
Here are percentages of stocks above key moving averages in the SP500.
This metric is not disturbed enough to signal a significant shift in market behavior. Stocks above their 20day remain near 75%, more have climbed above their 50day, and above 200day looks consistent with a bullish trend at 75%.
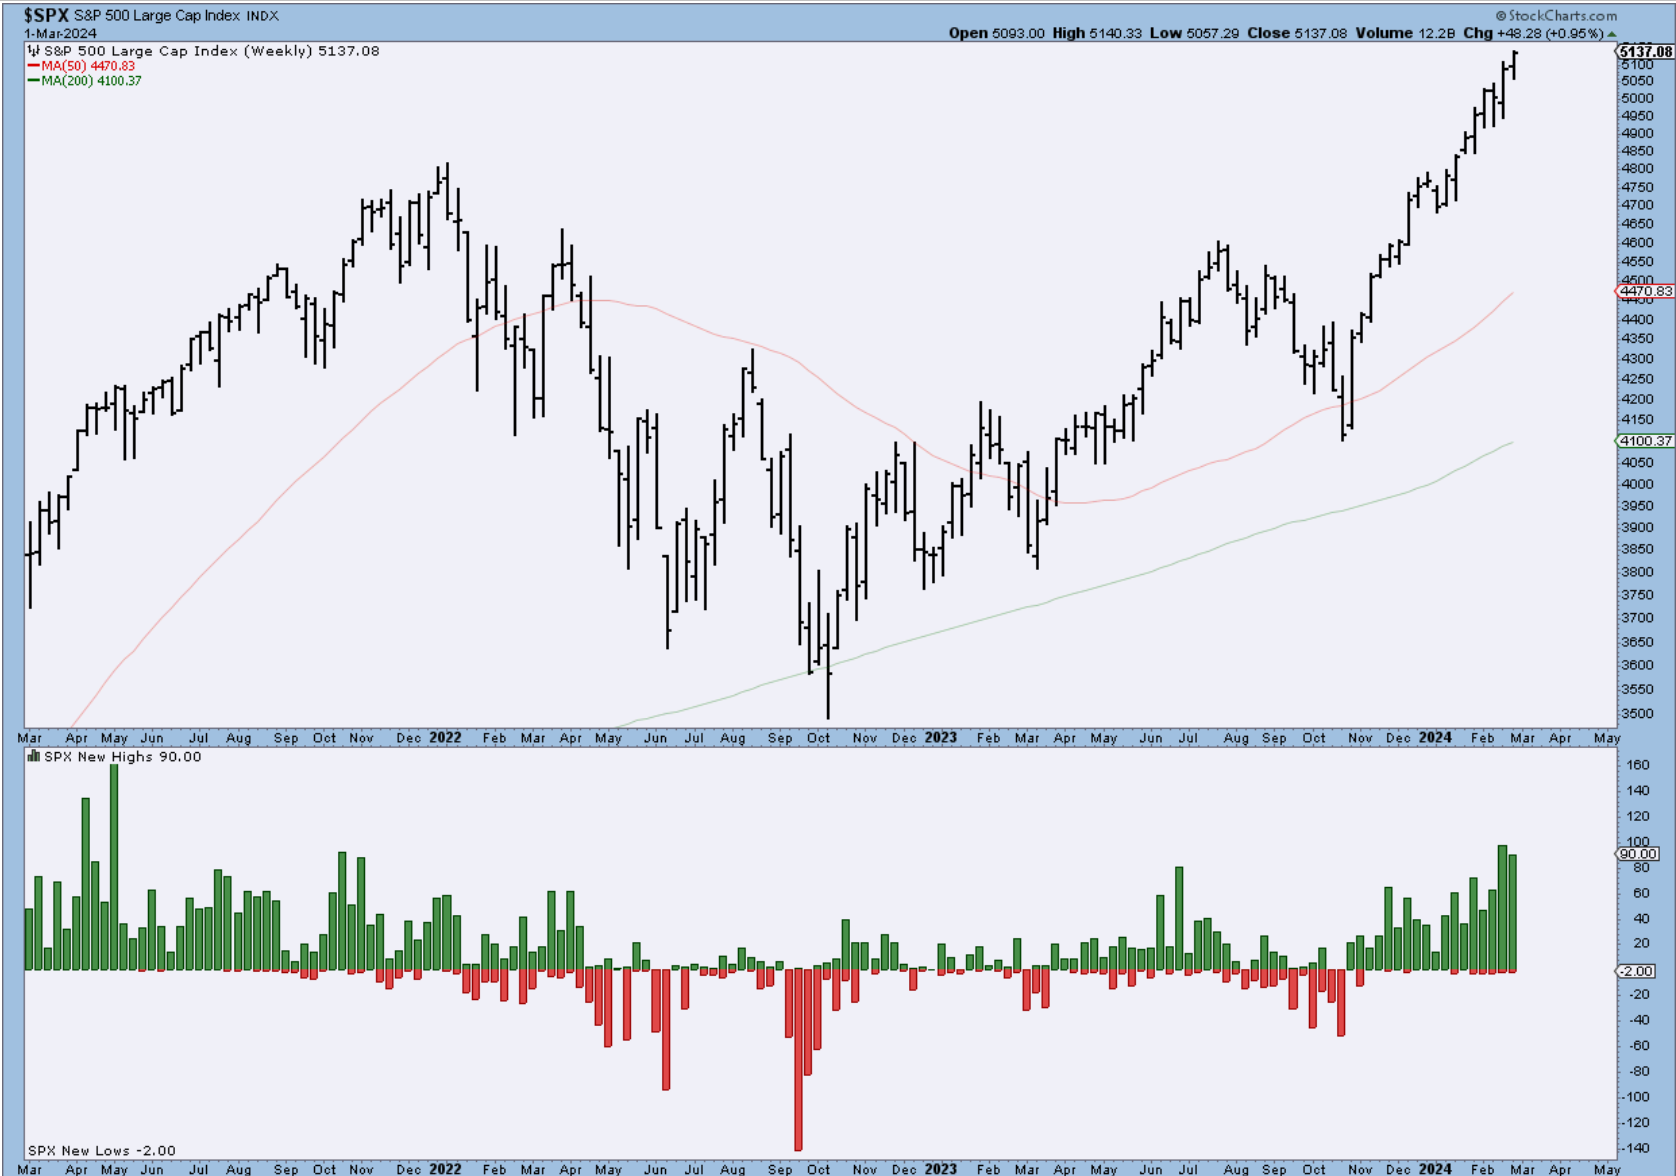
With 90 stocks making new 52-week highs after last week’s 98, it is hard to argue with the current strength in equities. New lows are nonexistent.
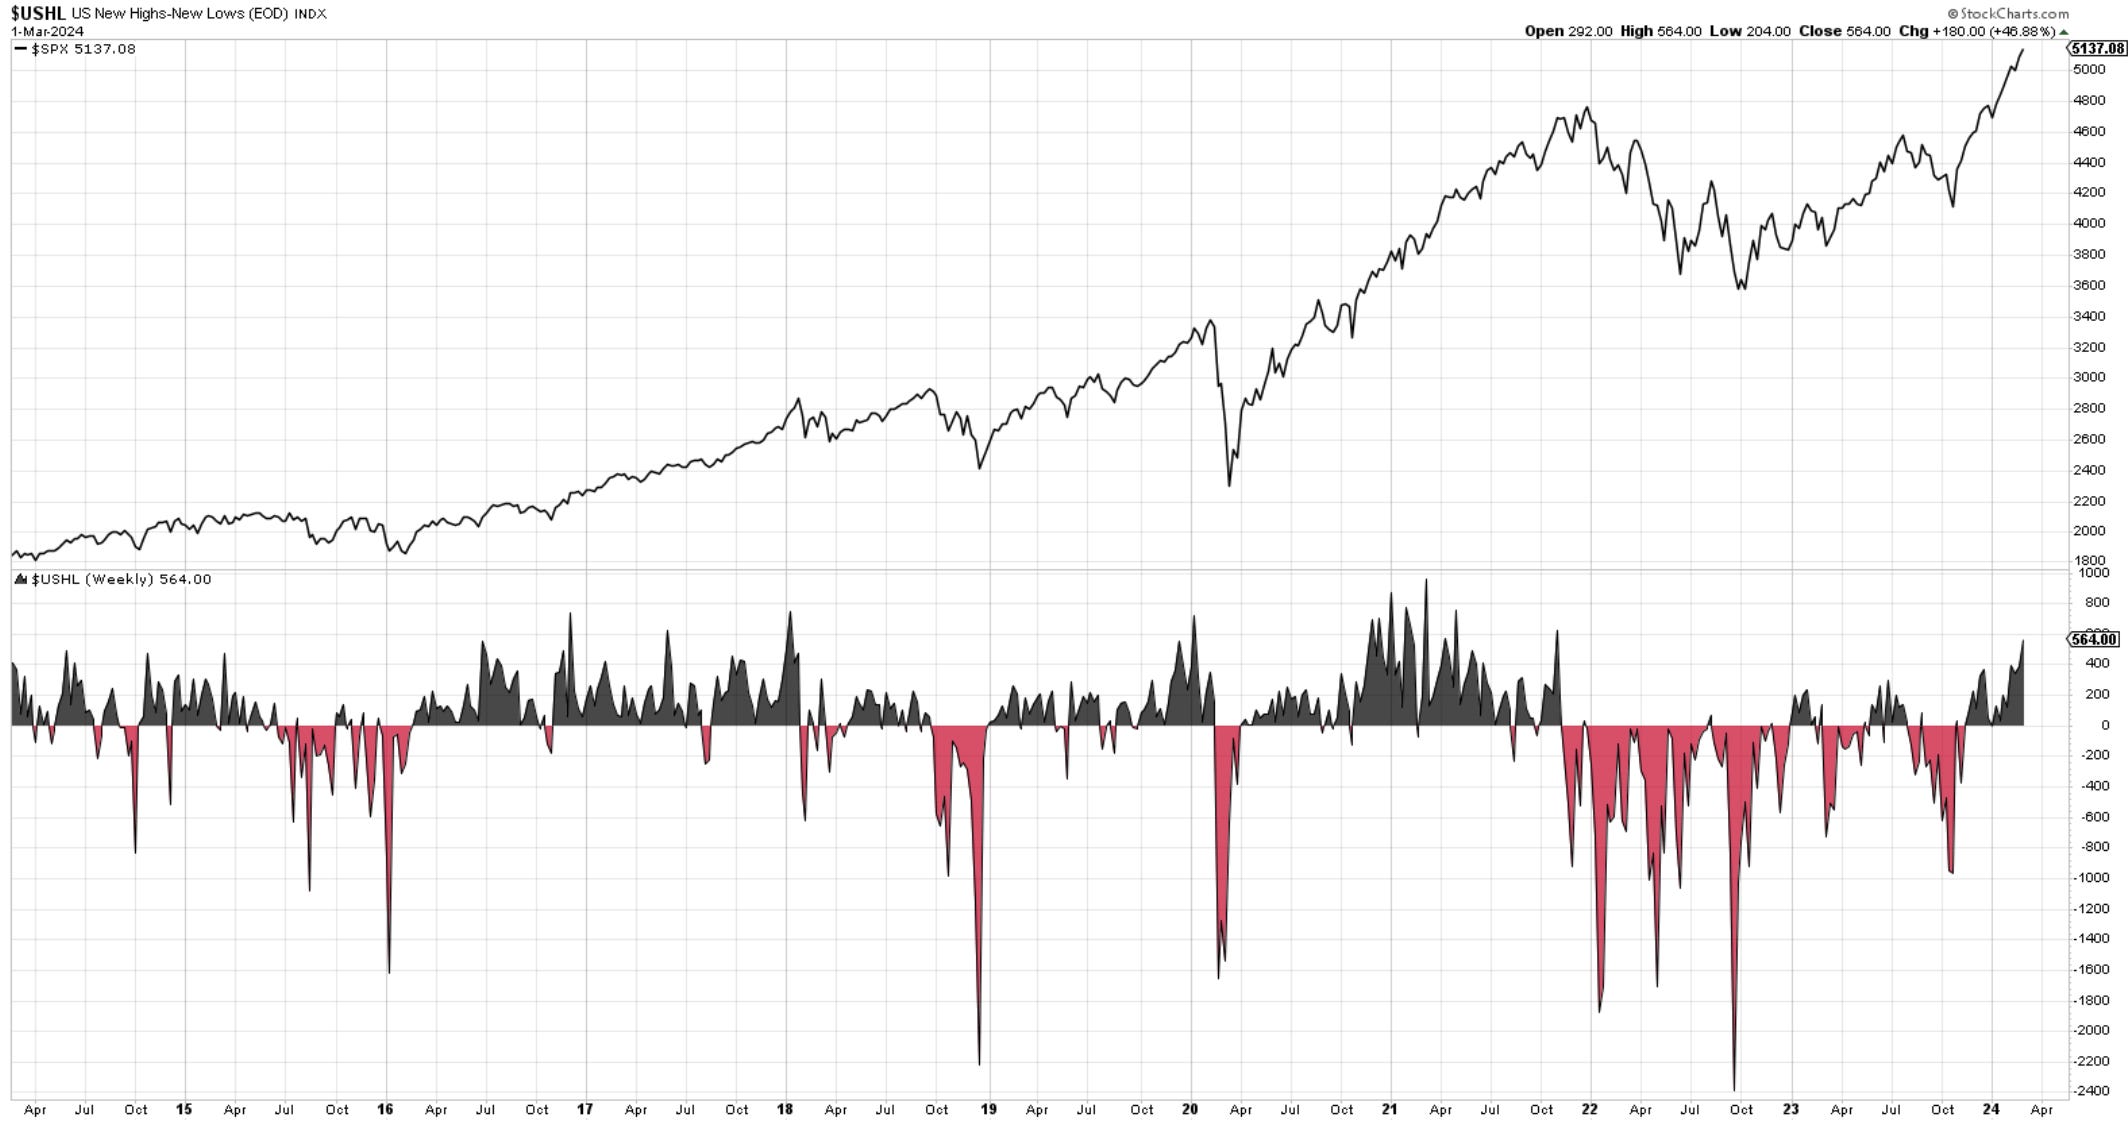
Here is the total new US highs vs. new lows. Black is good, red is bad. Another strong week that added roughly 170 new highs to the data.
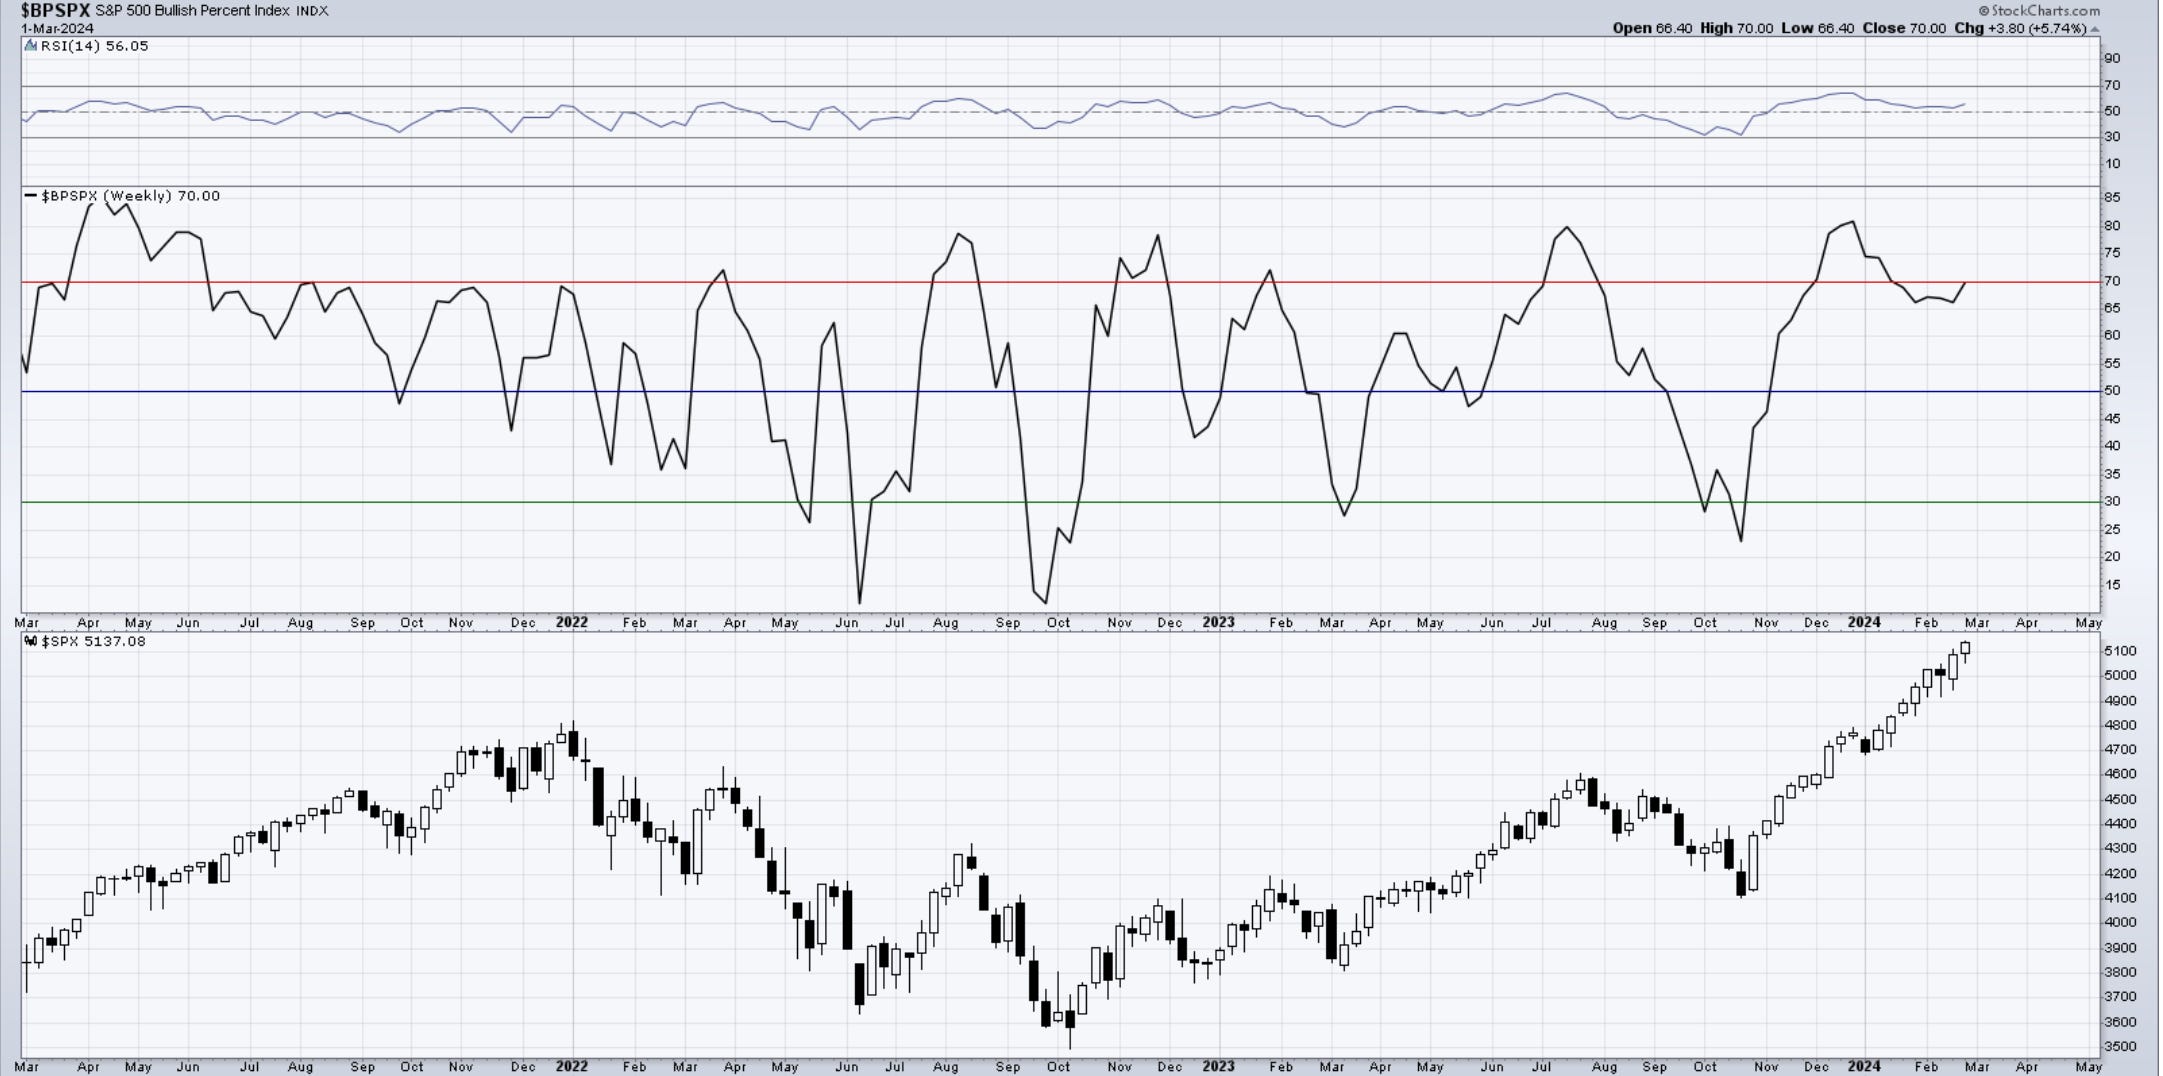
The Bullish Percent Index has gone back up to 70 and remains in bullish territory. It needs to get below 50 to raise larger concerns.
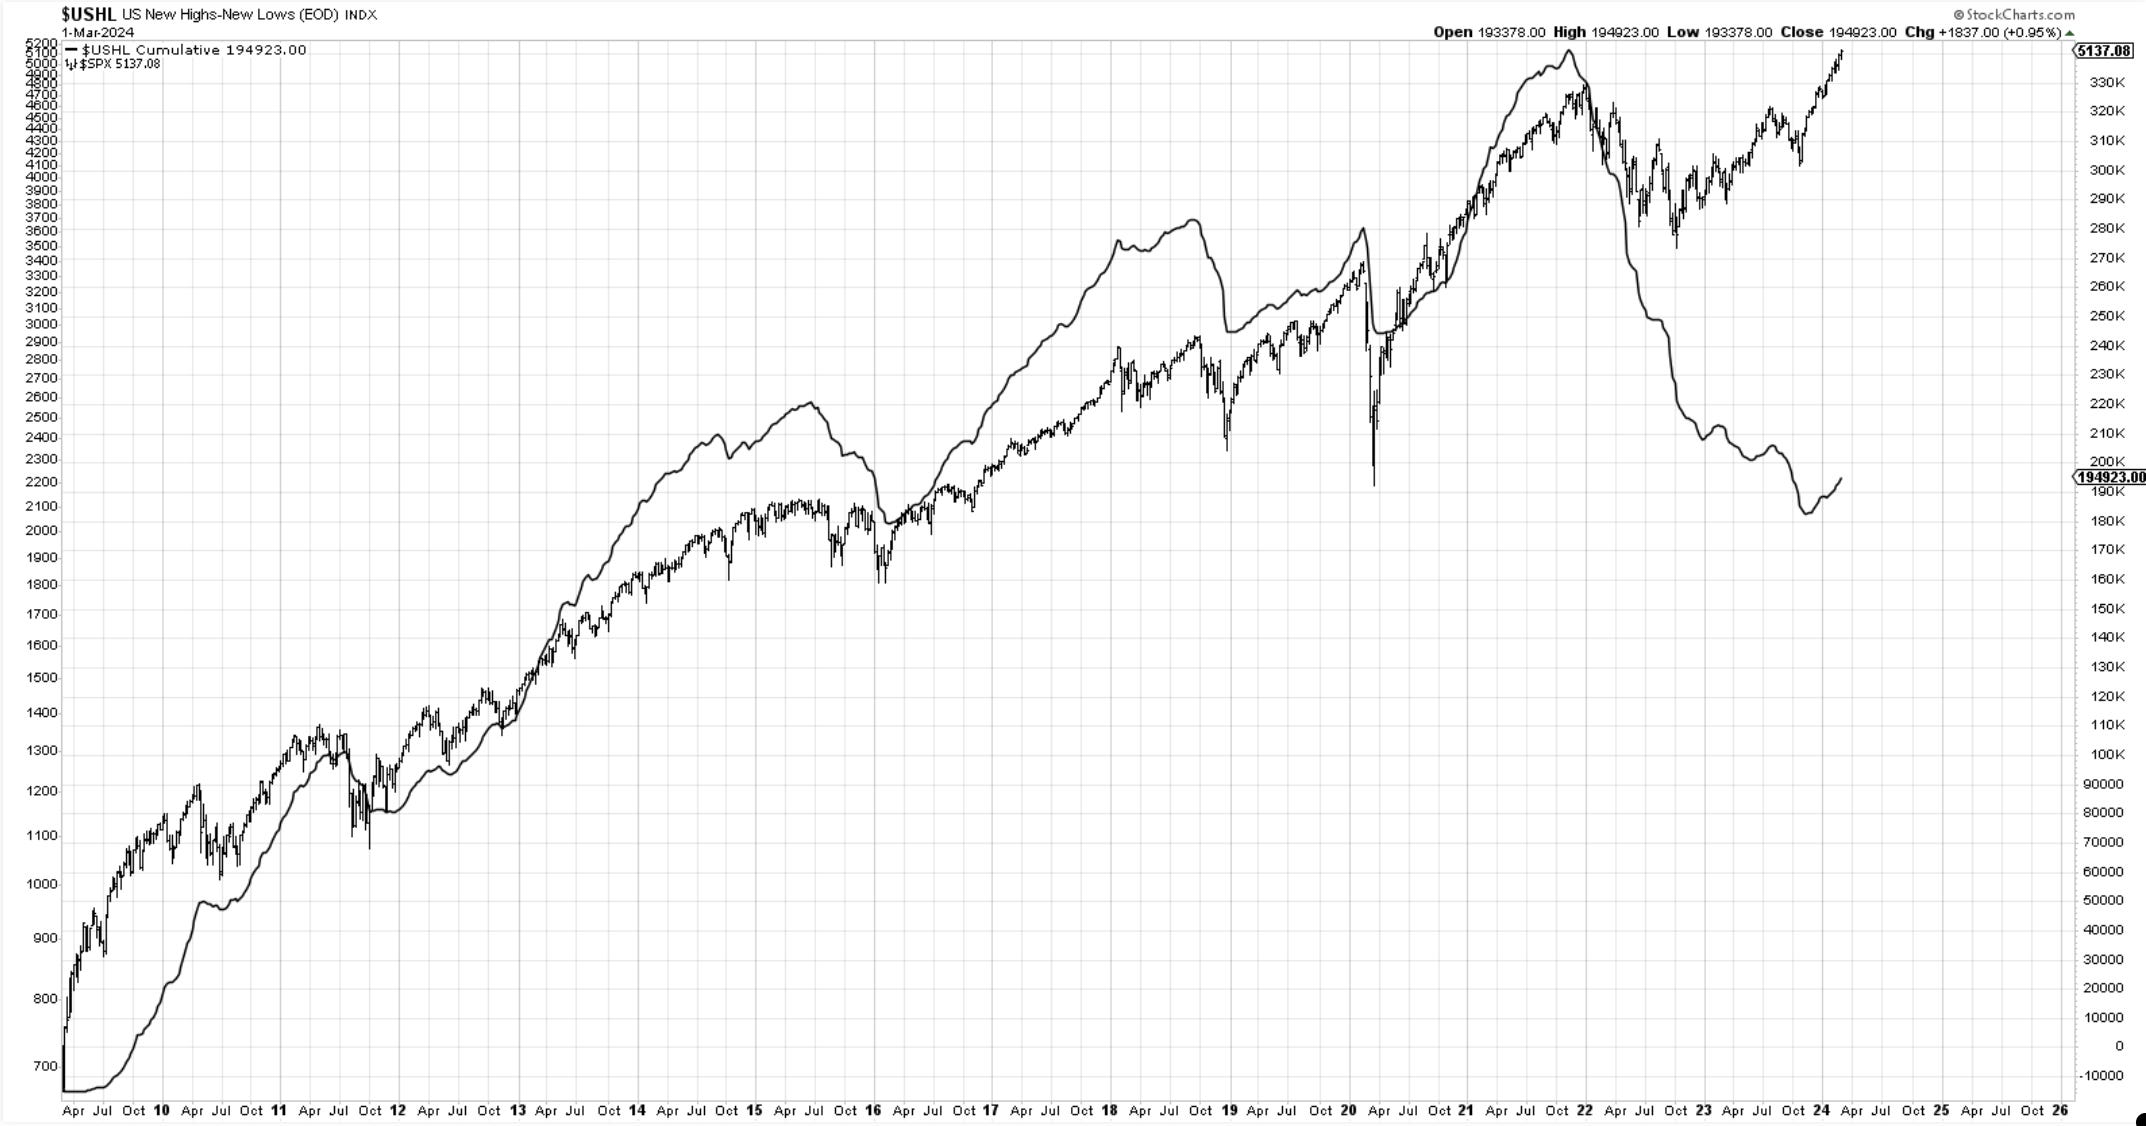
The cumulative line of new highs vs new lows is ticking higher every week since Oct 2023 lows but remains totally disconnected from the price of equities. One question that goes thru my mind is what if we’re about to witness the largest increase in this line that we have seen in a long time? If small caps begin to rally massively it would definitely help this metric play catch up.
Seasonality
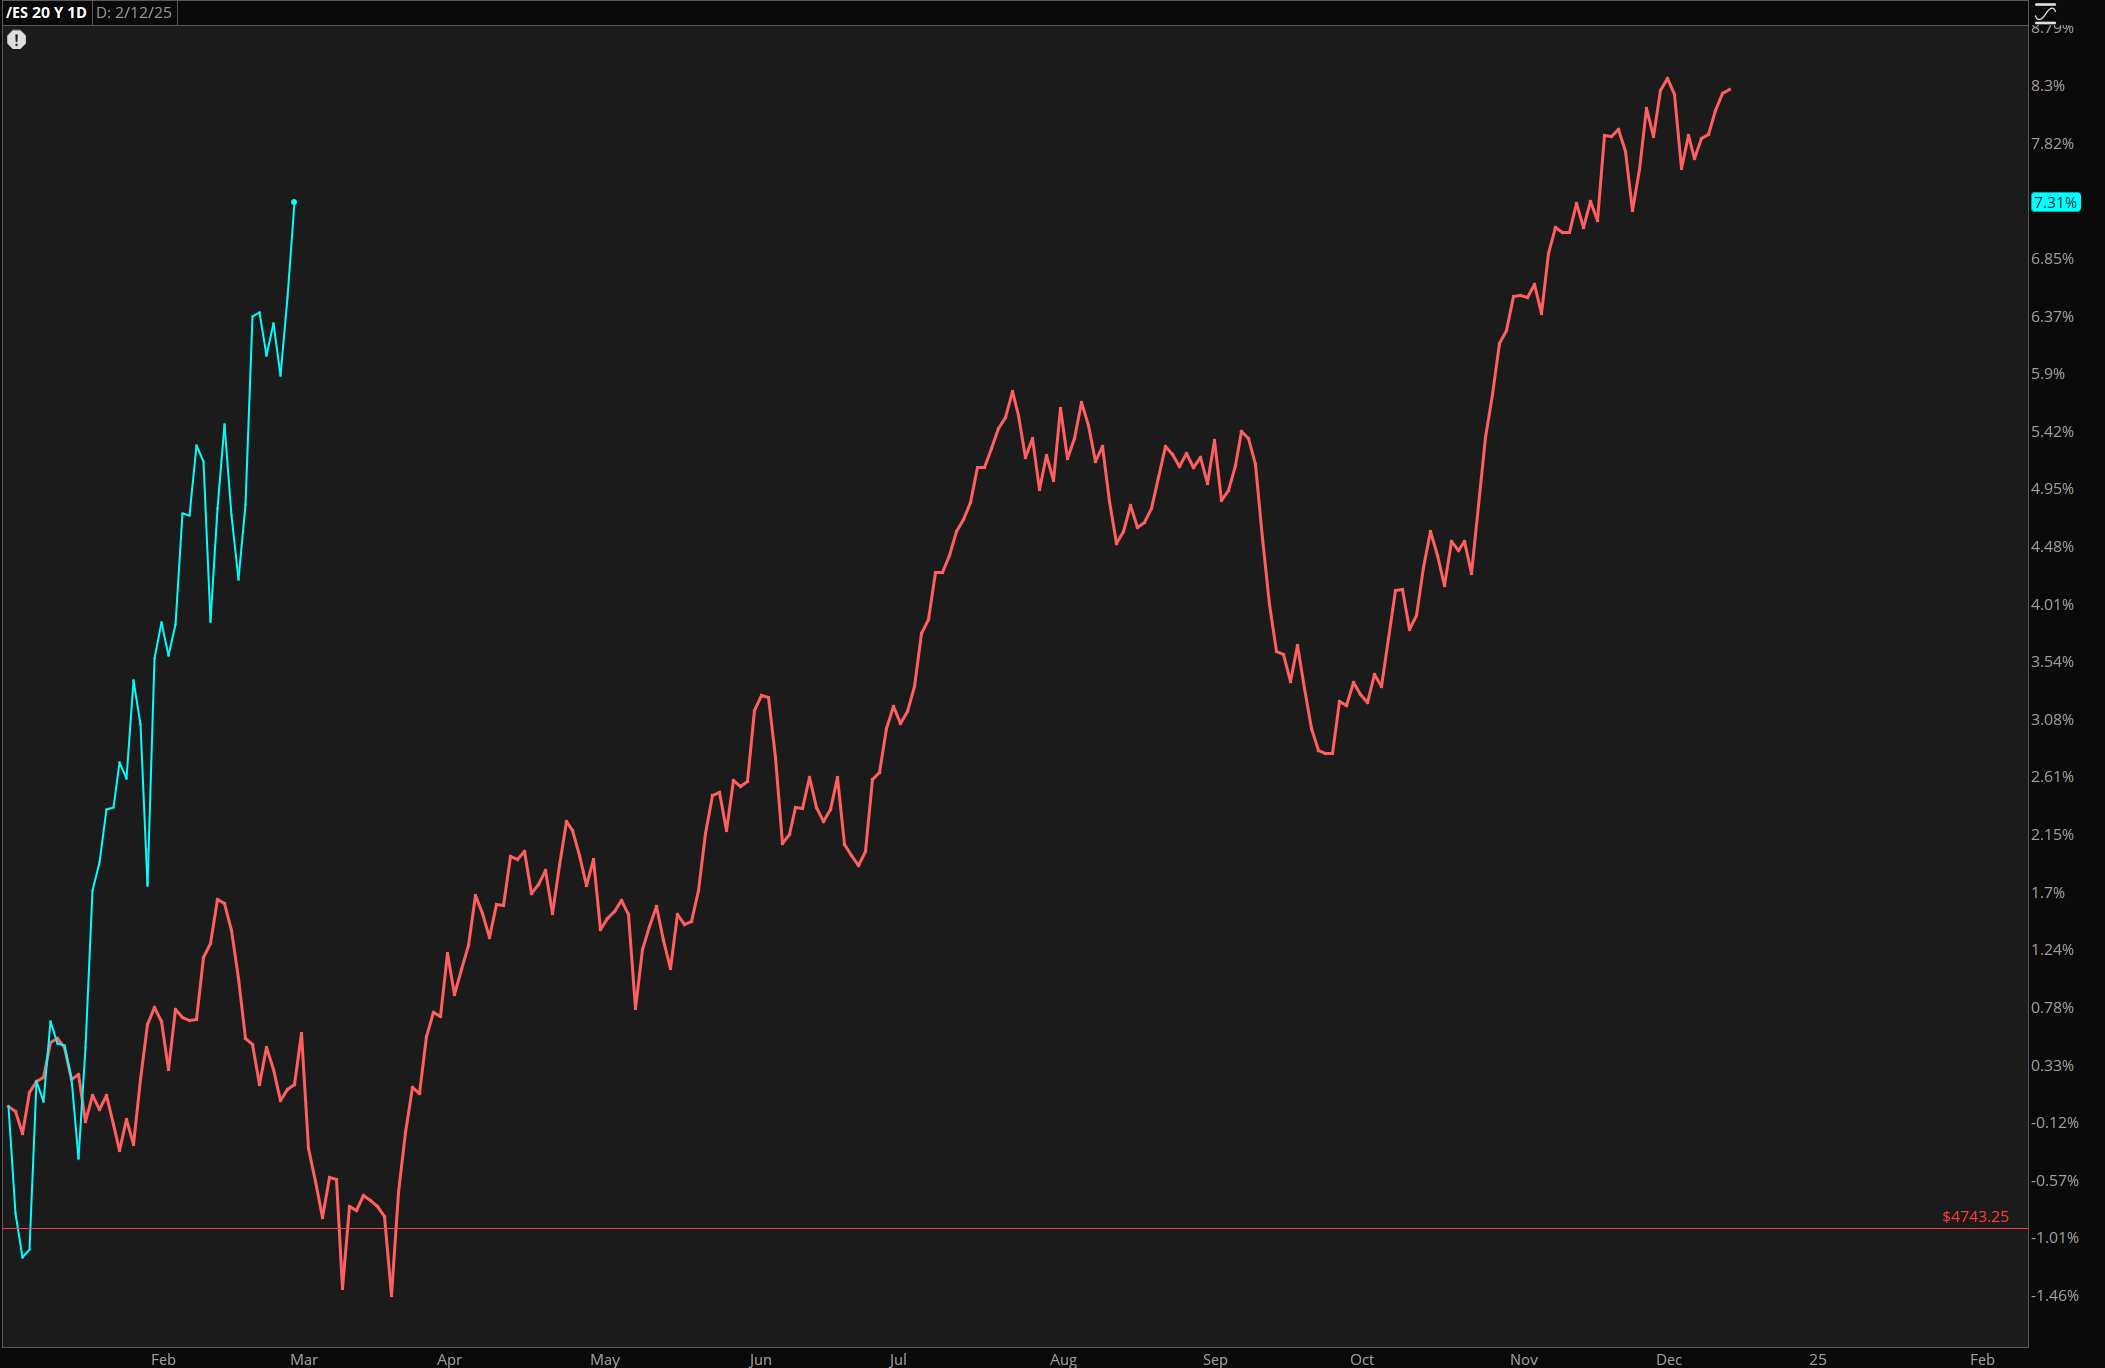
SP500. Here is the daily price action during the month of March. The first half of the month tends to be more positive, followed by some weakness later on.
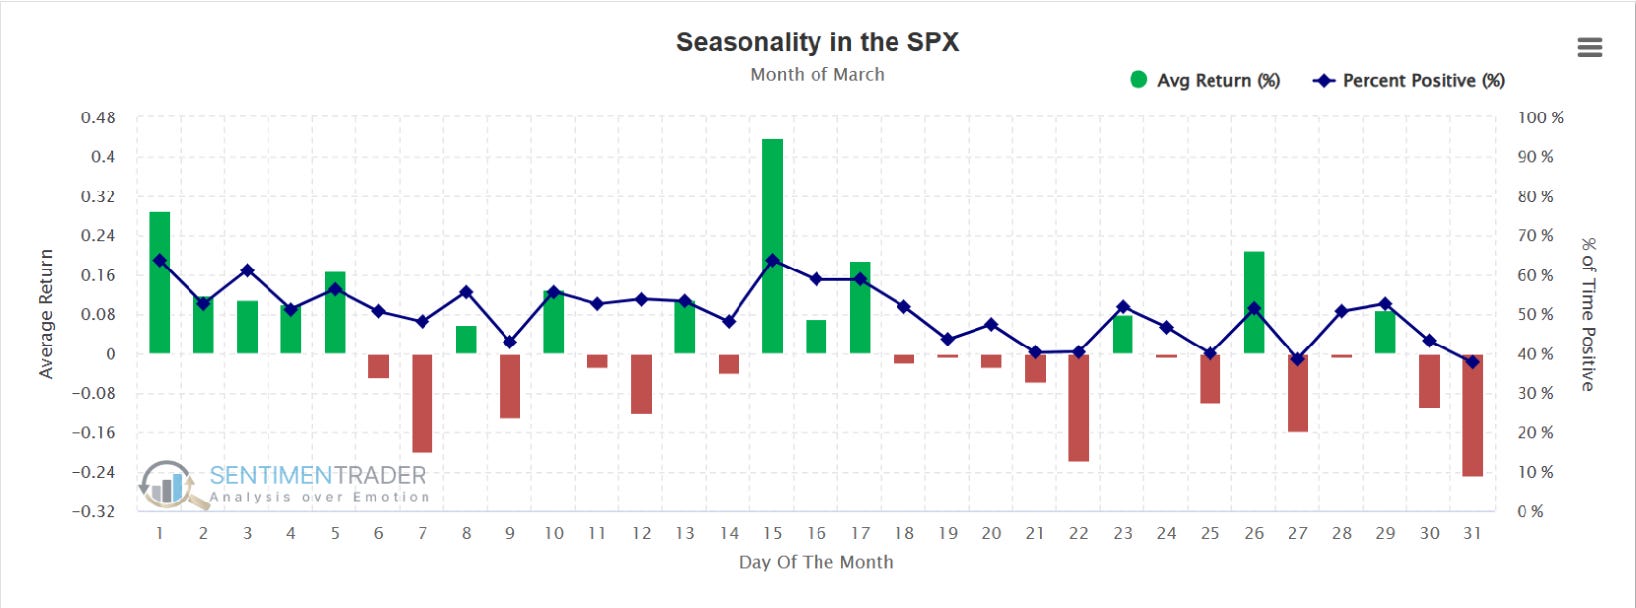
This year we had a great February completely at odds with what usually happens historically. Does this year wipe out this metric’s relevance? Not at all, it just shows tendencies not guarantees. Price remains the ultimate metric.
Price
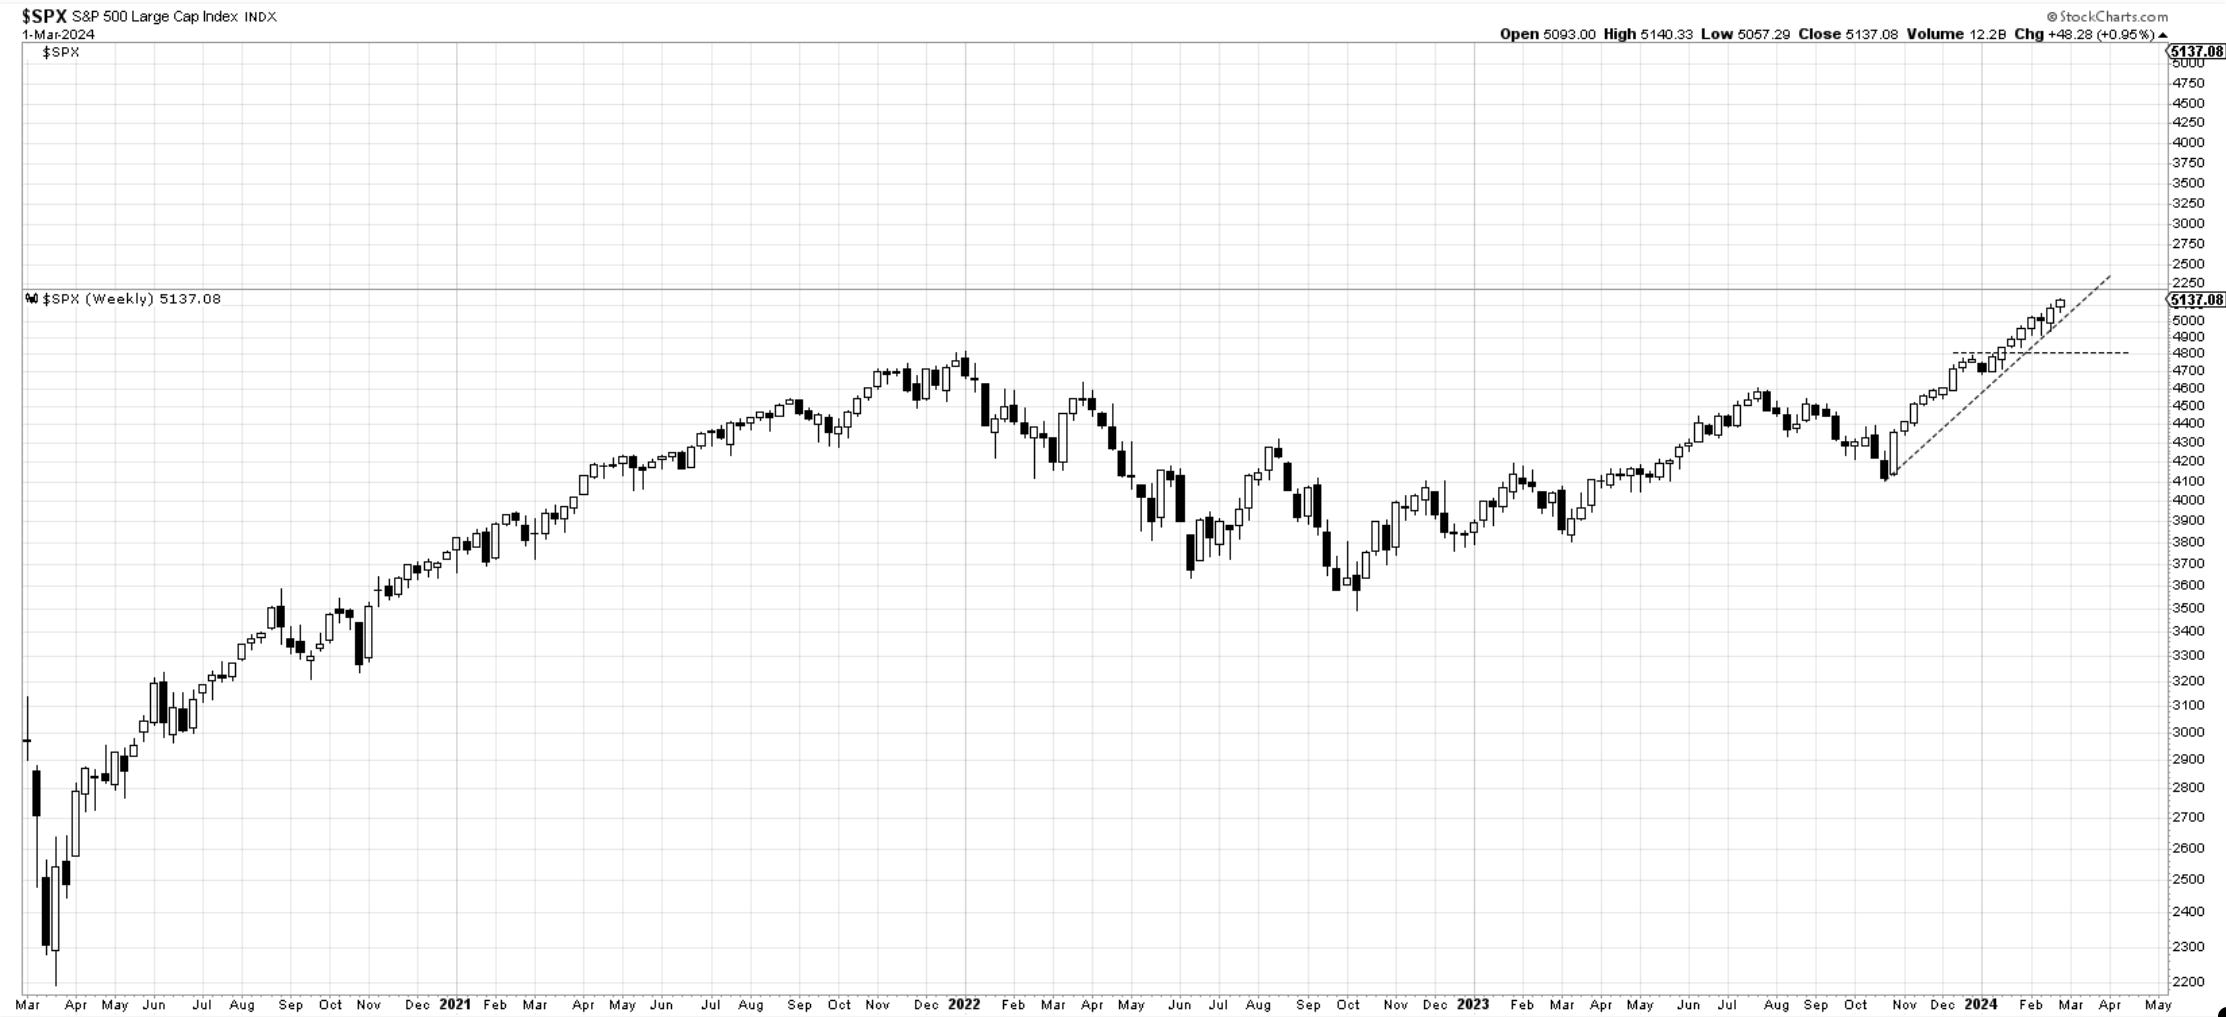
SP500. We made a new closing at all-time highs. The trendline remians intact and the major support is at 4800. 5040 is support closer by. I only discuss elliott wave counts in daily updates and videos but this move is shaping up more and more as a 3rd wave which is usually the strongest wave in a motive sequence.
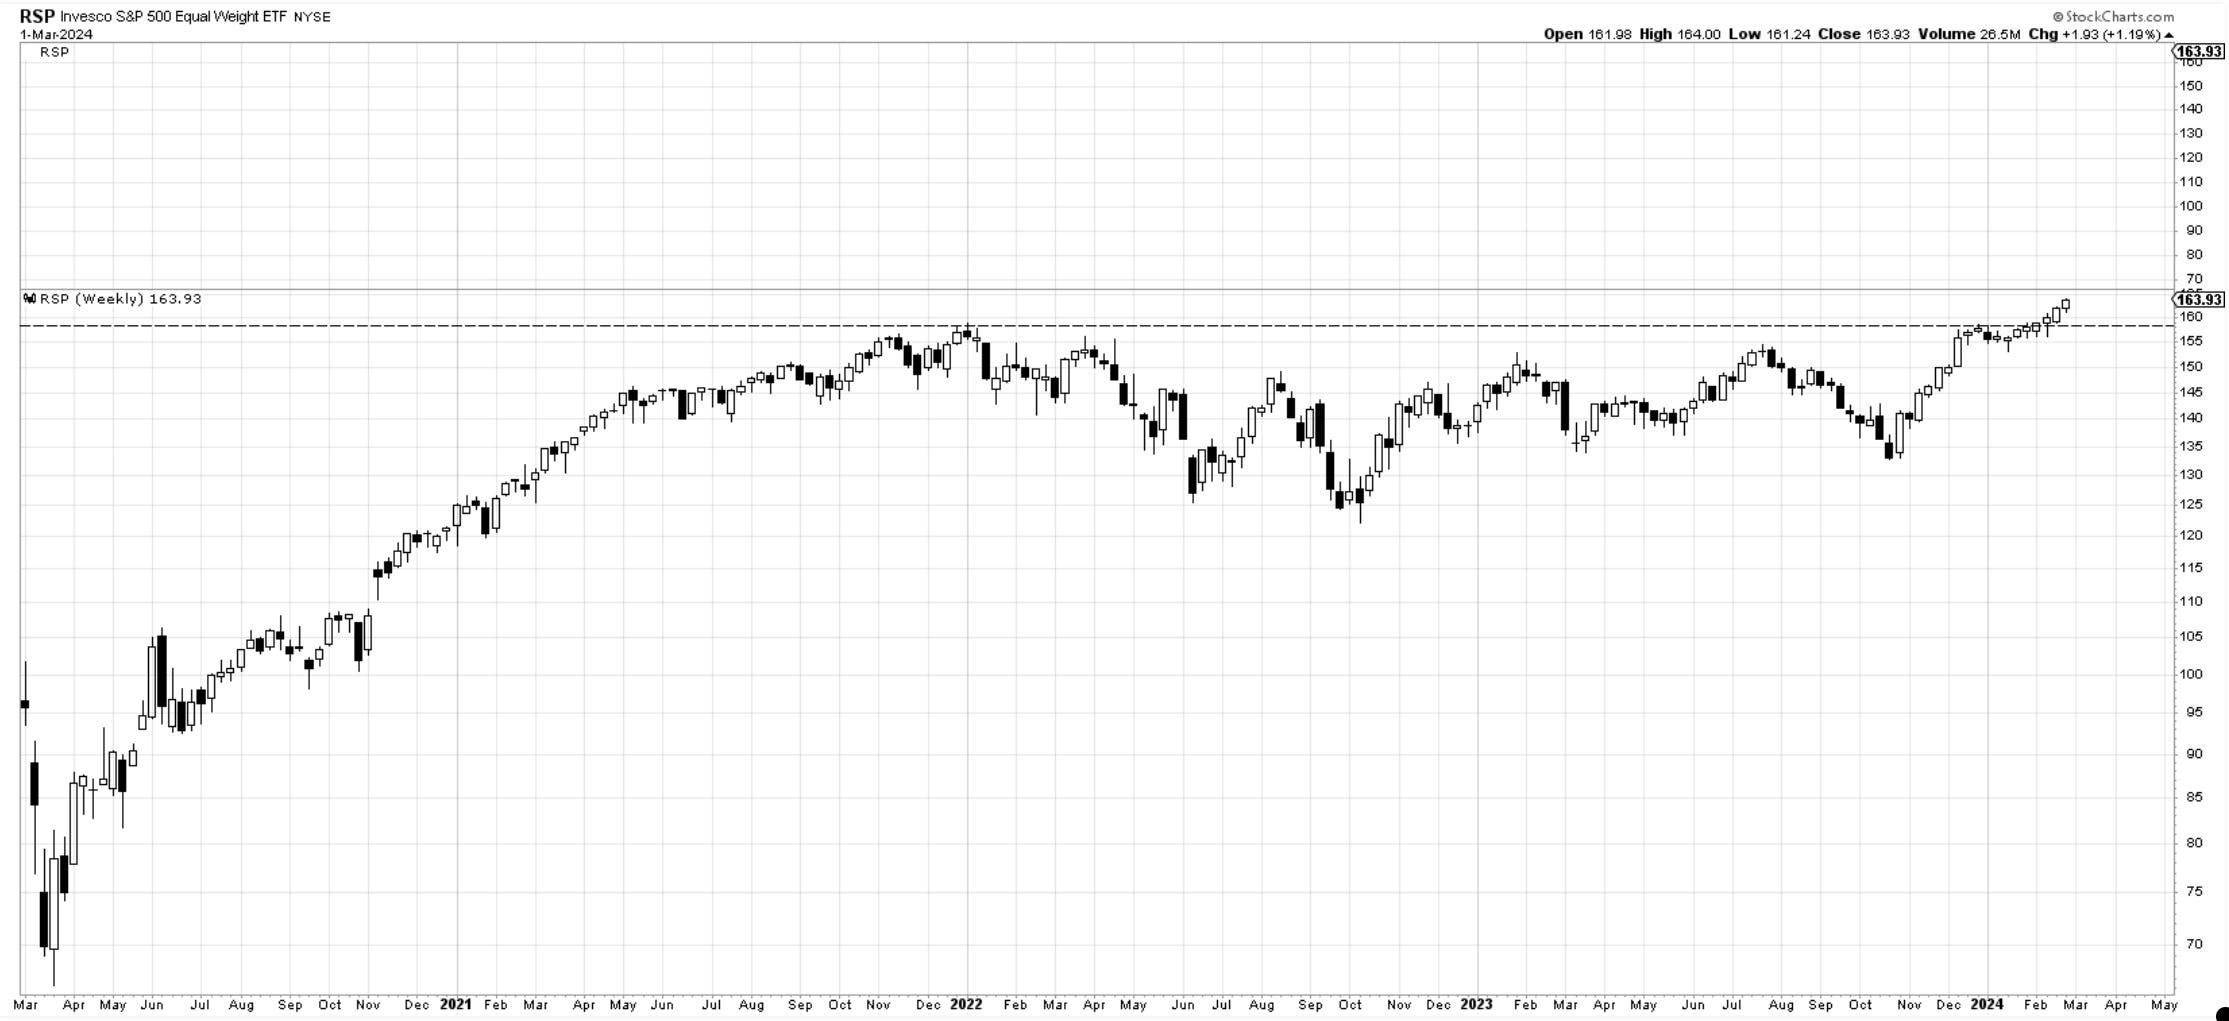
RSP - equal weight SP500. The fact that the equal weight index has broken as well confirms the health of the rally and leaves no doubt it could have further upside developments.
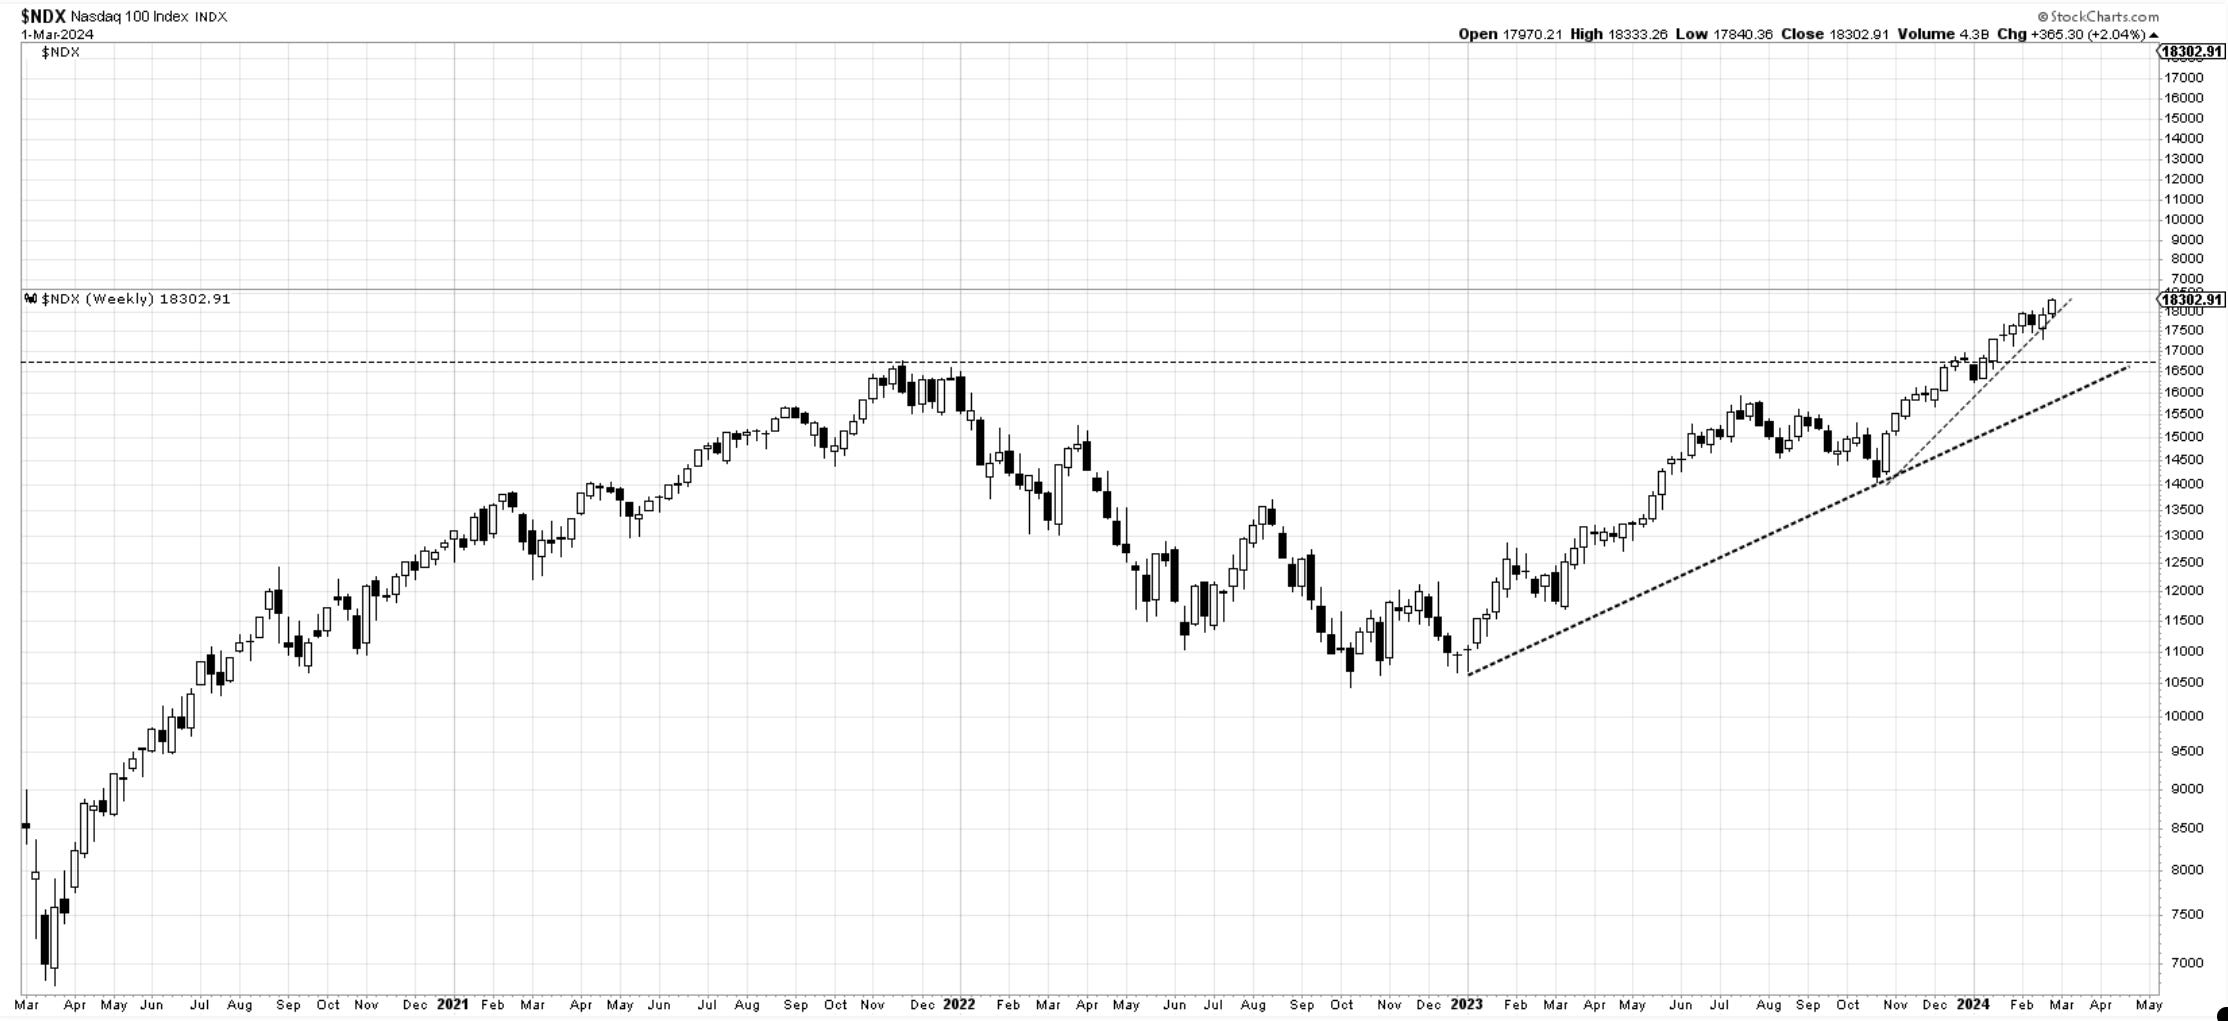
Nasdaq100 has managed to stage a new all-time closing high as well. The trend is now established and any return to the thicker line should be viewed as buy opportunities. Major Horizontal support is 16,764.
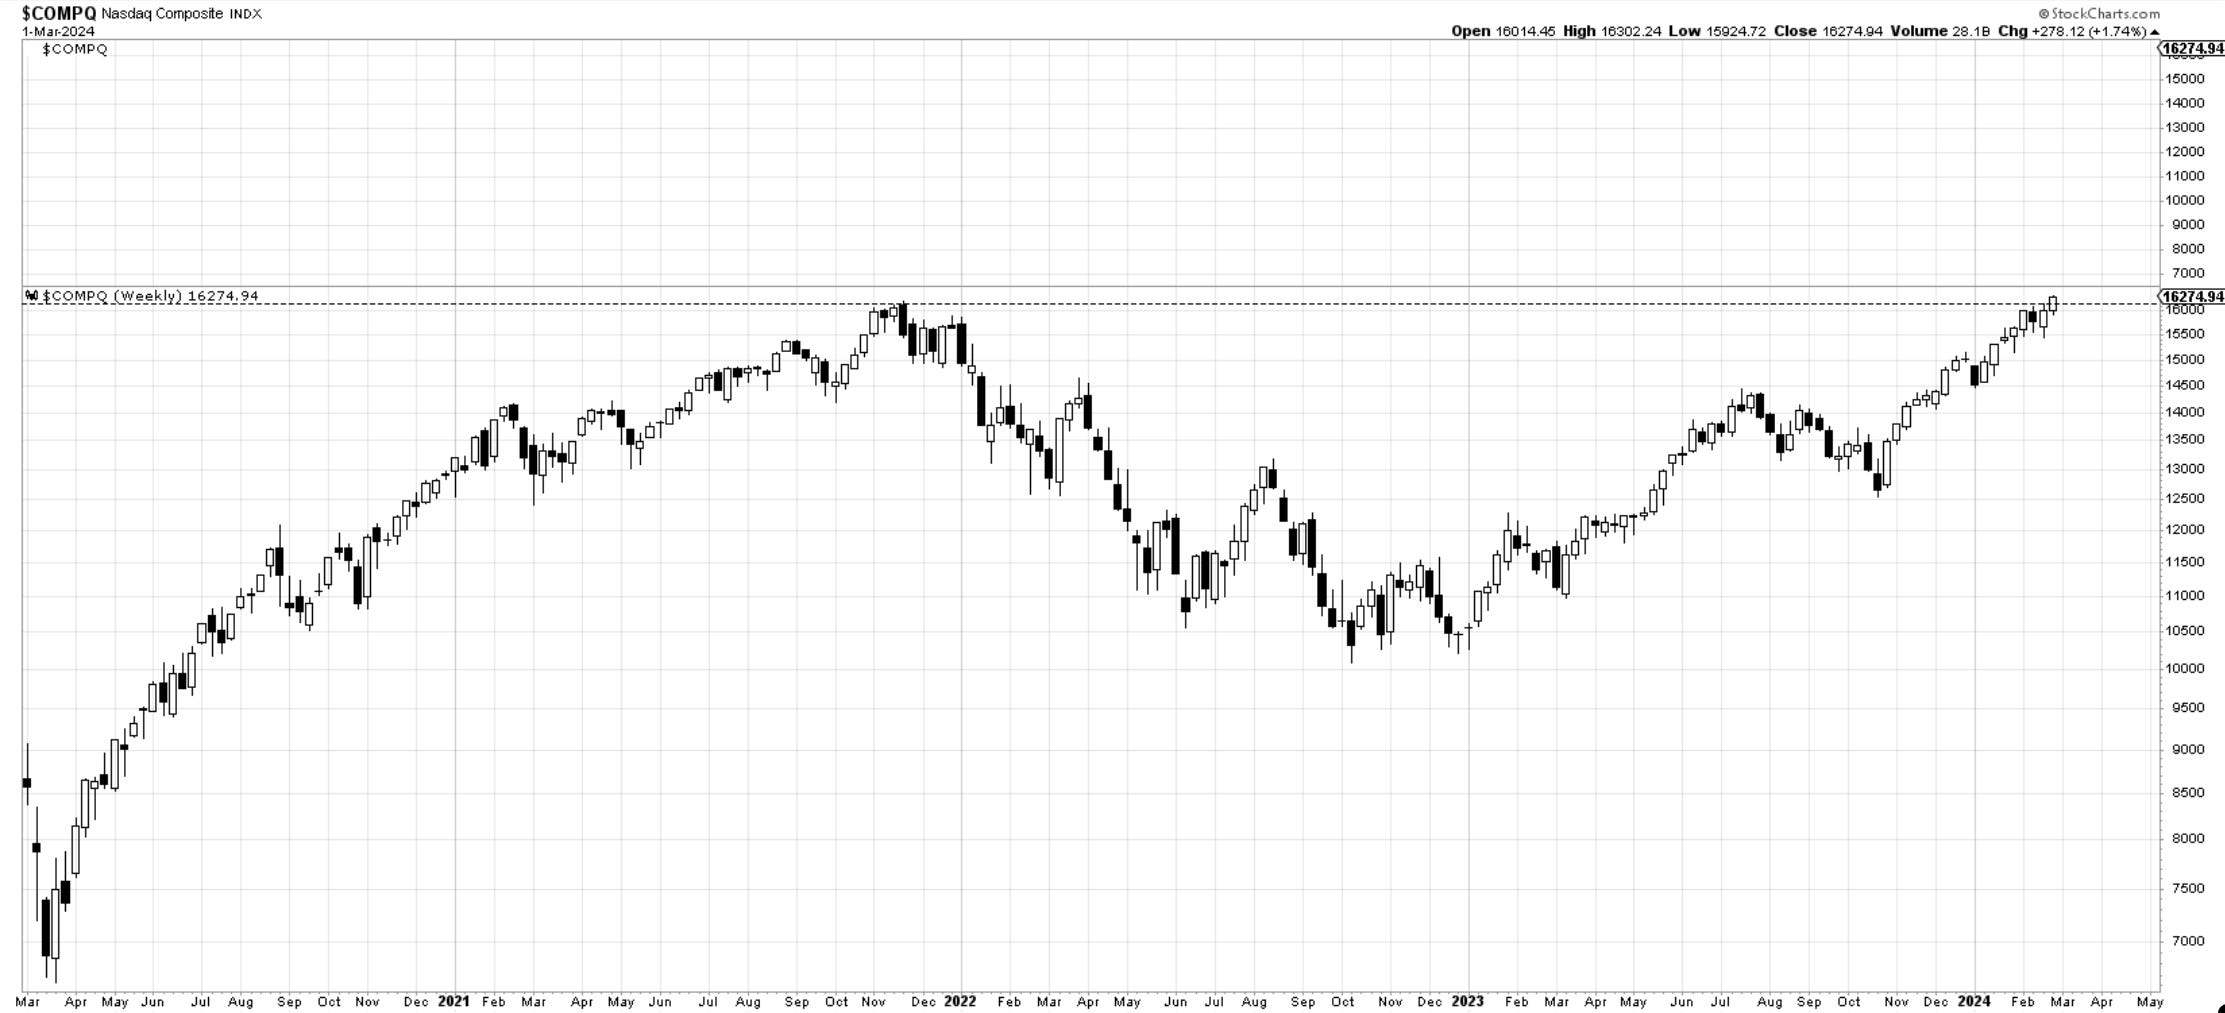
Nasdaq composite - has finally managed to close to new ATH. There are 3000 stocks listed here. A break higher in this index is a bullish signal.
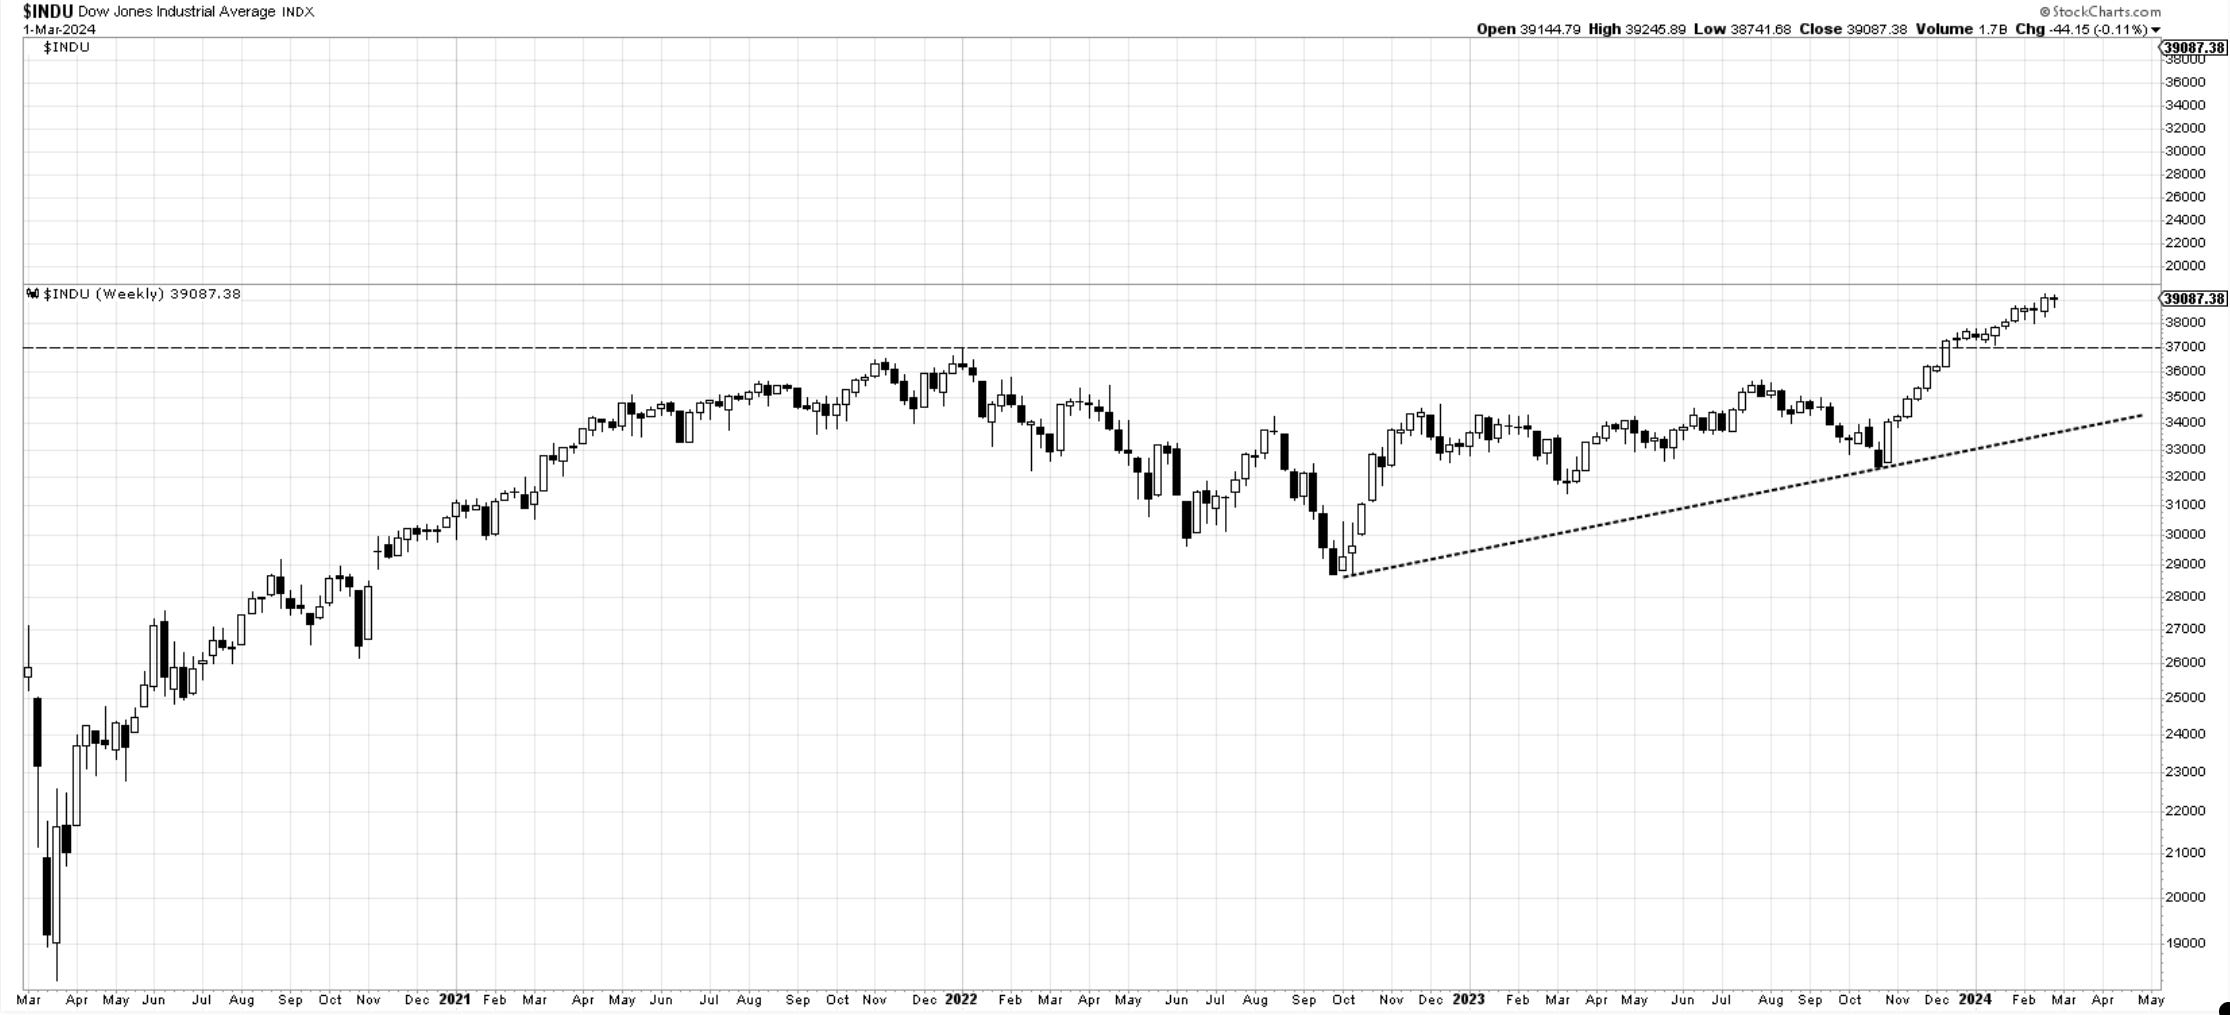
Dow Jones 30 was a bit more timid and did not close above last week’s close. However, this is likely a pause in the uptrend and will likely resume higher. 38k is the first major support.
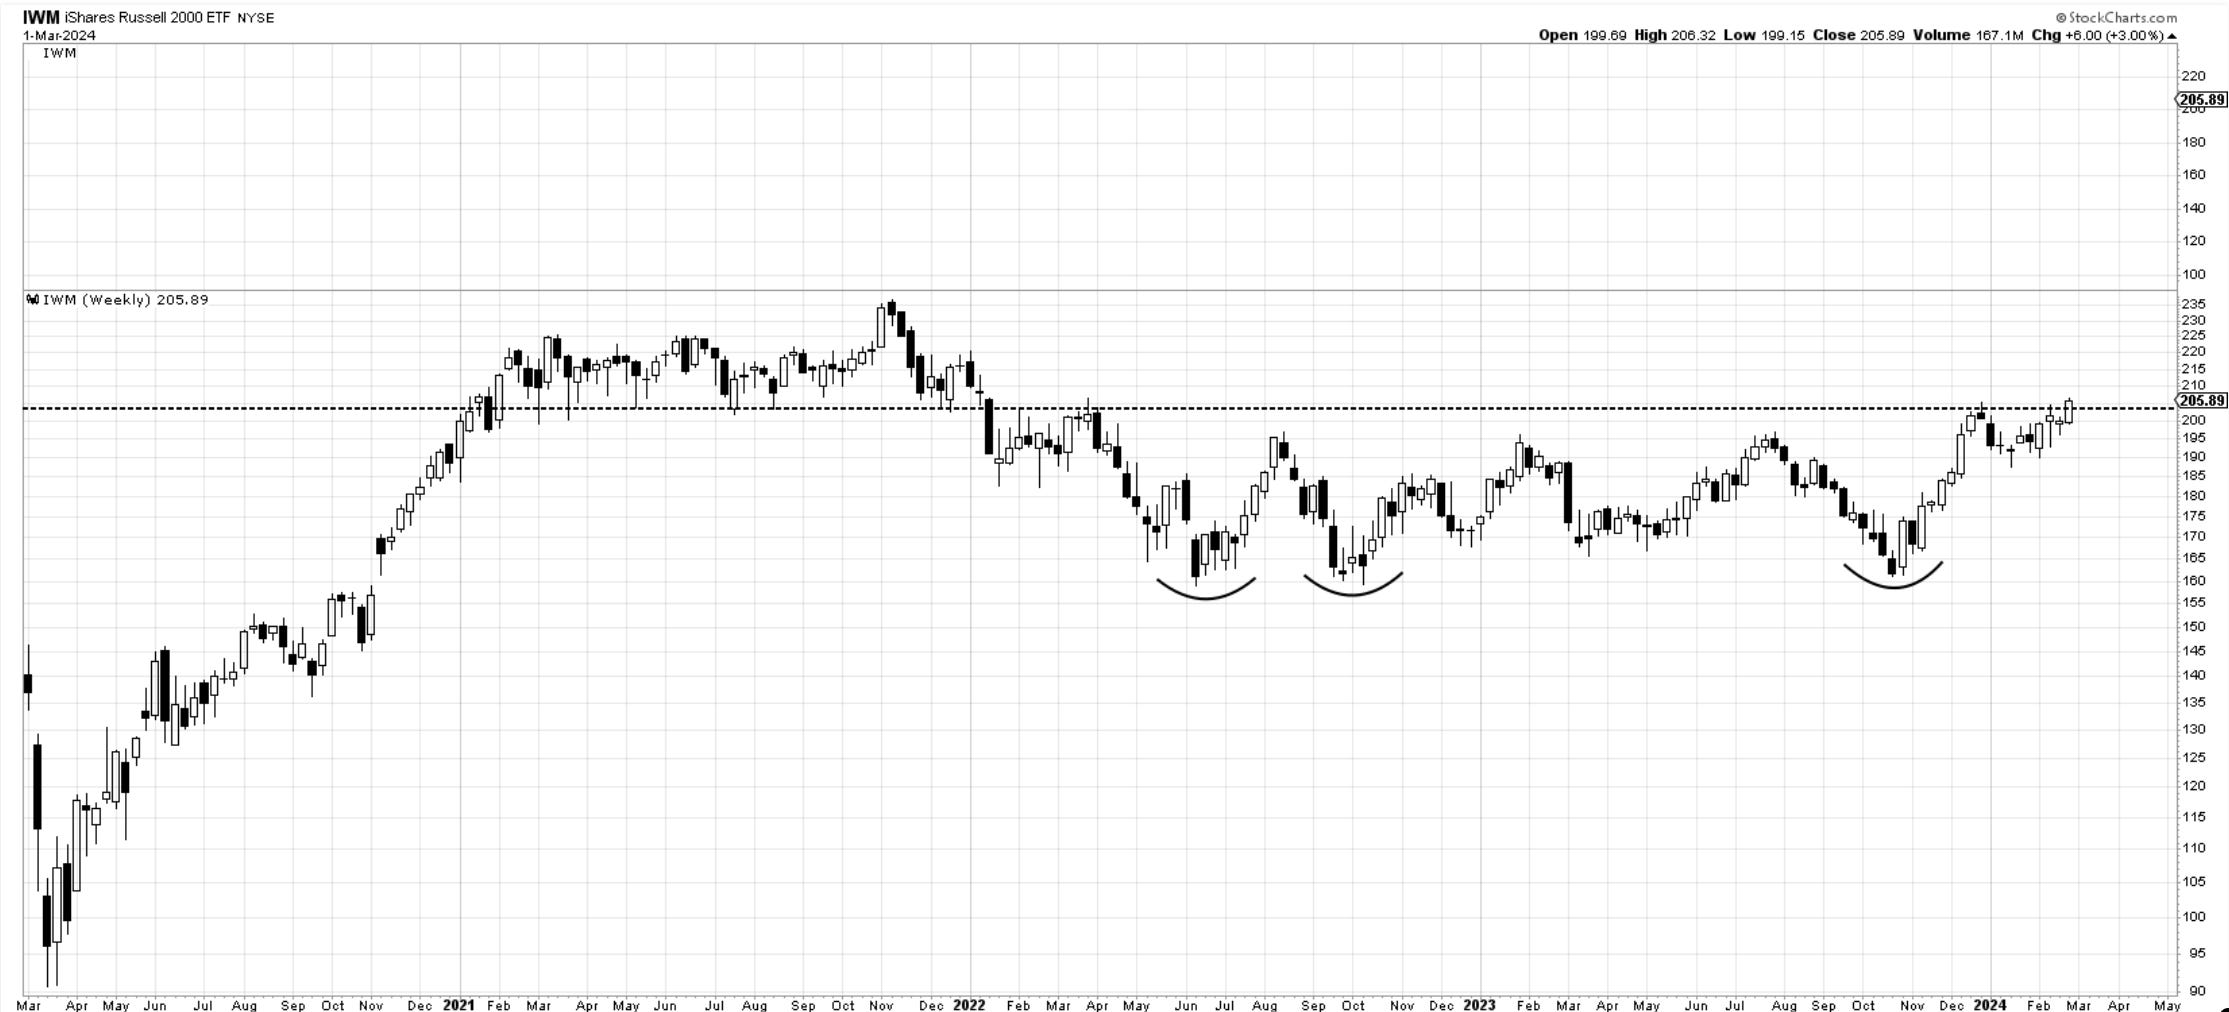
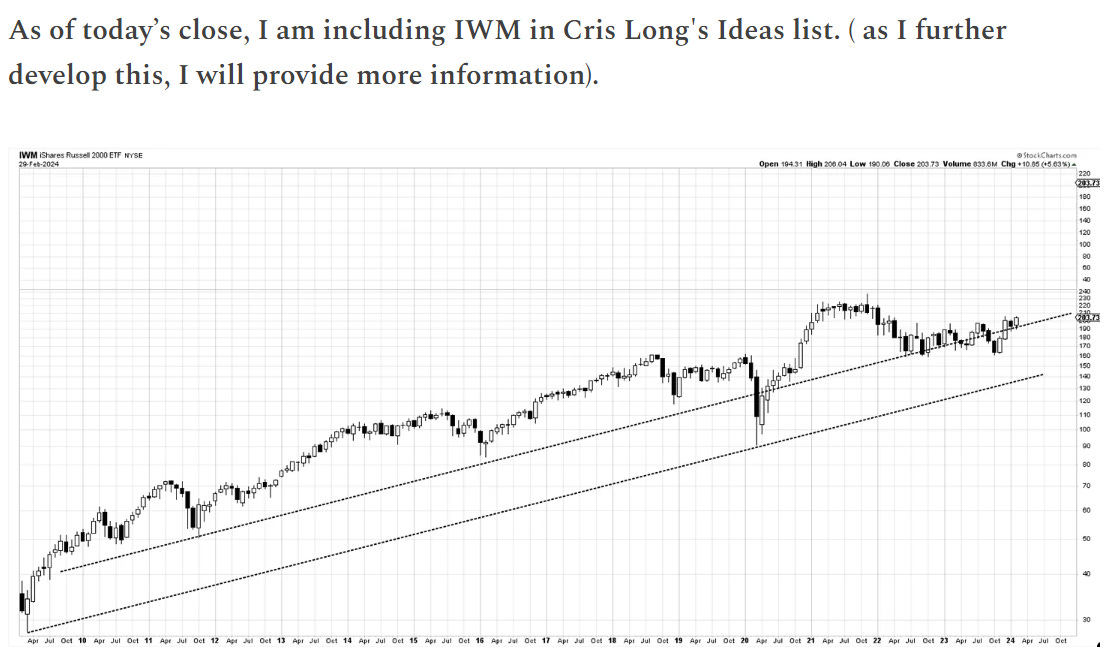
IWM - small caps. We have closed the week at 205.89. As I have been discussing in prior updates, this marks a new bullish signal for this market that has been lagging. It should now have a decent roadmap towards 225 over the upcoming months.
Here is the note below from Thursday’s daily updates.
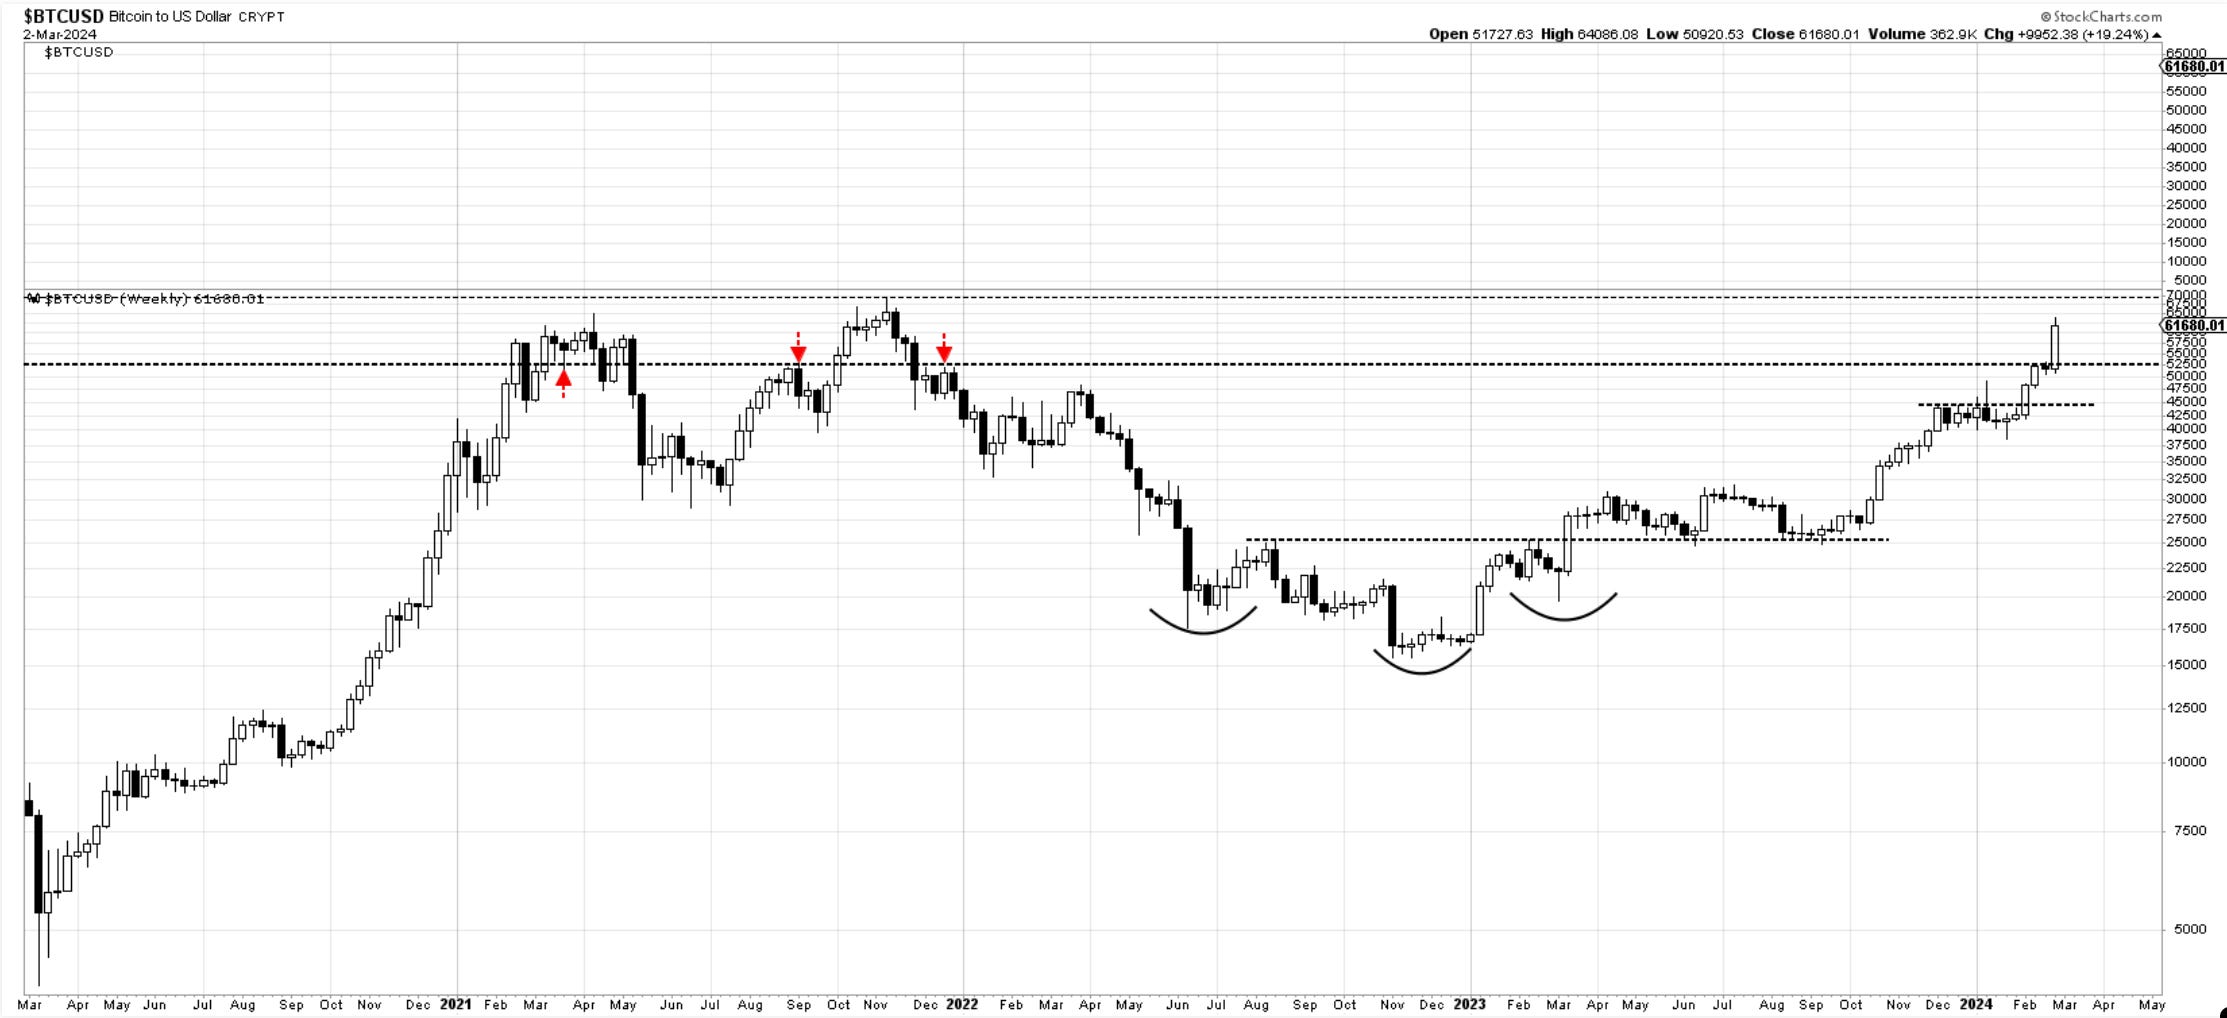
Bitcoin -the 60k targets from last week’s note got taken out and we are now on the way to new all time highs. We are finding some resistance at the old 2021 highs but should get overtaken over the course of the upcoming weeks. Elliott wave projection has us moving towards 120k. Check out daily videos fore more.
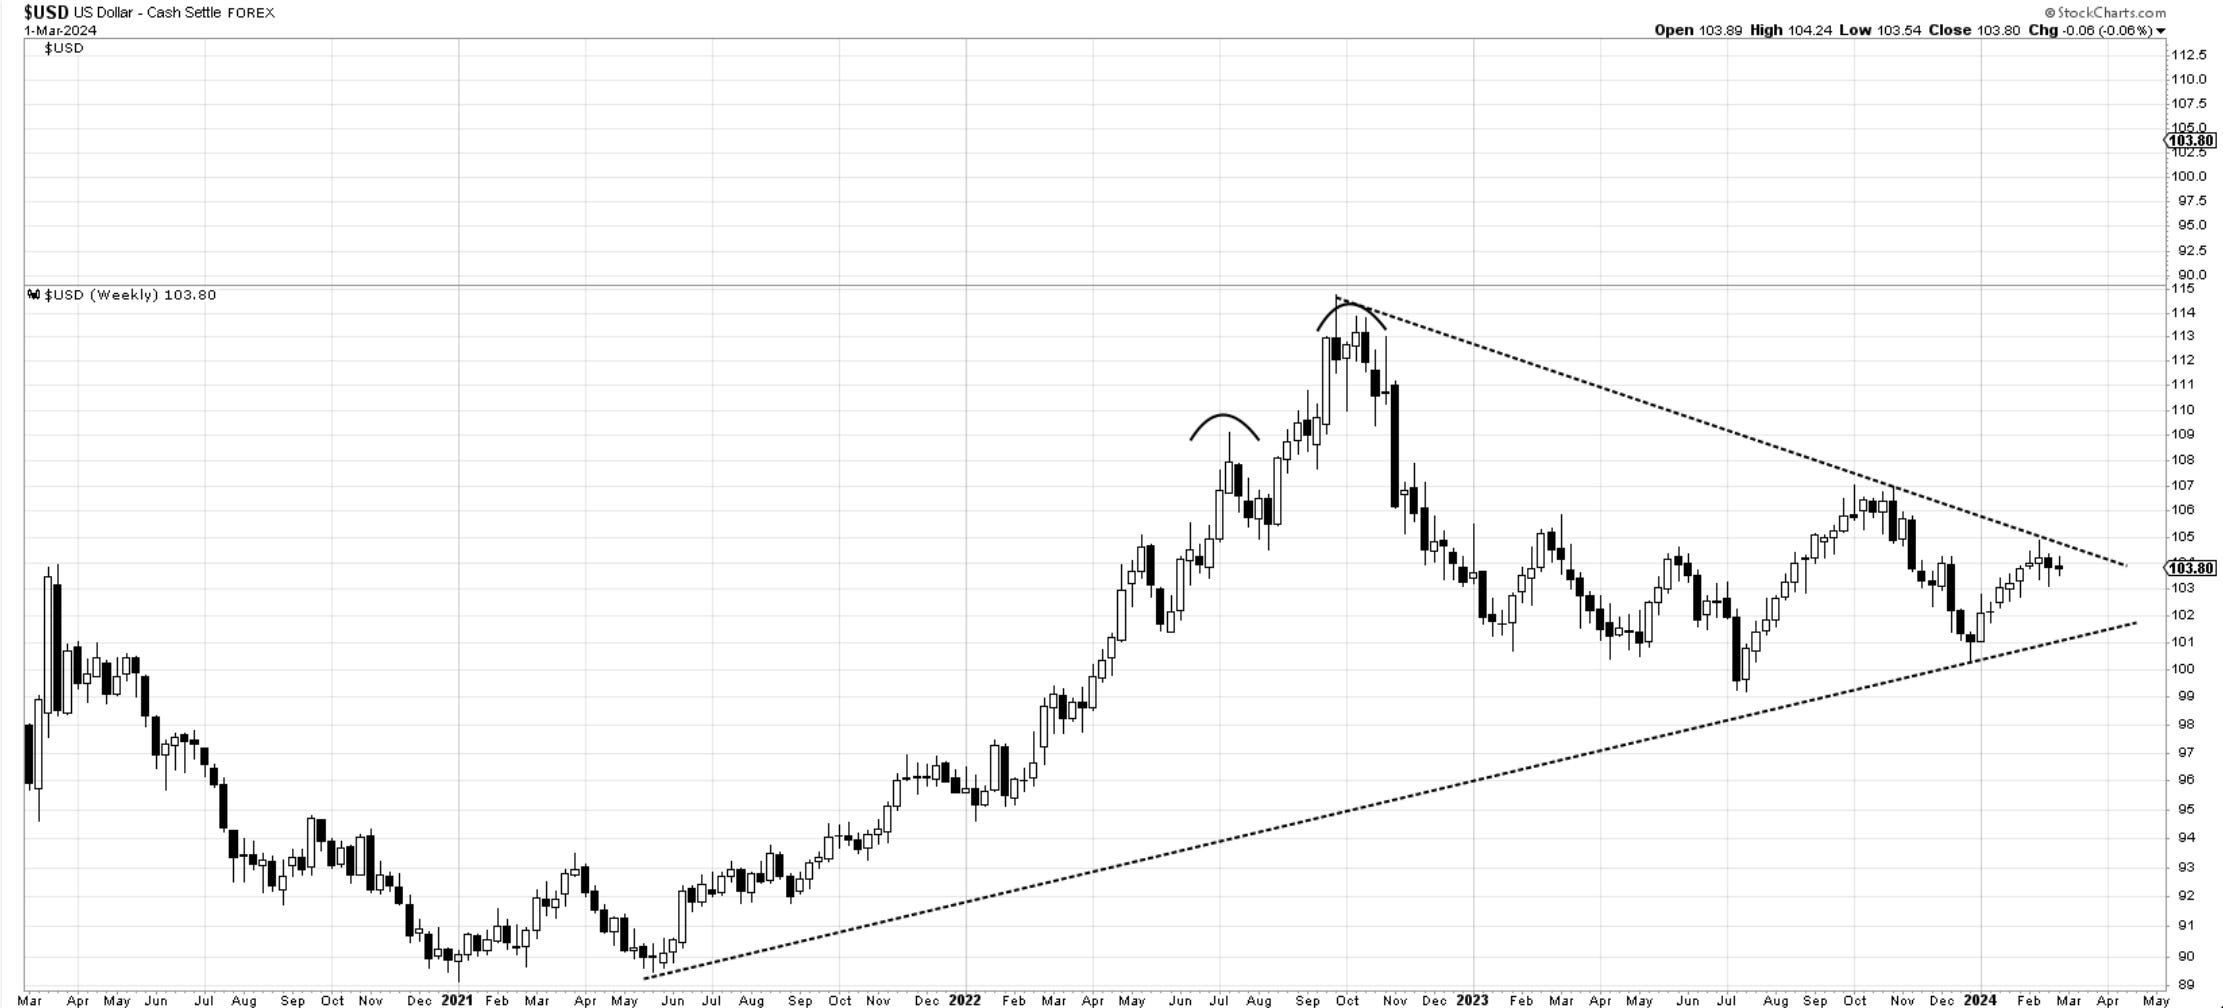
The US Dollar - remains in a state of equilibrium near 104. There are head and shoulder arguments since May 2023 peak with a head Oct 2023. Usually, these formations need to reverse something, and there is nothing apparent to reverse. Looking as a continuation pattern, it would suggest a break lower, but realistically until 101 gives way, there is not much to do here but observe.
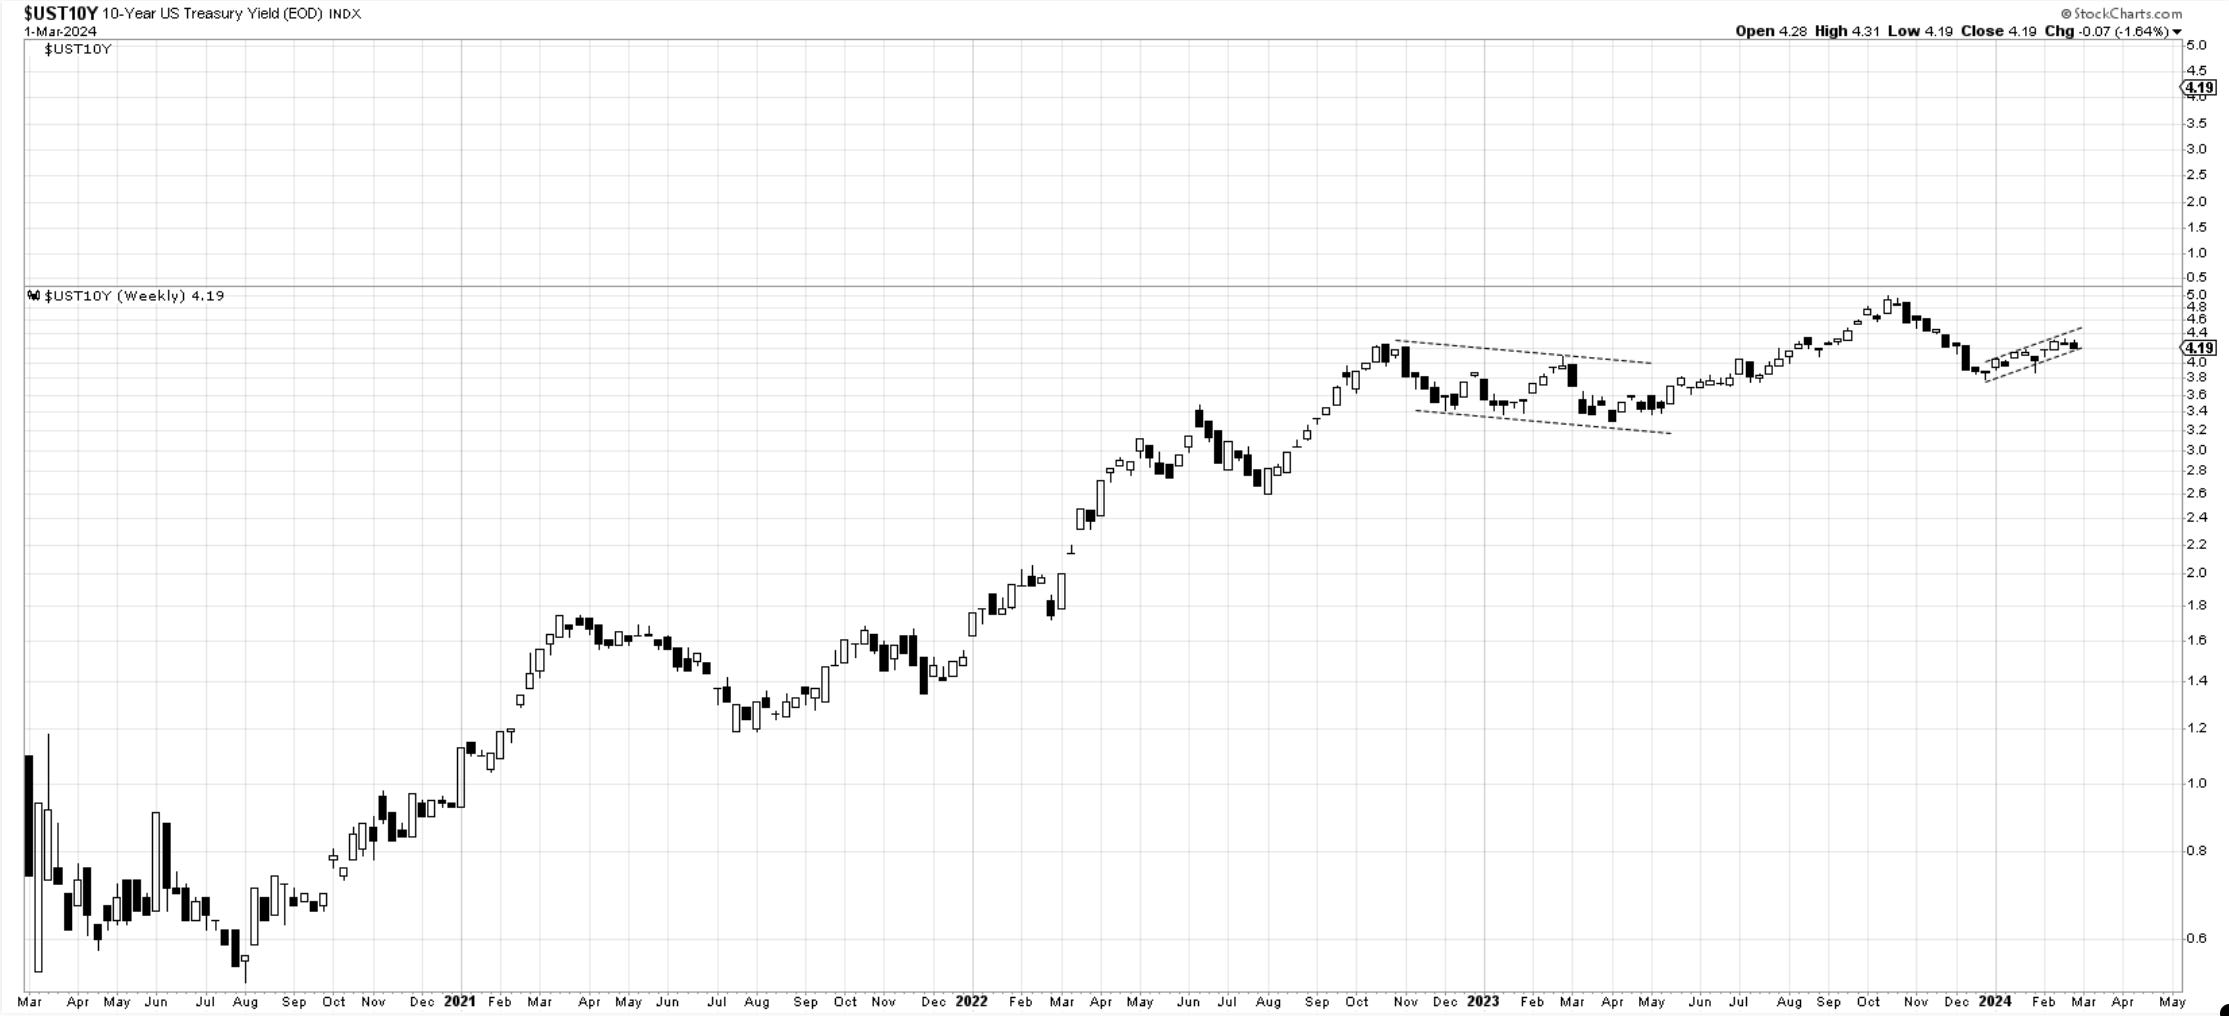
10y Yields - this small weekly bearish flag in yields is a must-watch. If we lose 4% is quite likely we will make new lows. The implications for markets are debatable depending on speed, but lower yields will help risk assets, especially small caps which depend on borrowing.
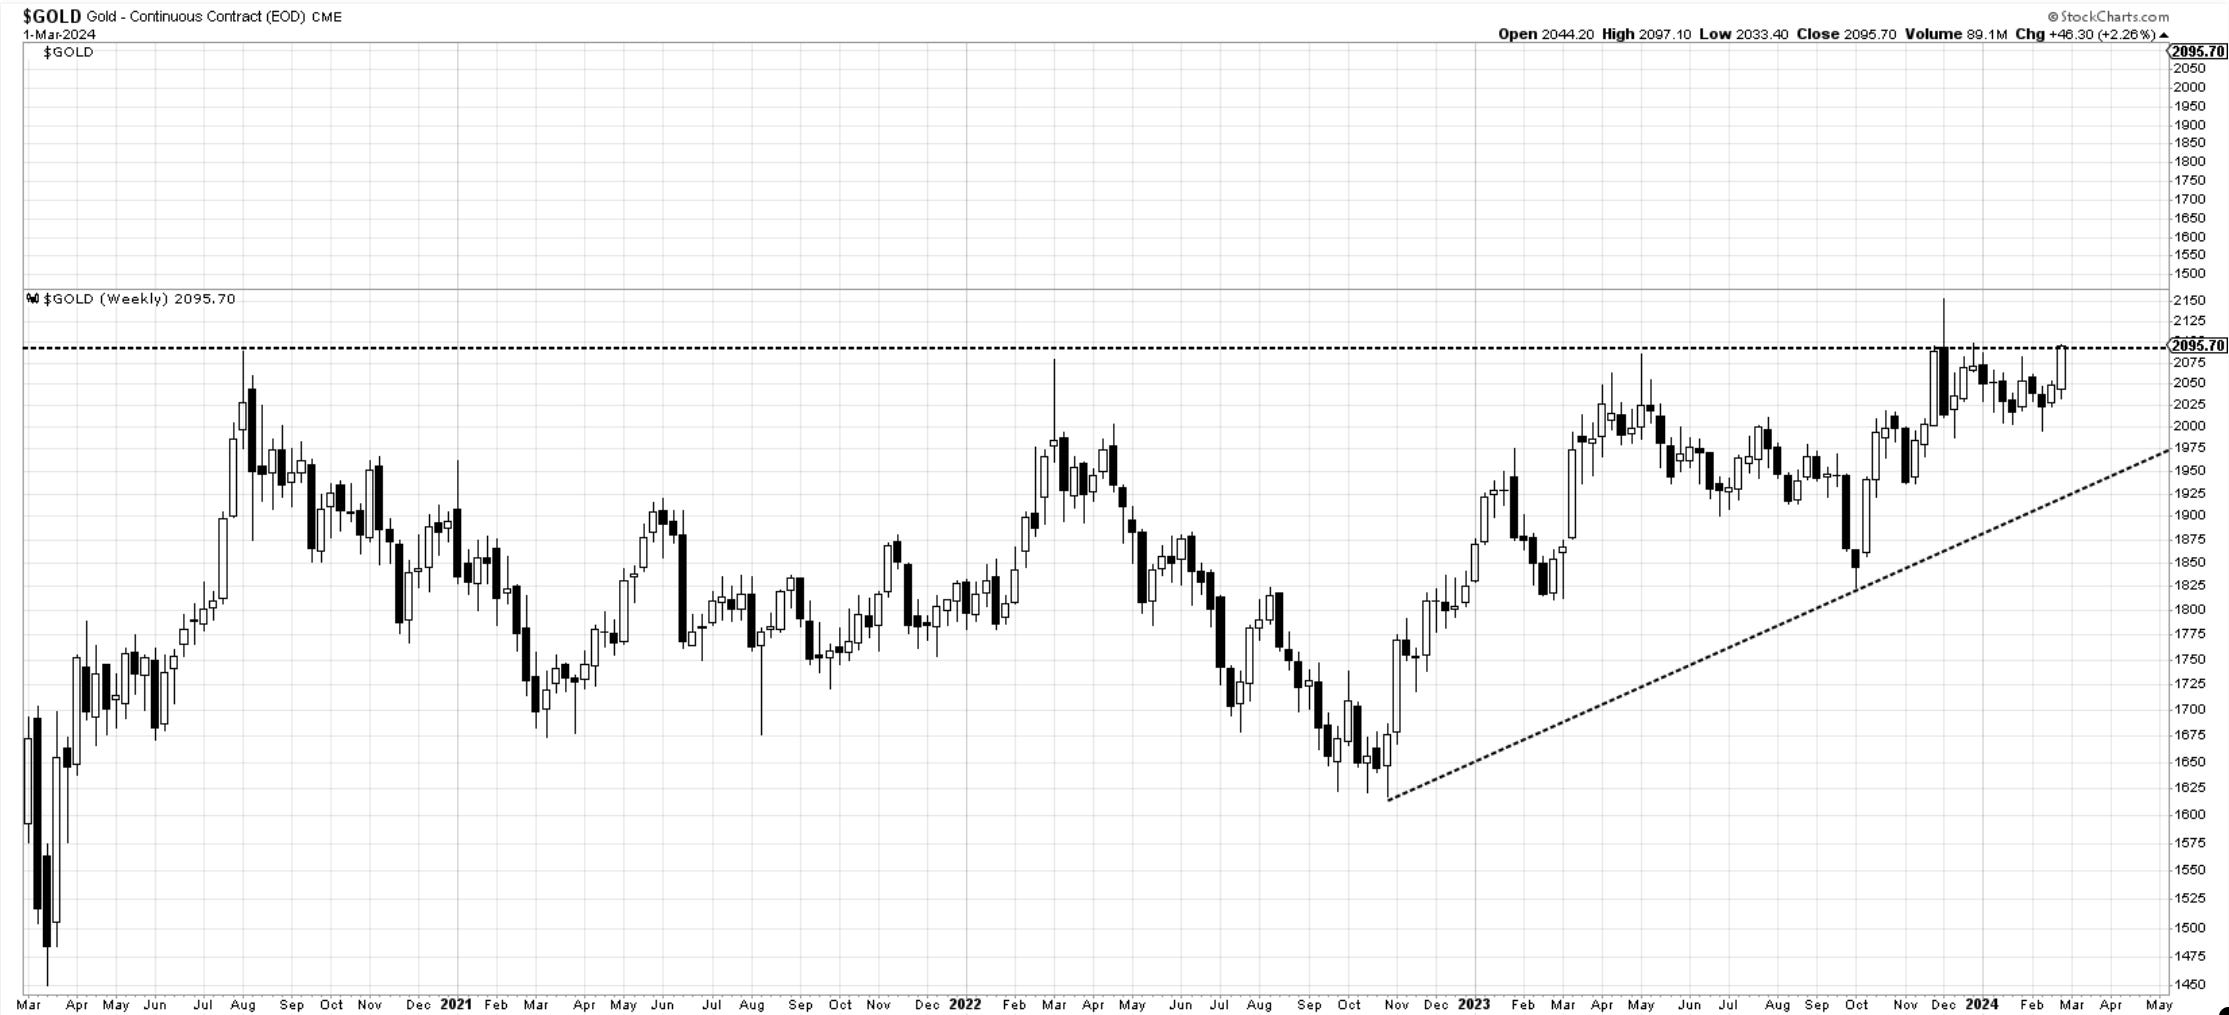
Gold - has now made a new all-time closing high at 2,095.70. I would take this as a very bullish development that has the potential to move the yellow metal towards 2200 and above. Would love to see follow thru next week.
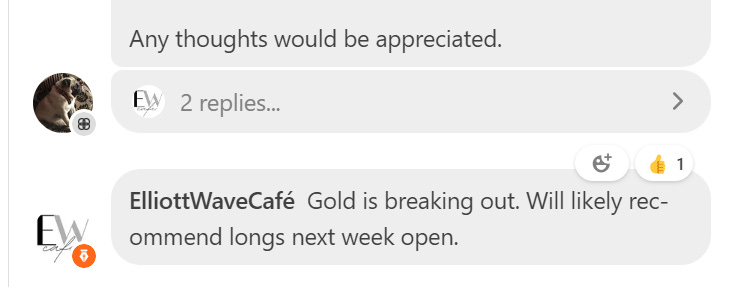
From our chat room notes below…
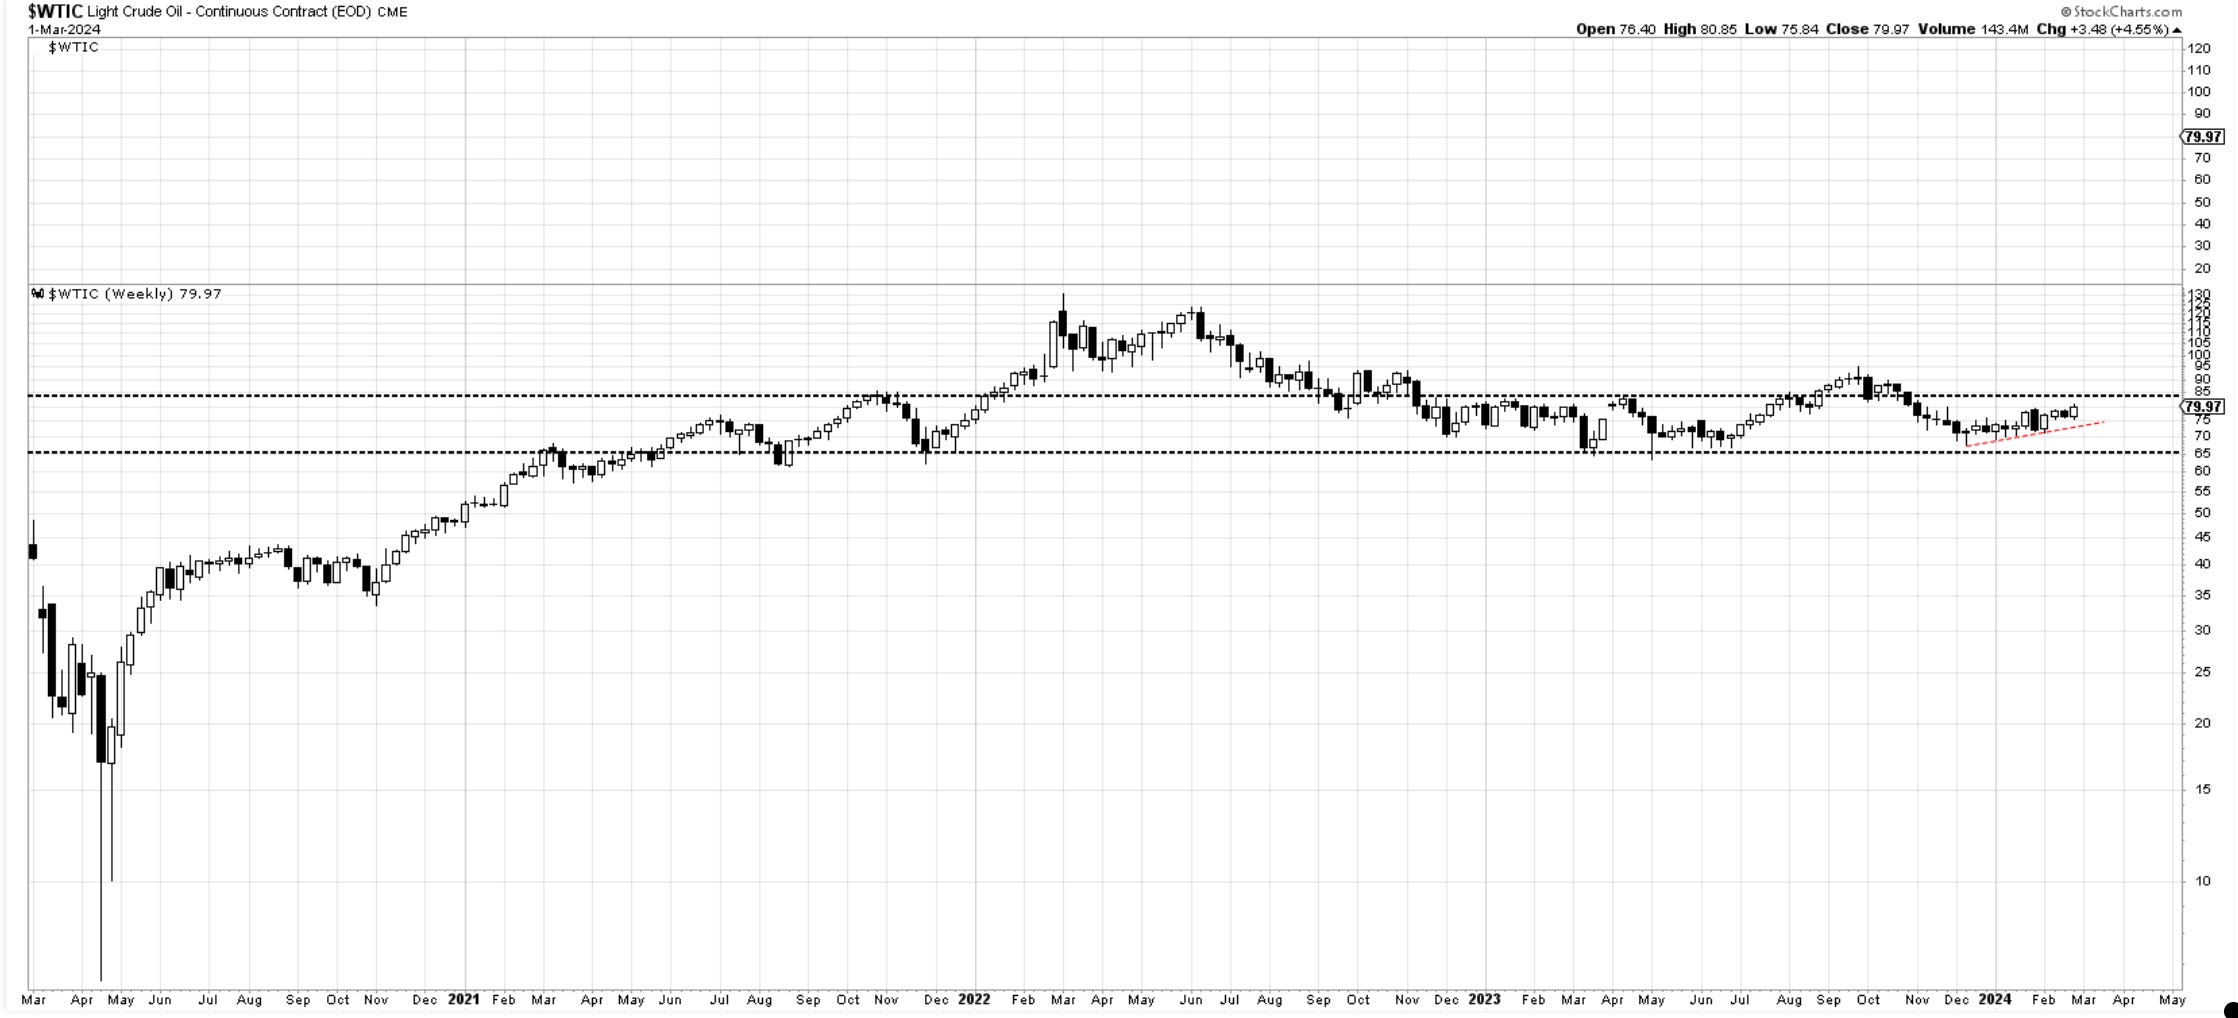
OIL - has made a decent close this week, one that is encouraging for a break above 84. I am still neutral on this at the moment.
Thank you all for reading, I will see you next week. Leave a comment or suggestion below. Join our chat to discuss markets with fellow traders.
In the meantime please consider subscribing to EWCafe and read “The Daily Drip” where I provide daily market updates, videos and commentary on core markets.
Cris,
EWCafe