
Weekly market review
A technical look at weekly trends in core markets.

This weekly report is free. For those who want our daily written and video reports, check out the brand-new low-cost payment plans.
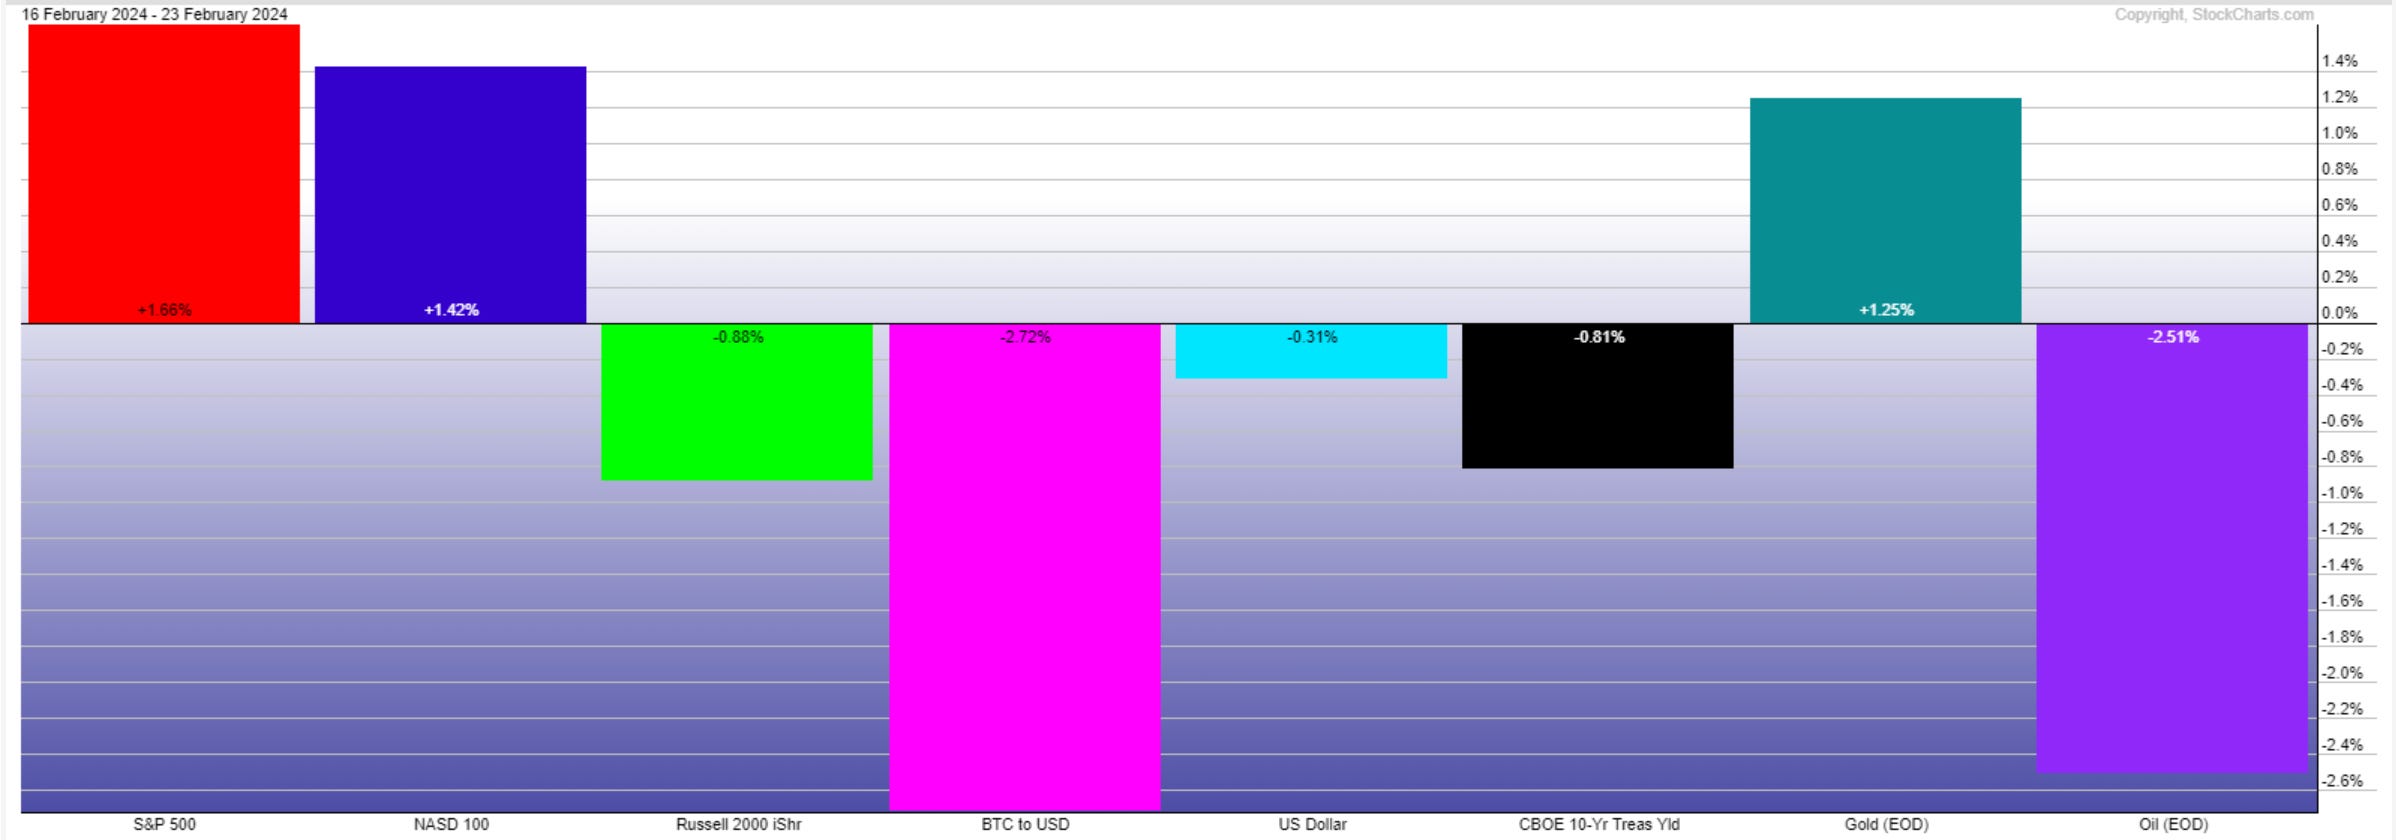
Market performance for the past week is below.
The clear winners were the large indices with continued breakouts, followed by a tease from Gold. BTC gave back some after last week’s strong performance. Probably just gathering steam ahead of the next leg higher. The dollar sat quietly in its corner and did not bother anybody, while OIL decided that a breakout was unnecessary at this stage. The small caps are unsure of their future and are waiting for a signal from yields to pick a direction.
Sentiment
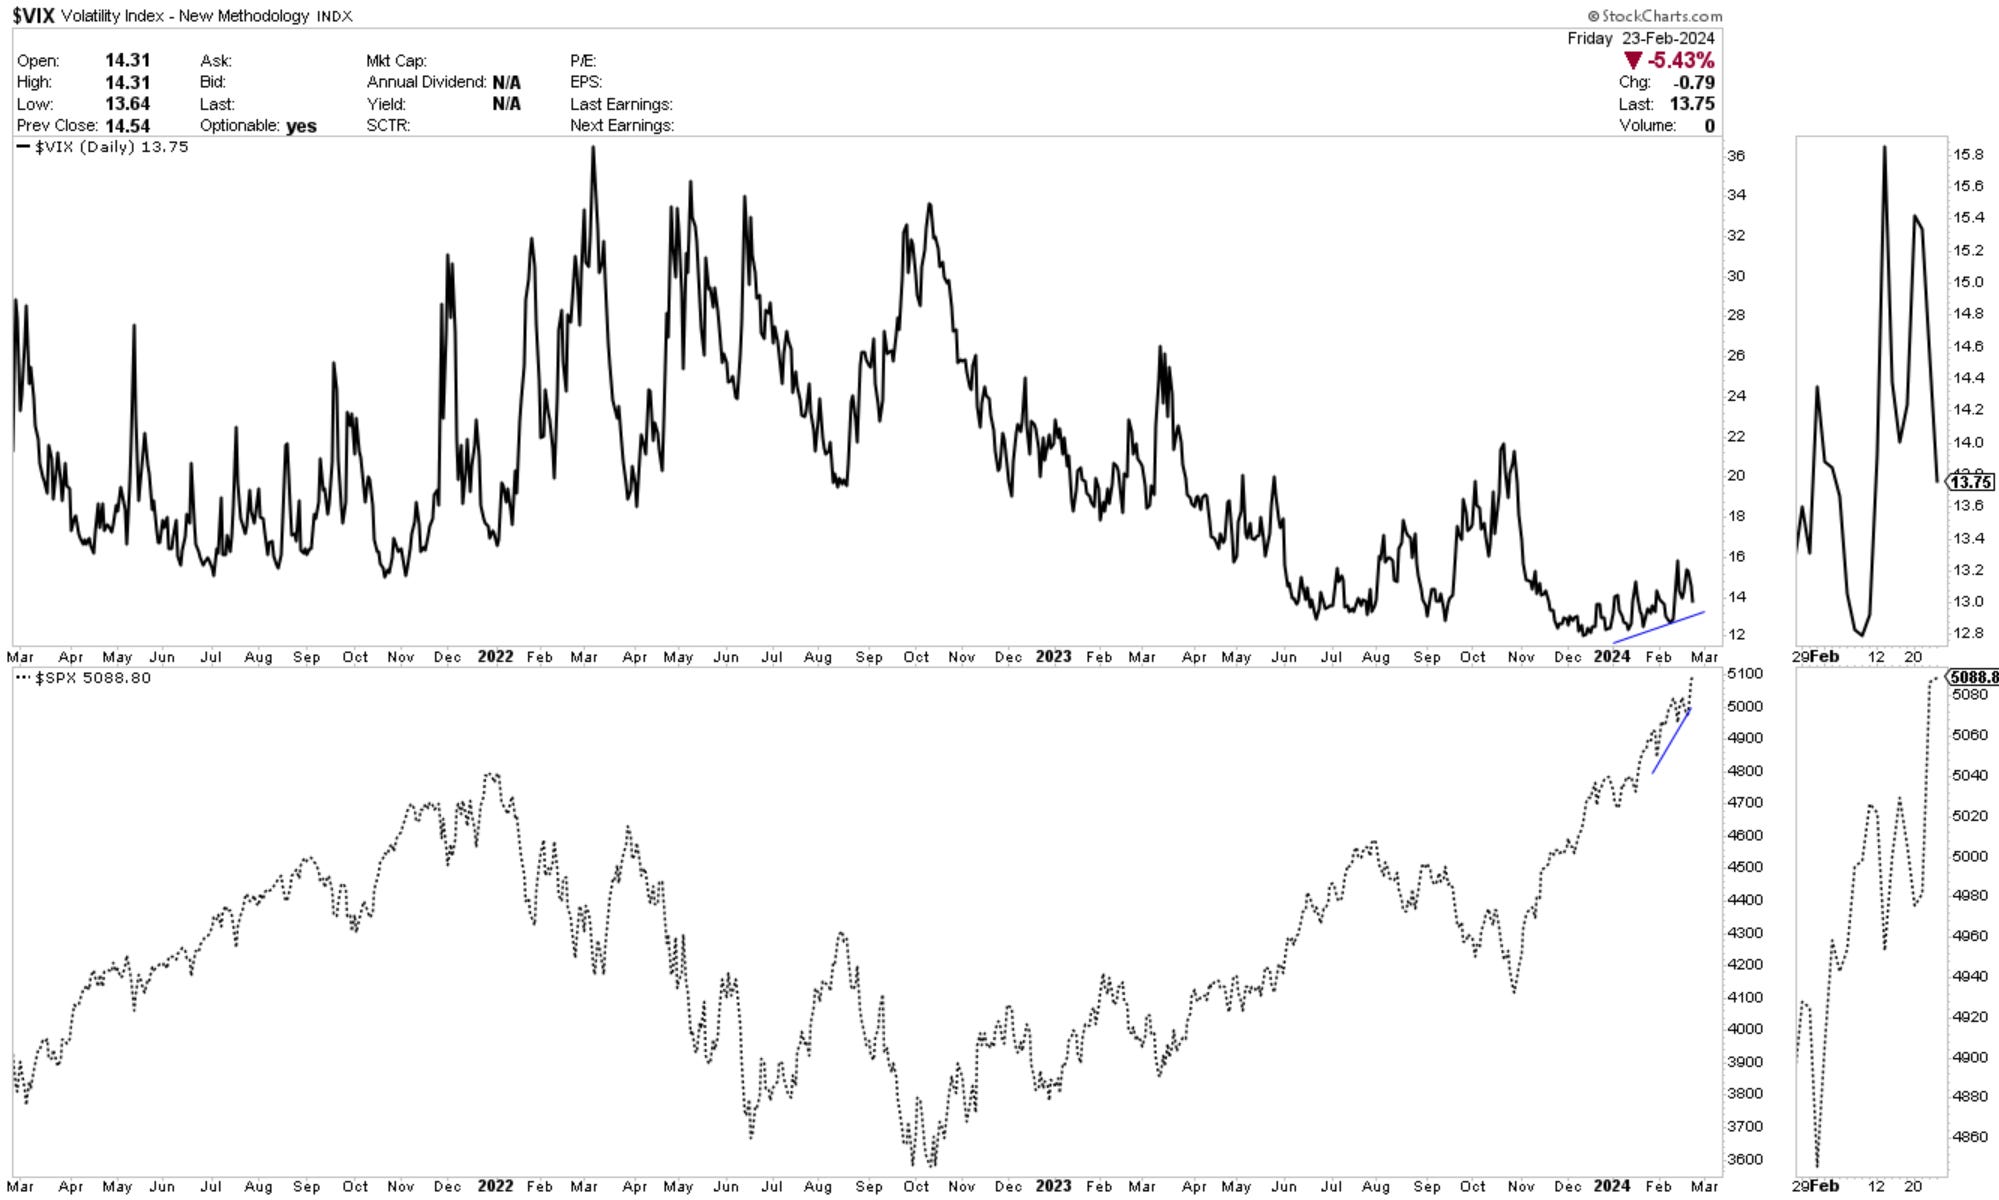
The VIX dropped to a higher low as the market continued to advance. There continues to be a small divergence between the elevating pricing of options and the market, but that has yet to deter the stregth of the trend. A vix above 16 would slow us down but markets are content at the moment.
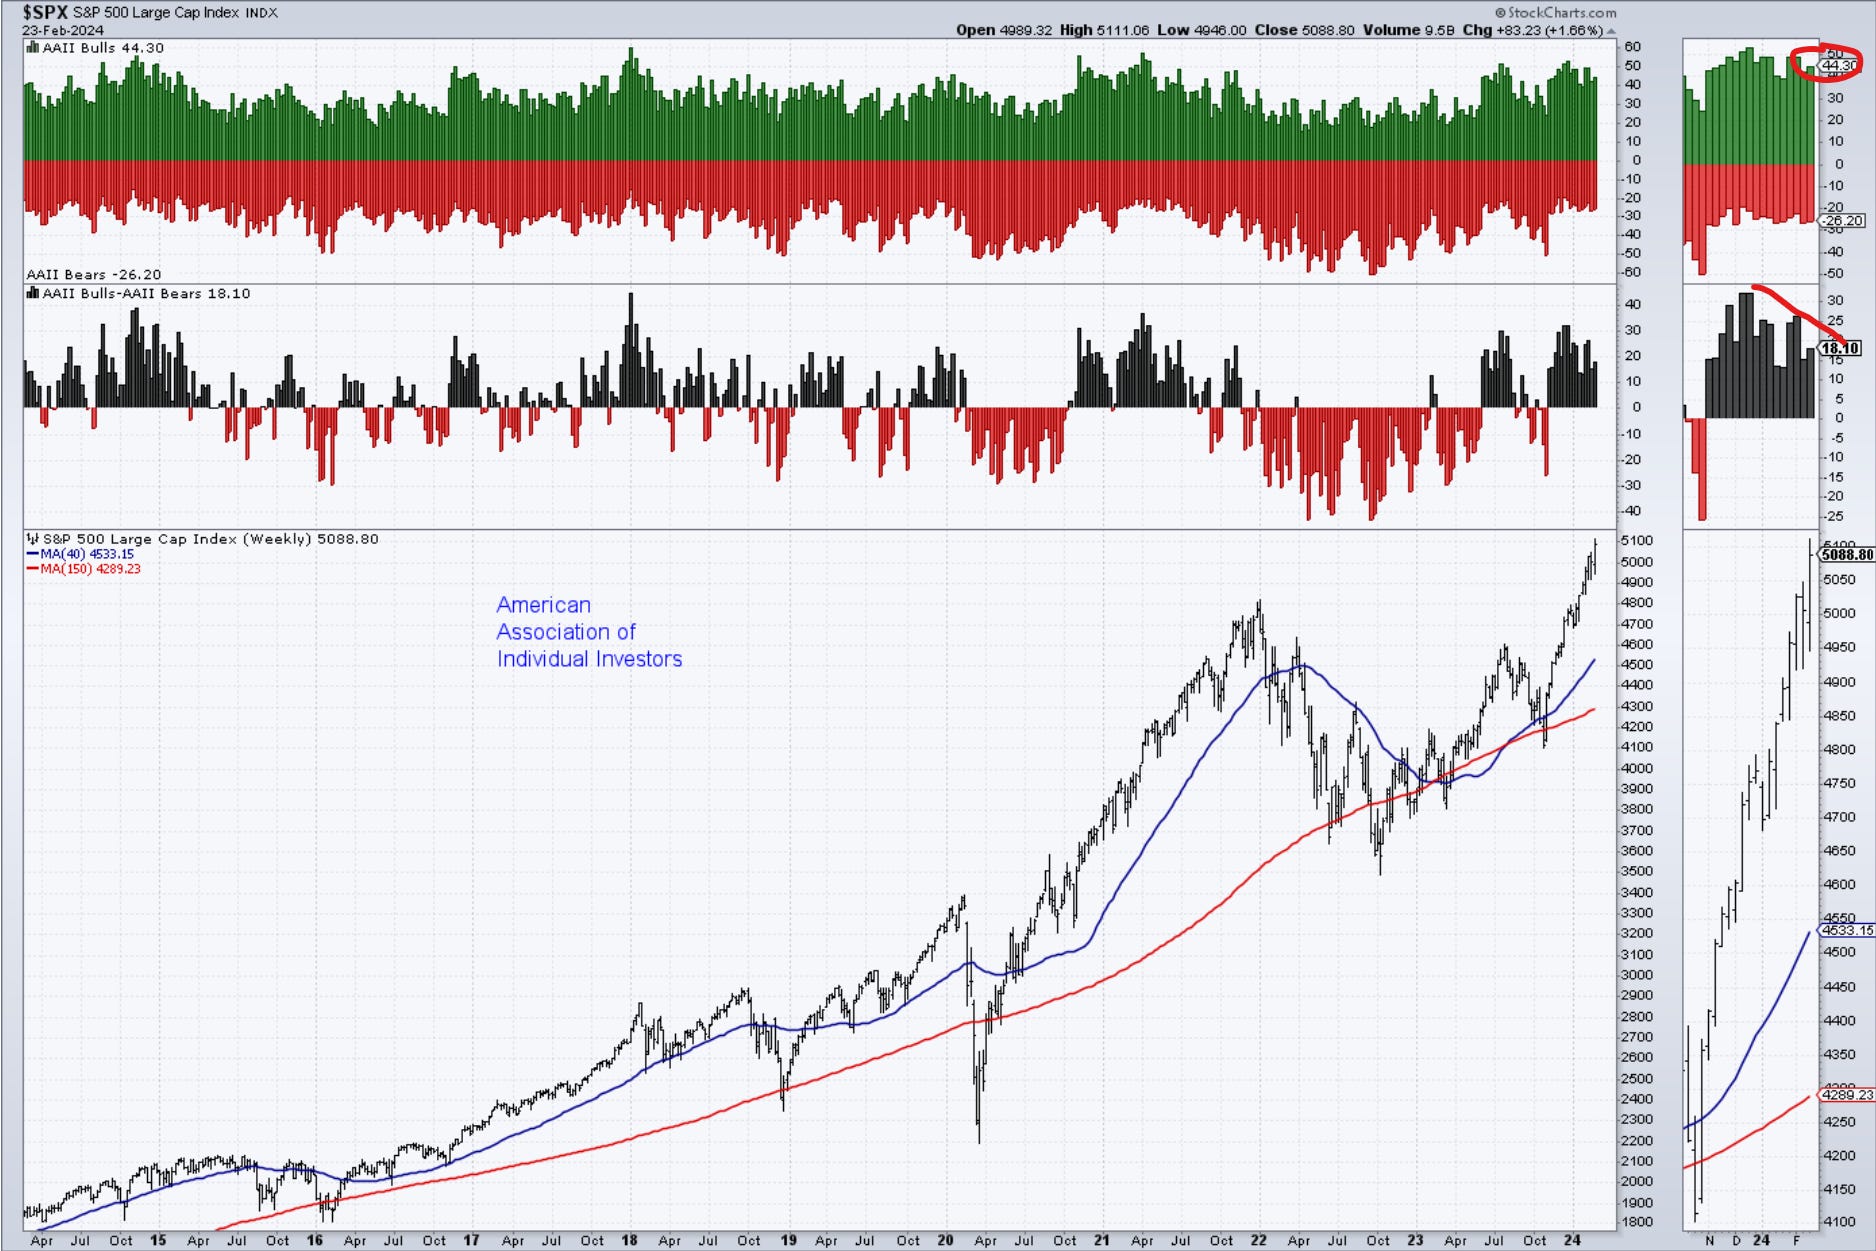
The AAII shows a slight elevation in the bullish sentiment at a declining pace since mid December. For reference, check out the April 2021 top in AAII and its behavior following that date. Notice how the market continued to rise for about 40 weeks before an actual market top was found. In conclusion, the deterioration or improvemnt in sentiment can take time to unfold, and one should not rely solely on this to form an opinion on the market.
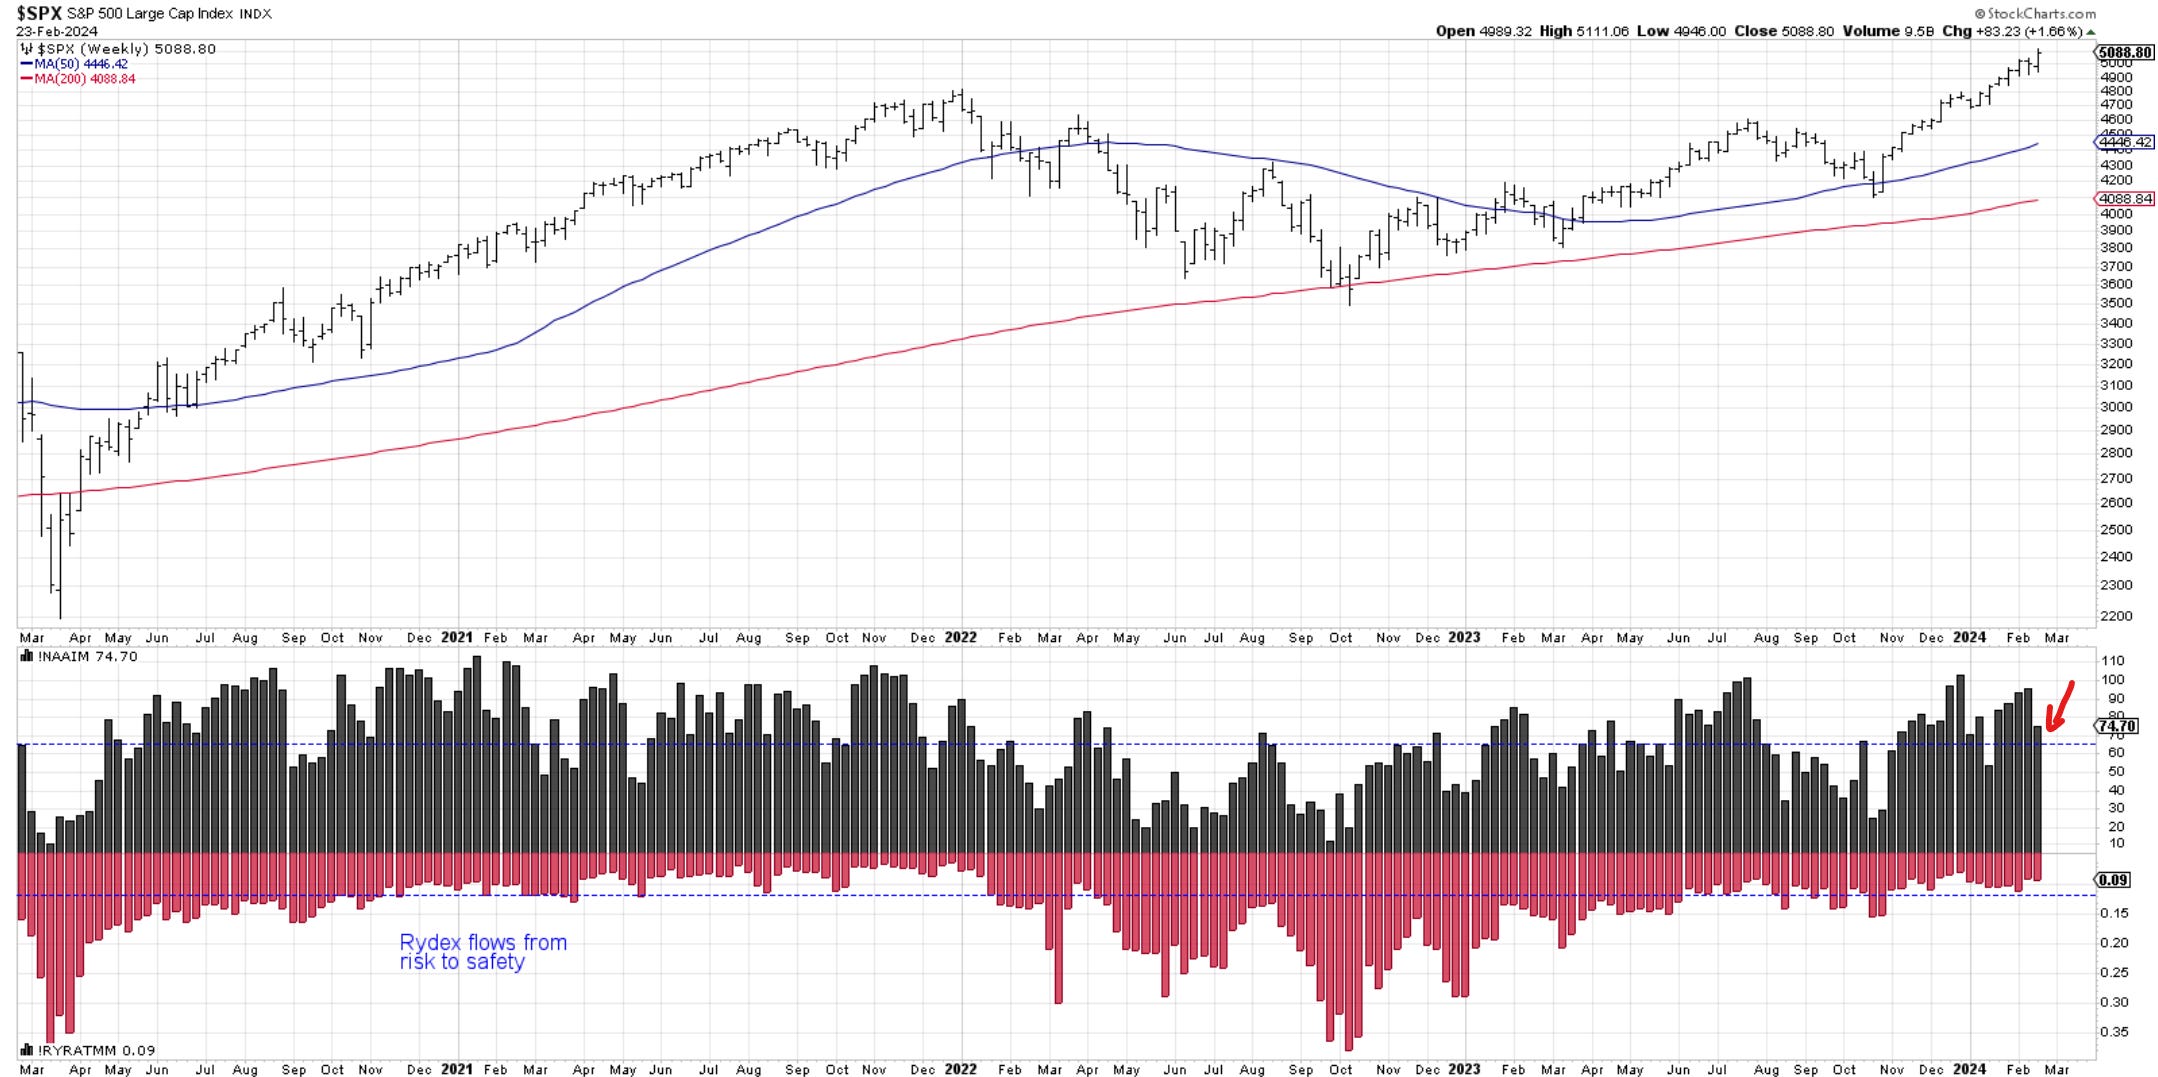
The Investment managers had a pretty significant reduction in market exposure this week. From 95% exposure to 75%. However, since the data came before the market breakout, I would not be surprised to see them chase the price next week once again.
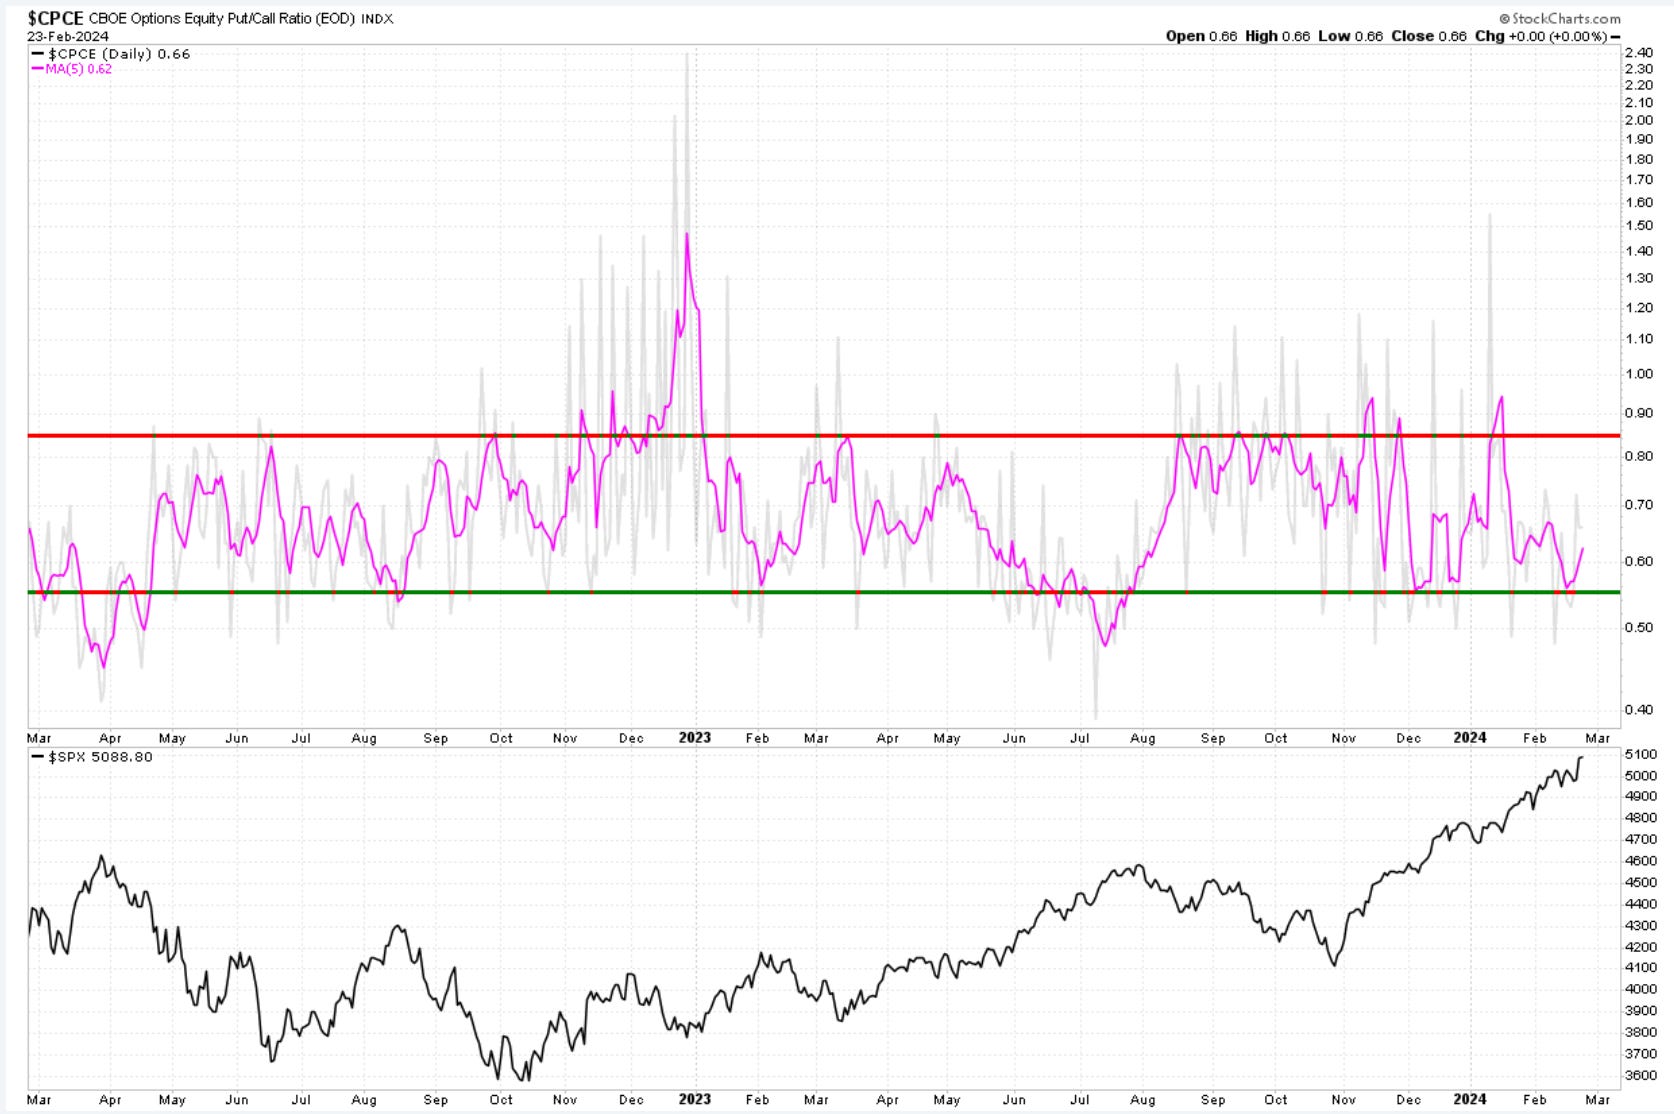
Put buyers have now slightly increased almost like saying they do not trust the breakout. We’re still at low levels, however, a place where call buying continues to be dominant.
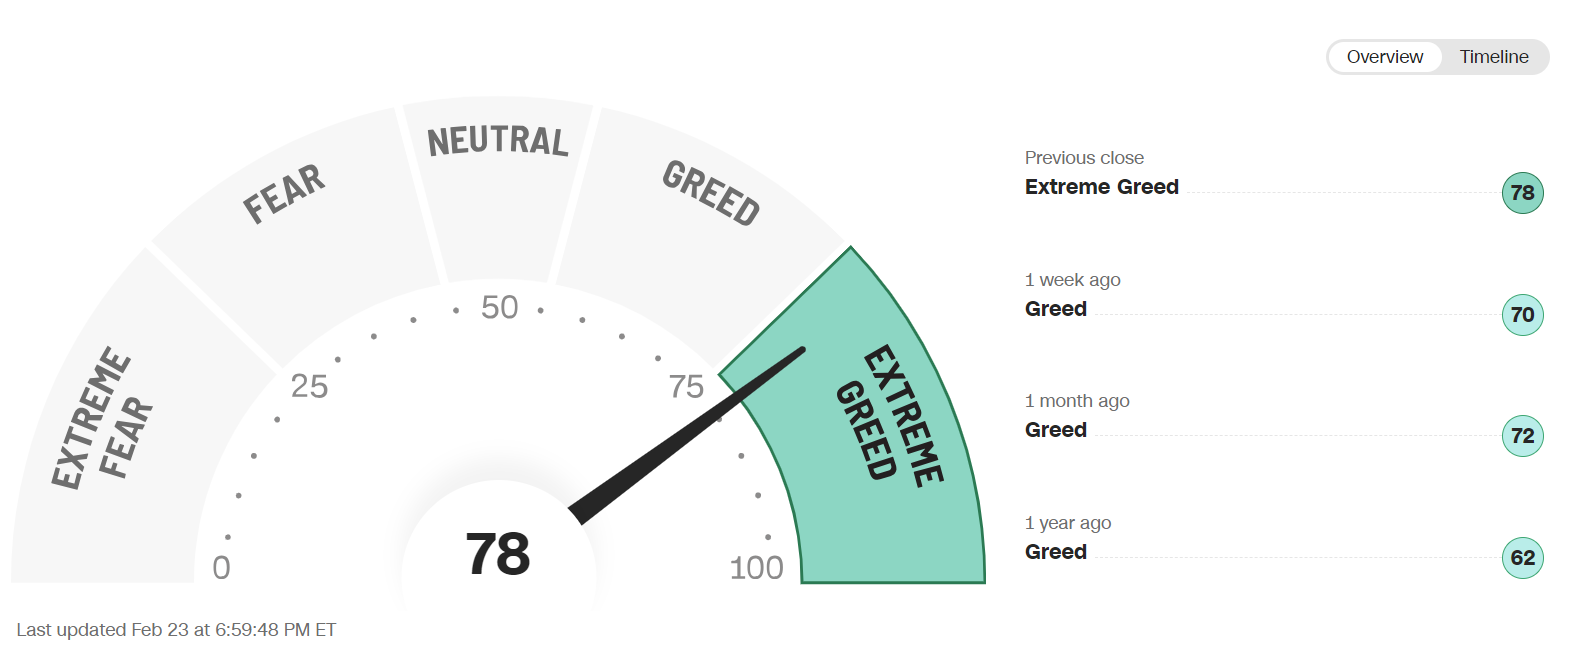
The sentiment section would not be complete without the CNN gauge of Fear vs Greed. One point higher than last week, it remains elevated but more to go until higher levels of excitement are hit.
Cycles
Note: cycles refer to time projections only not price projections.
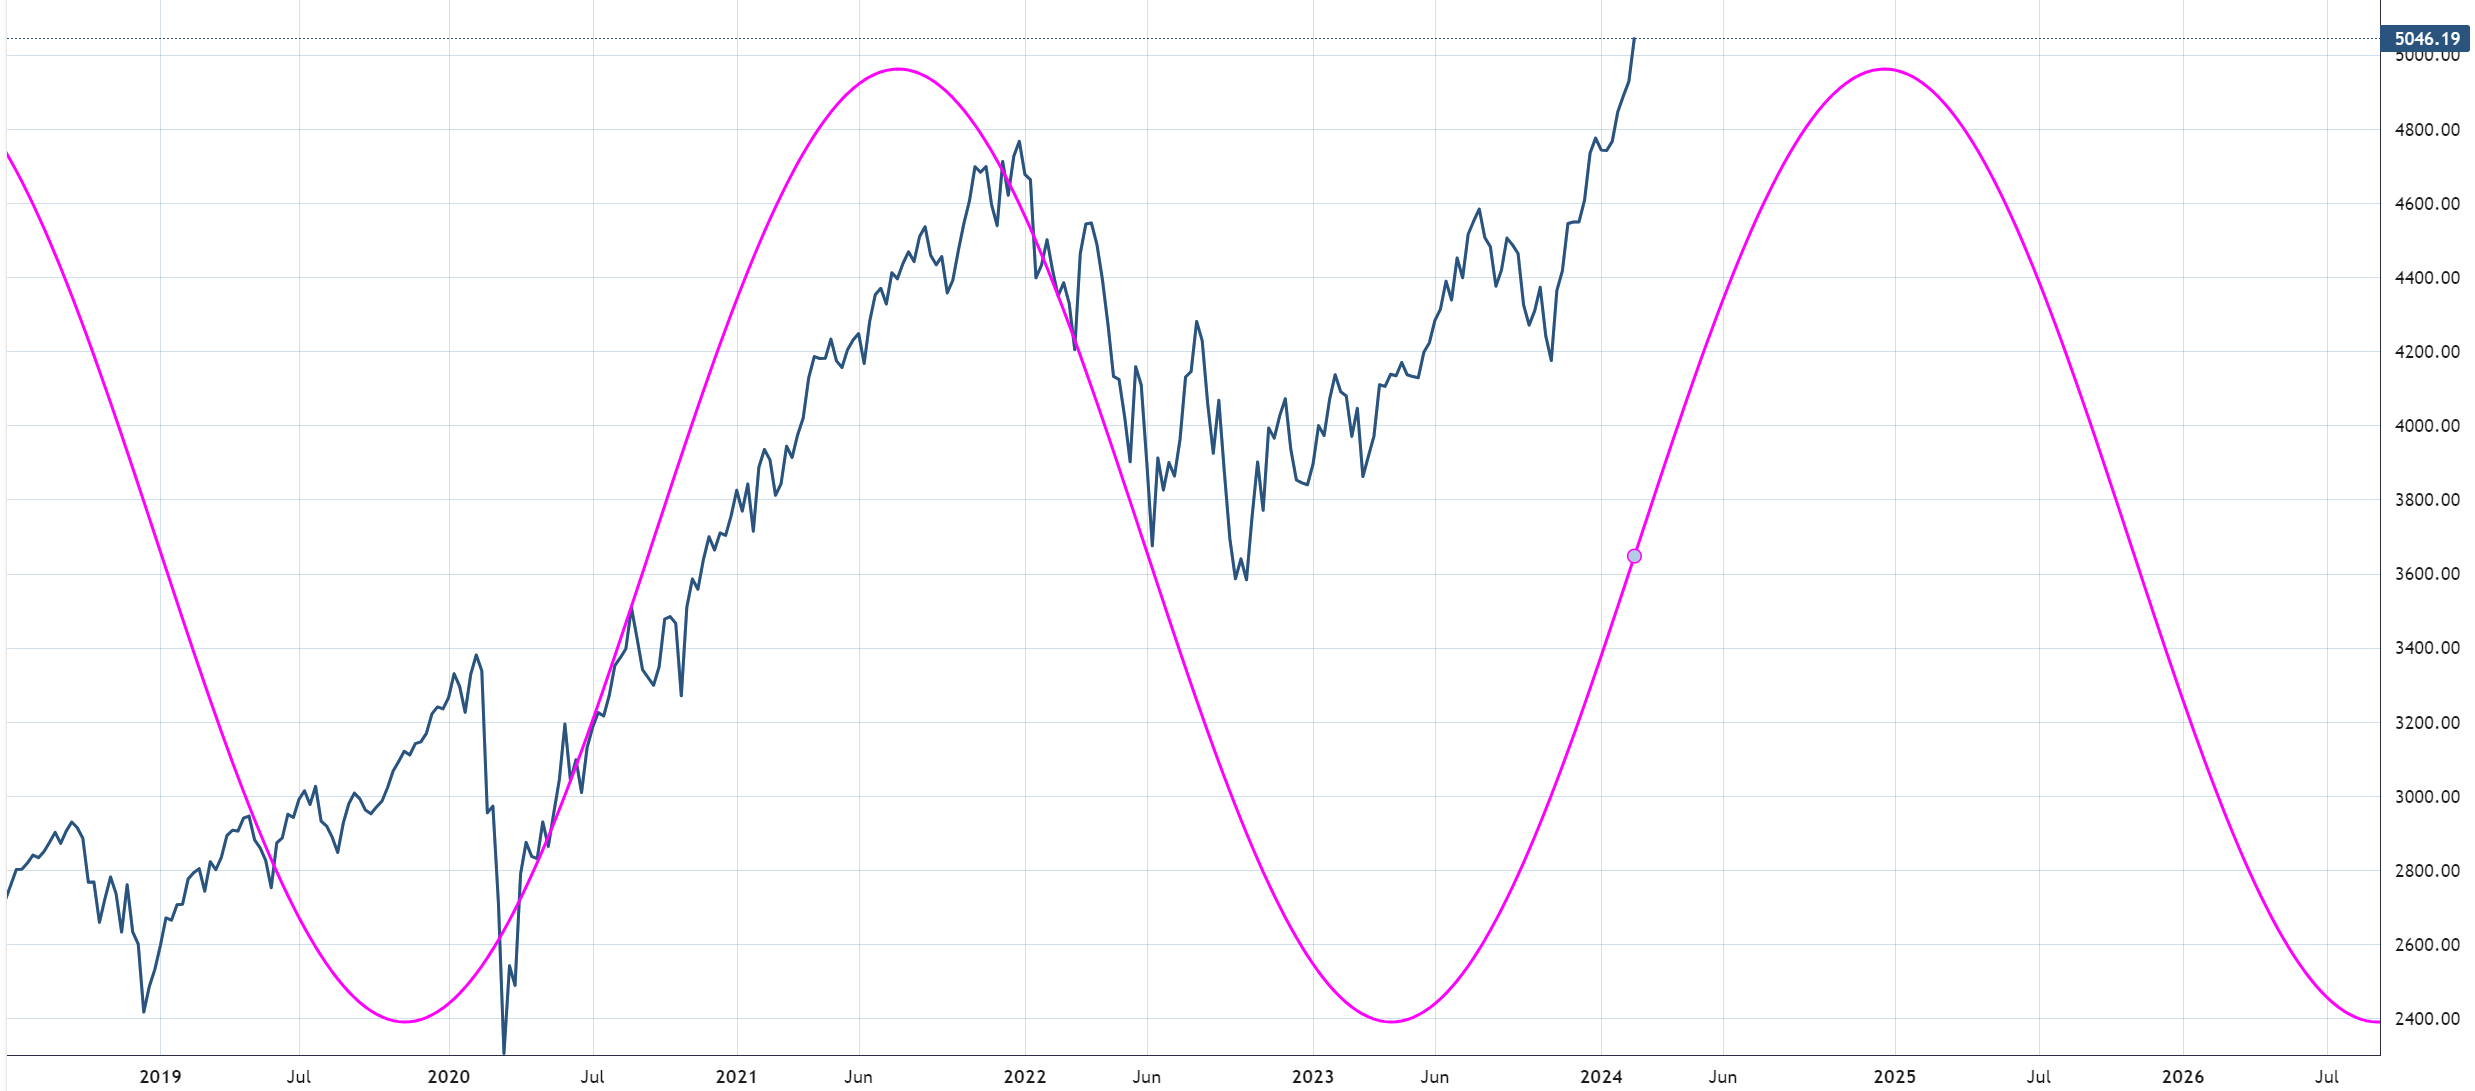
SP500 . The 180-day active weekly cycle continues to show an elevated market for the rest of the year. There is a daily swing cycle of around 125 days within this, which shows correction within this larger picture.
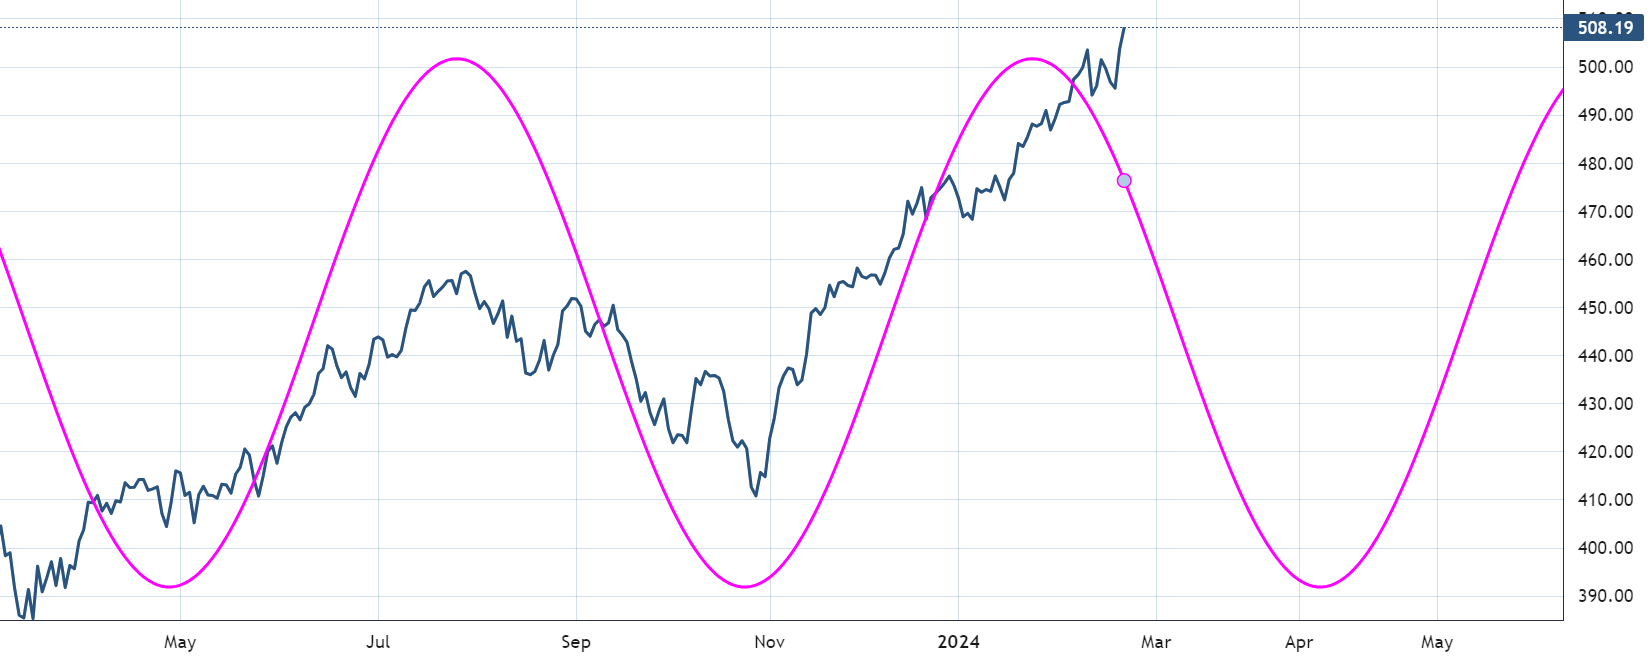
Here is the dominant daily cycle in the SPY, overdue for its corrective move into end of April.
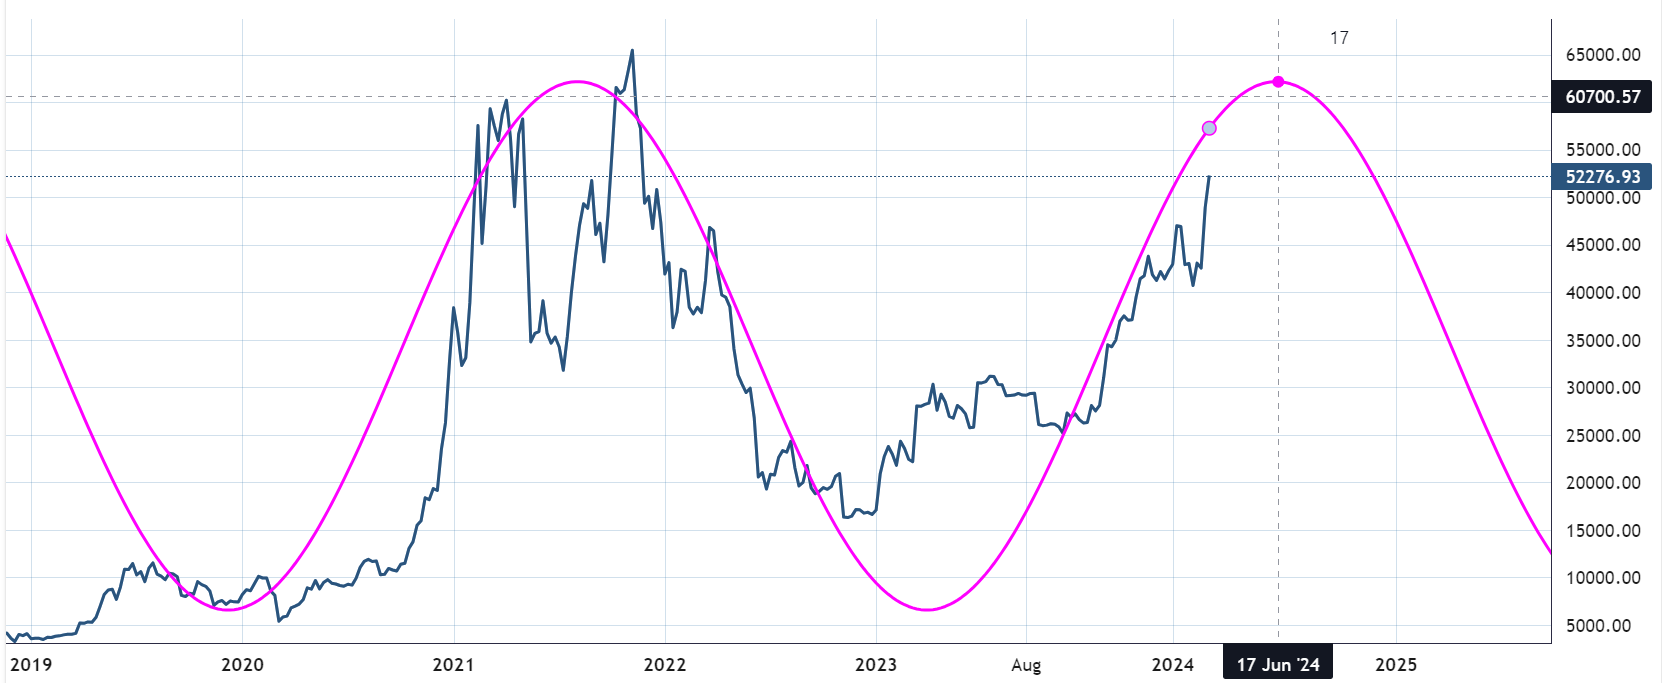
BTCUSD is at a 172-week active cycle and shows upward momentum to continue until roughly the summer of this year.
Breadth
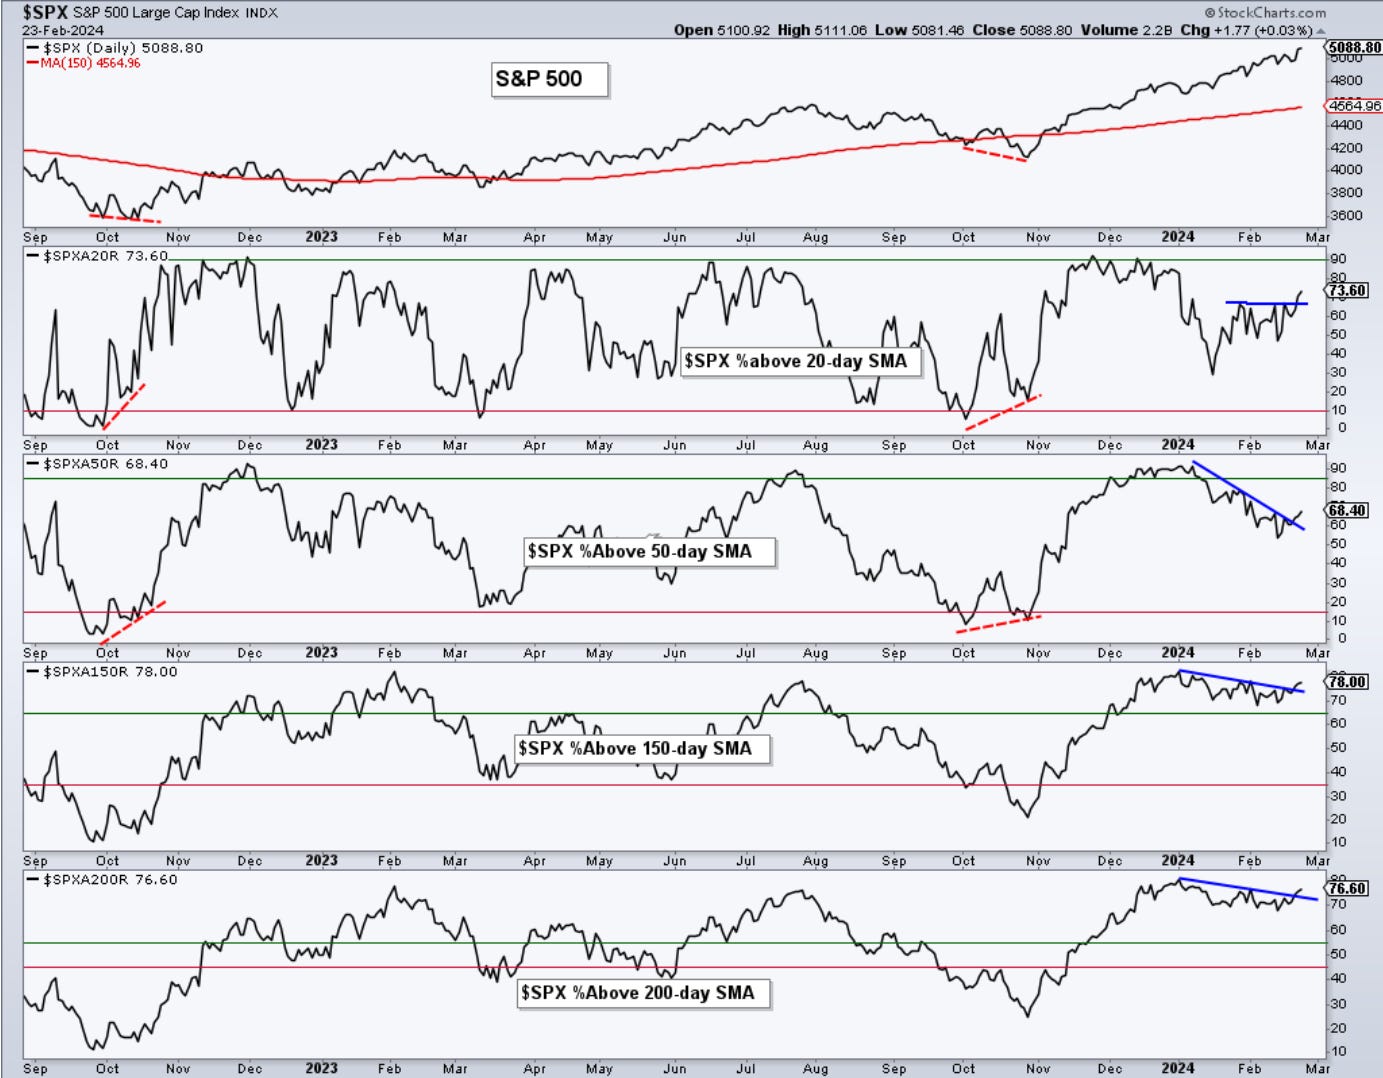
Here are percentages of stocks above key moving averages in the SP500.
It looks like we’re getting back to more participation and breaks above declining trends in breadth. 20day broke above 67%. It’s becoming harder to argue with a market that has over 75% of stocks above the 200day MA.
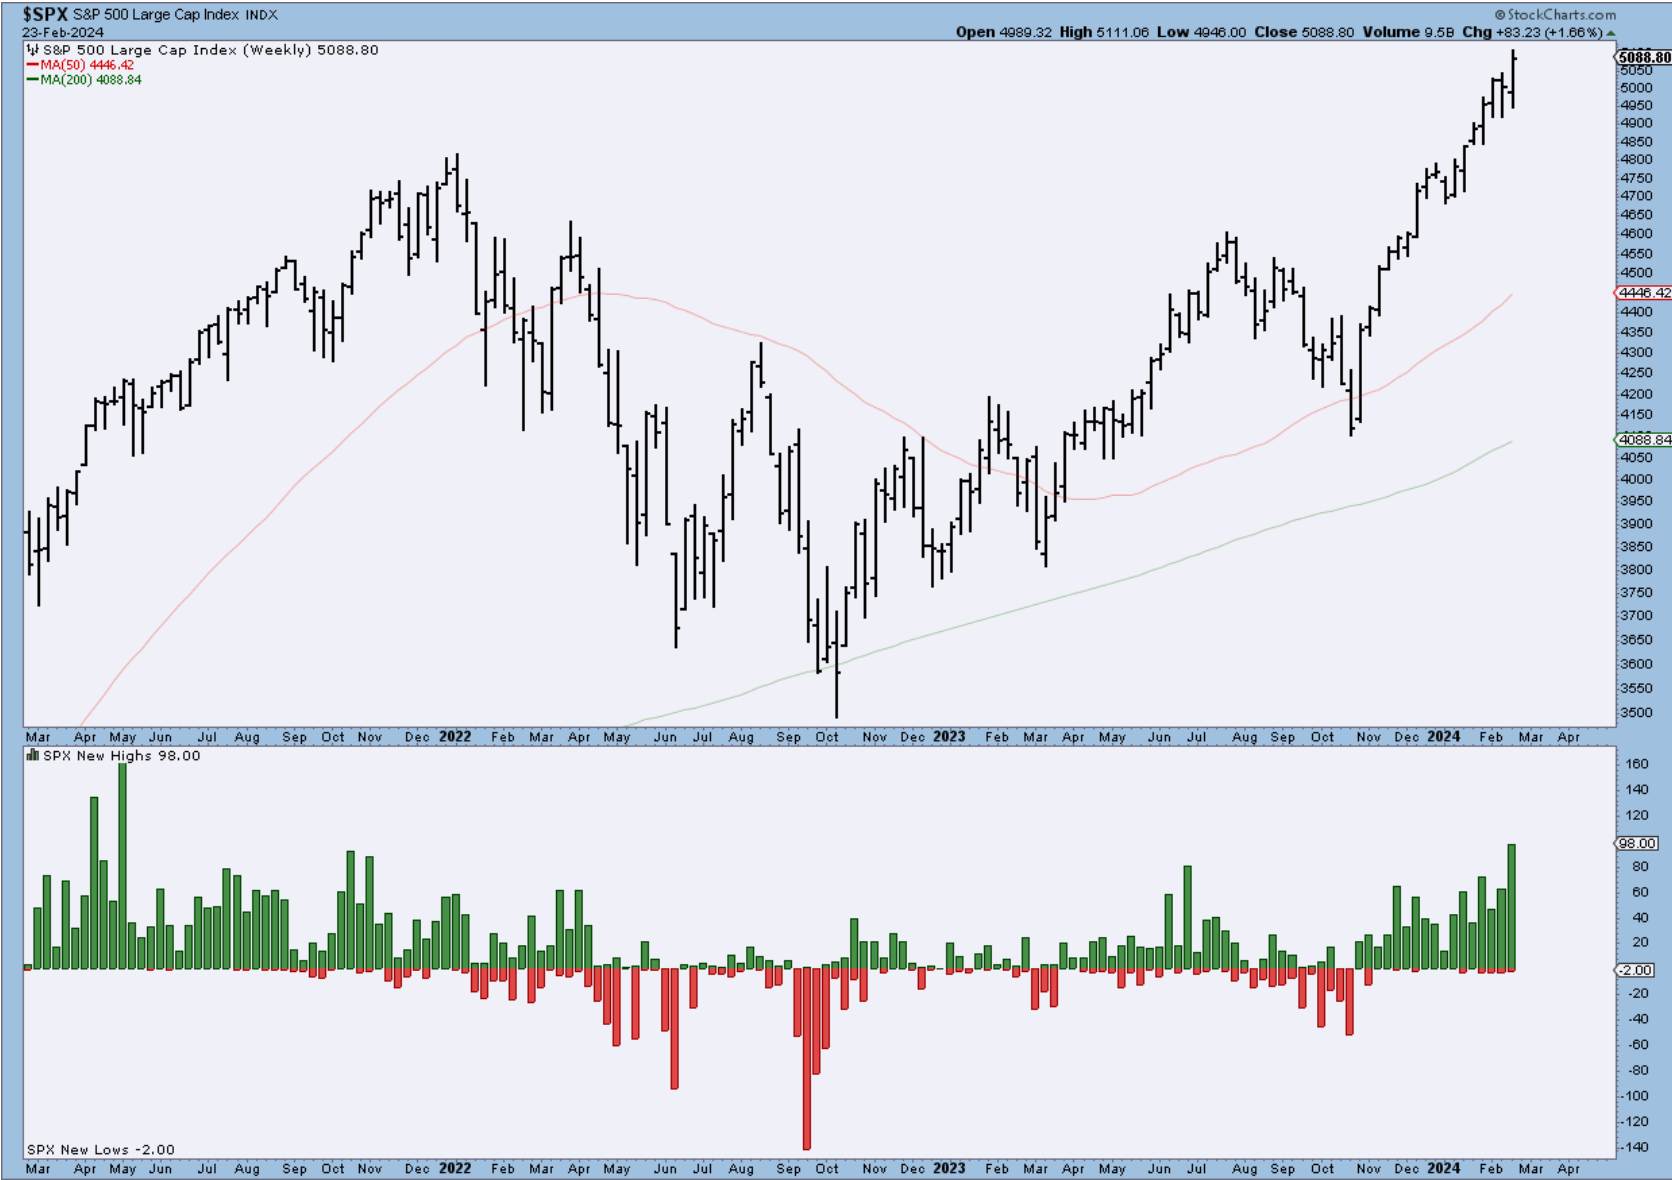
Strong new 52-week highs this week.
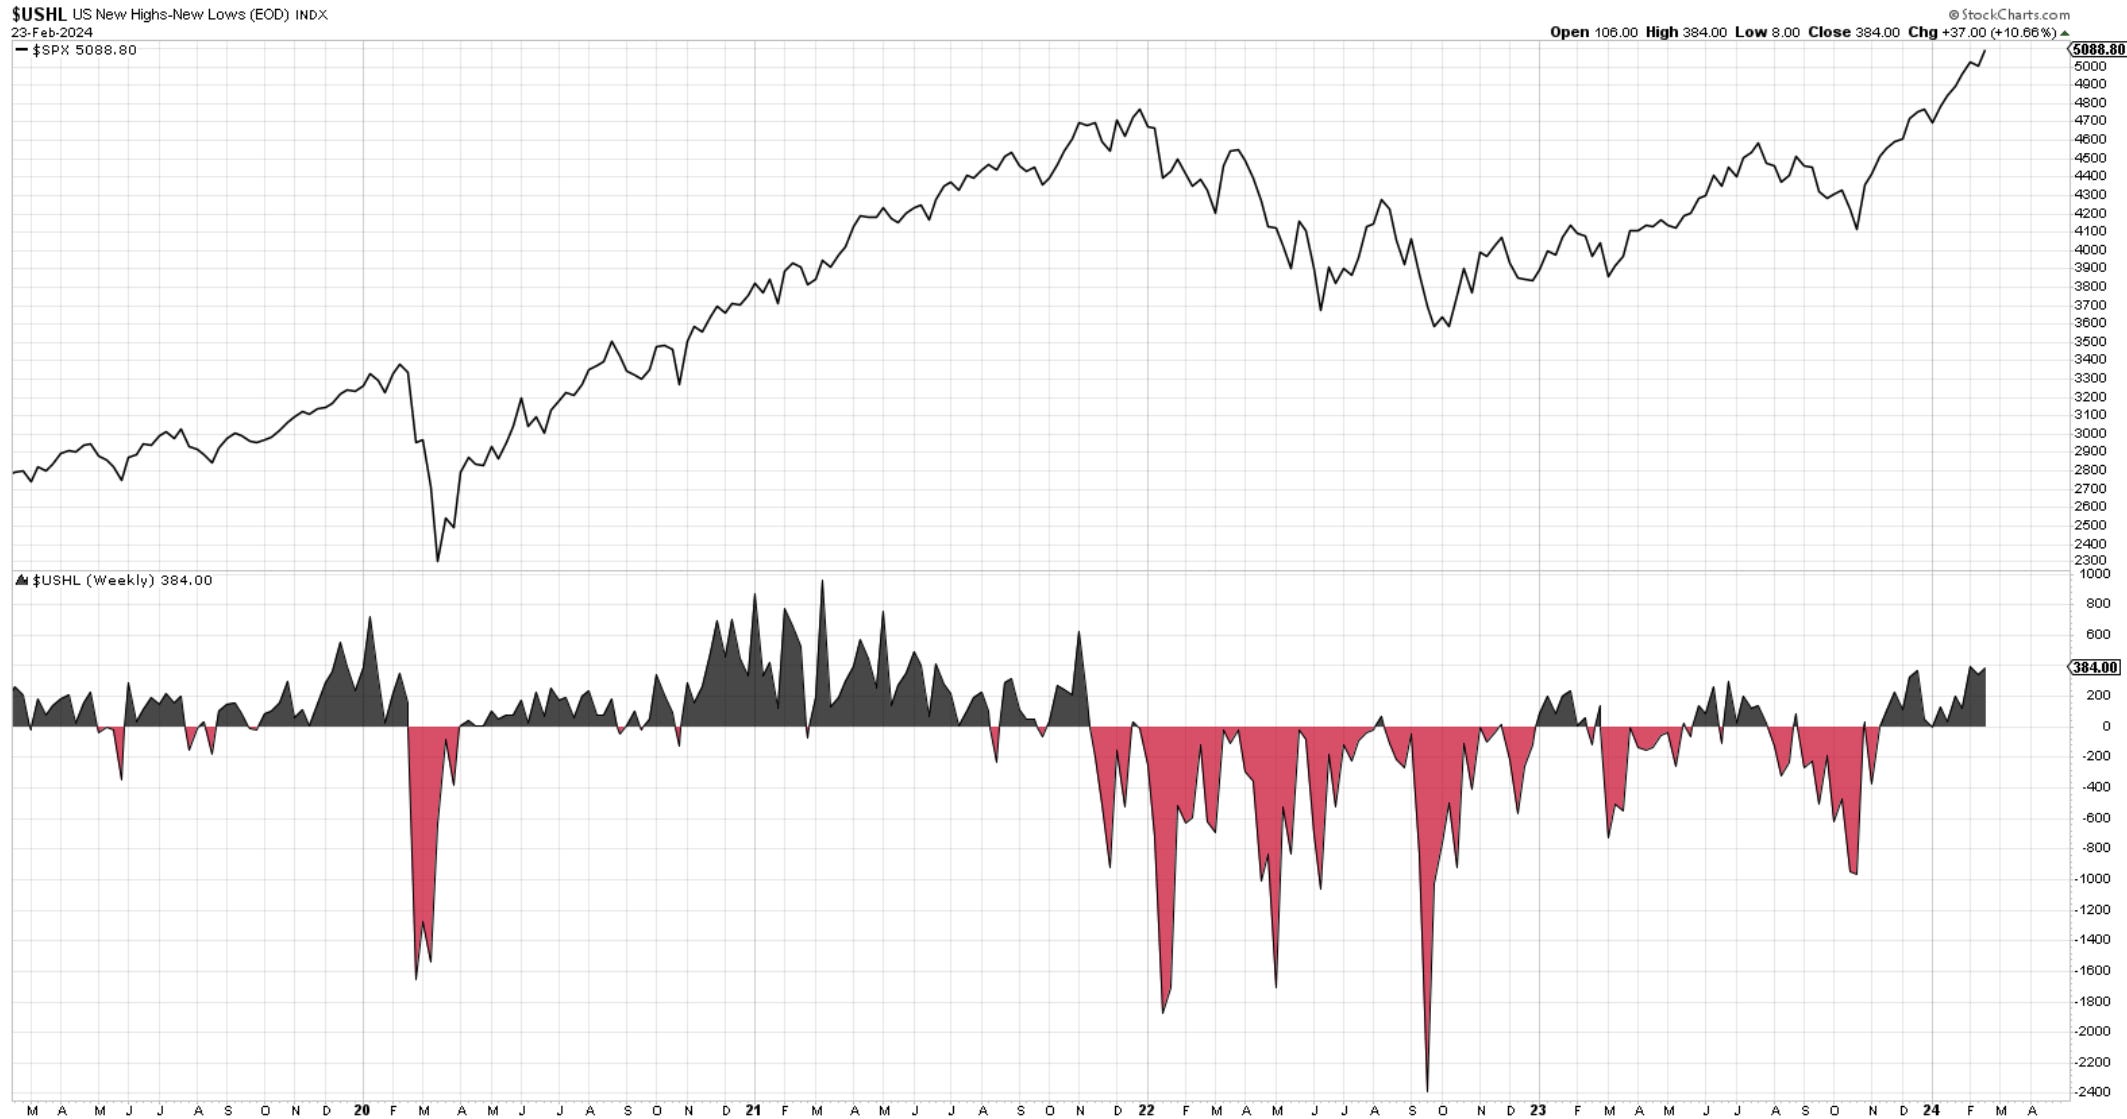
Here is the total US new highs vs new lows. Black is good, red is bad. If we compare it to 2021 ( and yes, we did have the money spigot turned on back then), we are halfway to those extremes.
The Bullish Percent Index is still threading water around the 65 mark. It came lower from extremes without the price of stocks budging much. Compare this with prior periods during the bear market and even during the first phase of this bull market and you can see that regime has changed. Trending prices do not provide many swings in this indicator.
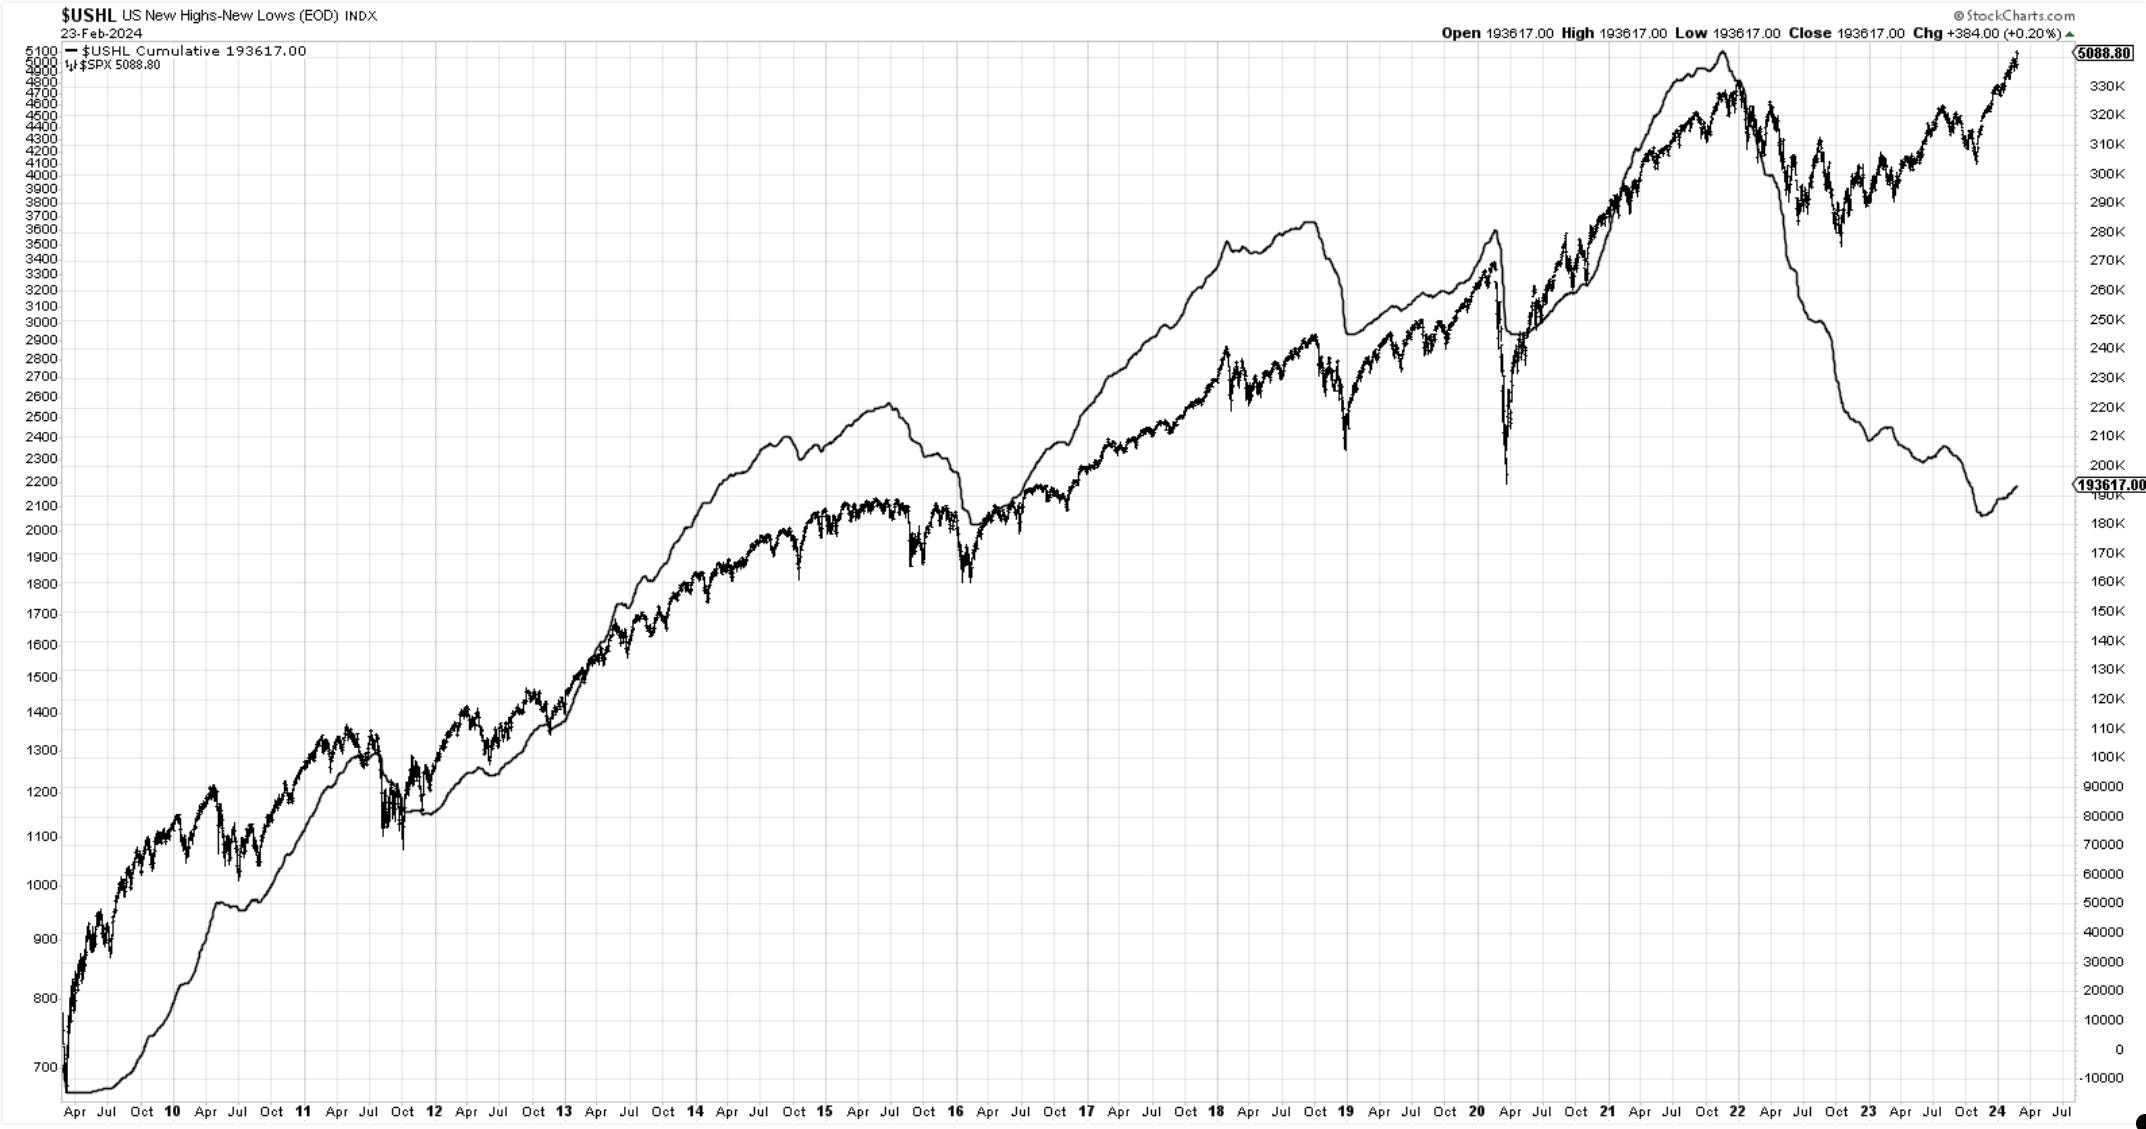
A very worrying sign is the cumulative chart of US new highs-new lows, showing a large discrepancy between how the SP500 behaves and the ability of the rest 2500 and more stocks to follow along. Notice how these lines have been pretty much sisters through time. Not the case since the Oct 2022 lows.
update - it has increased this week but remains notoriously low.
Seasonality
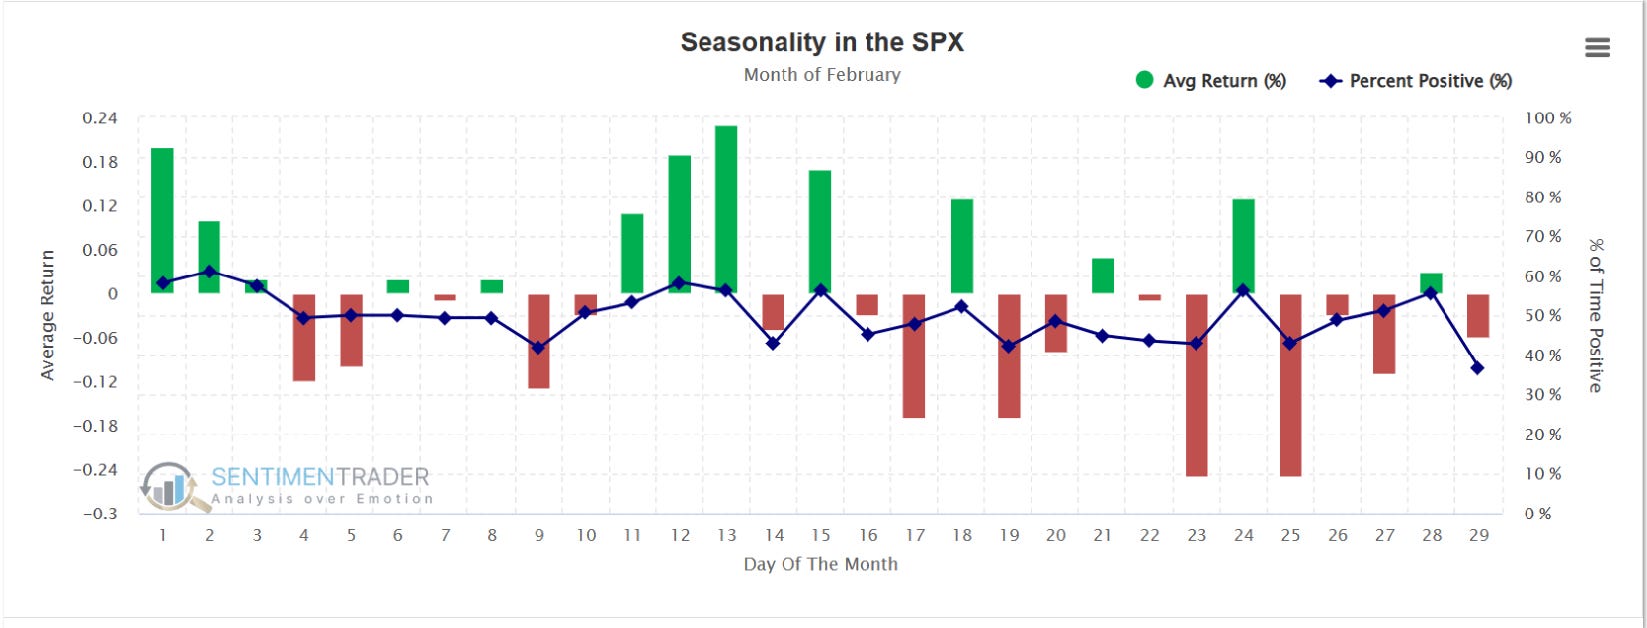
SP500. Here is the daily price action during the month of February. Notice it is heavily skewed towards a negative tape for the remainder of the month.
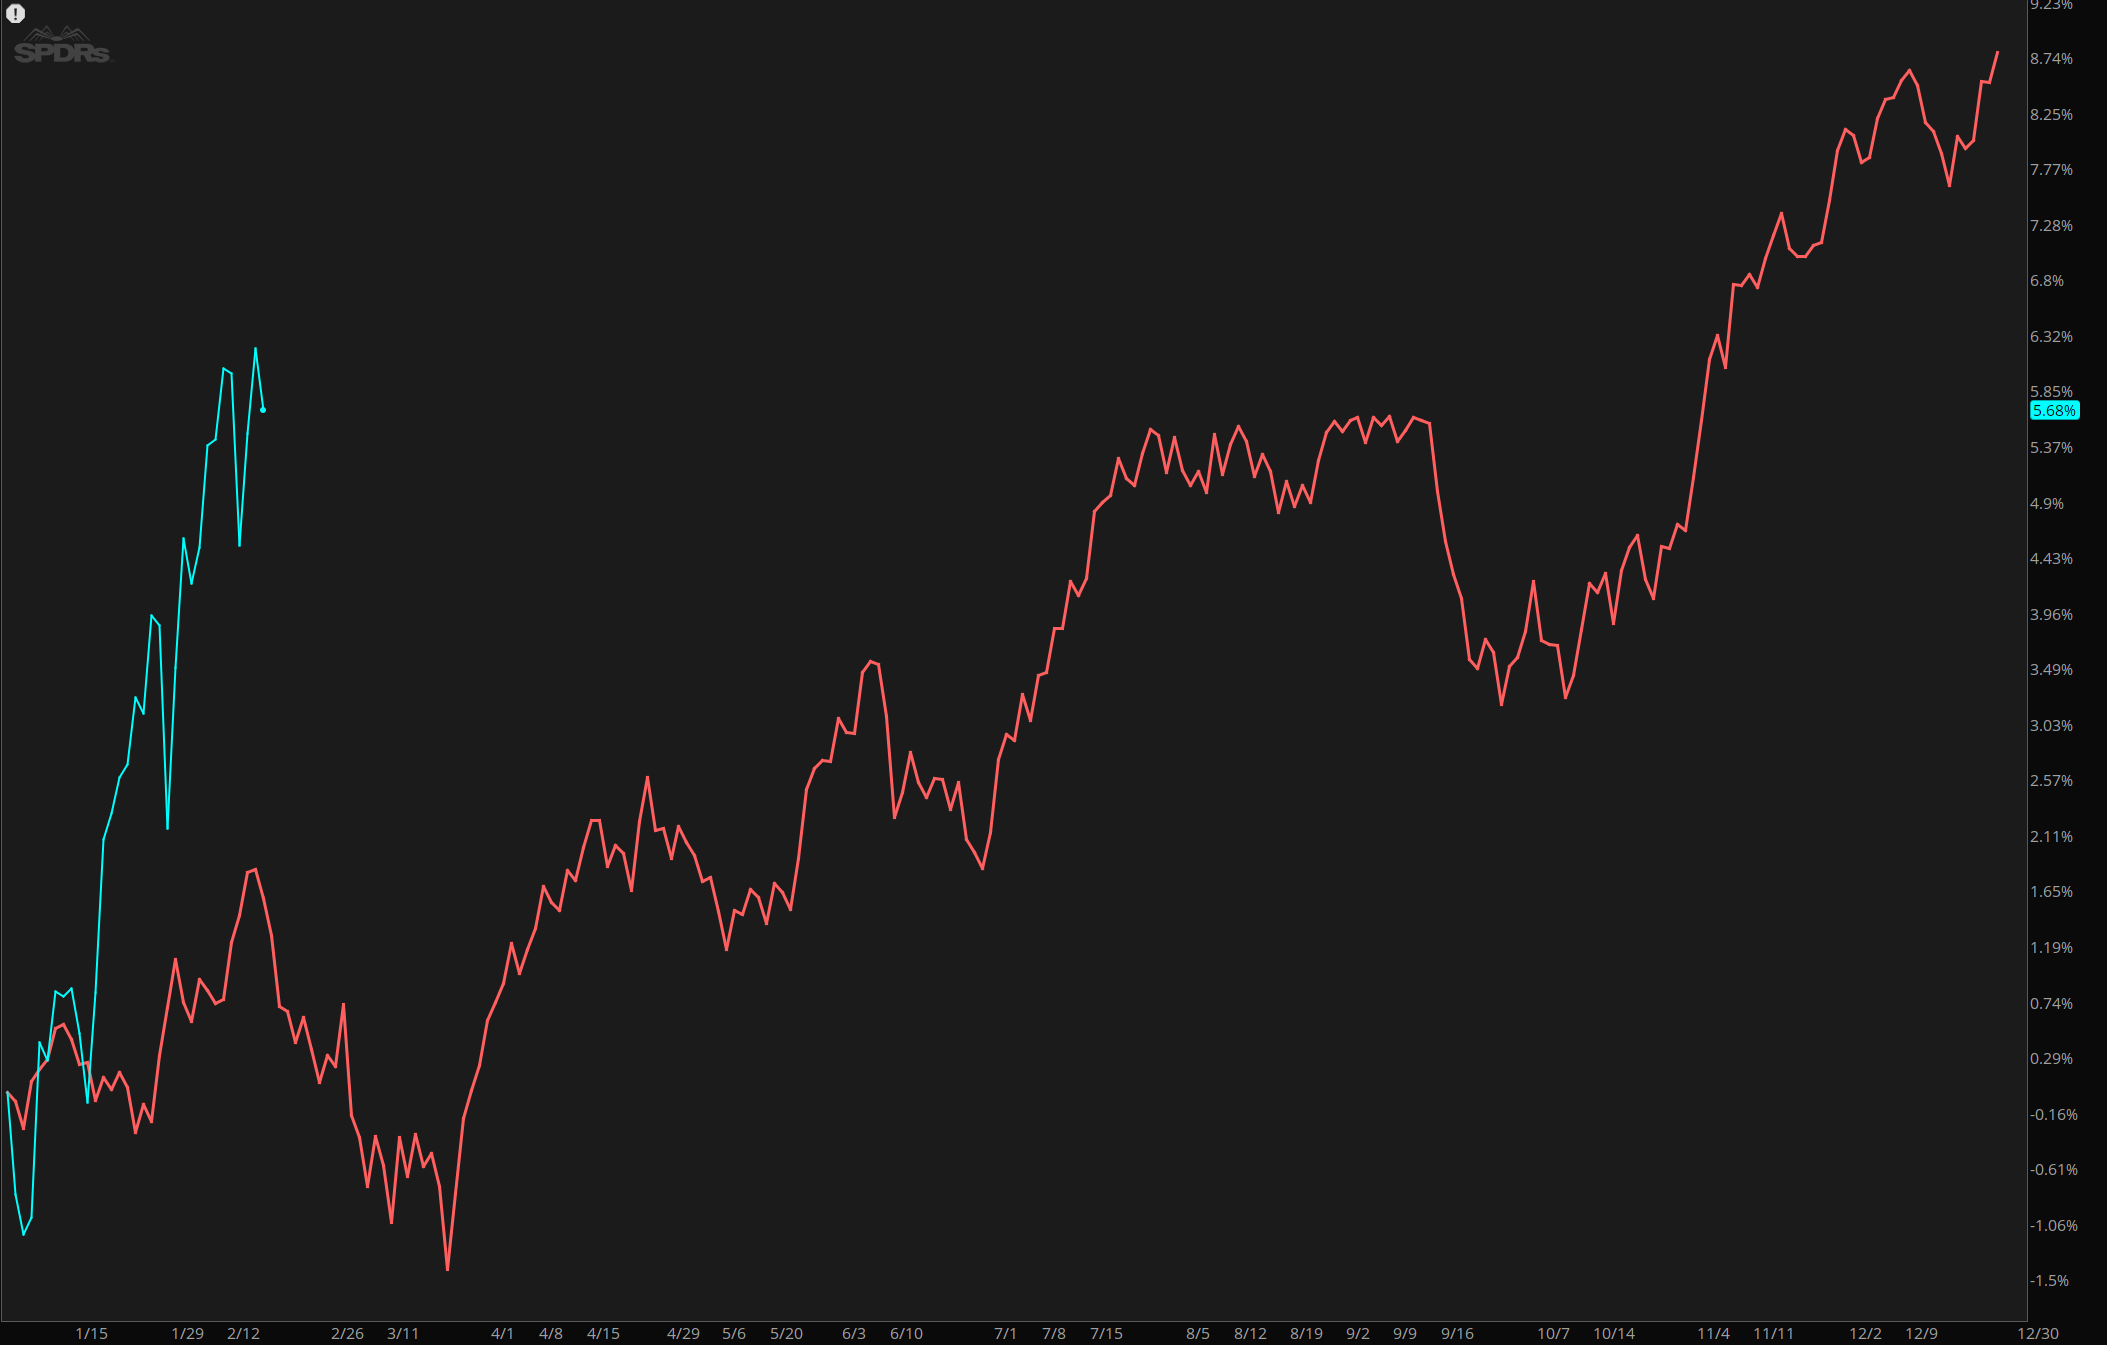
Here it is having the whole year outlook. We are now entering a weak period until March 20th.
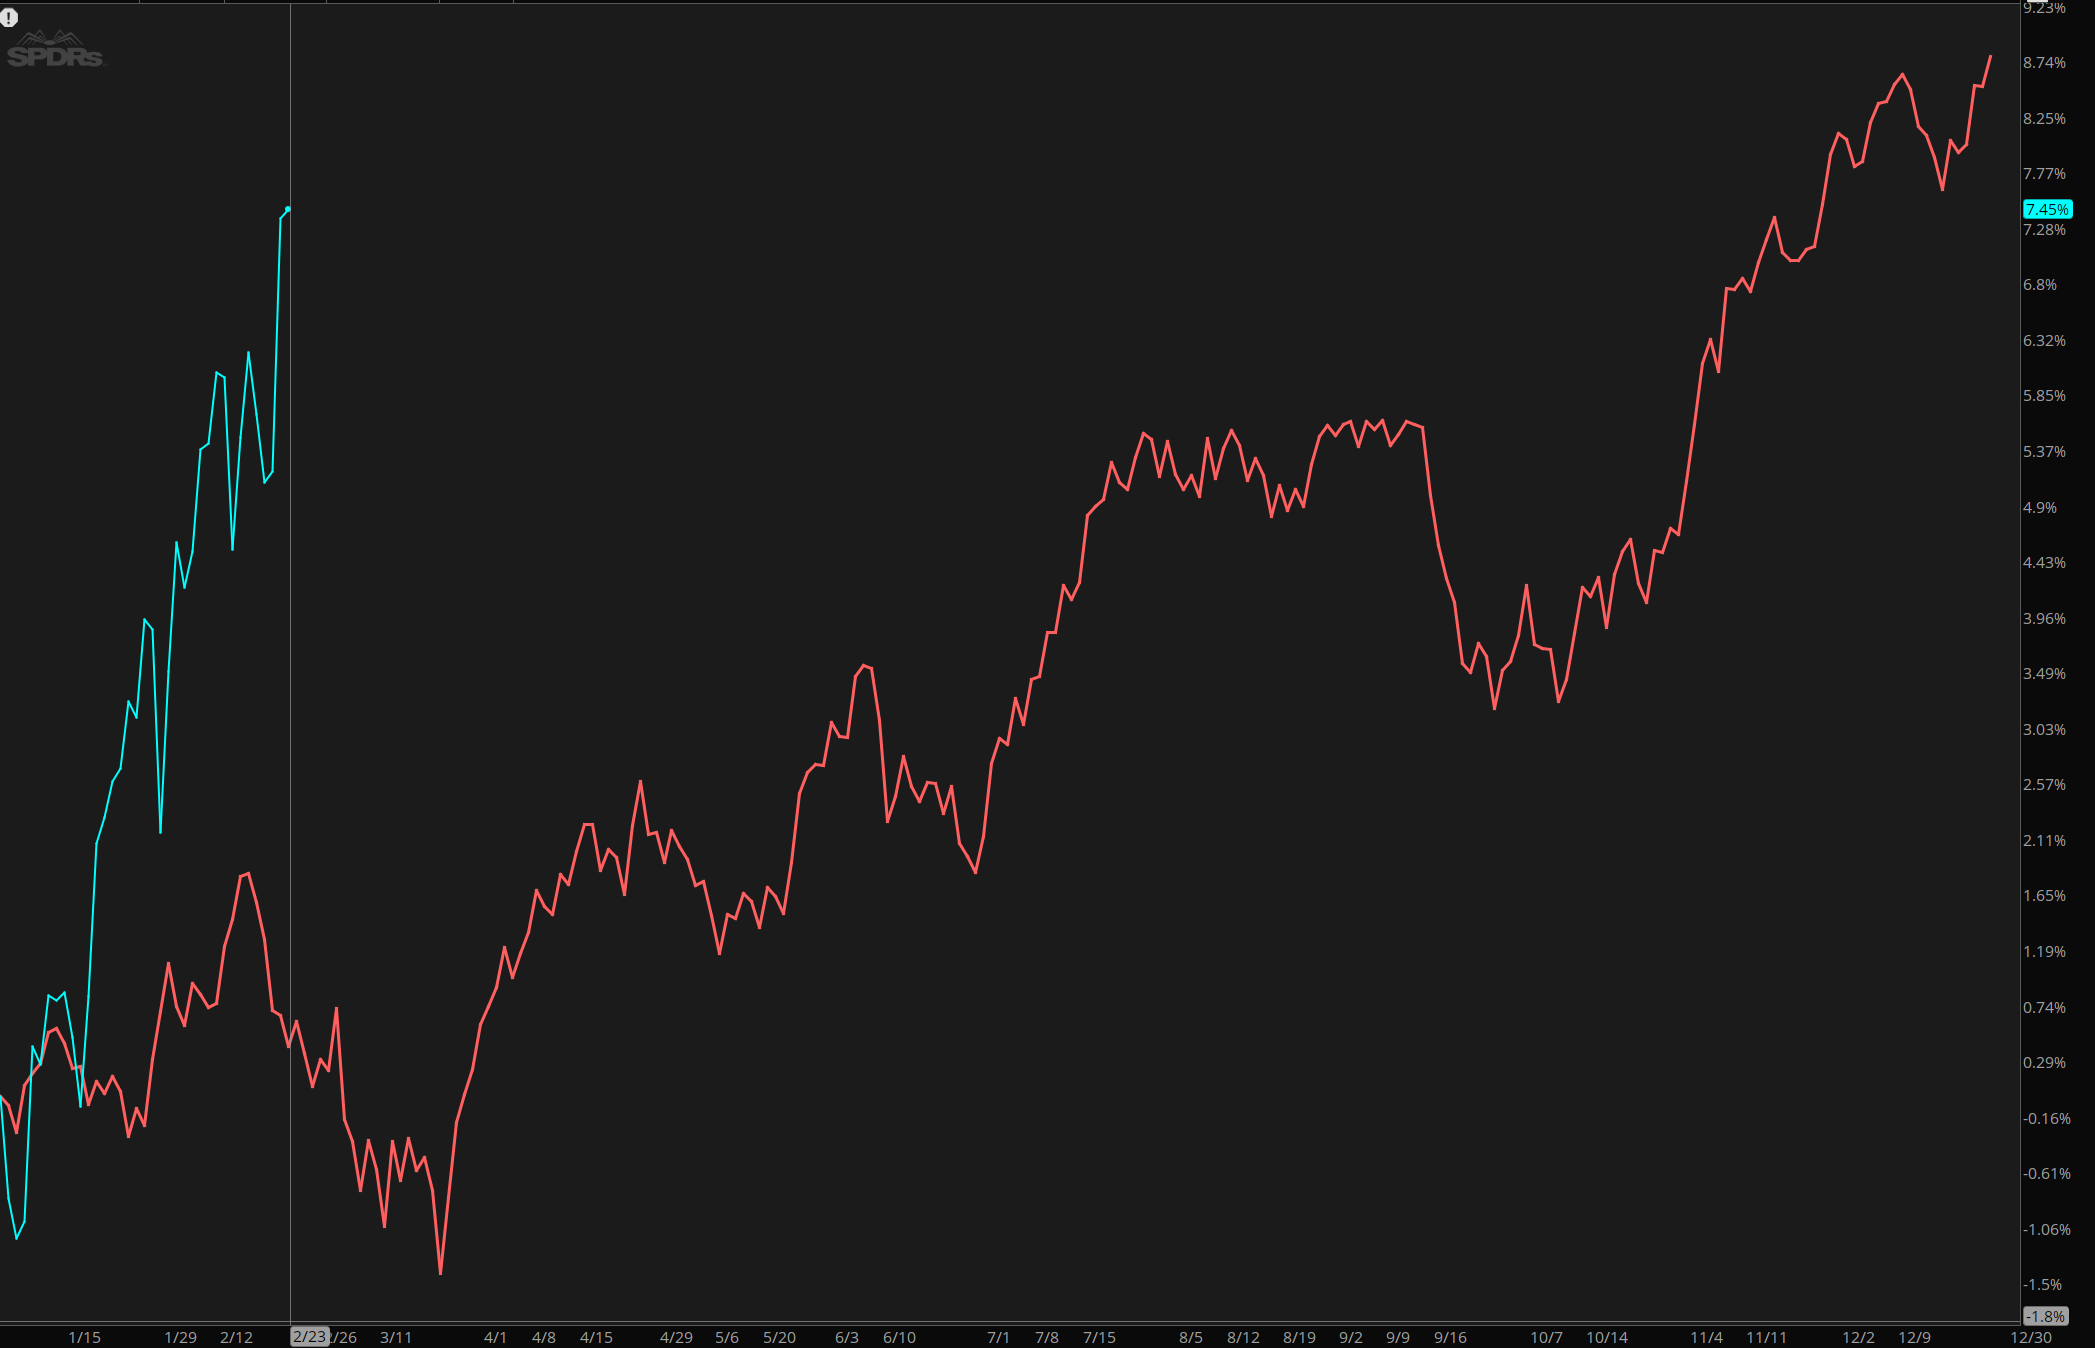
update. As you can see below, seasonality is not weather. We can be in the winter but have warm or even hot days throughout.
Price
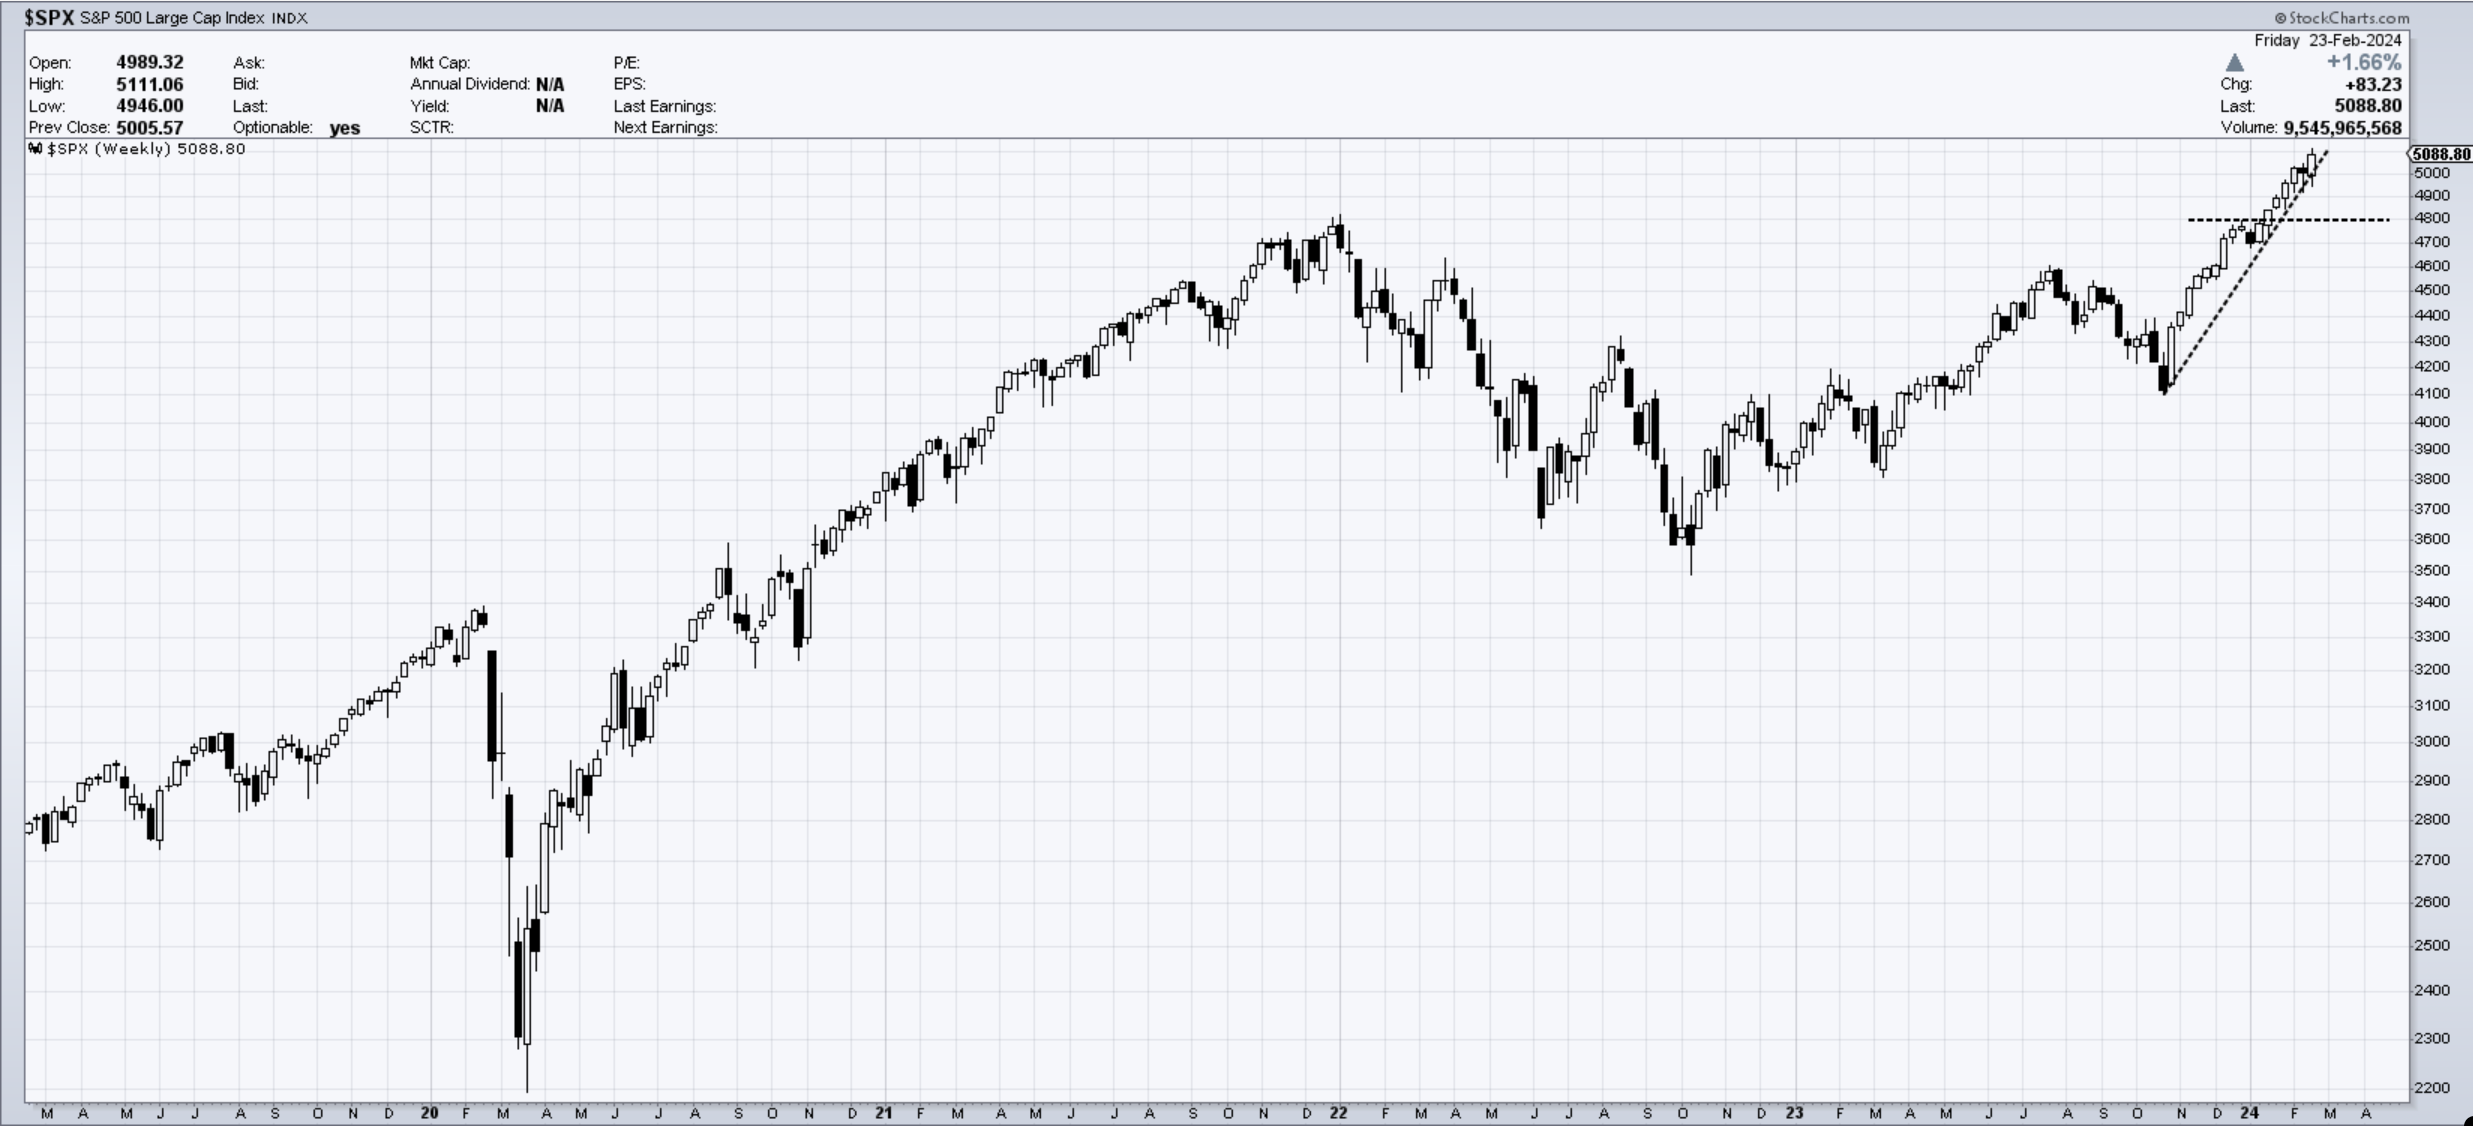
SP500. Last week’s actions were left in the dust this week as the market breaks and closes to a new all-time high. The trendline remains intact, and the 4800 (2022 highs) re-test has yet to occur, which makes one wonder: will it ever? A 6% correction from current levels would satisfy that. The price structure here in the weekly charts shows no evidence of that being in the cards at the moment.
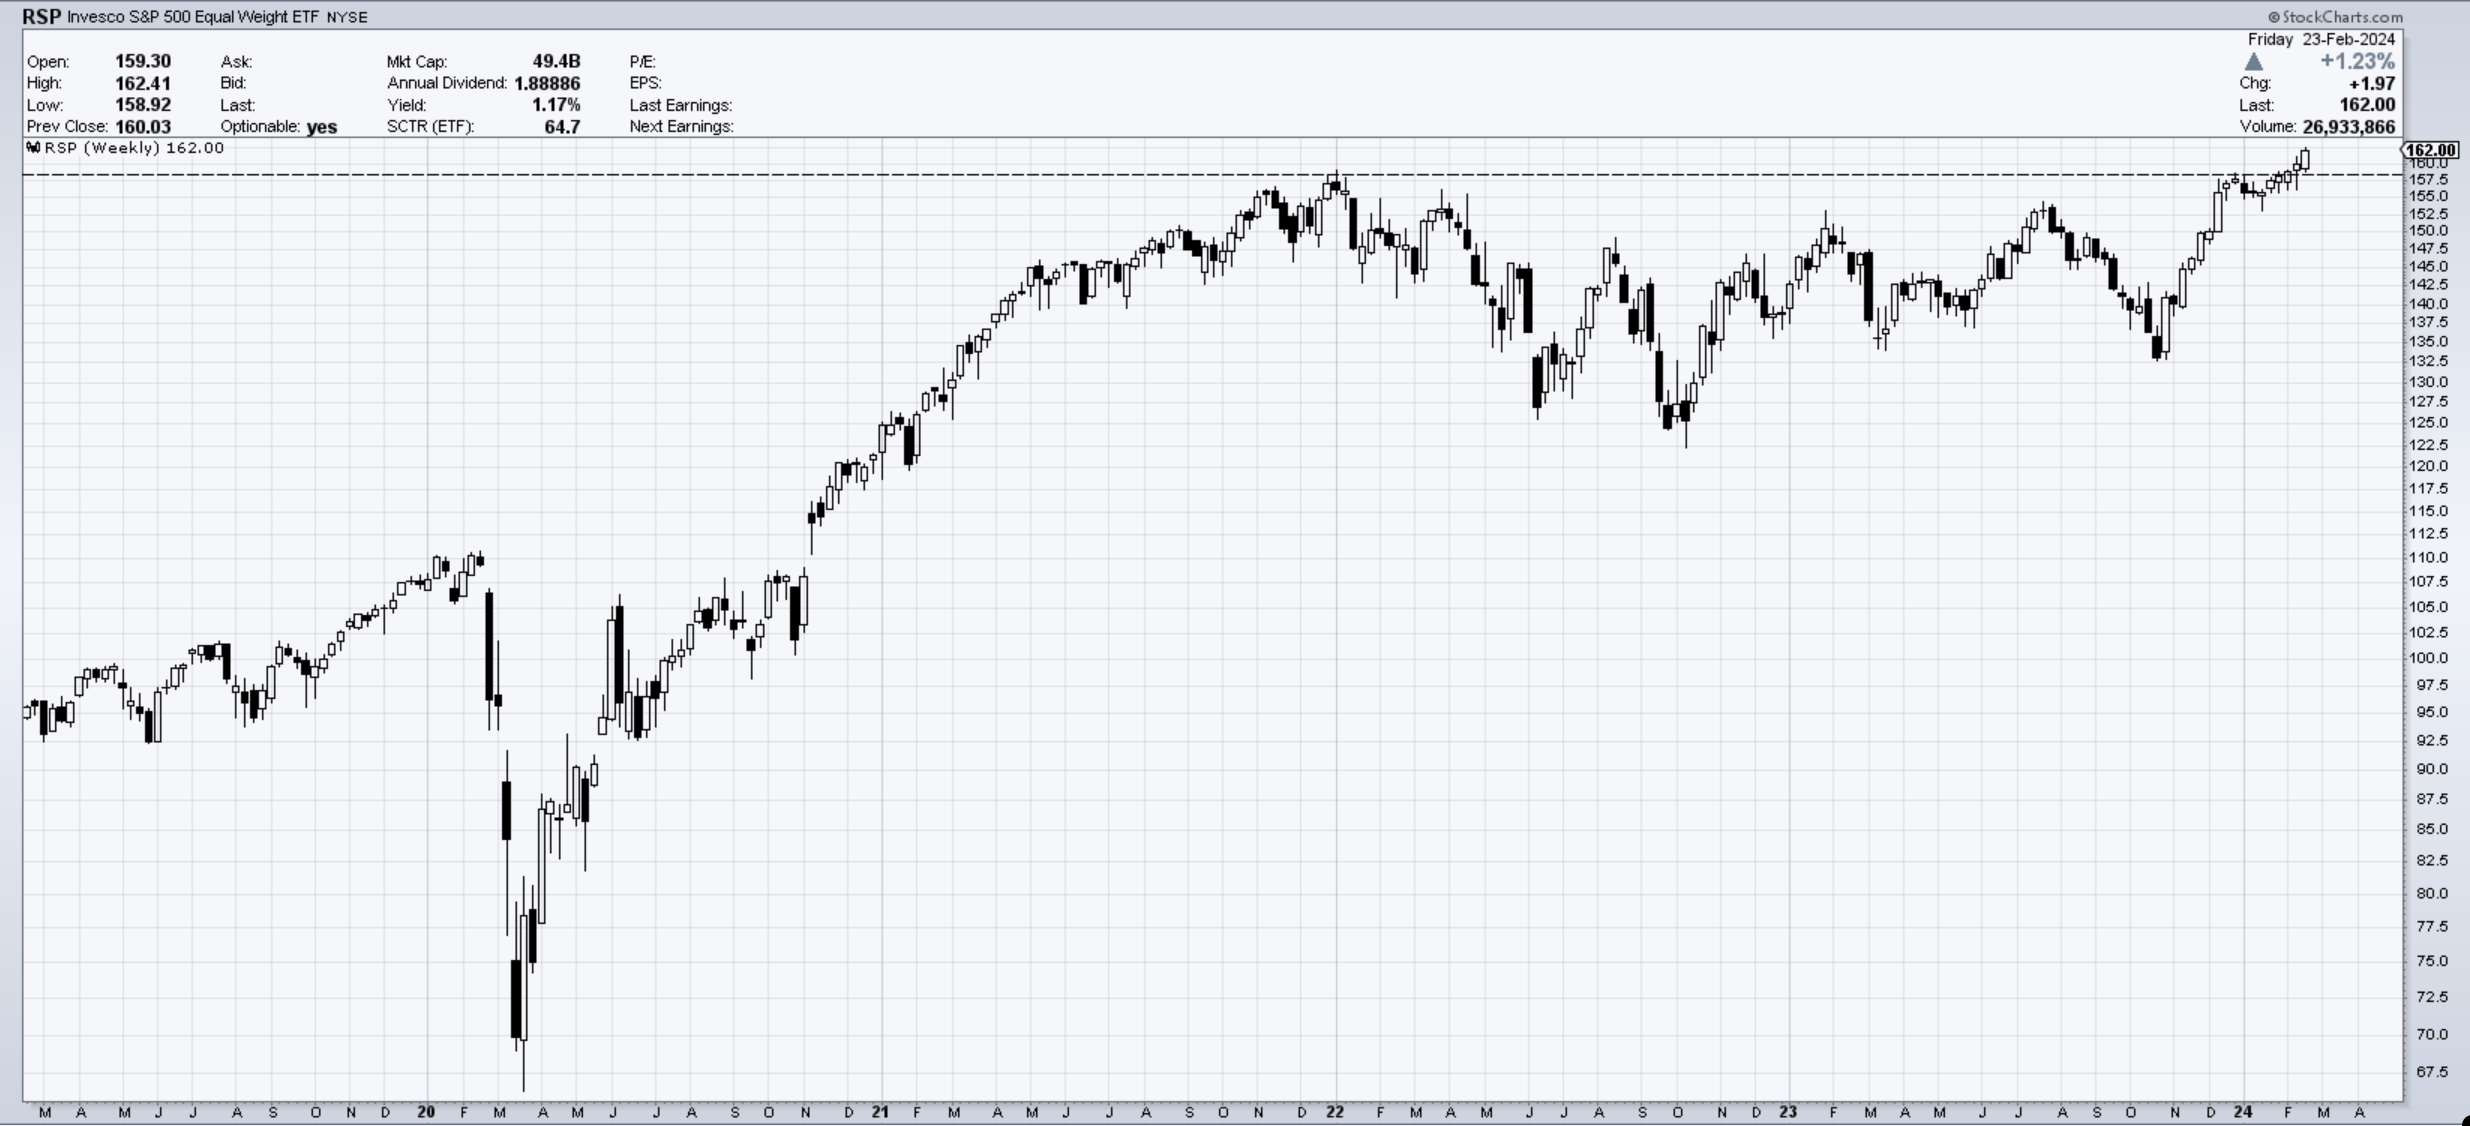
RSP - equal weight SP500. A very important break here from a market that has been struggling to follow the large cap weight. It confirms a much healthier participation in the uptrend. Not to be ignored.
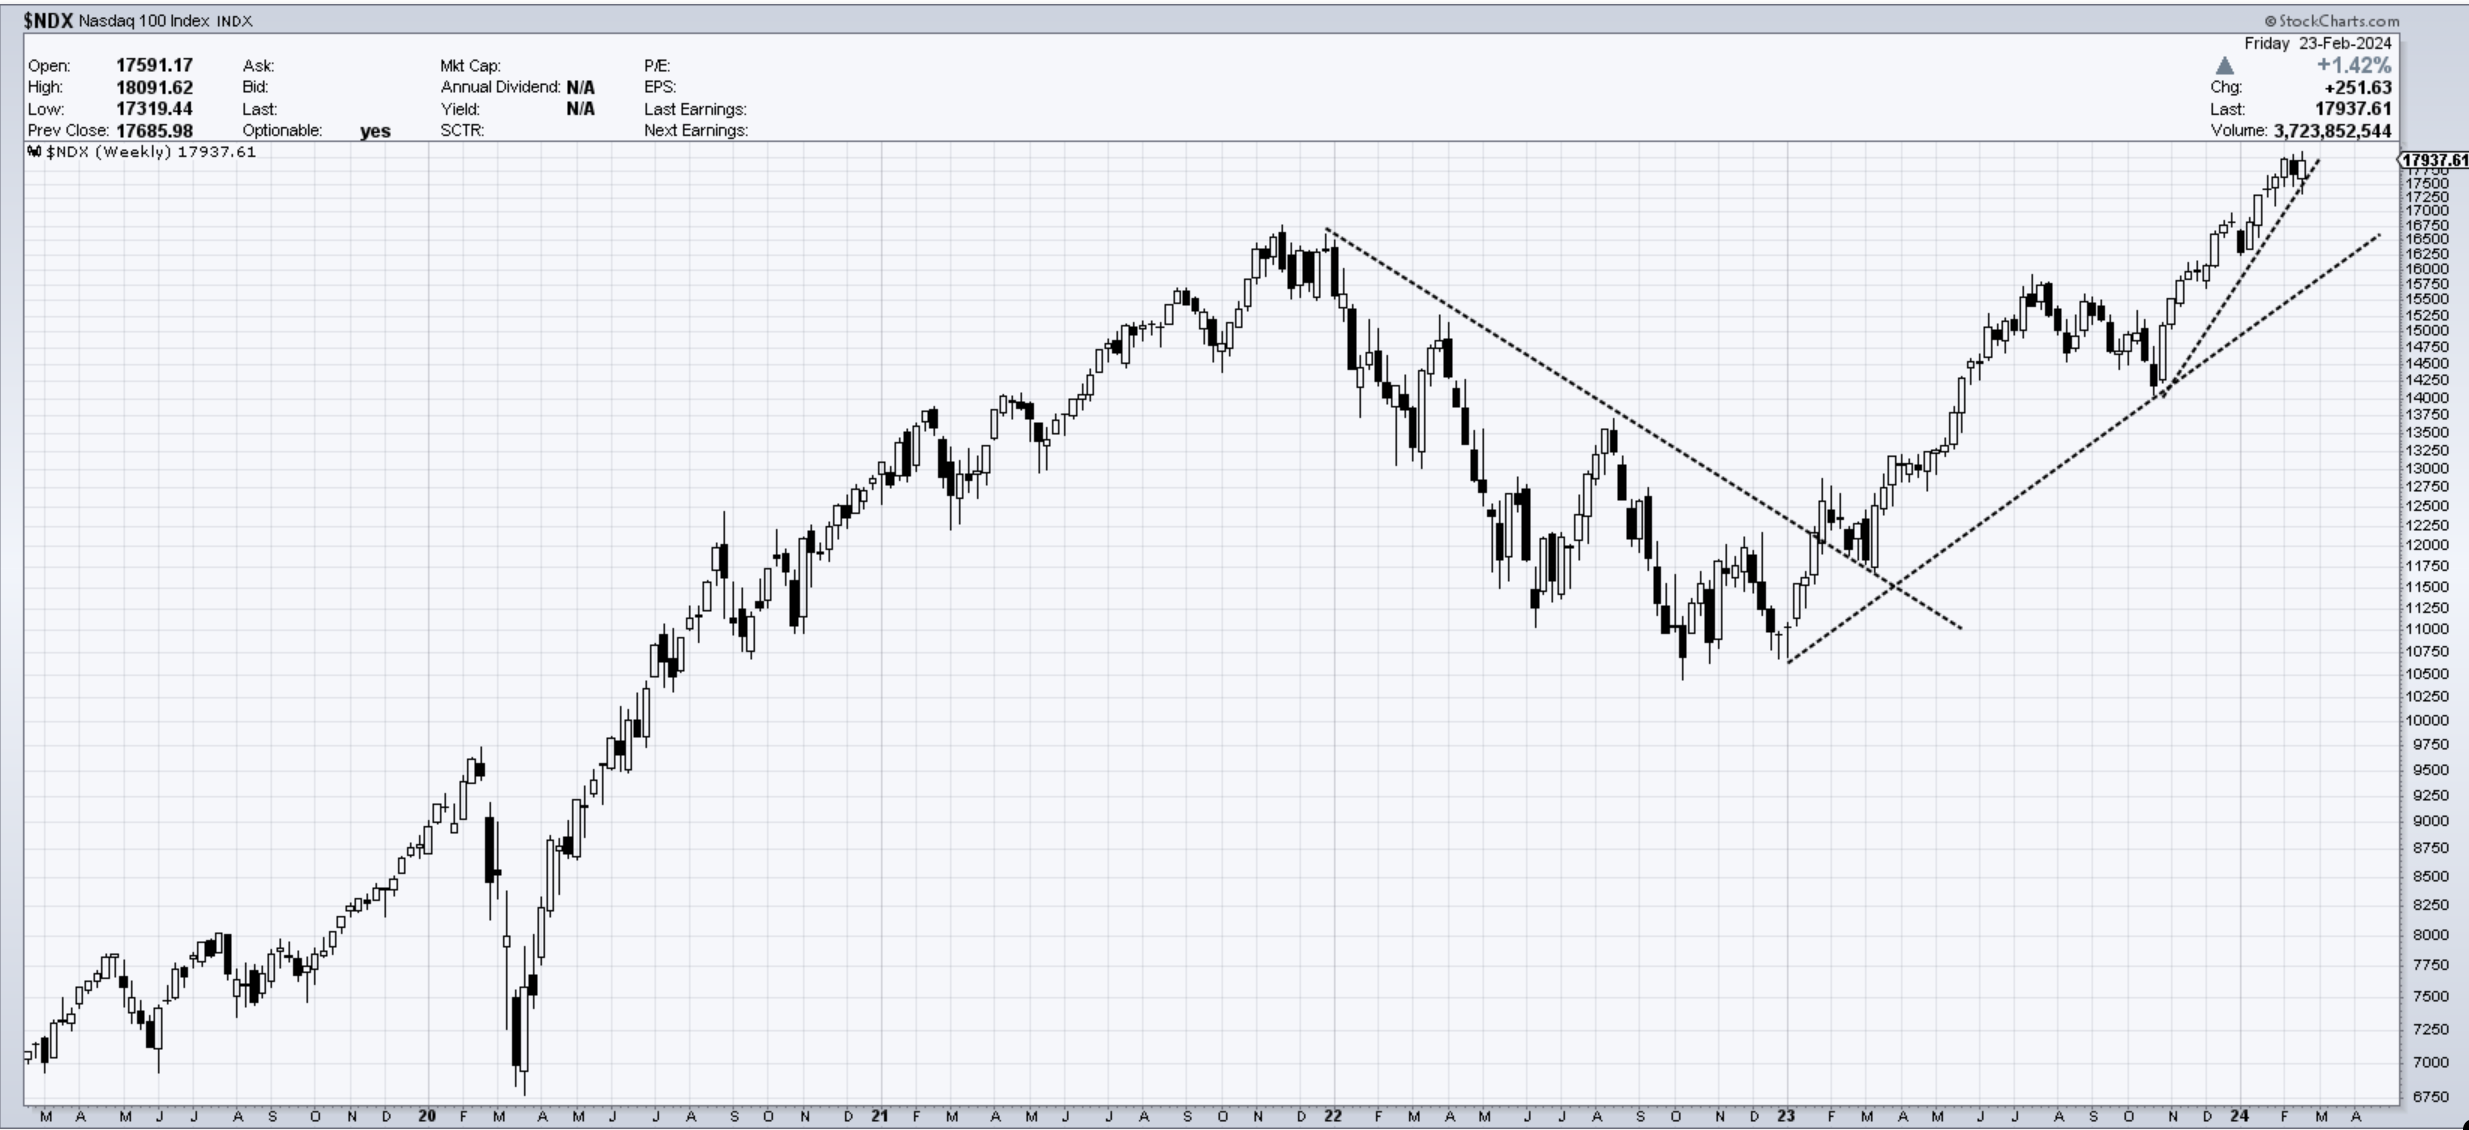
Nasdaq100 did not follow through on last week’s weakness and, if anything, closed back up near the prior week’s open. ( did not make a new all-time closing high). This can now be seen as a bullish development with a good reaction from the most current trendline.
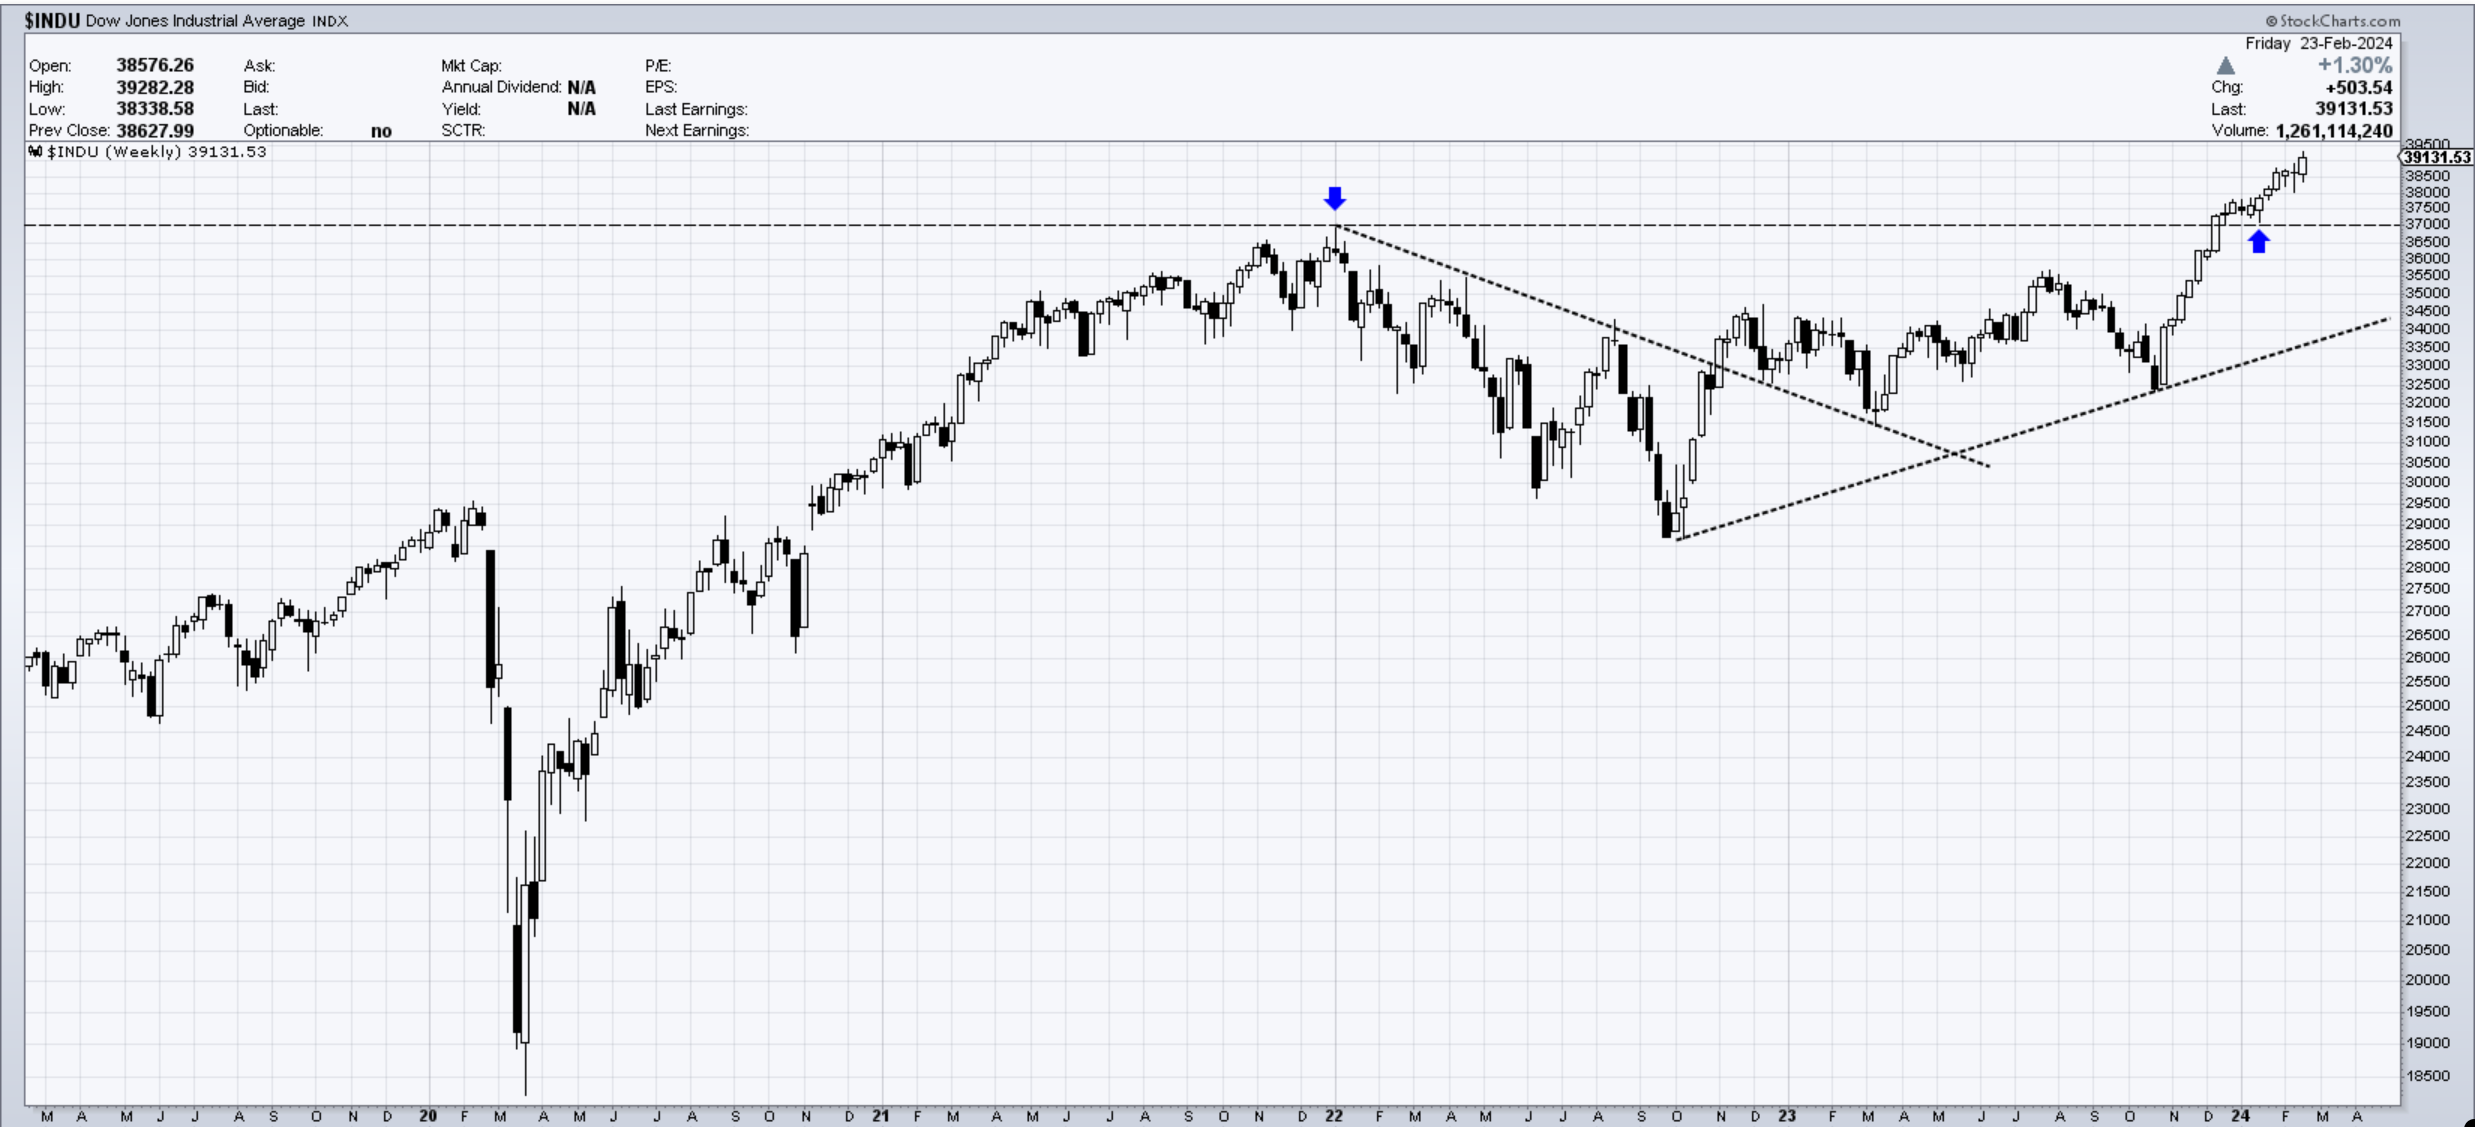
Dow Jones 30 also broke higher after consolidation in the last two weeks. This index provided a quick retest of the 37k level, after which was a one-way train. Notice how in 17 weeks of gains we had only 2 weeks with small tiny negative closes. Bears are nowhere to be found. The chart will tell us once they show up.
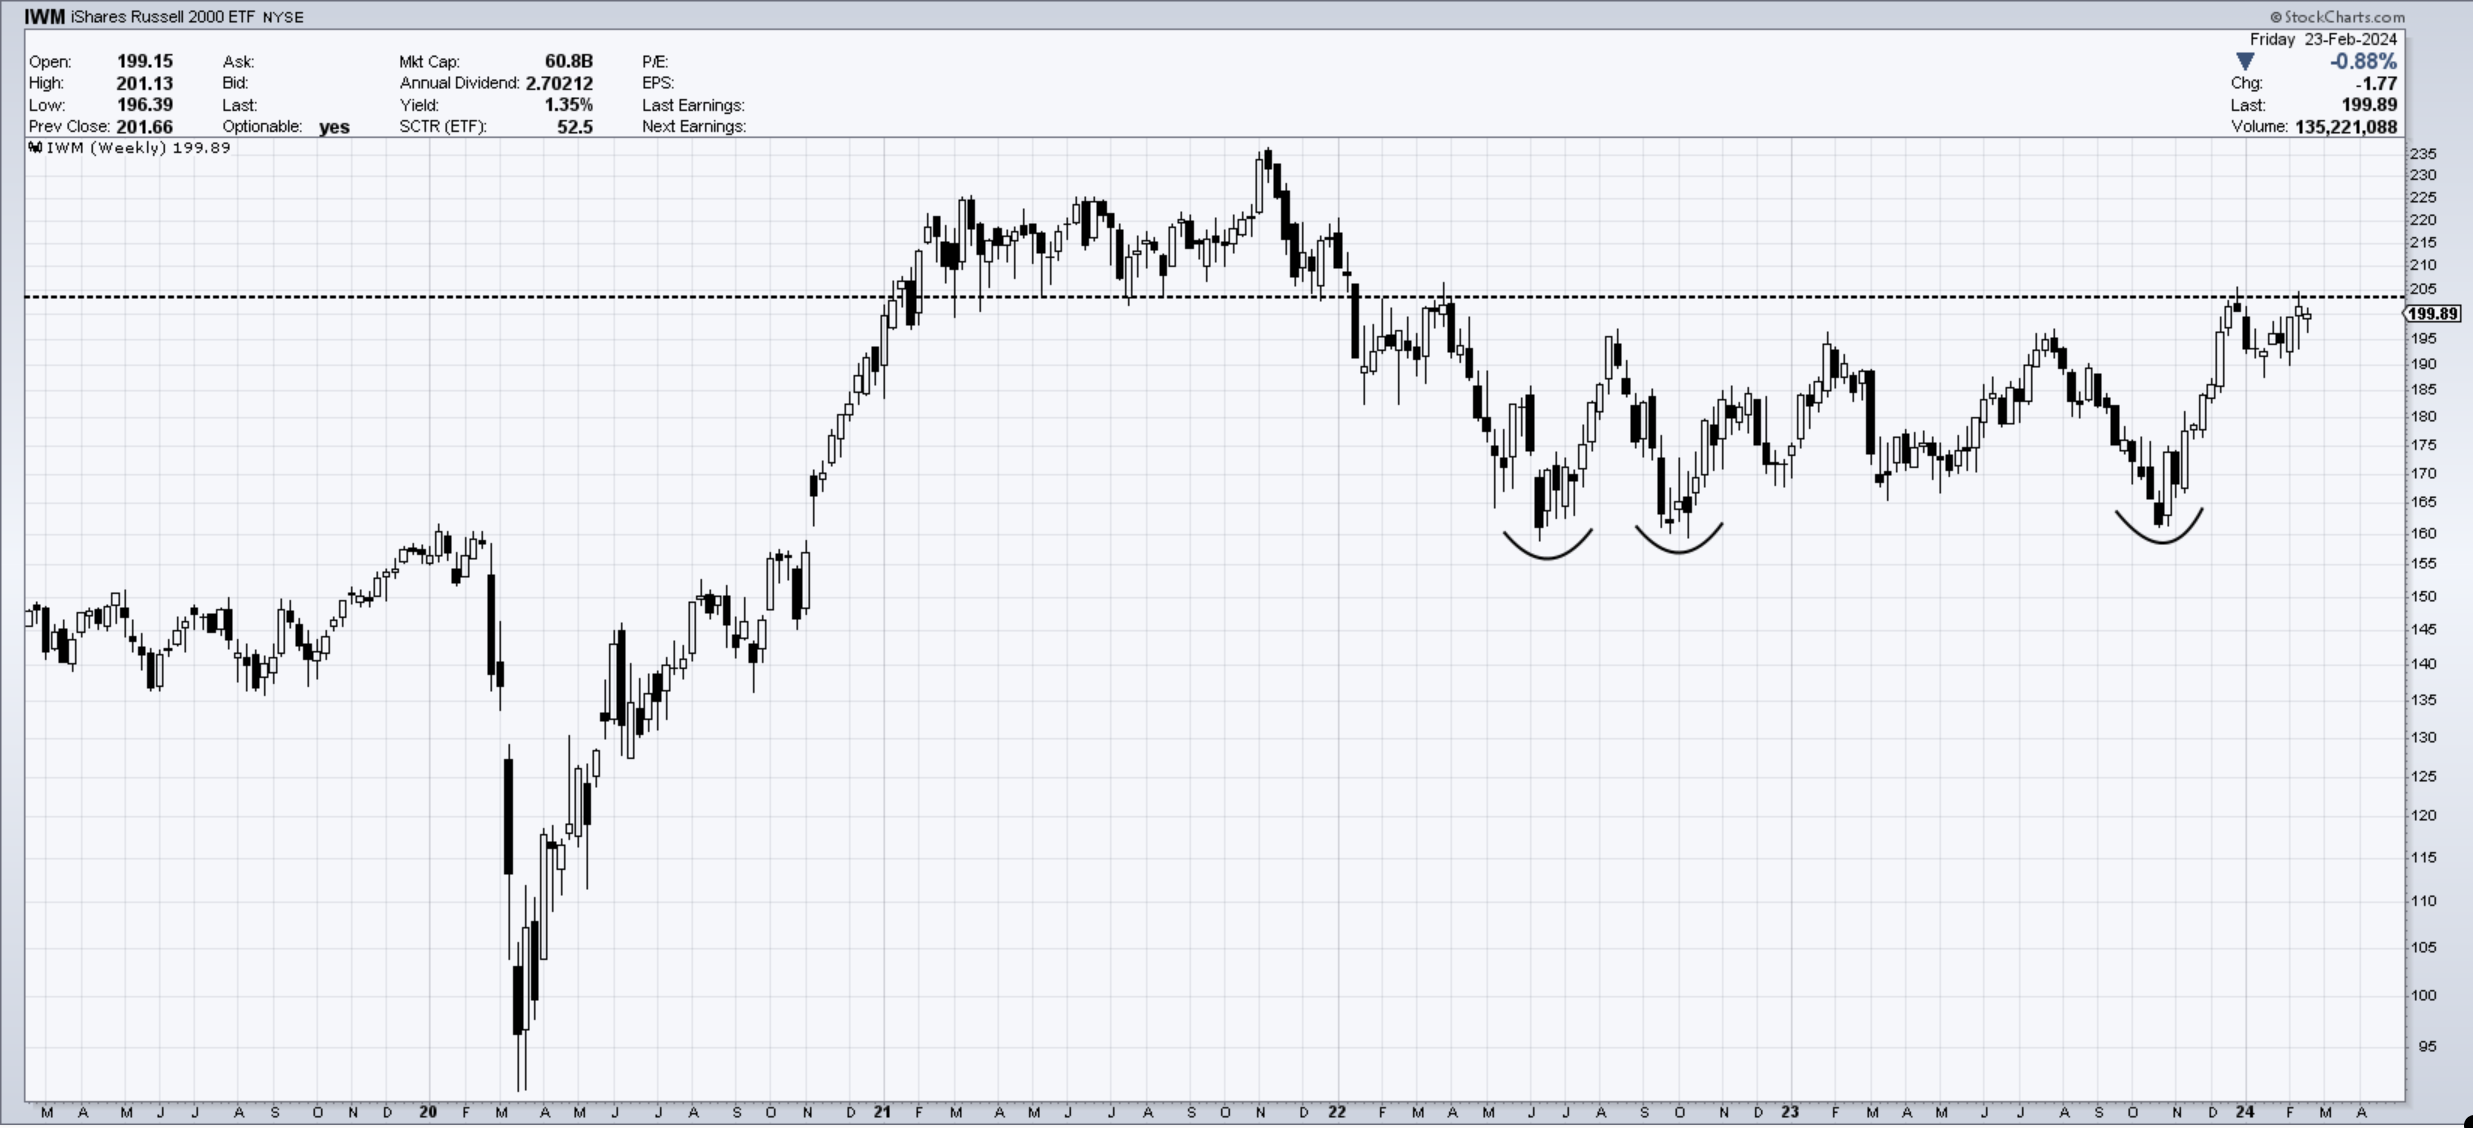
IWM - small caps. Here is one market that has yet to stage anything convincing. A bullish close here, but not above the prior week’s close. The 205 level is very important, and if it gets taken out, I would take that as a sign that can get this train going. Monitoring this in daily updates written and videos.
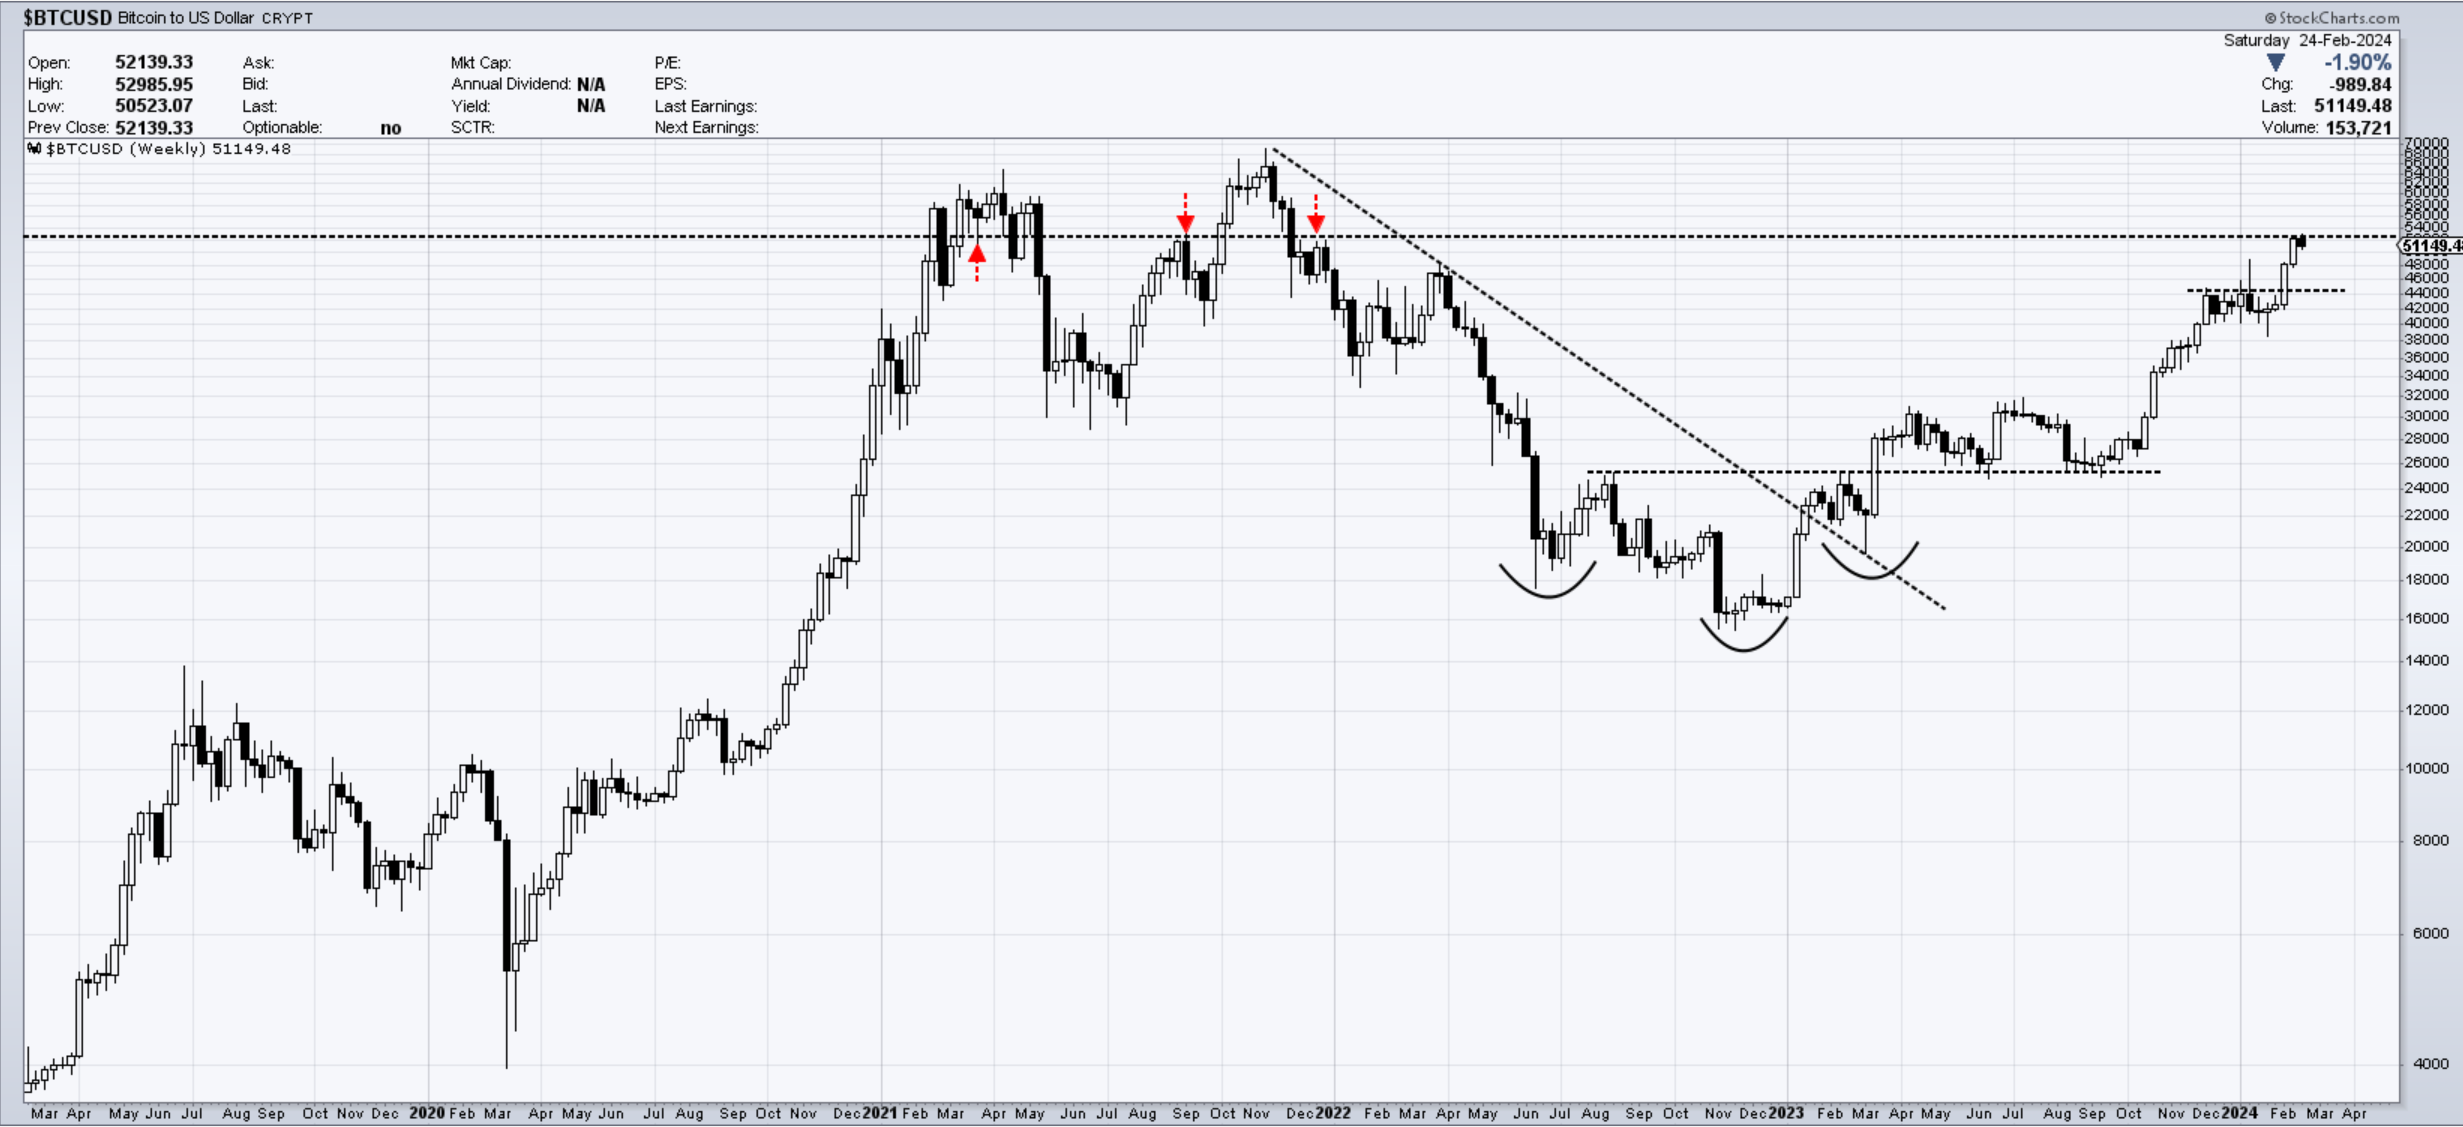
Bitcoin - is finding new resistance at some old levels near the 53k mark. The trend continues to appear strong and it gives no strong reason to reverse. A pause is understandable as we’re getting closer to the all-time highs, but as long as 45k holds any potential re-tests, it is right to keep looking higher. 60k are the next targets from a supply zone perspective.
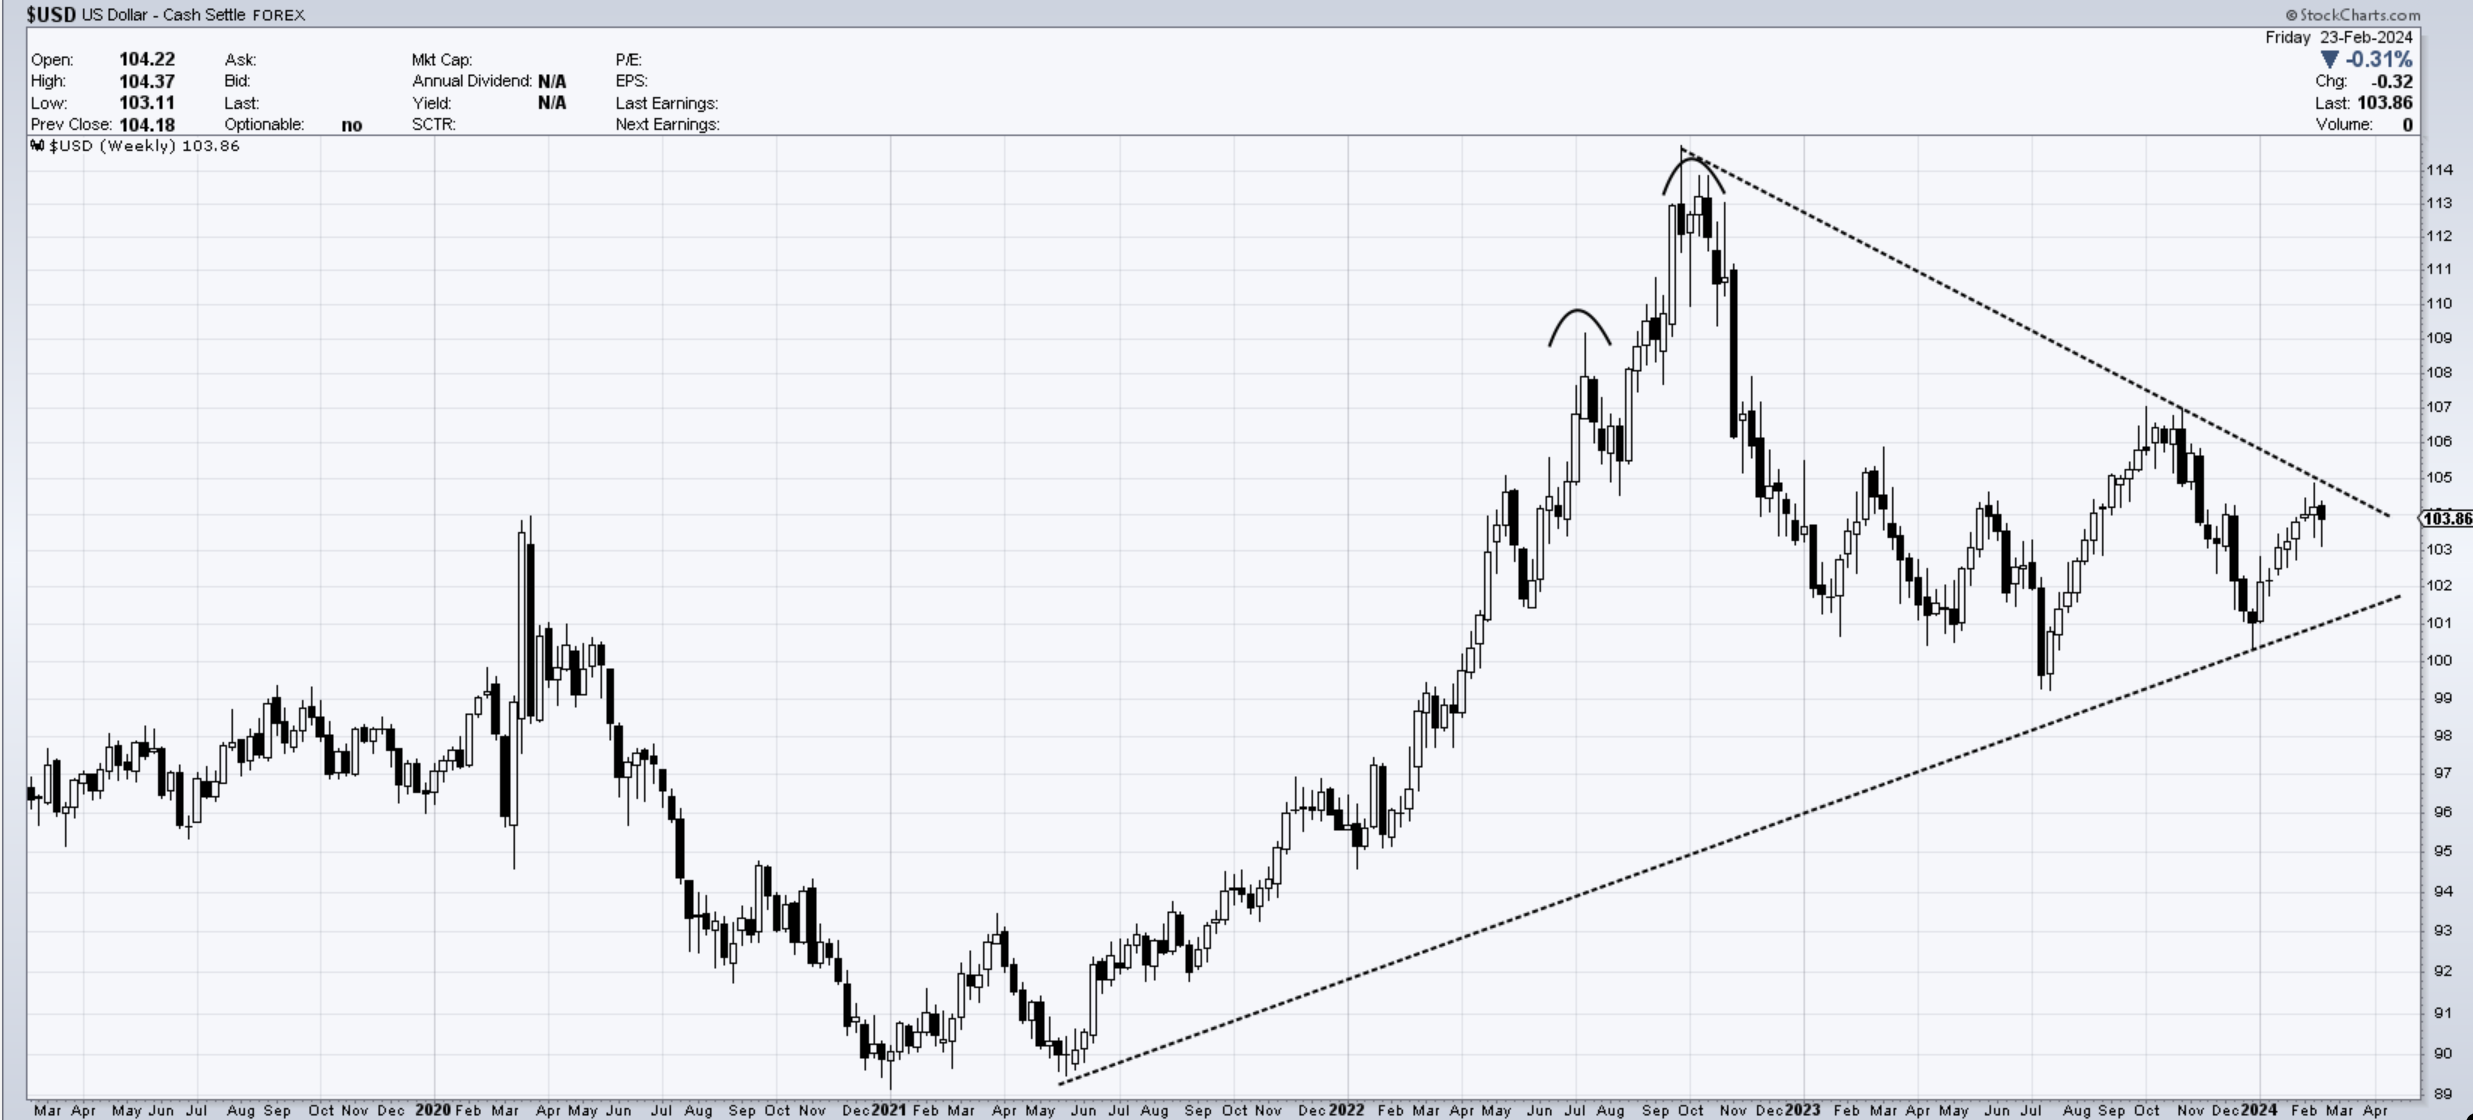
The US Dollar - remains in a state of equilibrium near 104. There are head and shoulder arguments since May 2023 peak with a head Oct 2023. Usually, these formations need to reverse something, and there is nothing apparent to reverse. Looking as a continuation pattern, it would suggest a break lower, but realistically until 101 gives way, there is not much to do here but observe.
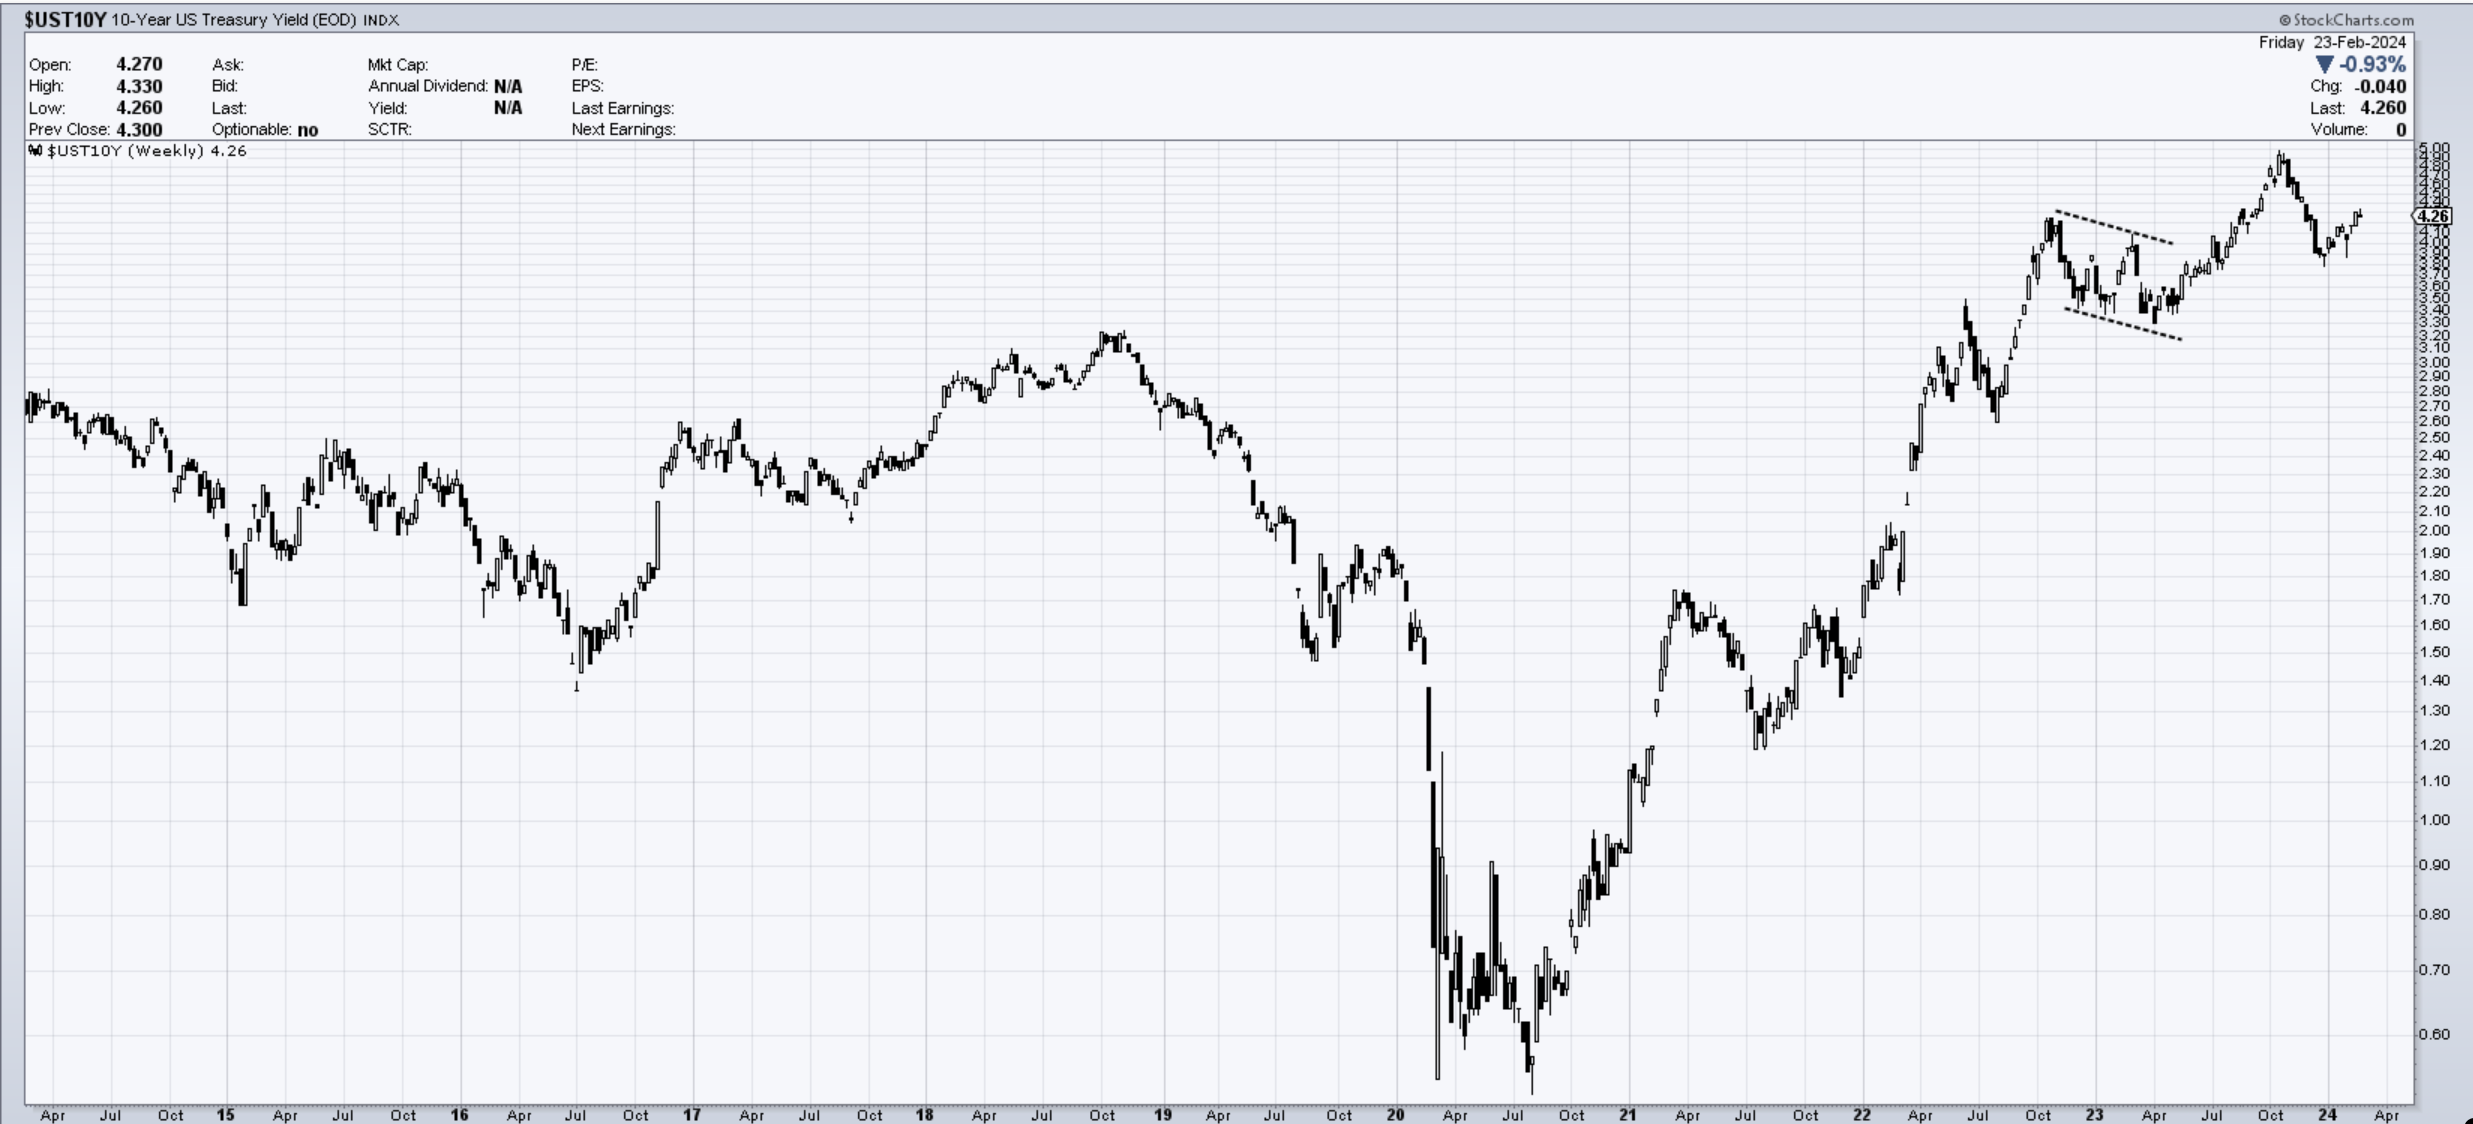
10y Yields - have had 8 weeks of uptrend in the context of a decline from Oct 2023 top. One could argue lower yields are ahead following this corrective move upwards. Waiting for a decline below 4% before making such a bet would be a sensitive approach.
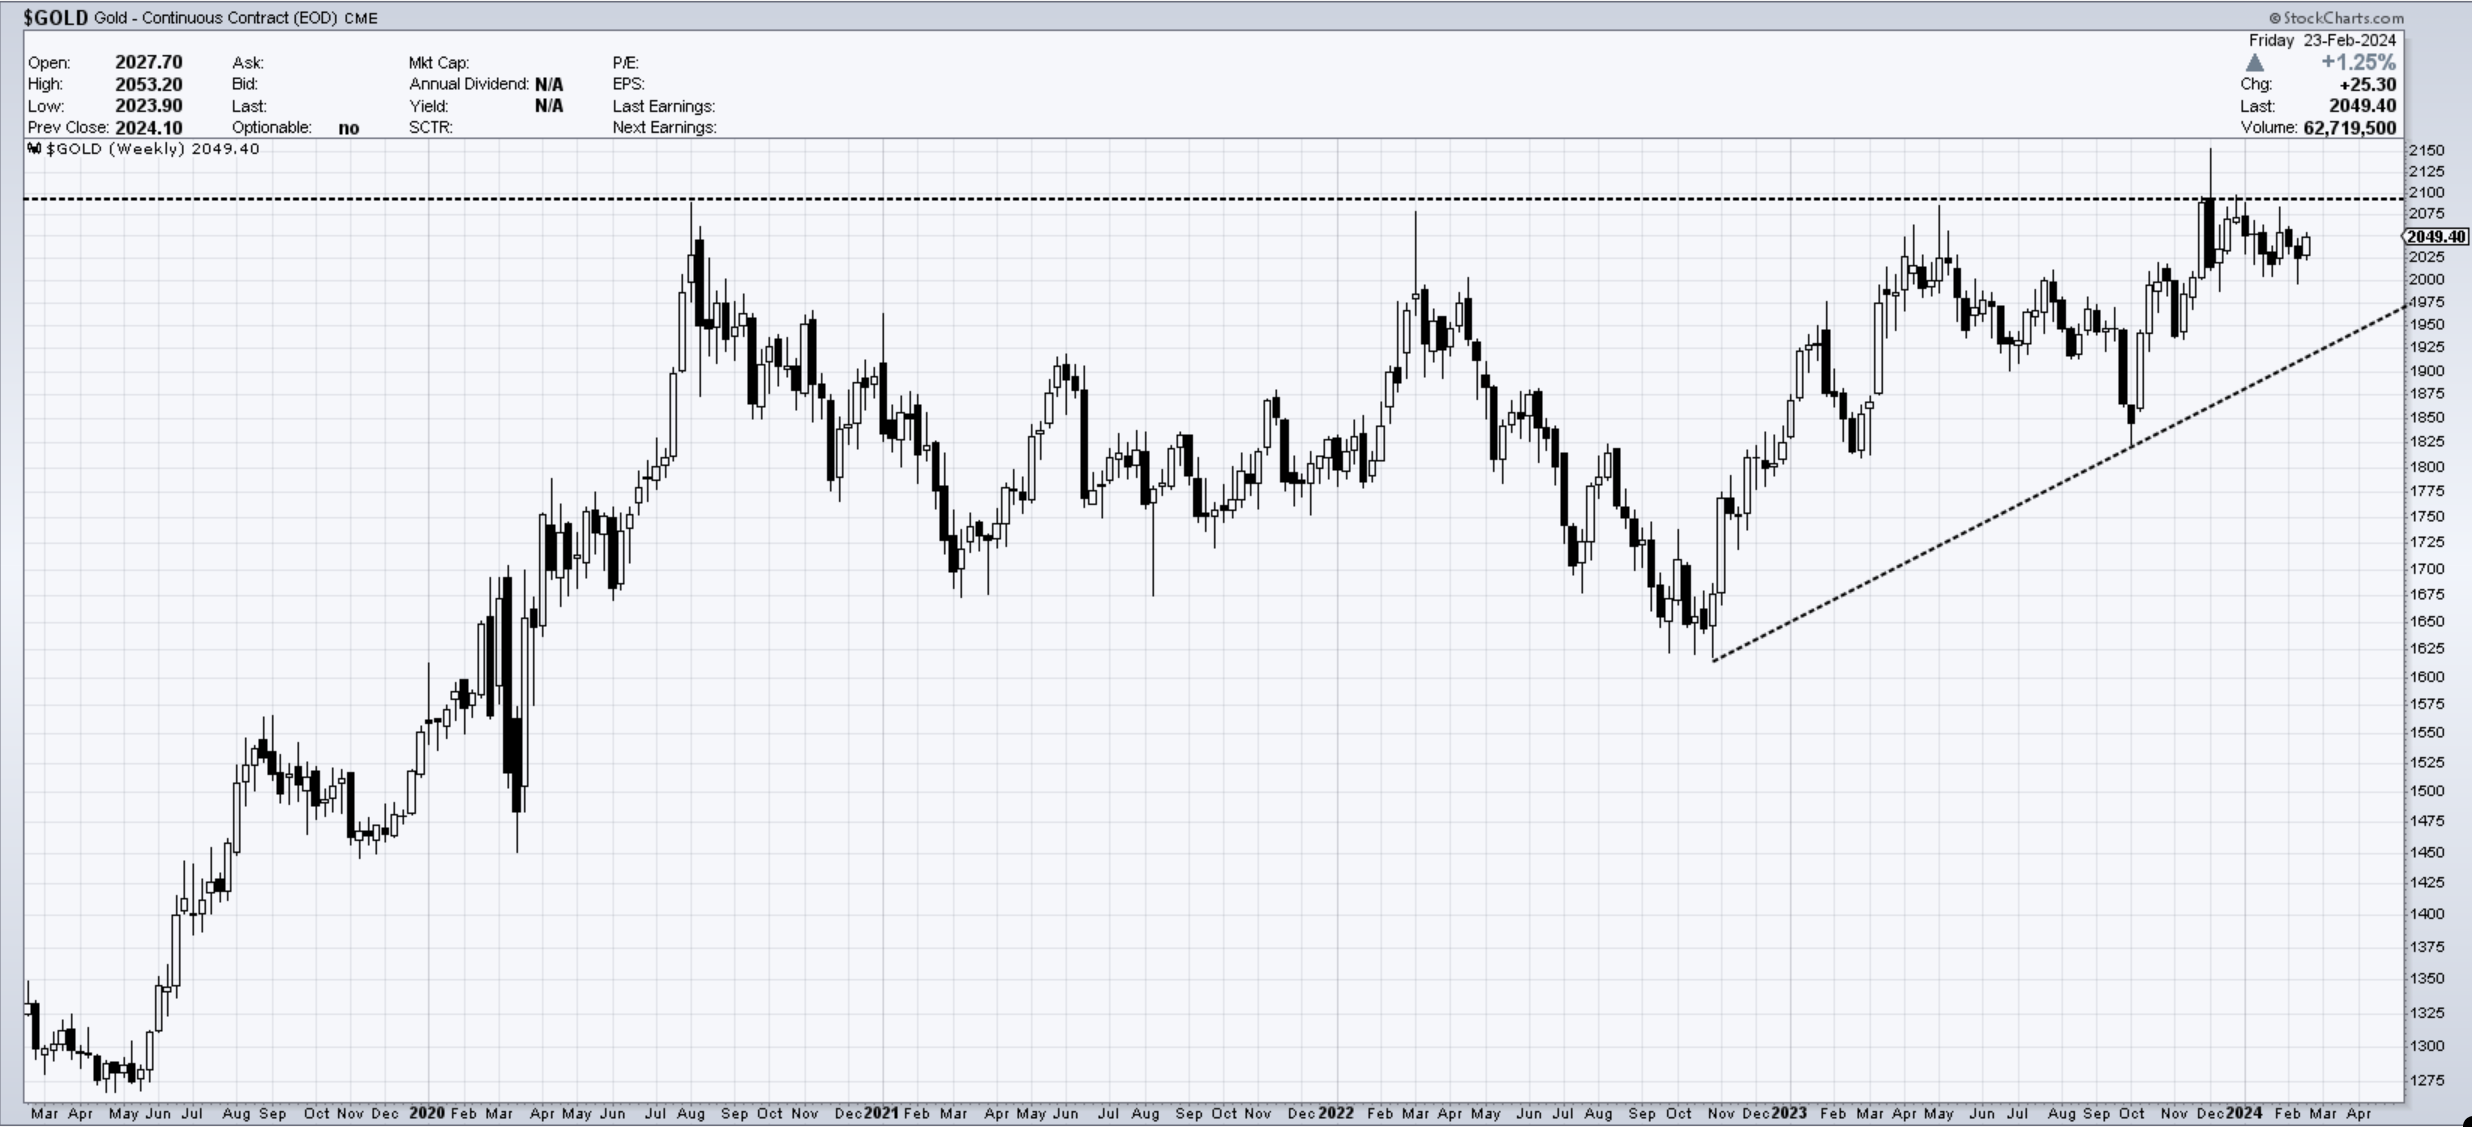
Gold - managed a decent weekly close which can bring some excitement in this arena. There are several upside levels to get taken out, but if we see Gold closing near 2100, I would say look for some extra cash to put to work. A breakout in Gold could stage a very large move towards 2500.
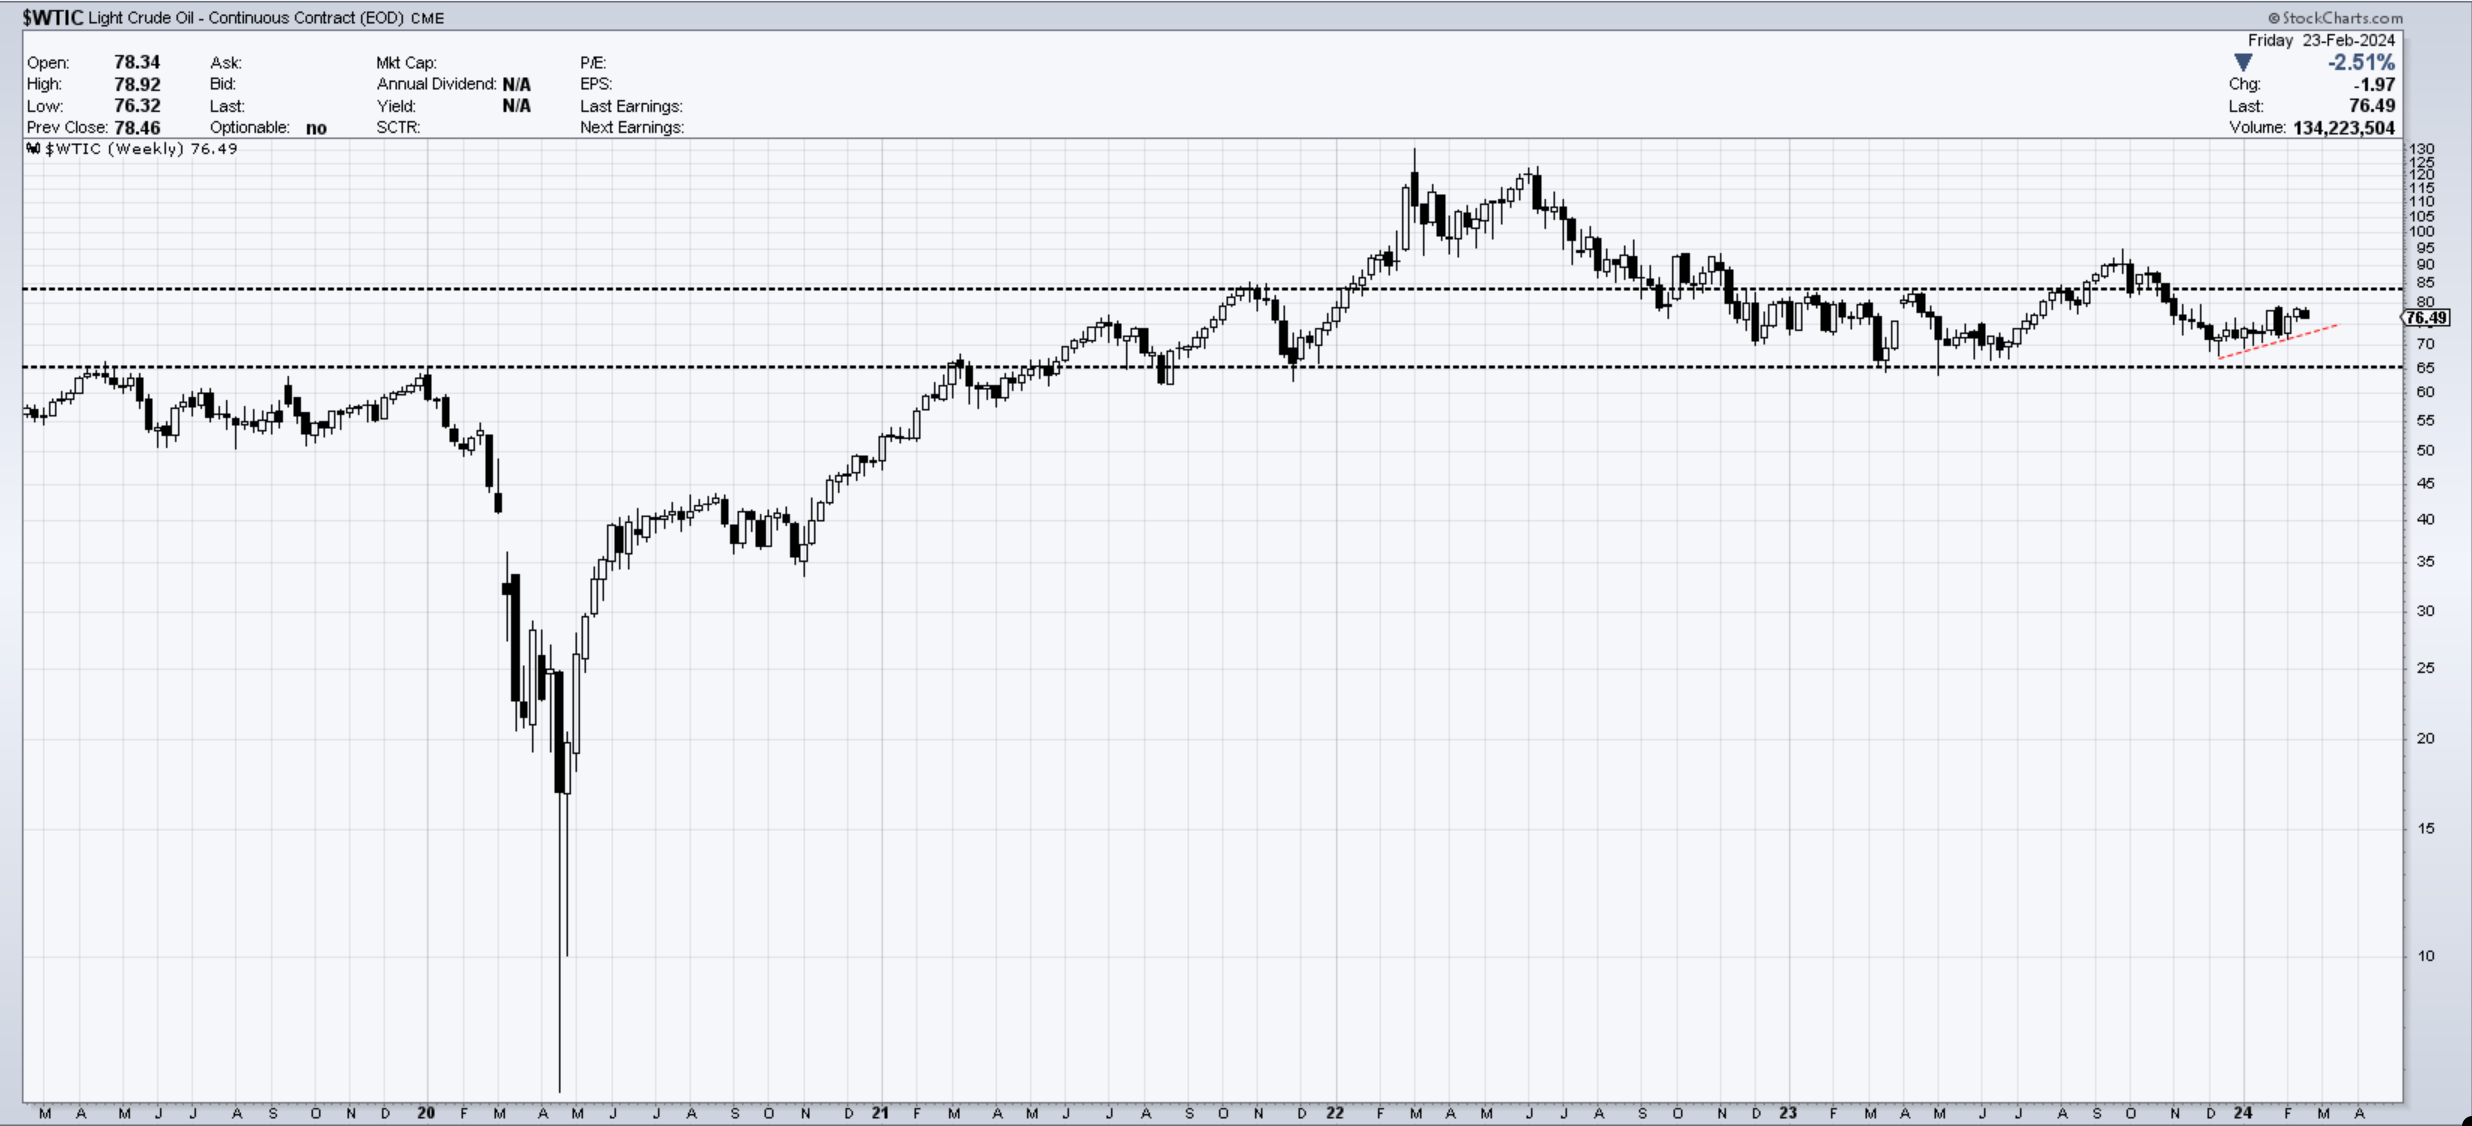
OIL - remains in a pretty tight range and stages another upside break failure. The lines are clear for those looking at some short-term moves between them.
Thank you all for reading, I will see you next week. Leave a comment or suggestion below. Join our chat to discuss markets with fellow traders.
In the meantime please consider subscribing to EWCafe and read “The Daily Drip” where I provide daily market updates, videos and commentary on core markets.
Cris,
EWCafe