
Weekly market review
A technical look at weekly trends in core markets.

This weekly report is free and provides a recap of the action in the core markets for the past week. Check out the daily updates and videos for a deeper dive into market analysis, projections, elliott wave counts, technical reviews, and opportunities. A 7-day free trial will give you access to my work.
Sentiment
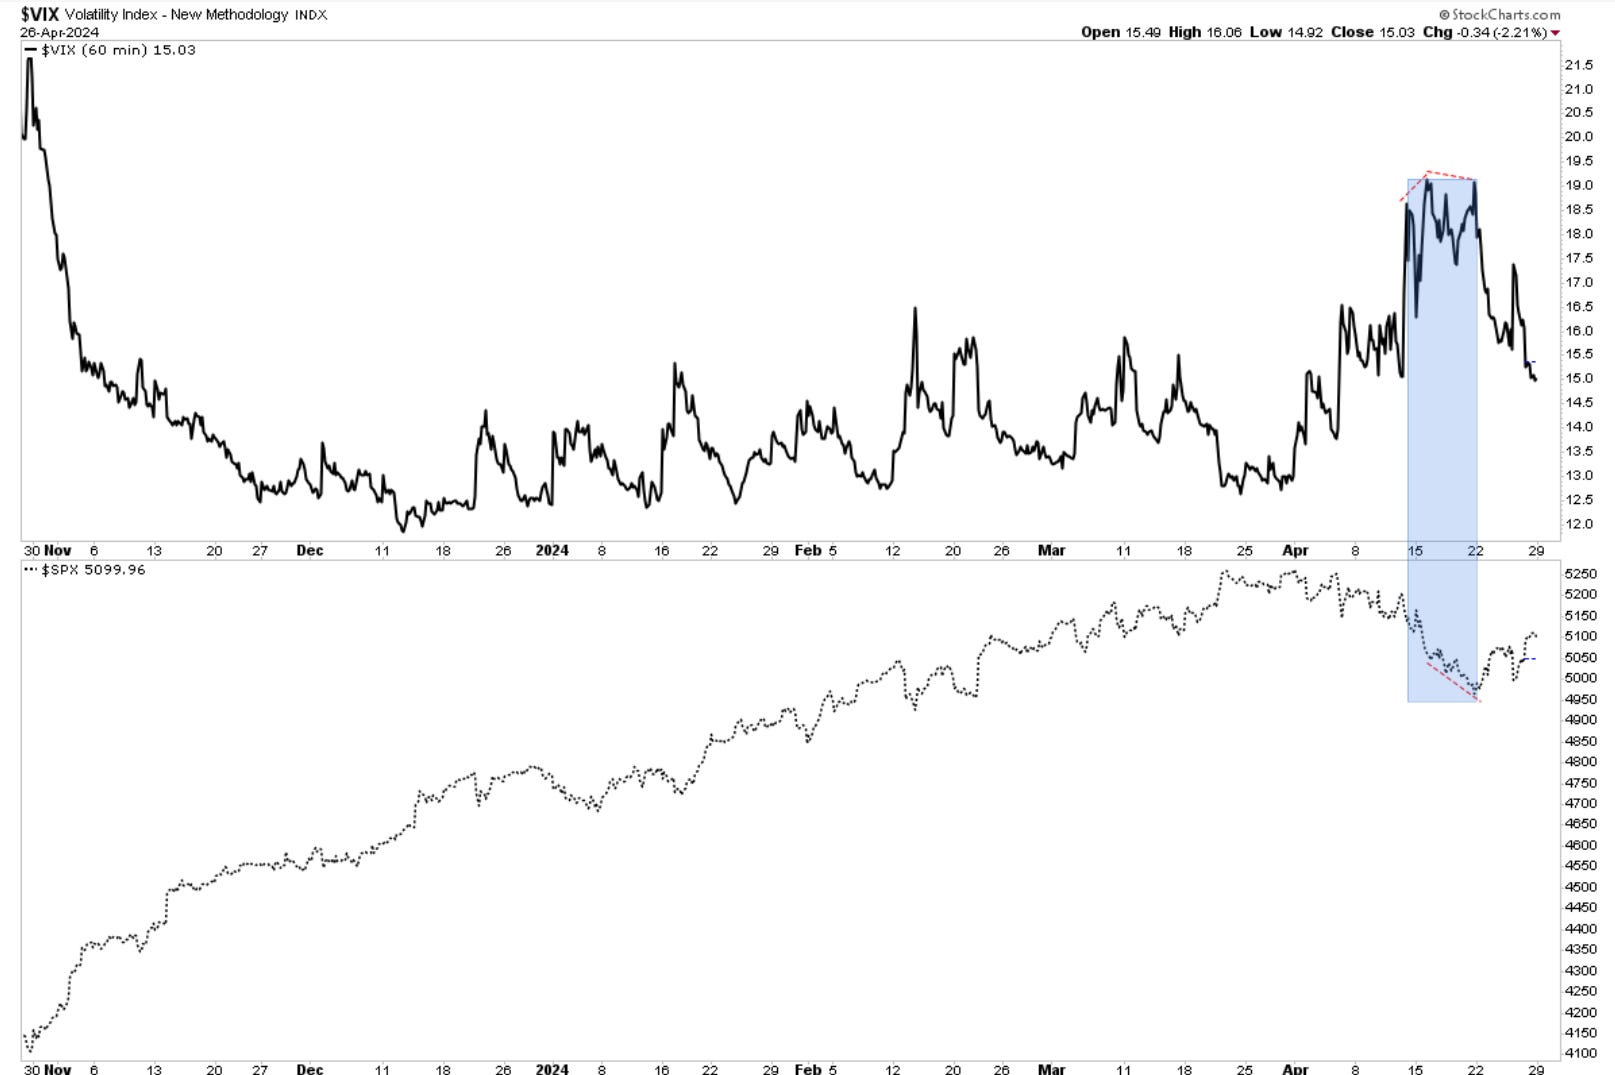
The lack of volatility expansion above 19 while equity prices were moving lower, hinted at the likelihood of an imminent reversal.
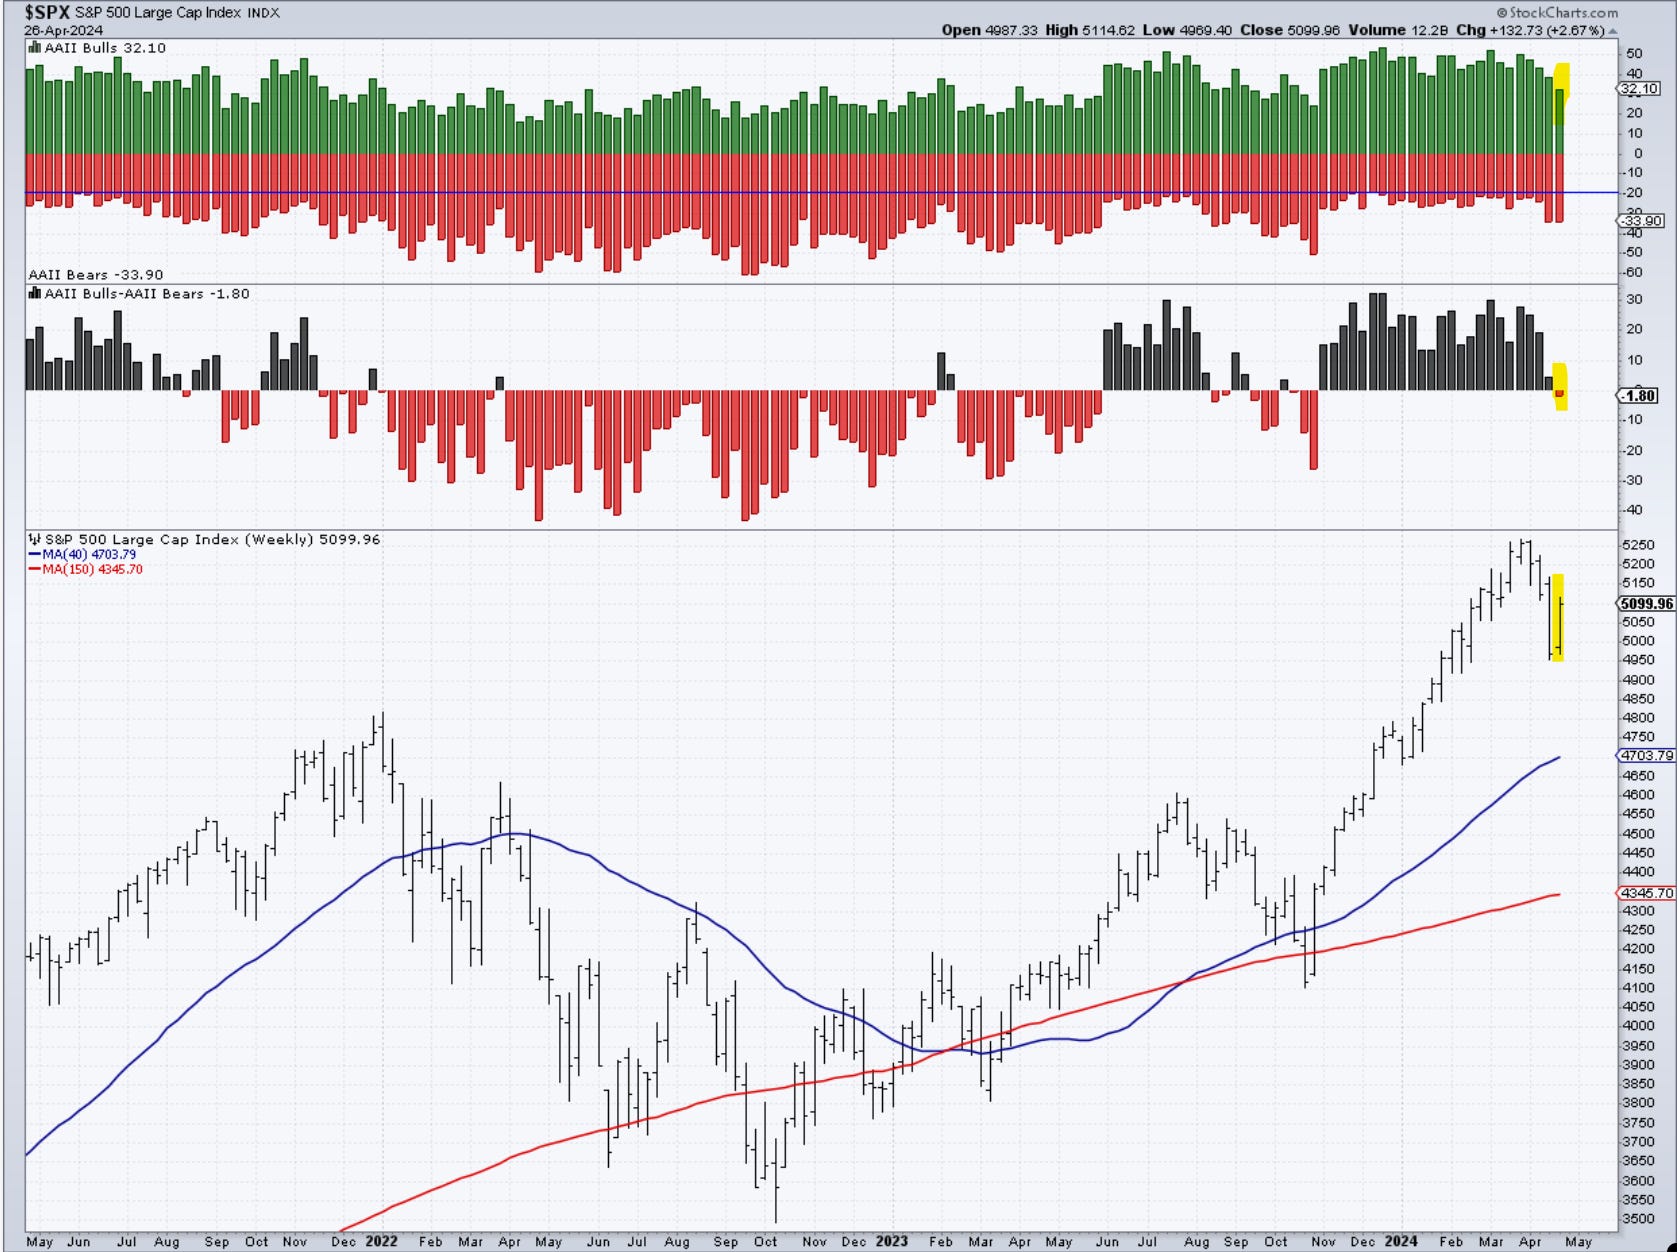
last week - The bullish sentiment continues to correct in the AAII survey. The overall read is still tilted toward bulls but is likely to go negative this upcoming week. This could coincide with a near-term low in this correction.
Update - as anticipated, the bullish sentiment dropped further, cleaning the frothy conditions built in the first few months of the year. It’s not necessarily a bullish read going forward, but now the table has been somewhat reset.
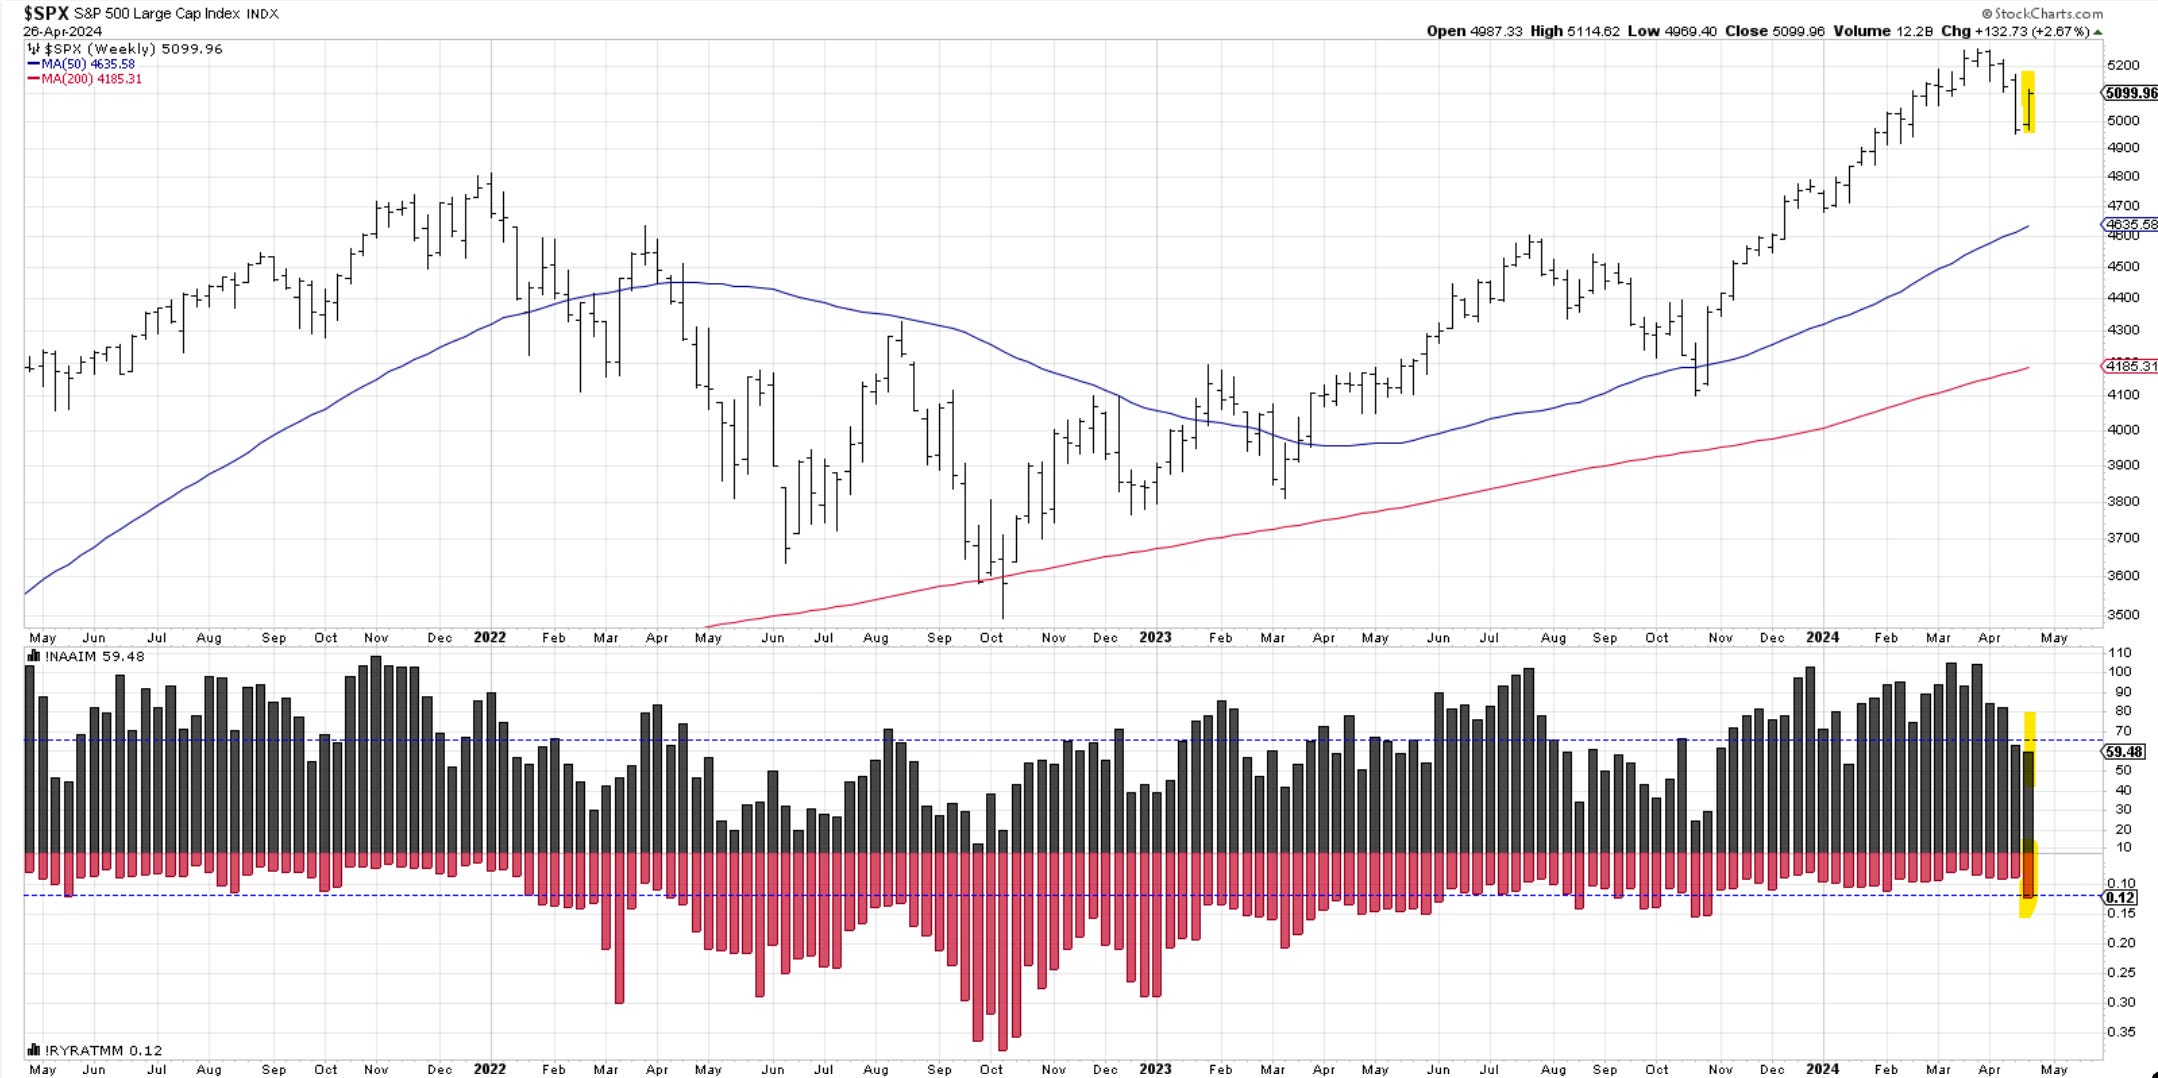
Investment managers further reduced long positions to below 60% invested just as the market found at least a temporary low. If Monday and Tuesday next week manage to push higher, we might see them increasing back exposure.
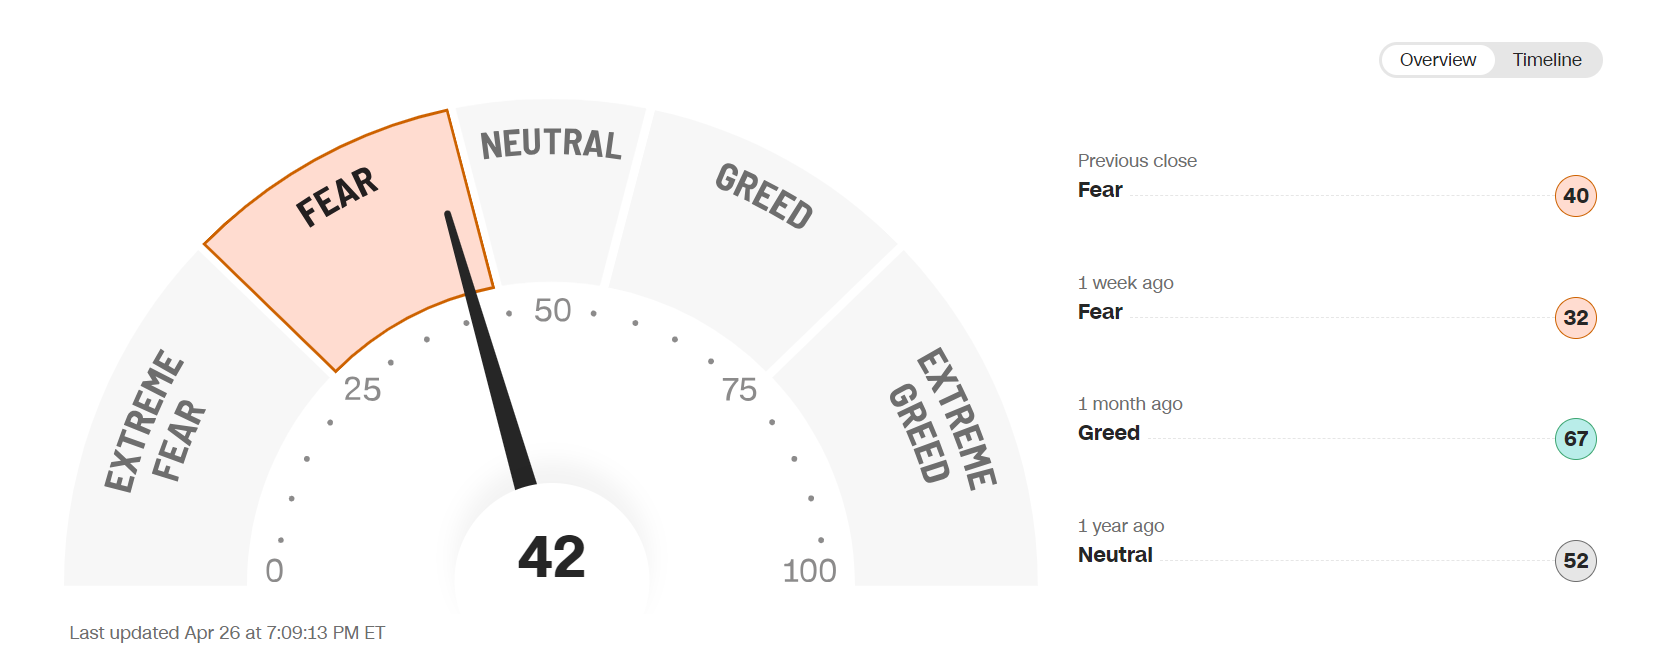
After hitting 32 last week, traders managed to get slightly more excited, pushing back to 42. The selloff was pretty orderly, and the index never pushed into extreme fear.
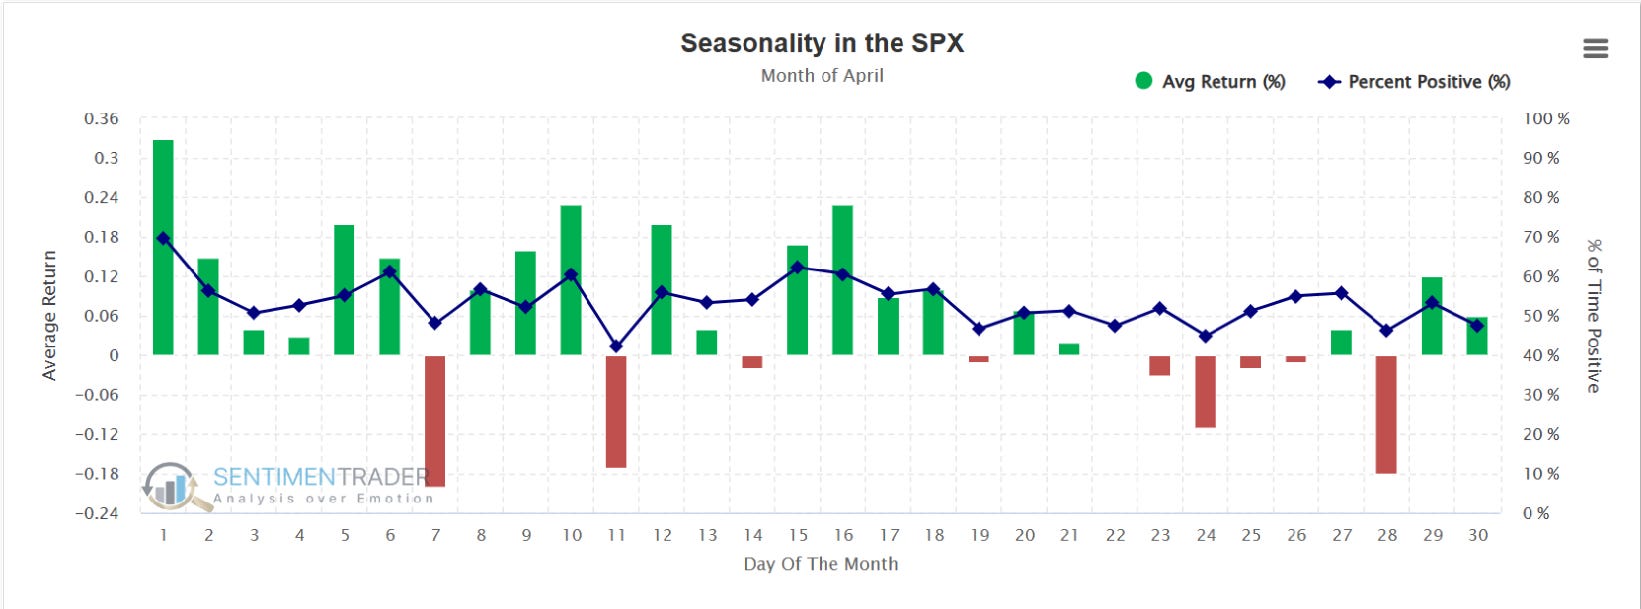
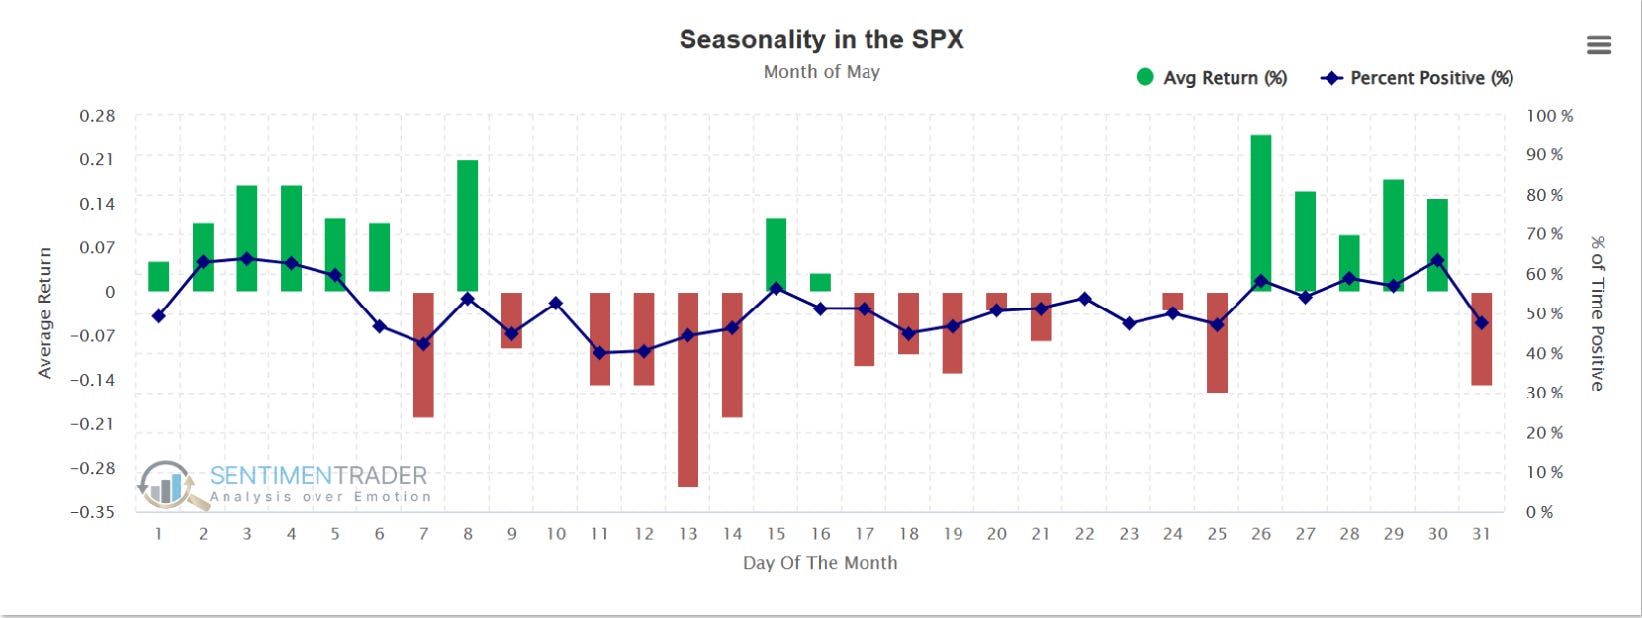
Seasonality
SP500. I will leave April and introduce May in this report. Historical tendencies suggest that the next 10 days will be quite positive. However, it does not have to be like that this time around.
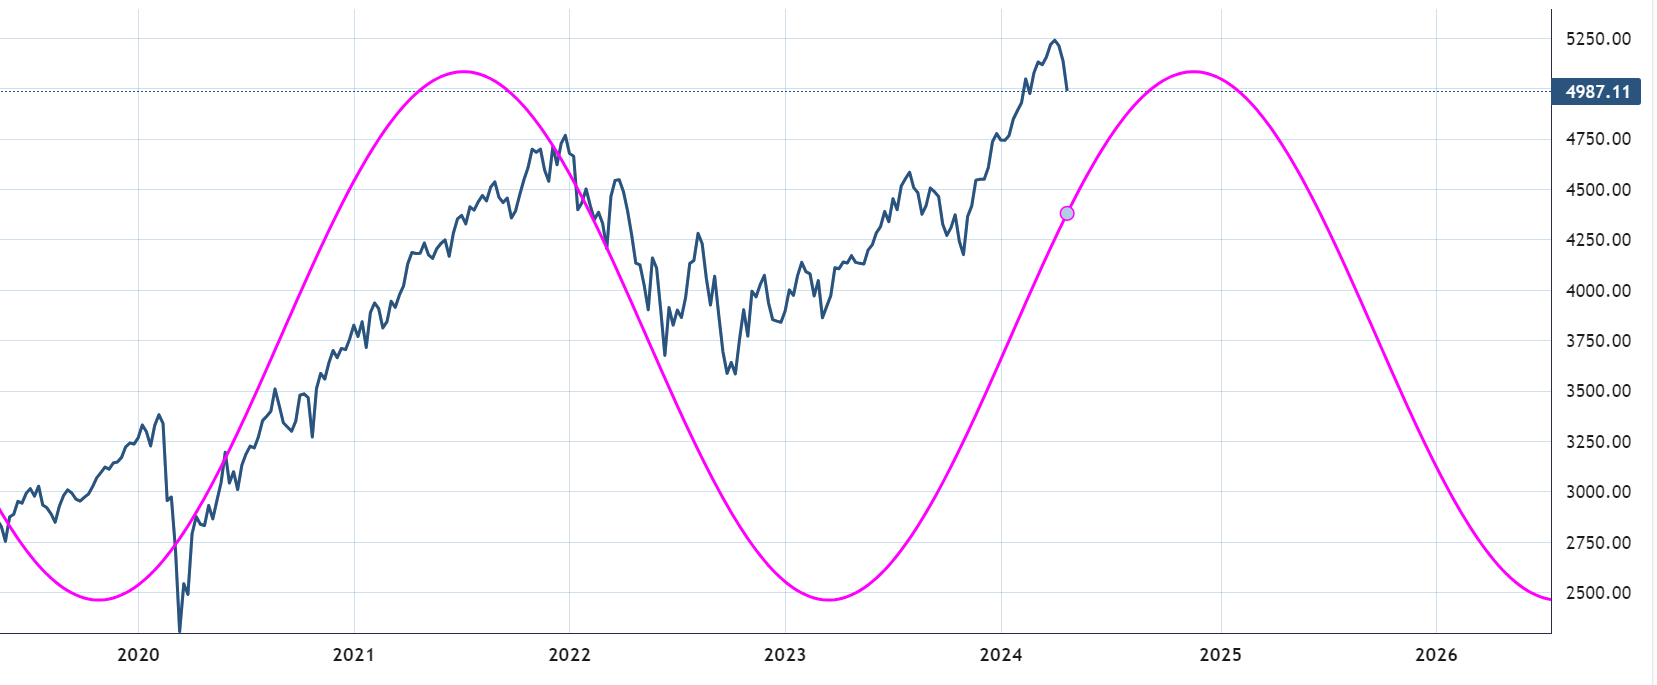
SP500 CYCLE
I presented this 179-day cycle in my work around mid-March. It has started to play out, and it is suggested that it could be extended until early June.
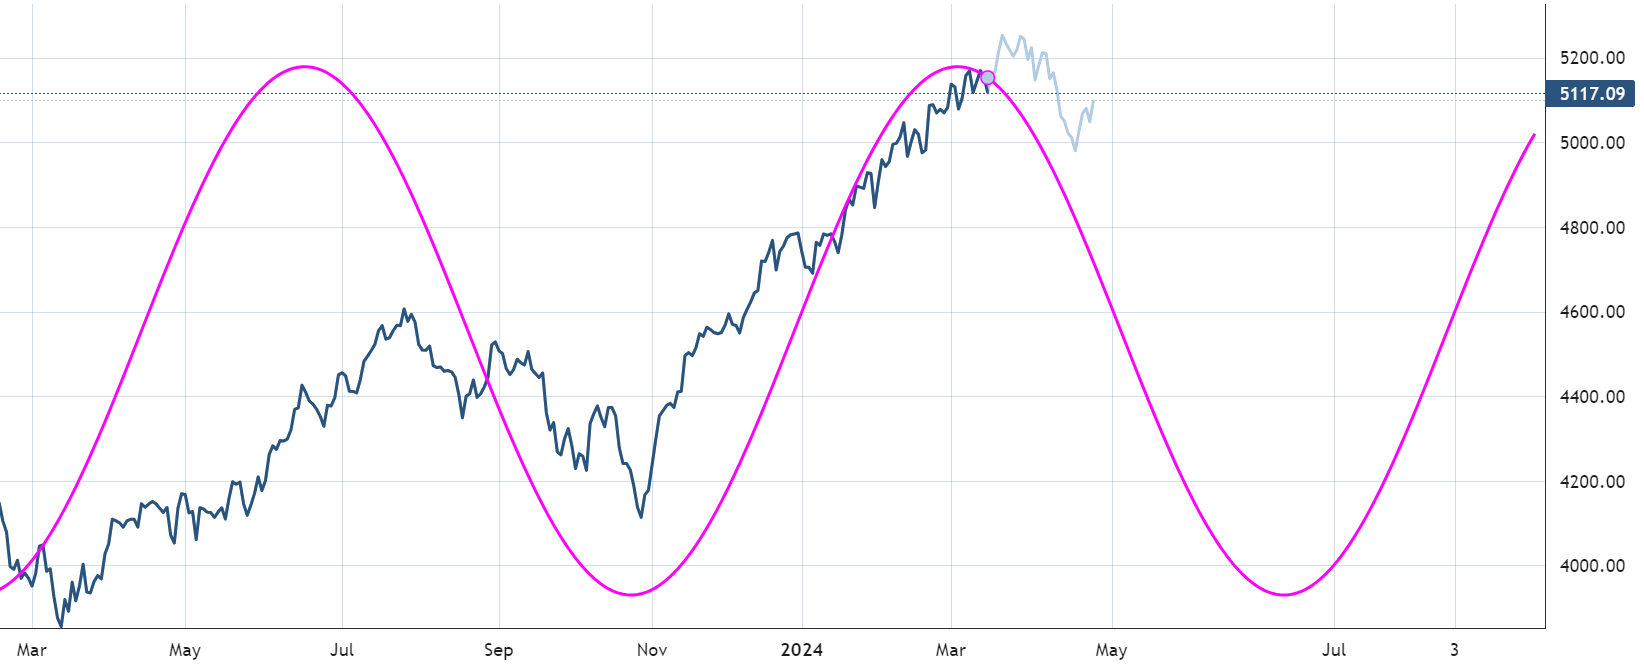
The weekly cycle remains bullish towards year-end.
Price
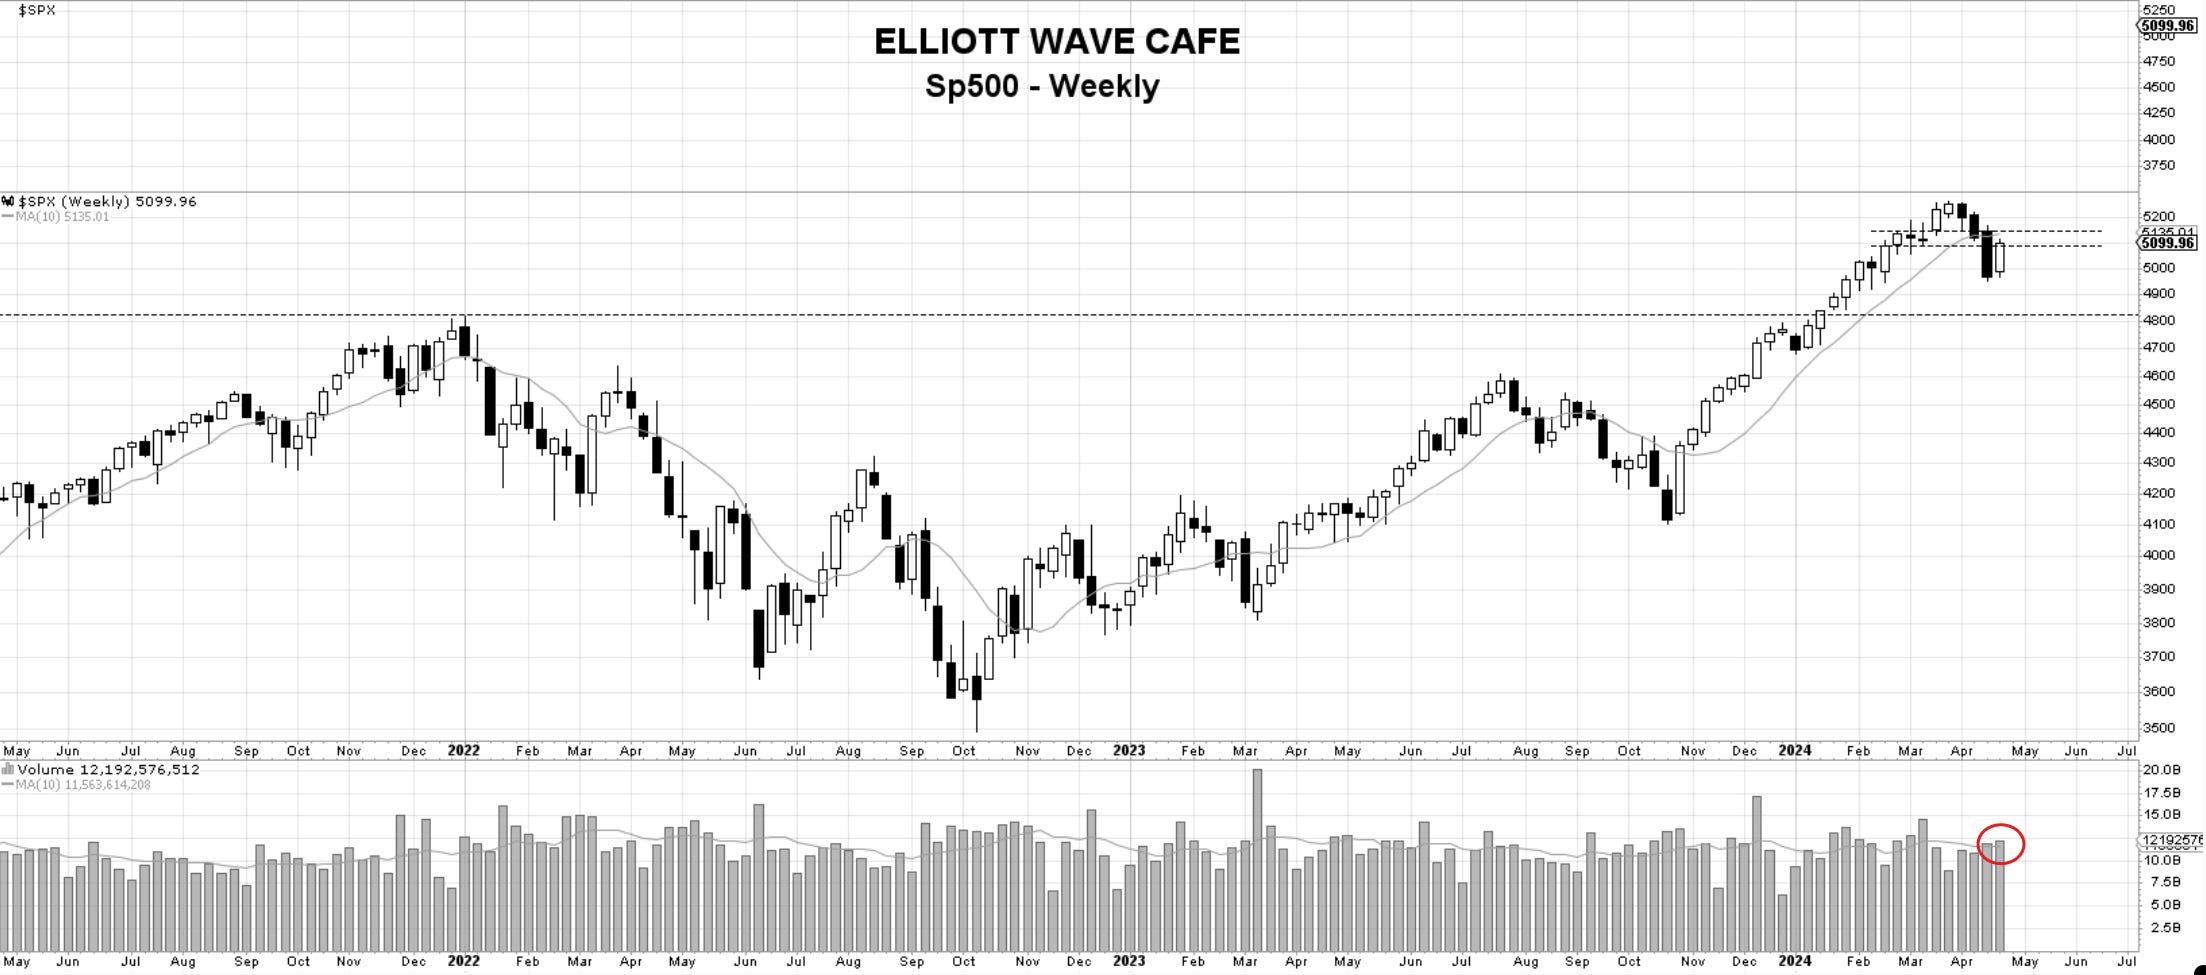
SP500.
A +2.67% rally brings this week to just under the 10-week MA. The move came in on slightly higher than average volume which makes it quite significant. There are still a few upside hurdles that need to be cleared, but bears have now the chance to prove their strength by selling into these resistace levels. If they fail to succeed, watch out above for trend resumption. Follow the daily updates via “The Daily Drip” and videos for step-by-step information on price behavior and investment opportunities.
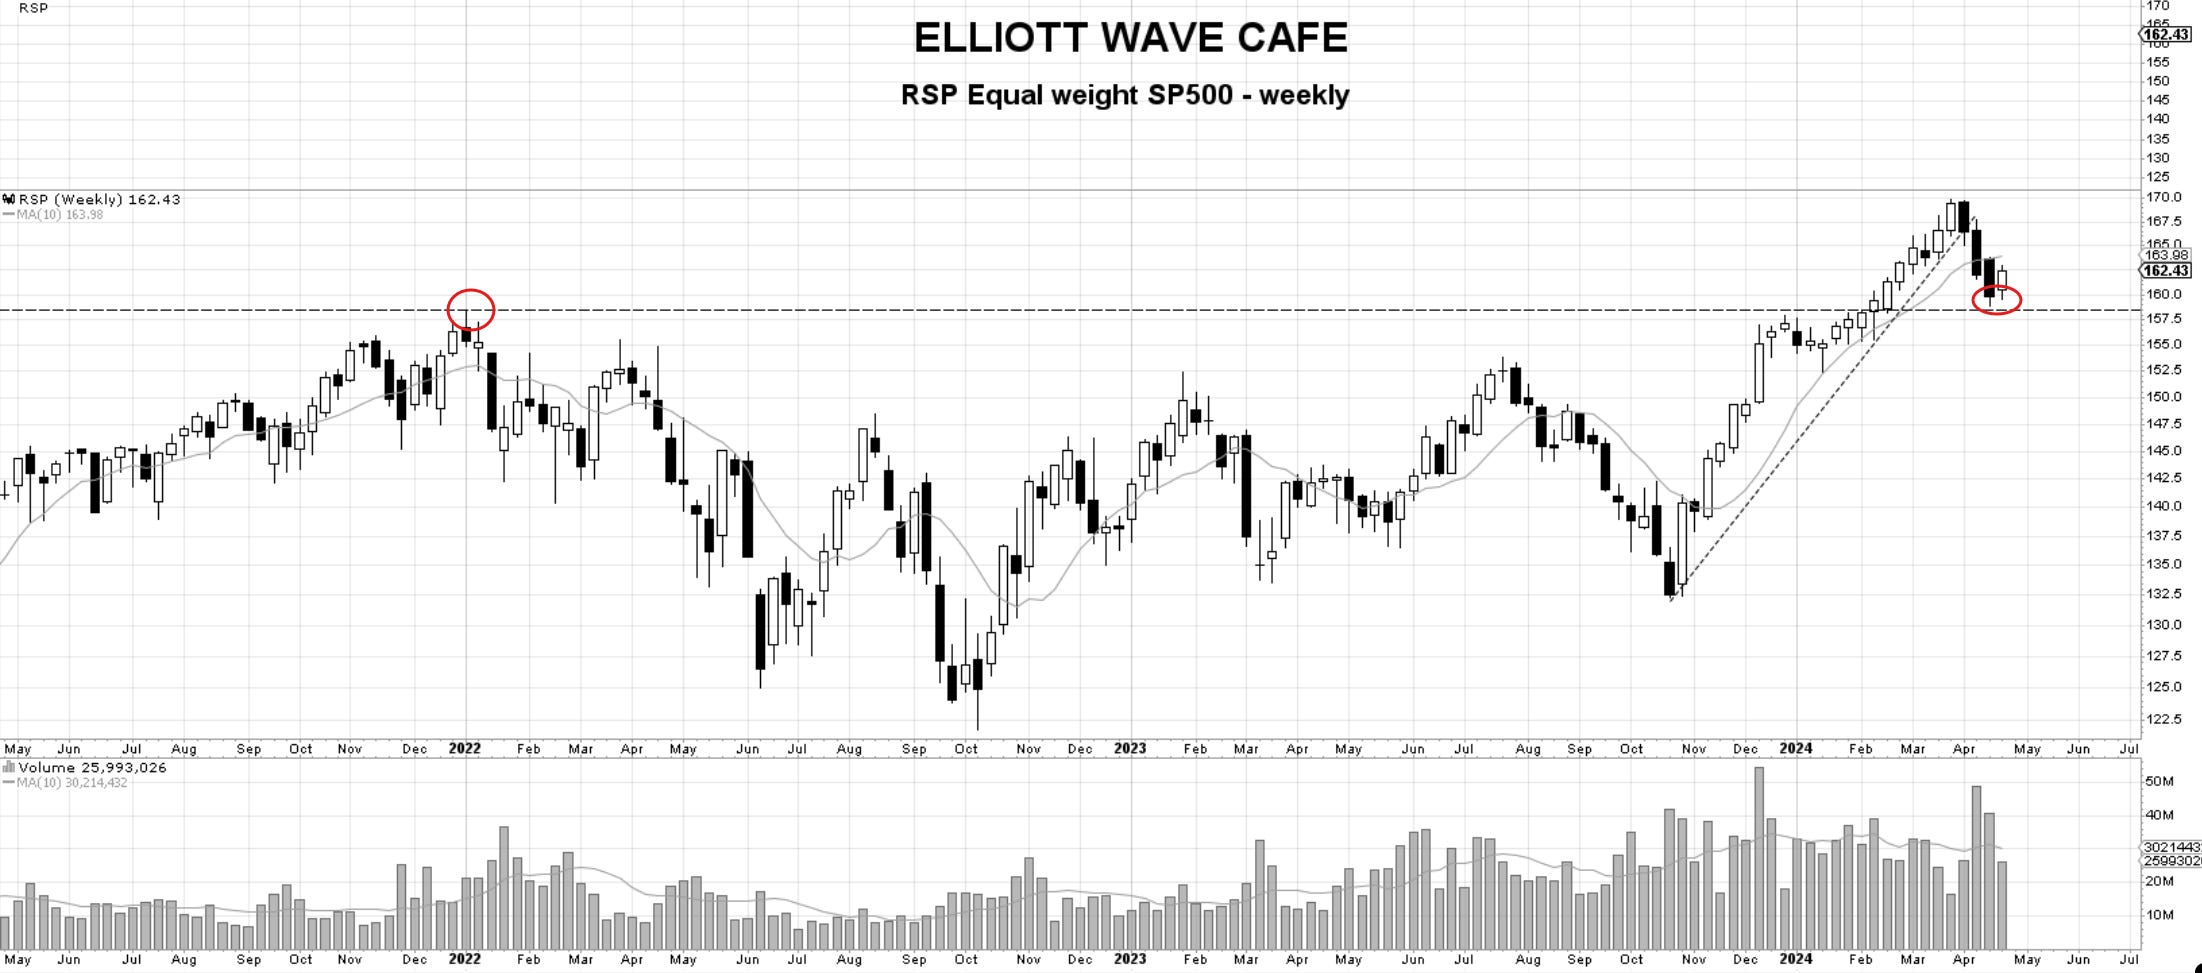
RSP—equal weight SP500.
Last week - The highs from January 2022 were 158.45. The low of this week was 158.83. As you can see below, we will start entering a large demand zone until the 150 zone. How we react from current levels will be interesting to watch over the next couple of weeks to see if demand comes in. Getting back above the 10-day MA would be a positive sign.
Update - Demand came in and pushed prices higher by +1.64% this week. Holding above 2022 highs is important. However, the volume here was lower as most of the heavy lifting was done by a few large stocks in the cap-weighted index. Getting back above the 10-week MA will be seen as a positive sign by investors.
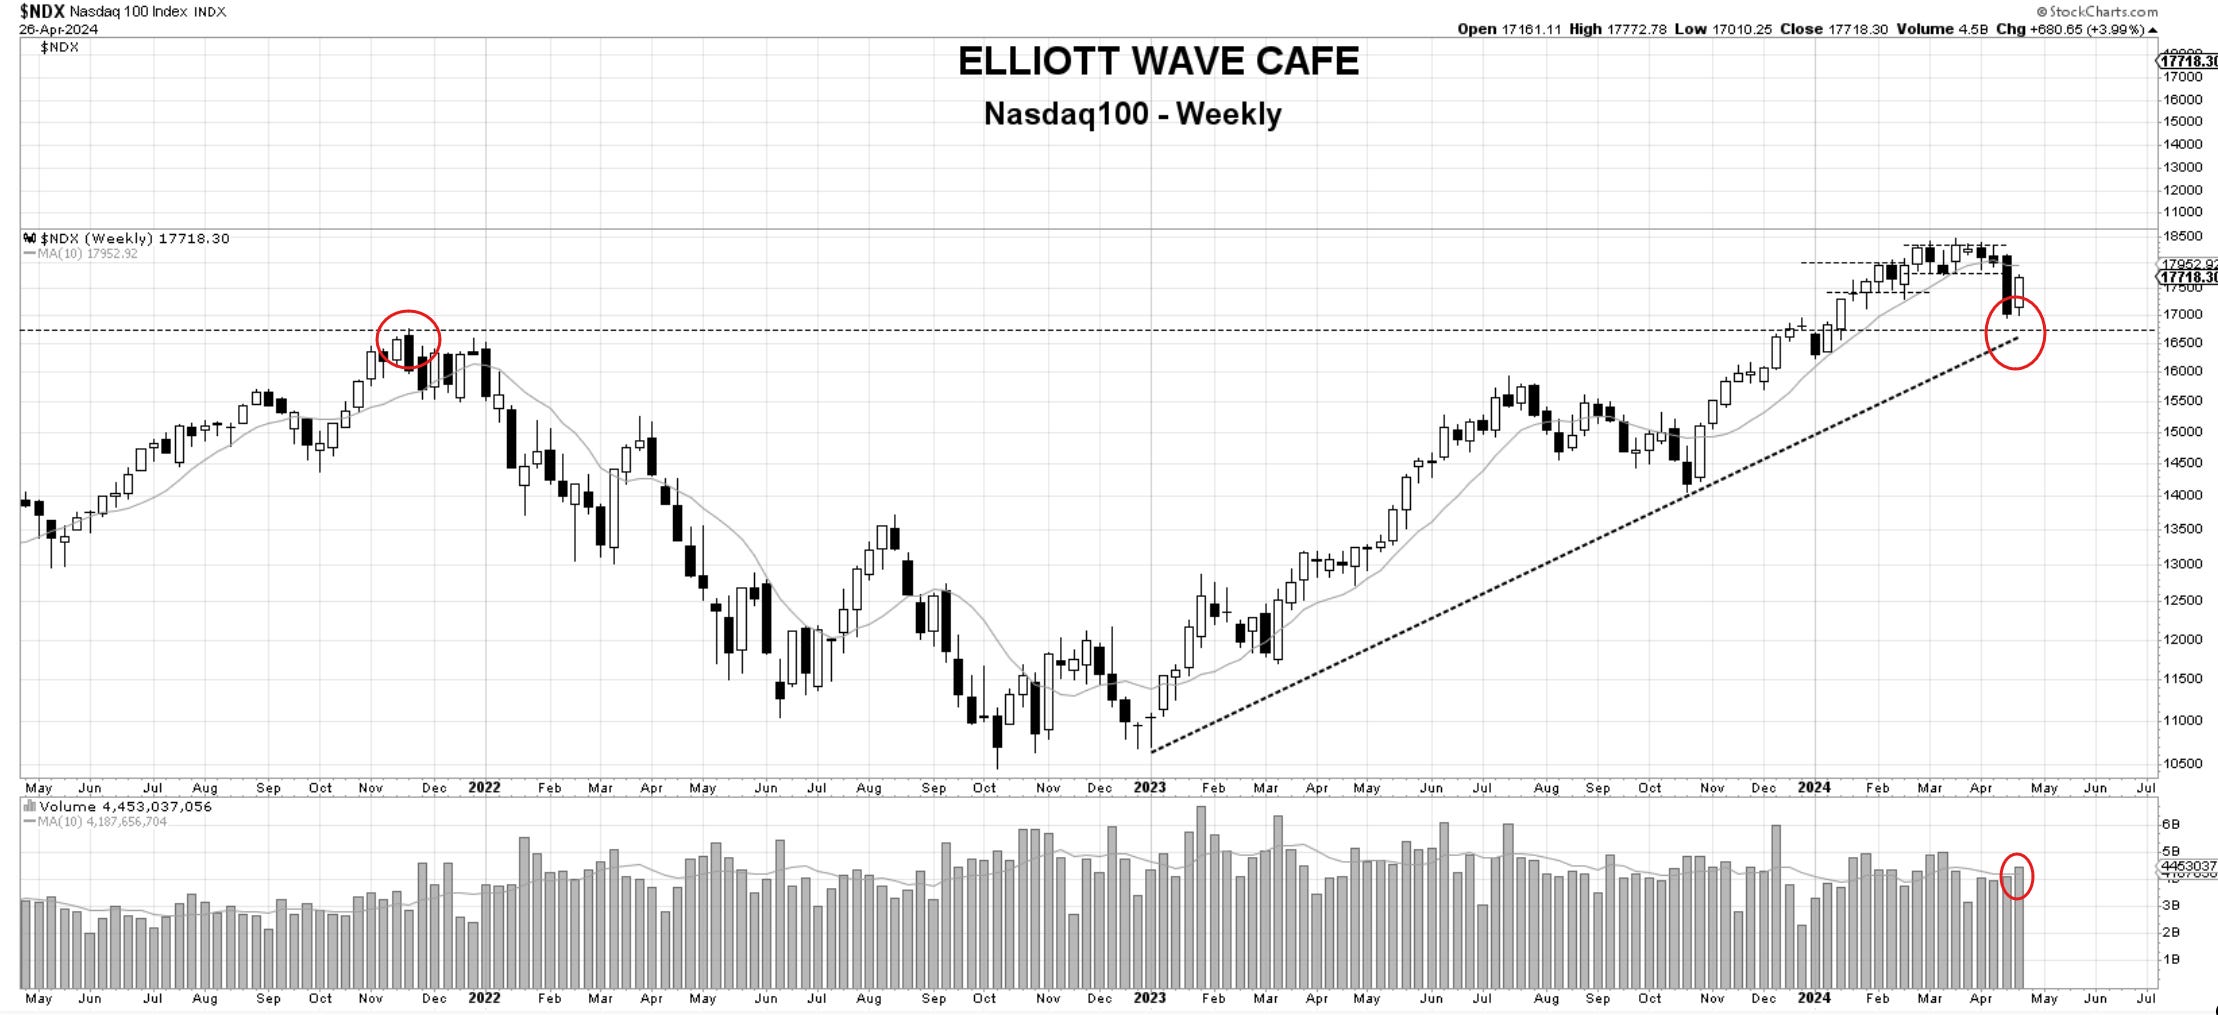
Nasdaq100.
The market came close to reaching the 2021 levels and the trendline but fell short of doing so. The rally is stopping just under the dotted resistance lines on the chart and below the 10-week. The volume is decent and in the plus column for the bulls. Bears have the overhead resistance to rely on and they might heavily cover if that gives way.
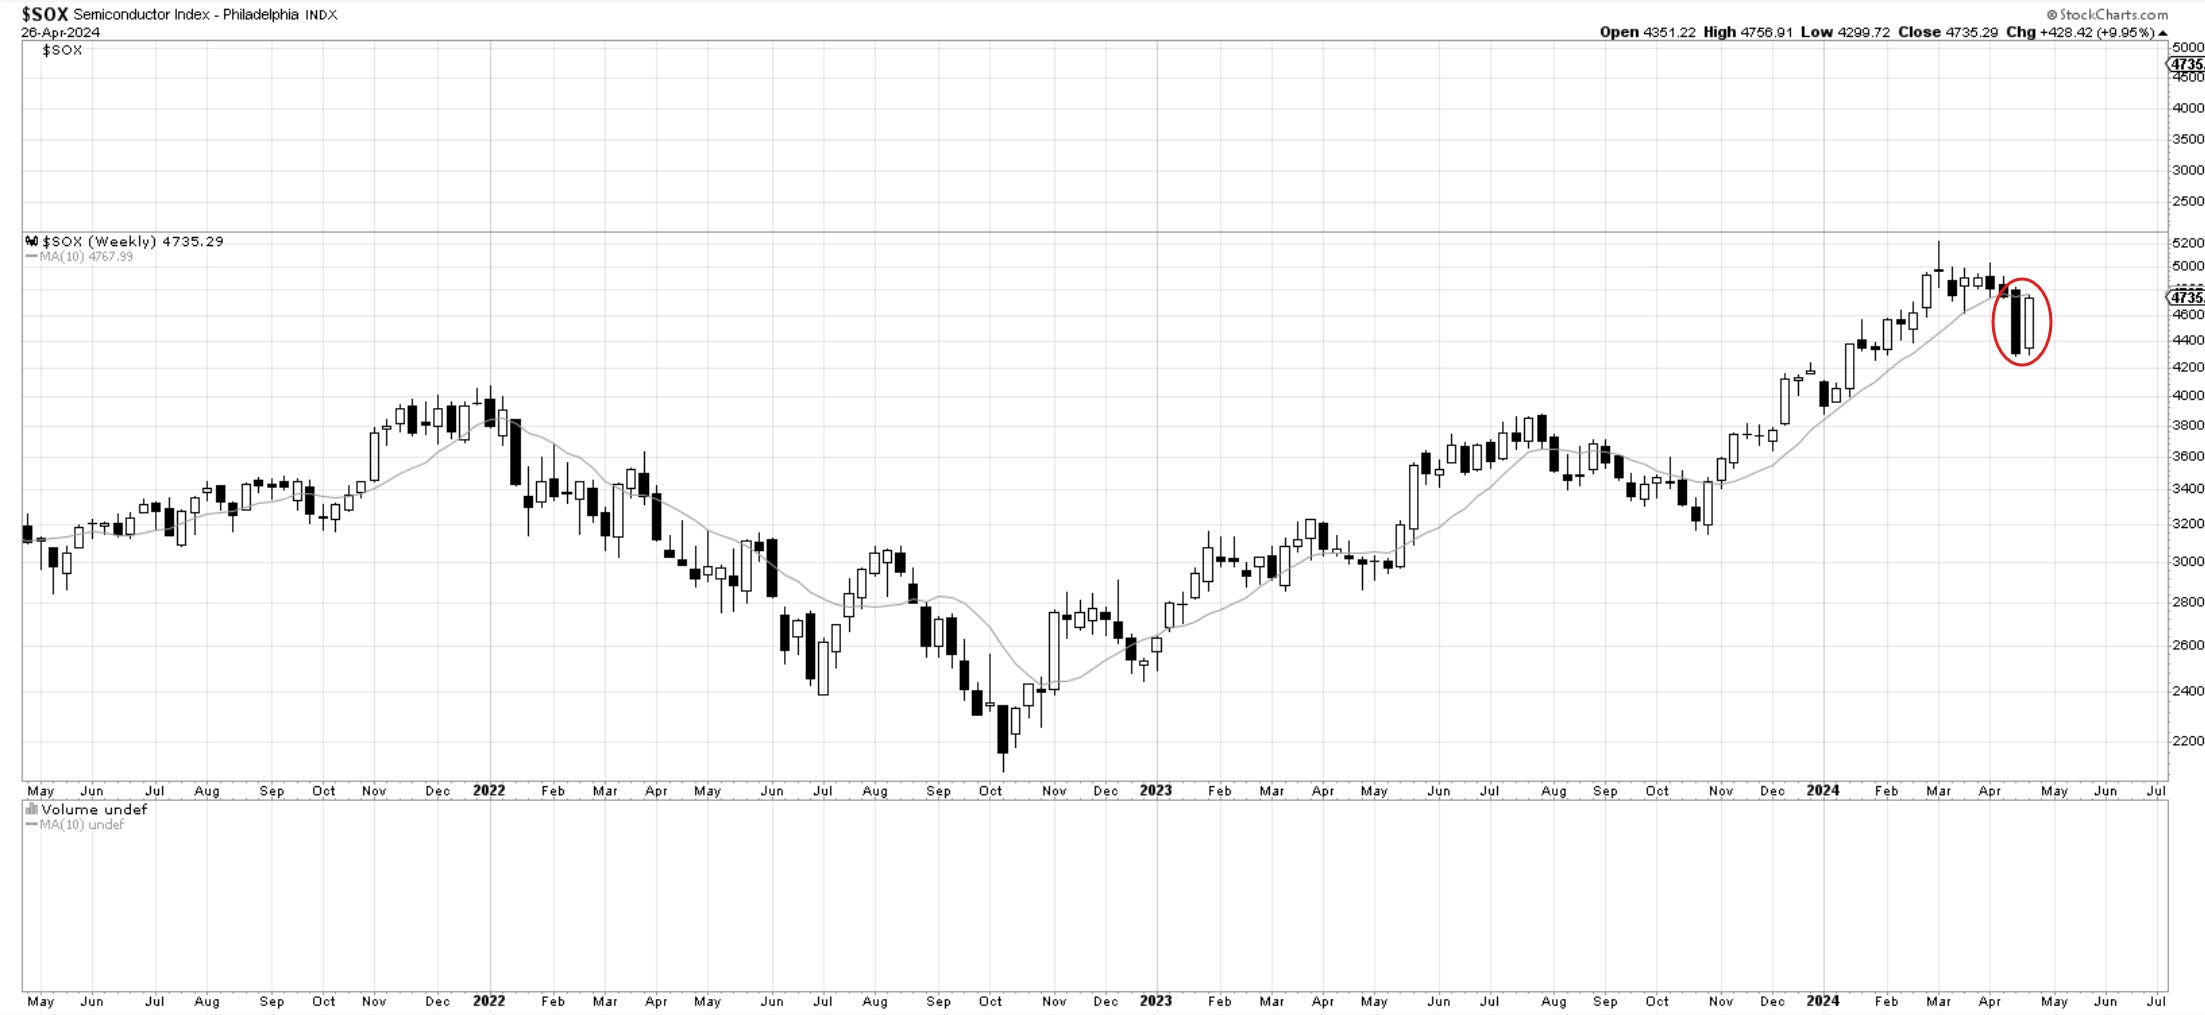
SOX - Semiconductors
It is impressive to see the price action in semiconductors almost engulf the prior week. If this was just a simple 3-wave correction that met heavy buyers, the anticipation would be for much higher prices. A move above 4950 would be key.
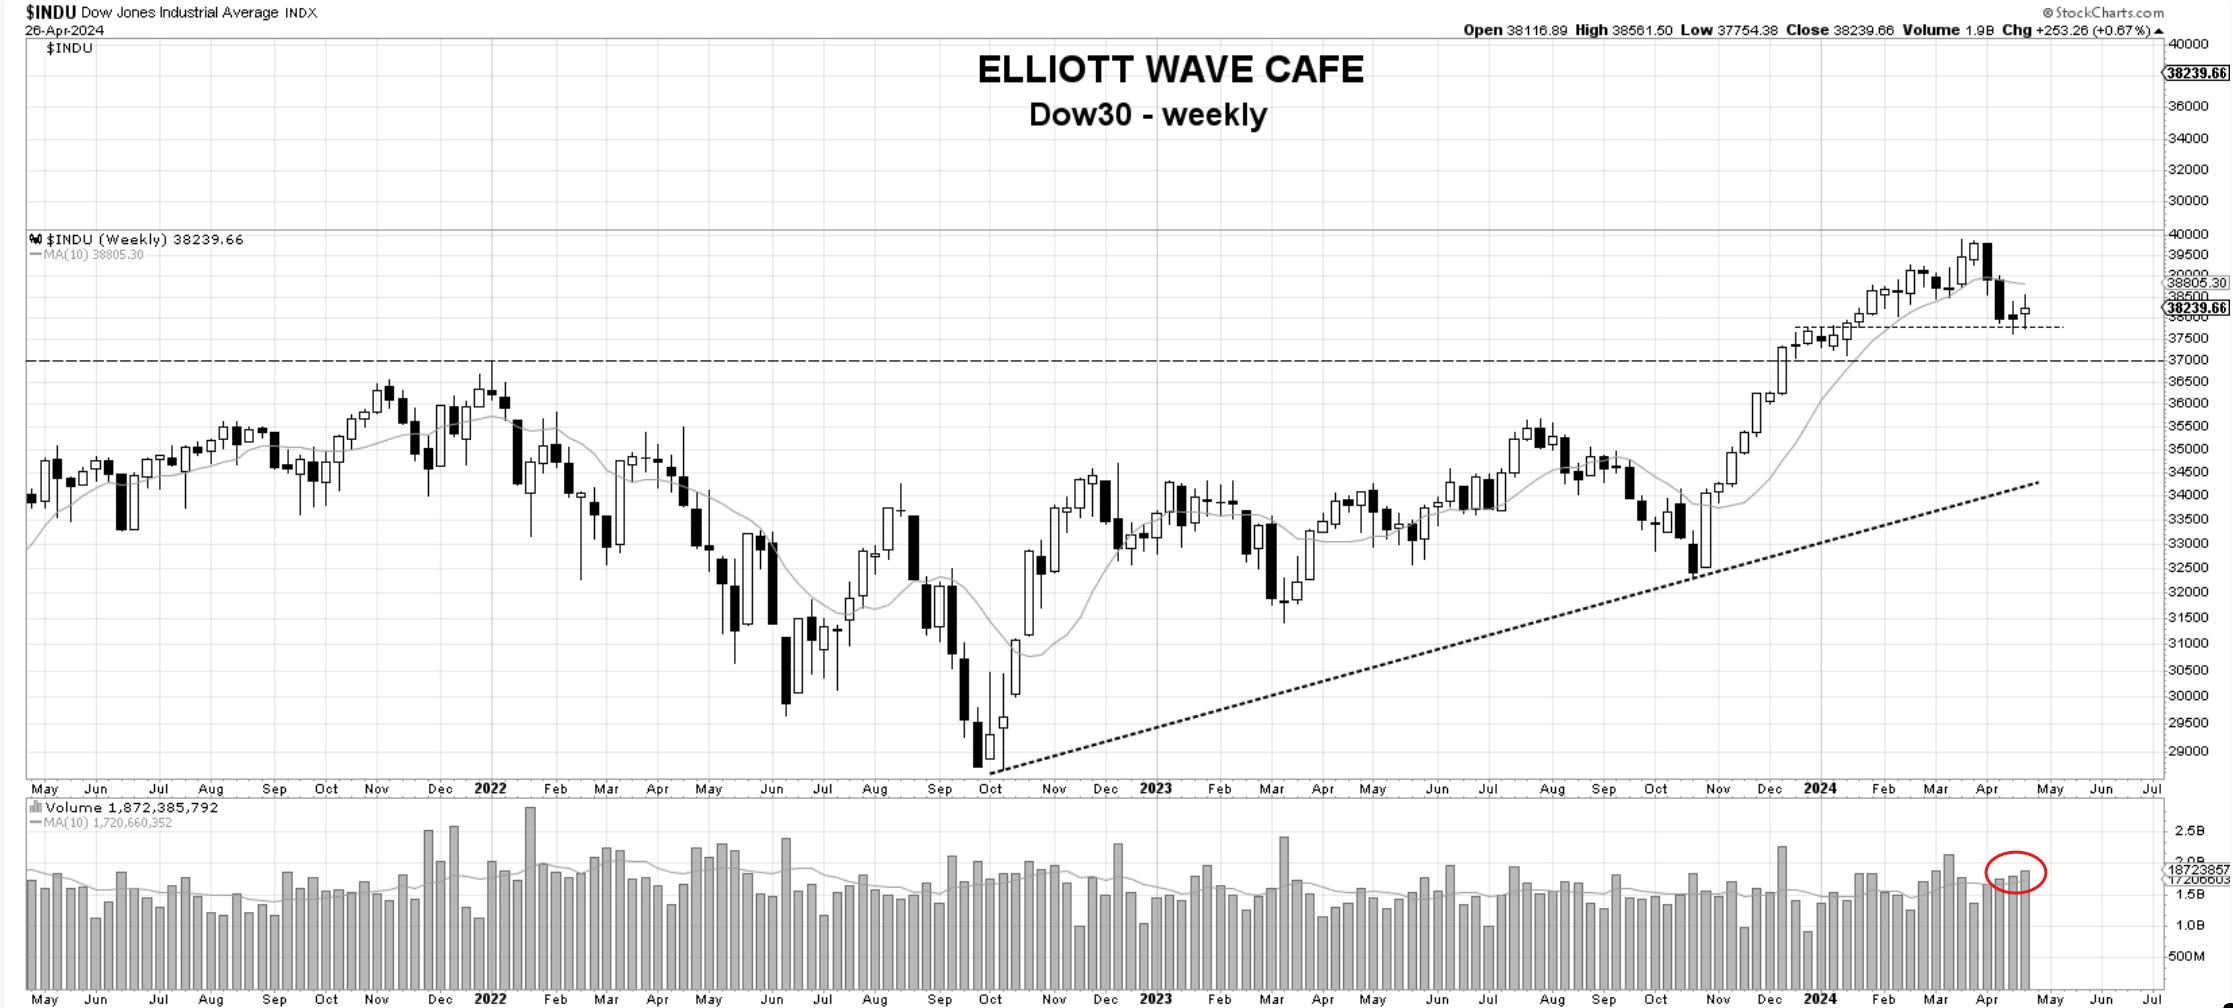
Dow Jones 30
There was nothing too impressive from Papa Dow, but it continued to hold that 37,800 zone. The volume is coming in as well on this support. A strong close next week would be a great signal to get back on the long side.
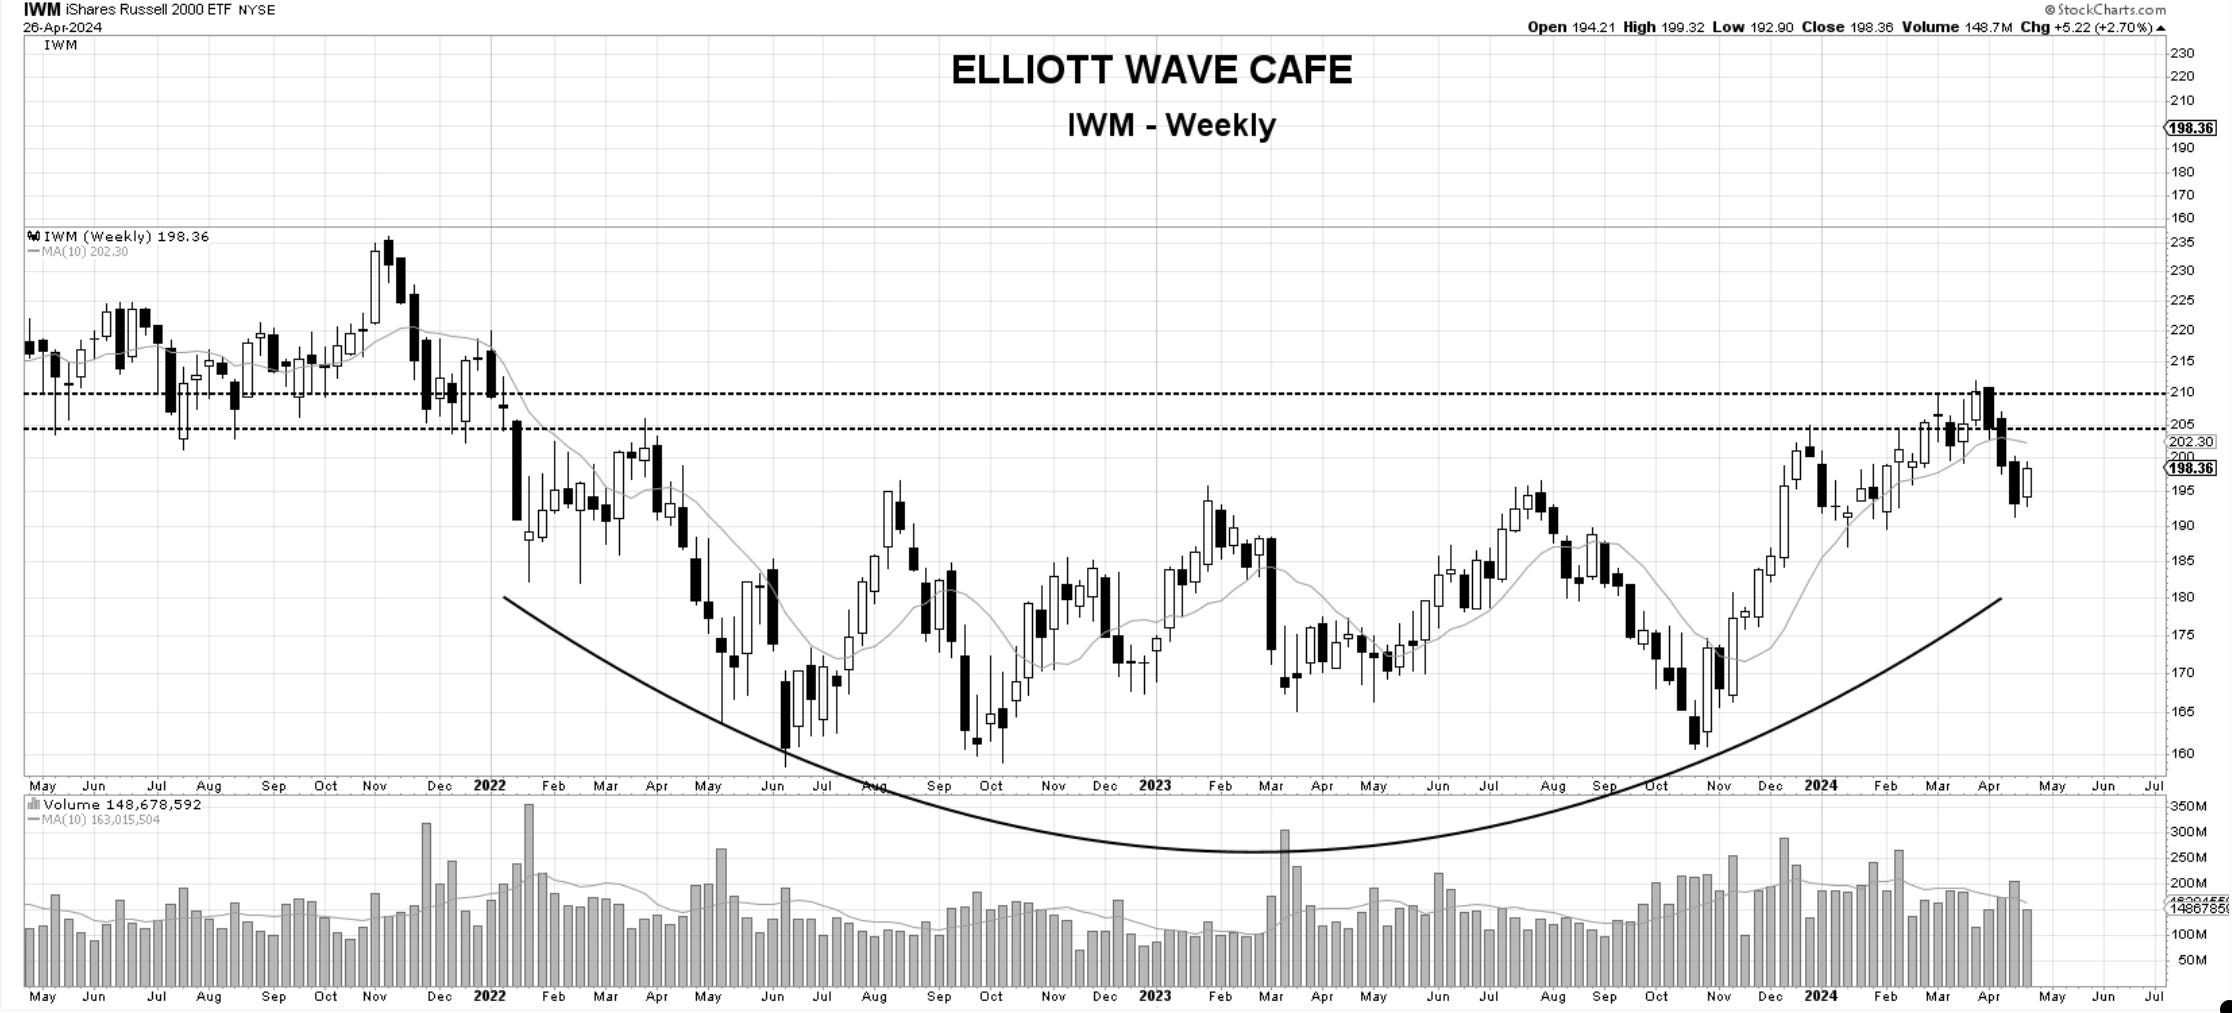
IWM—small caps.
As commented last week, support came in, but the volume is lackluster, continuing to show the timidity in this sector of the market. The higher yields don’t benefit these stocks. However, if I see prices crack 205, I am willing to nibble.
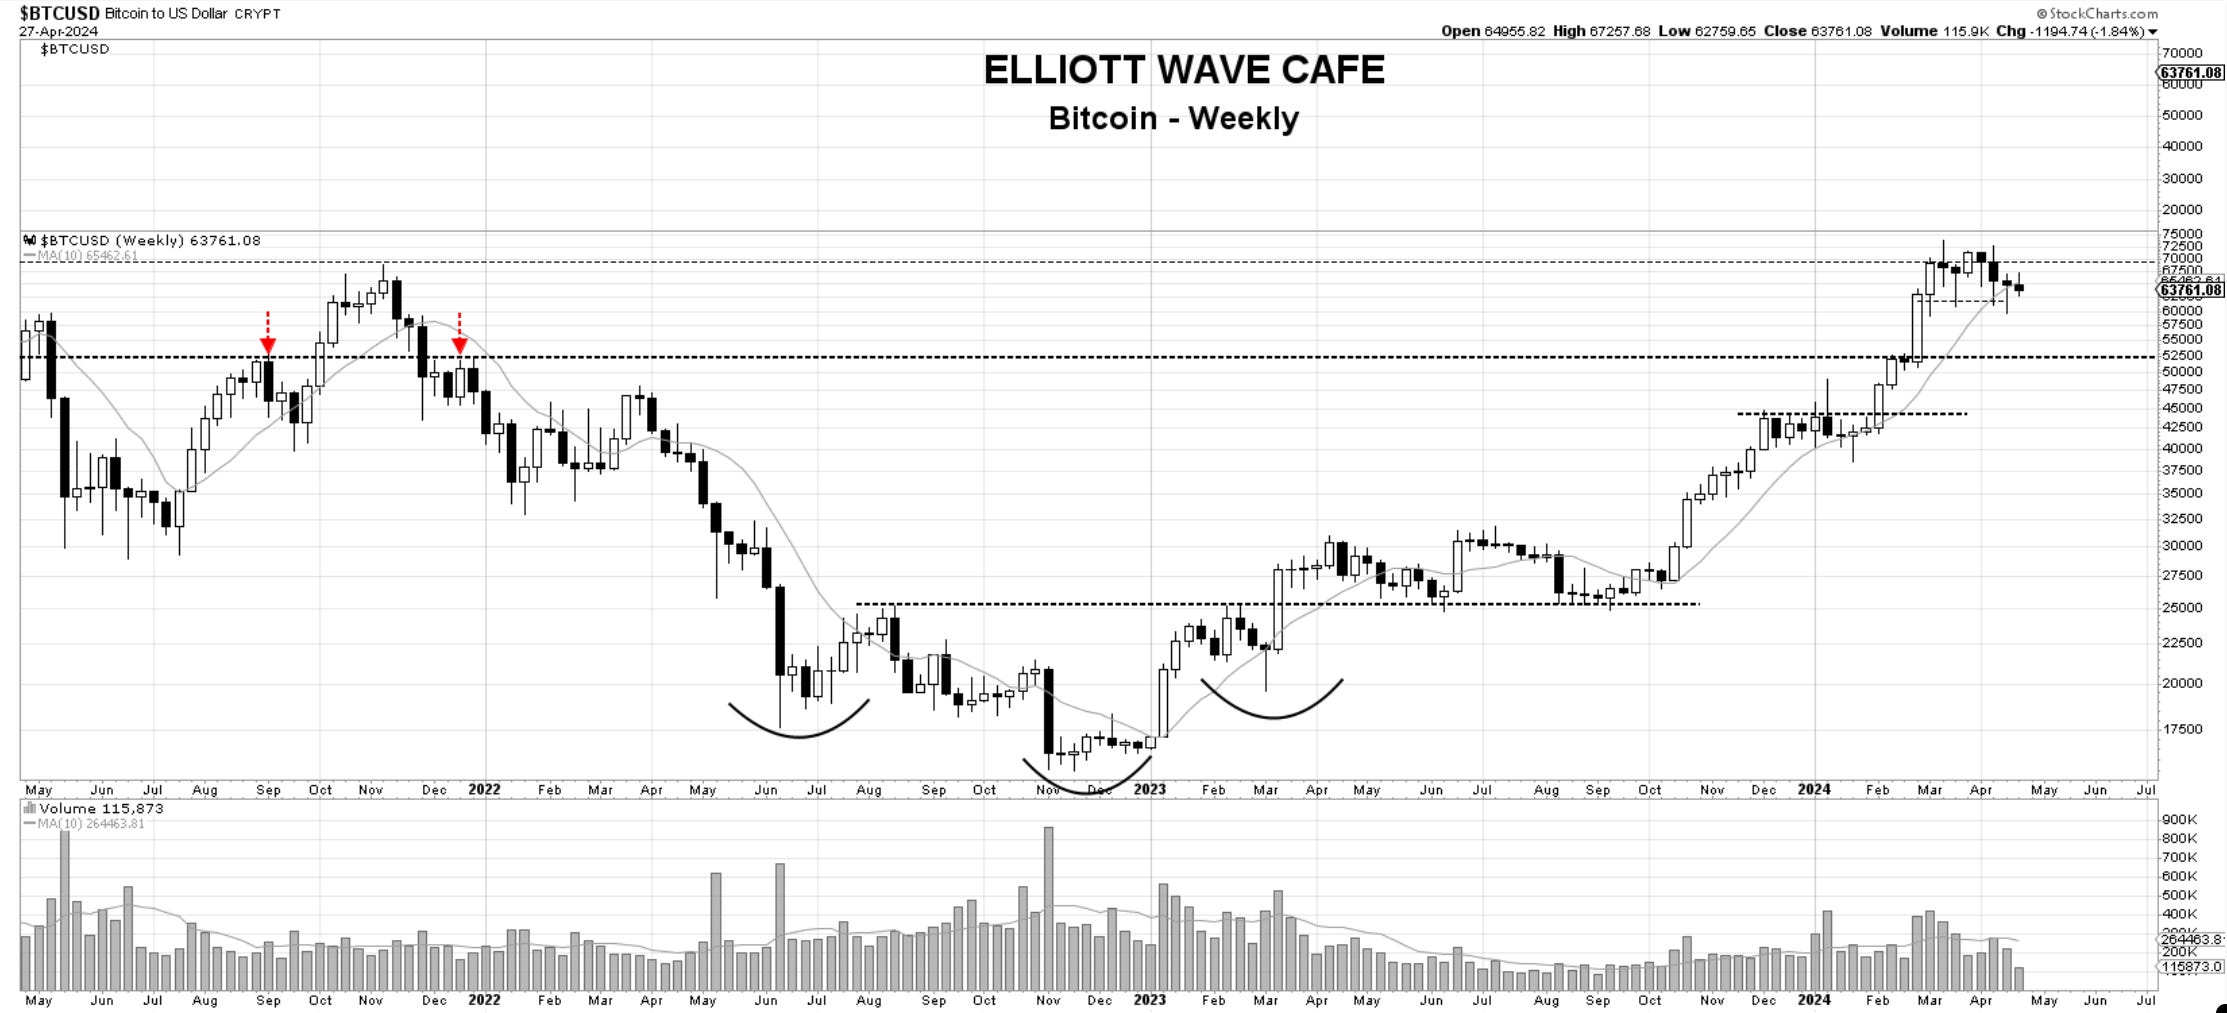
Bitcoin
Bitcoin remains in a corrective phase following a 65% rally from the latest breakout. Low volume as prices correct continues and it is welcomed. If we do break above 70k with participating volume, I will be lining up to start buying. Until then it is a watch for me. Follow the daily updates and videos for more info on price behavior and EW counts.
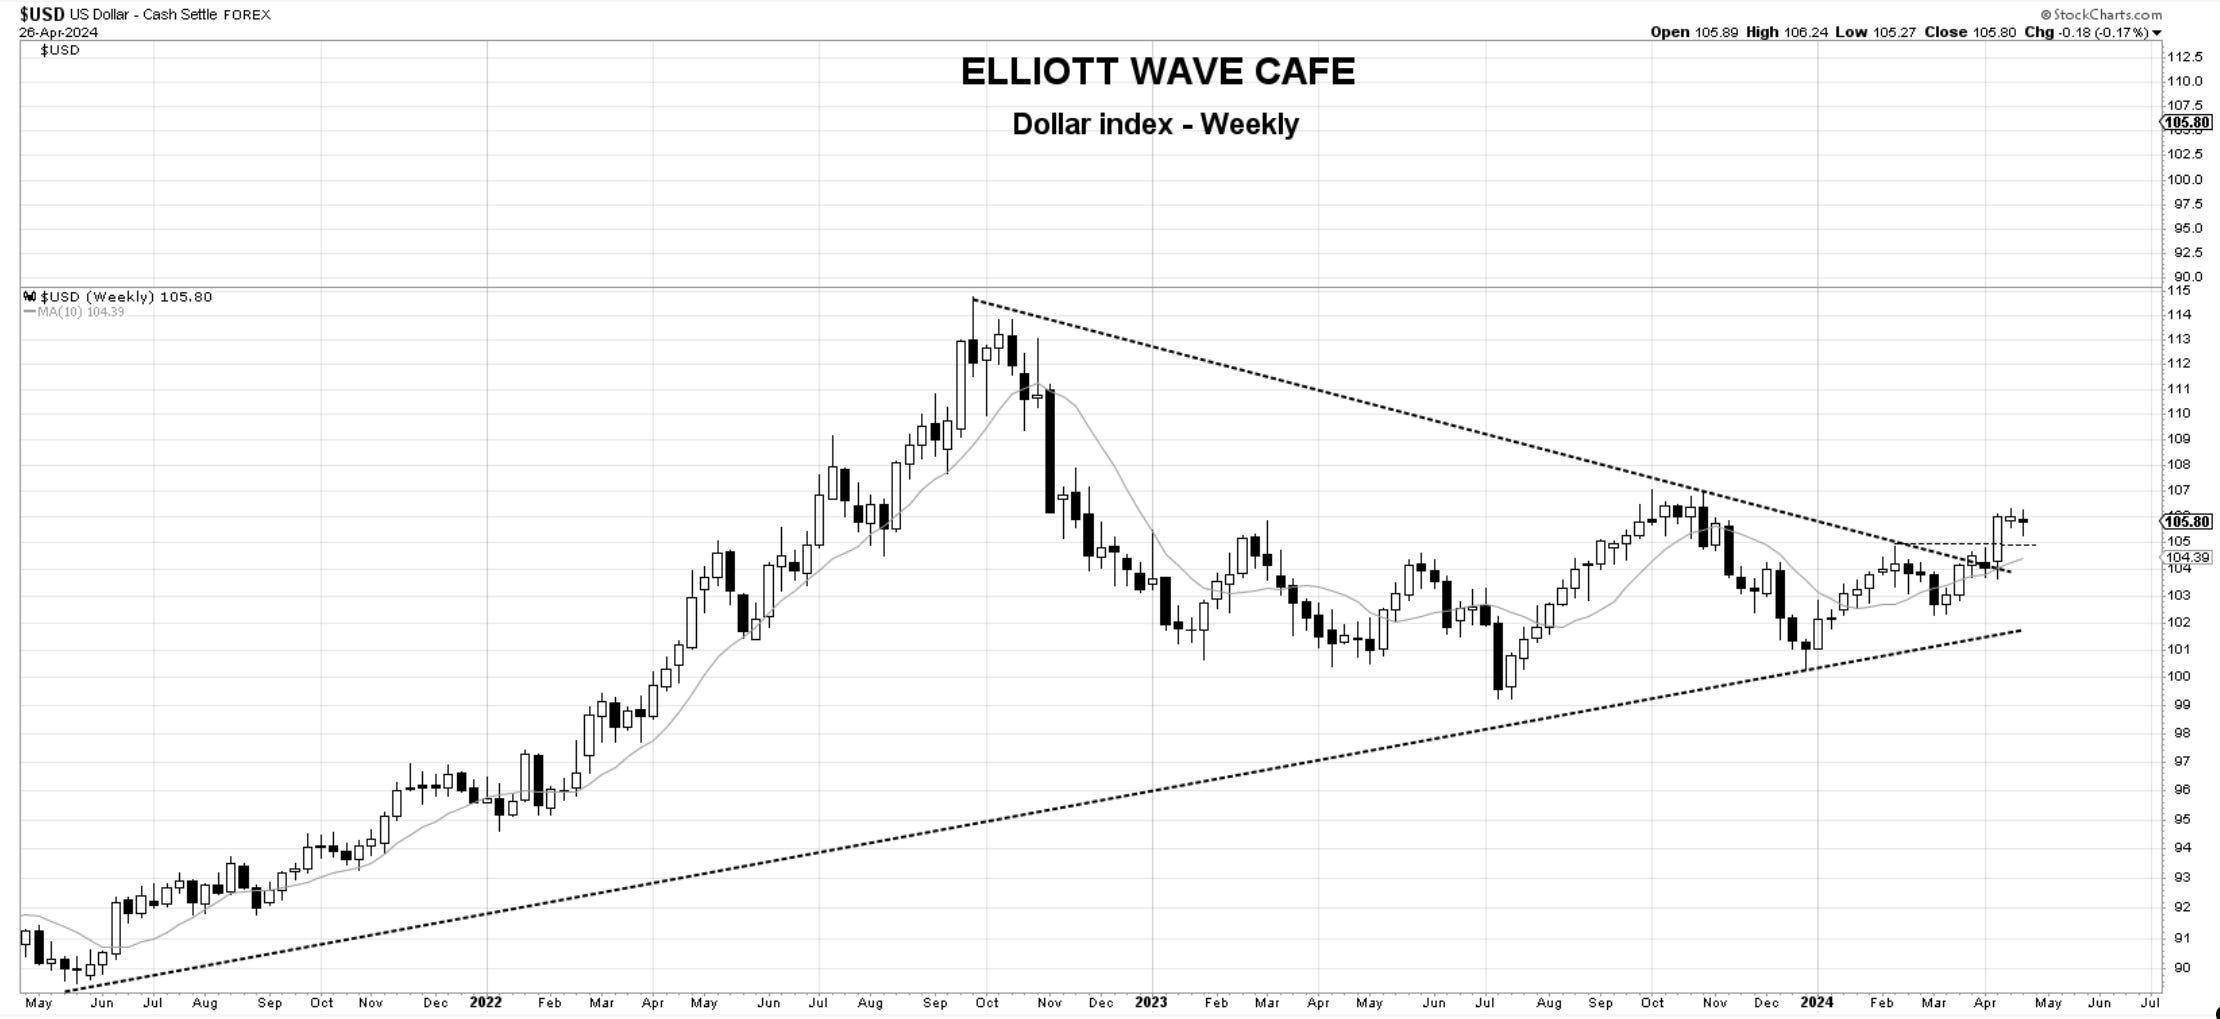
US Dollar—The greenback has shown nothing worth discussing this week. There are no signs of failure or strength. The outlook is bullish above 107 and bearish below 105.
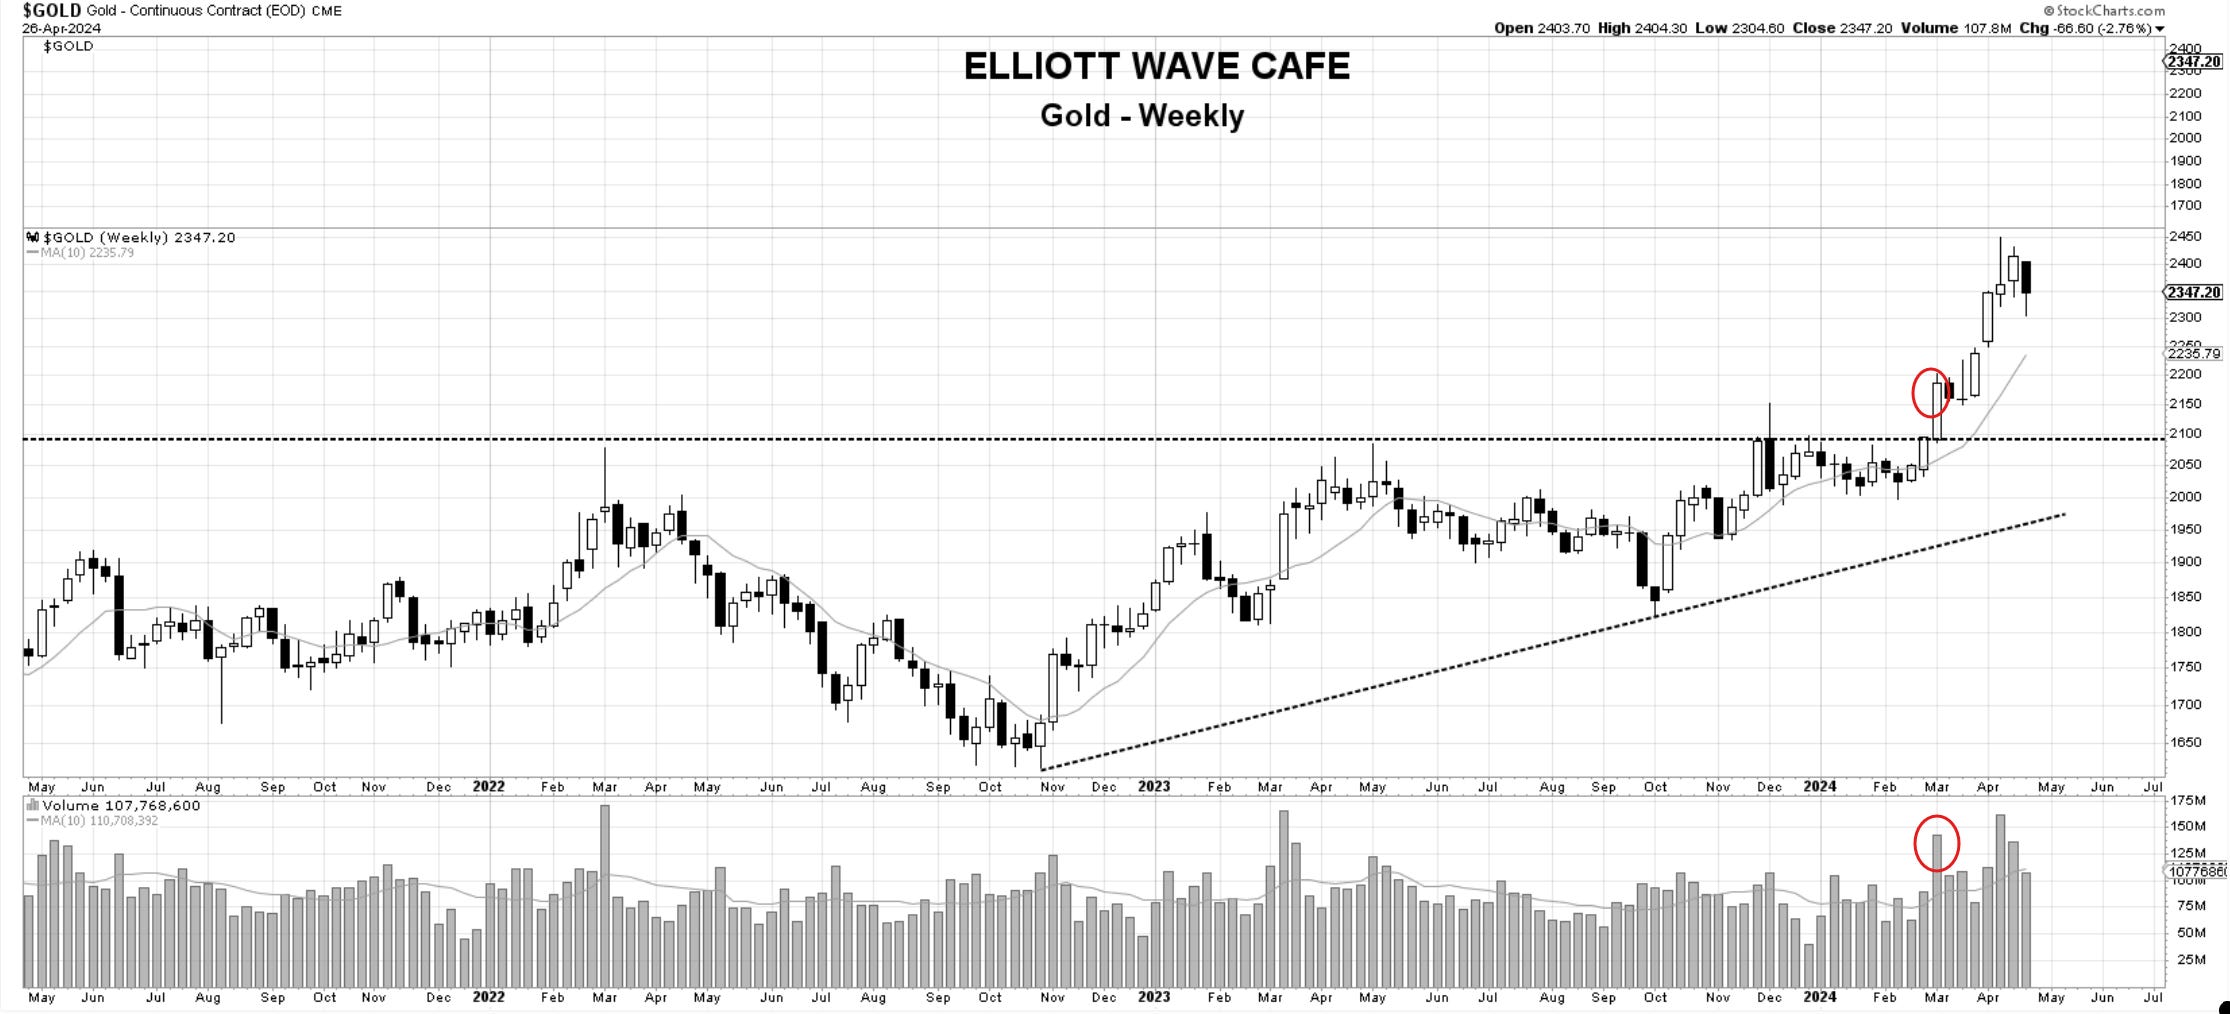
Gold
When Gold broke out the week of March 4th, it did so with plenty of power. It has had a stellar performance since then, and there are really no signs of giving up on it. We are dropping correctively on low volume, likely just to consolidate before the next advance begins. I would use the 10-week as a guide, and as long as it’s pointing higher, long is the way to go.
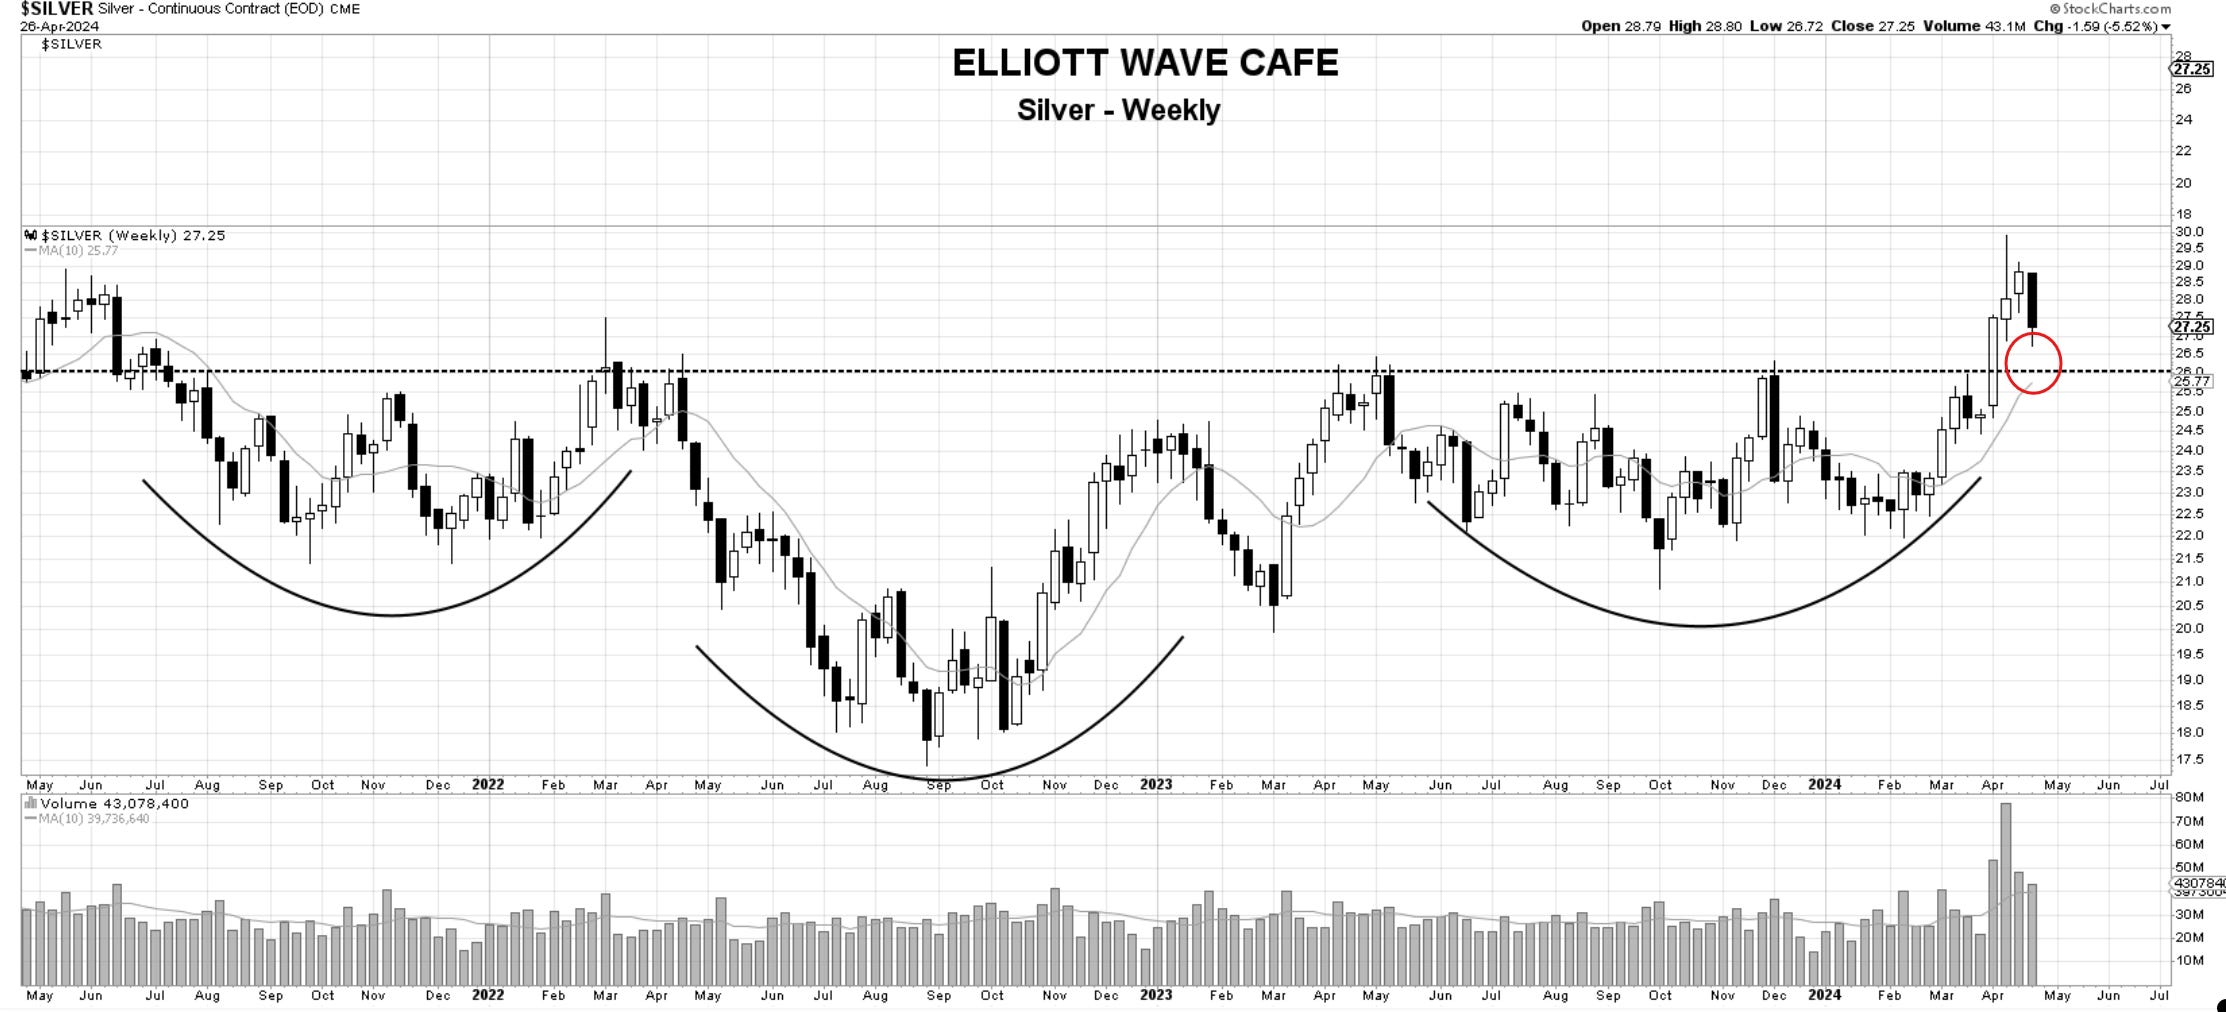
SILVER
Keep an eye on it as it returns to the scene of the breakout. It might offer opportunities. I will update you on our daily coverage.
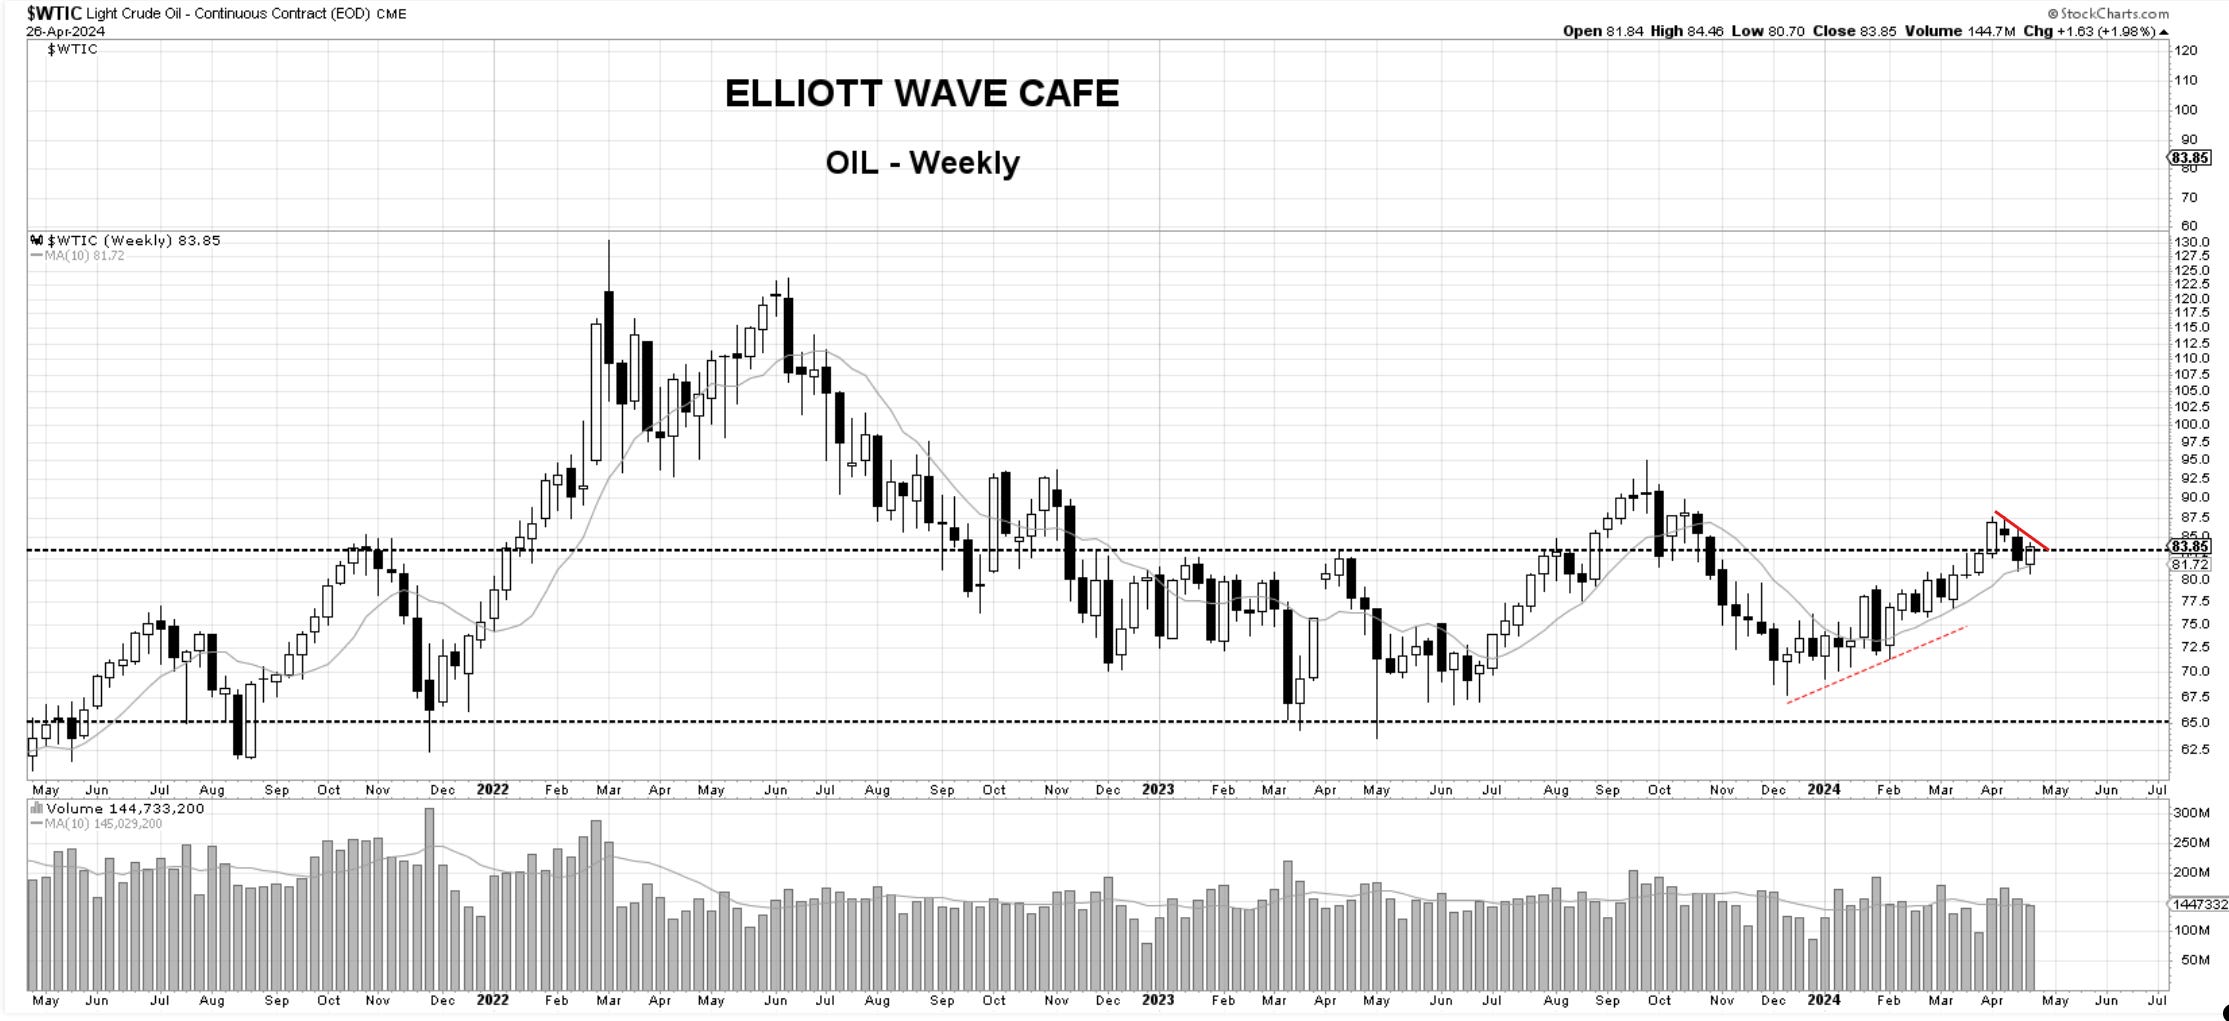
Oil
The 10-week held, and West Texas Crude closed up +2 % on the week. I will be watching for a break of the red trendline to see if initiating long positions would make sense.
Thank you all for reading; I will see you next week. Leave a comment or suggestion below. Join our chat to discuss markets with fellow traders.
In the meantime, please consider subscribing and supporting EWCafe and read “The Daily Drip,” where I provide daily market updates, videos, and commentary on core markets.
Cris,
EWCafe
email: ewcafe@pm.me