
Weekly market review
A technical look at weekly trends in core markets.

This weekly report is free and provides a recap of the action in the core markets for the past week. For a deeper dive into market analysis, projections, elliott wave counts, technical reviews, and opportunities, check out the daily updates and videos. A 7-day free trial will give you access to my work.
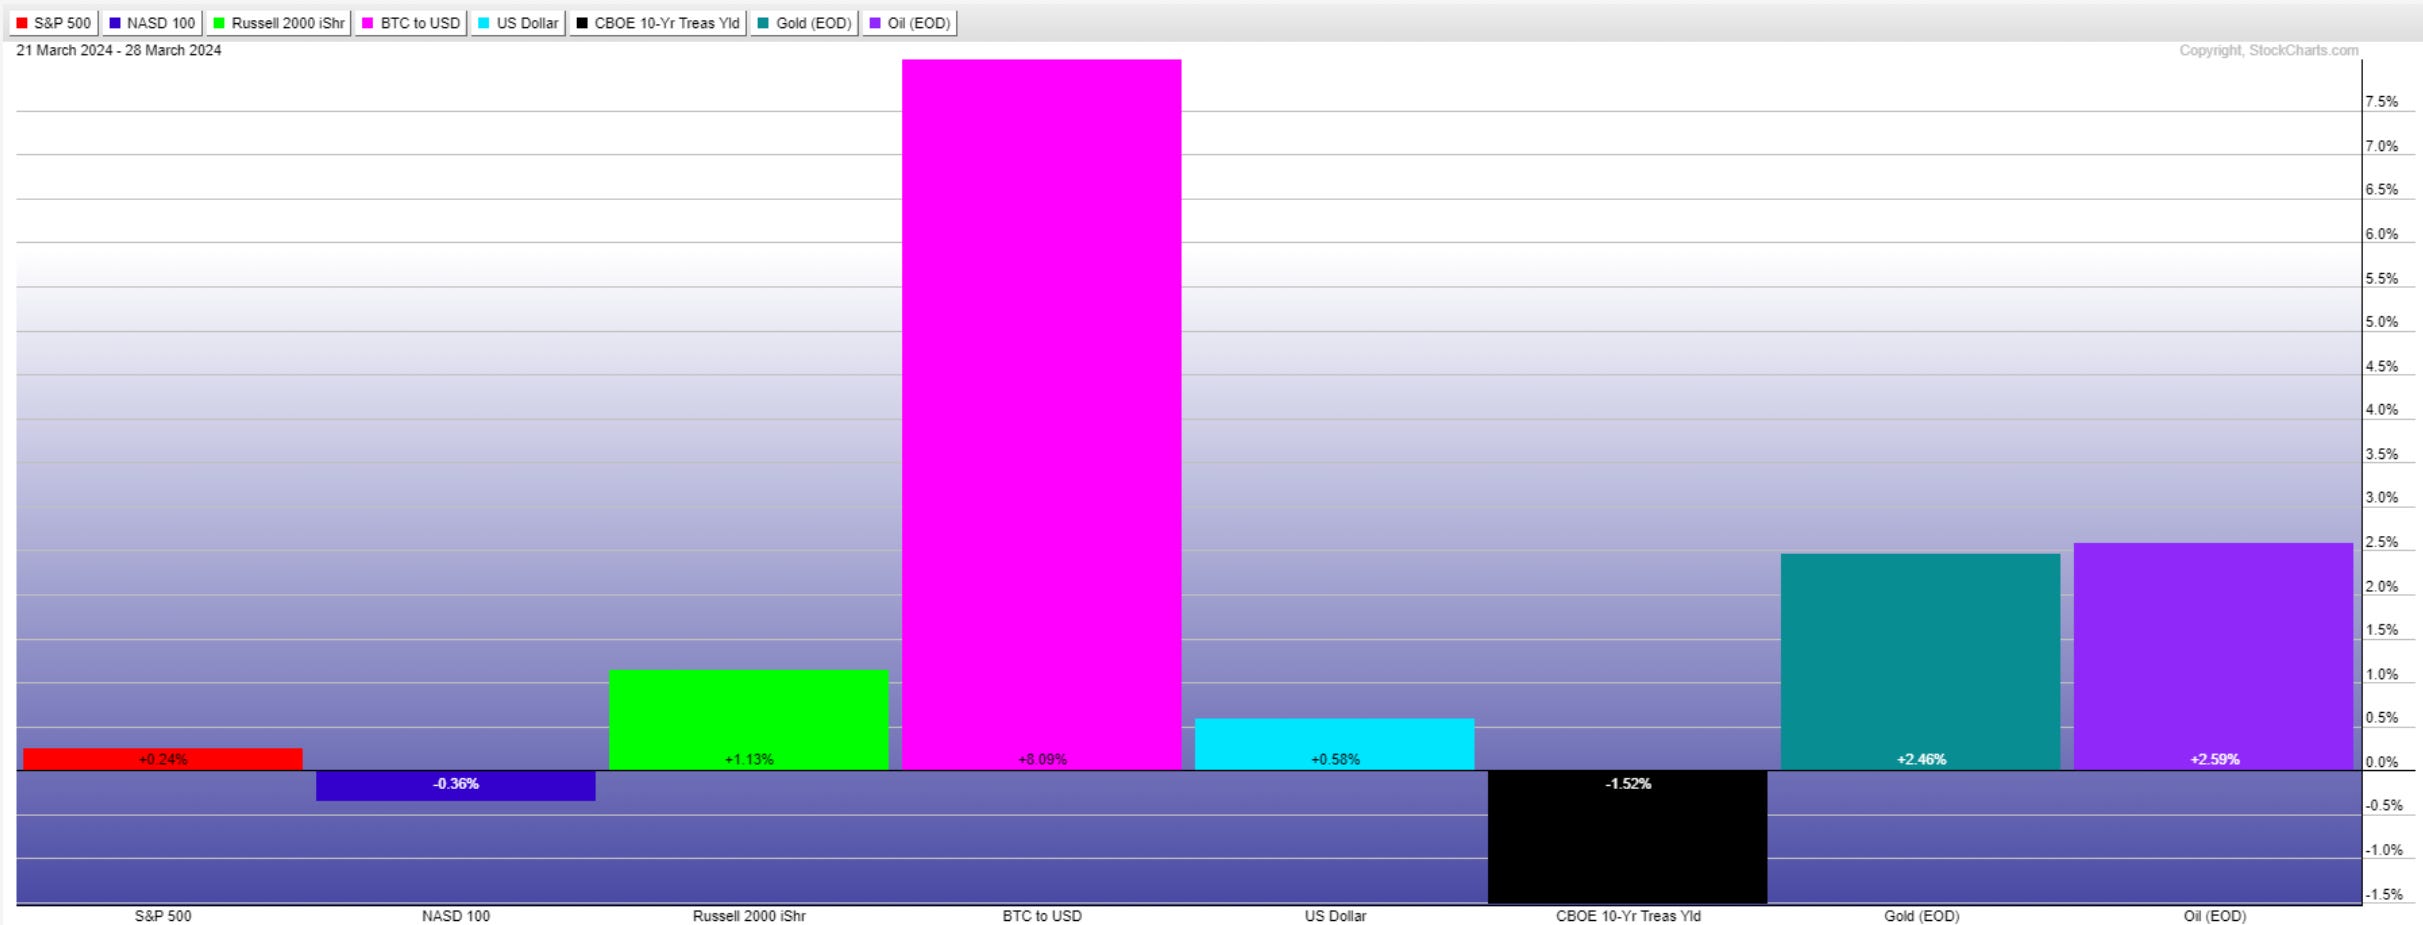
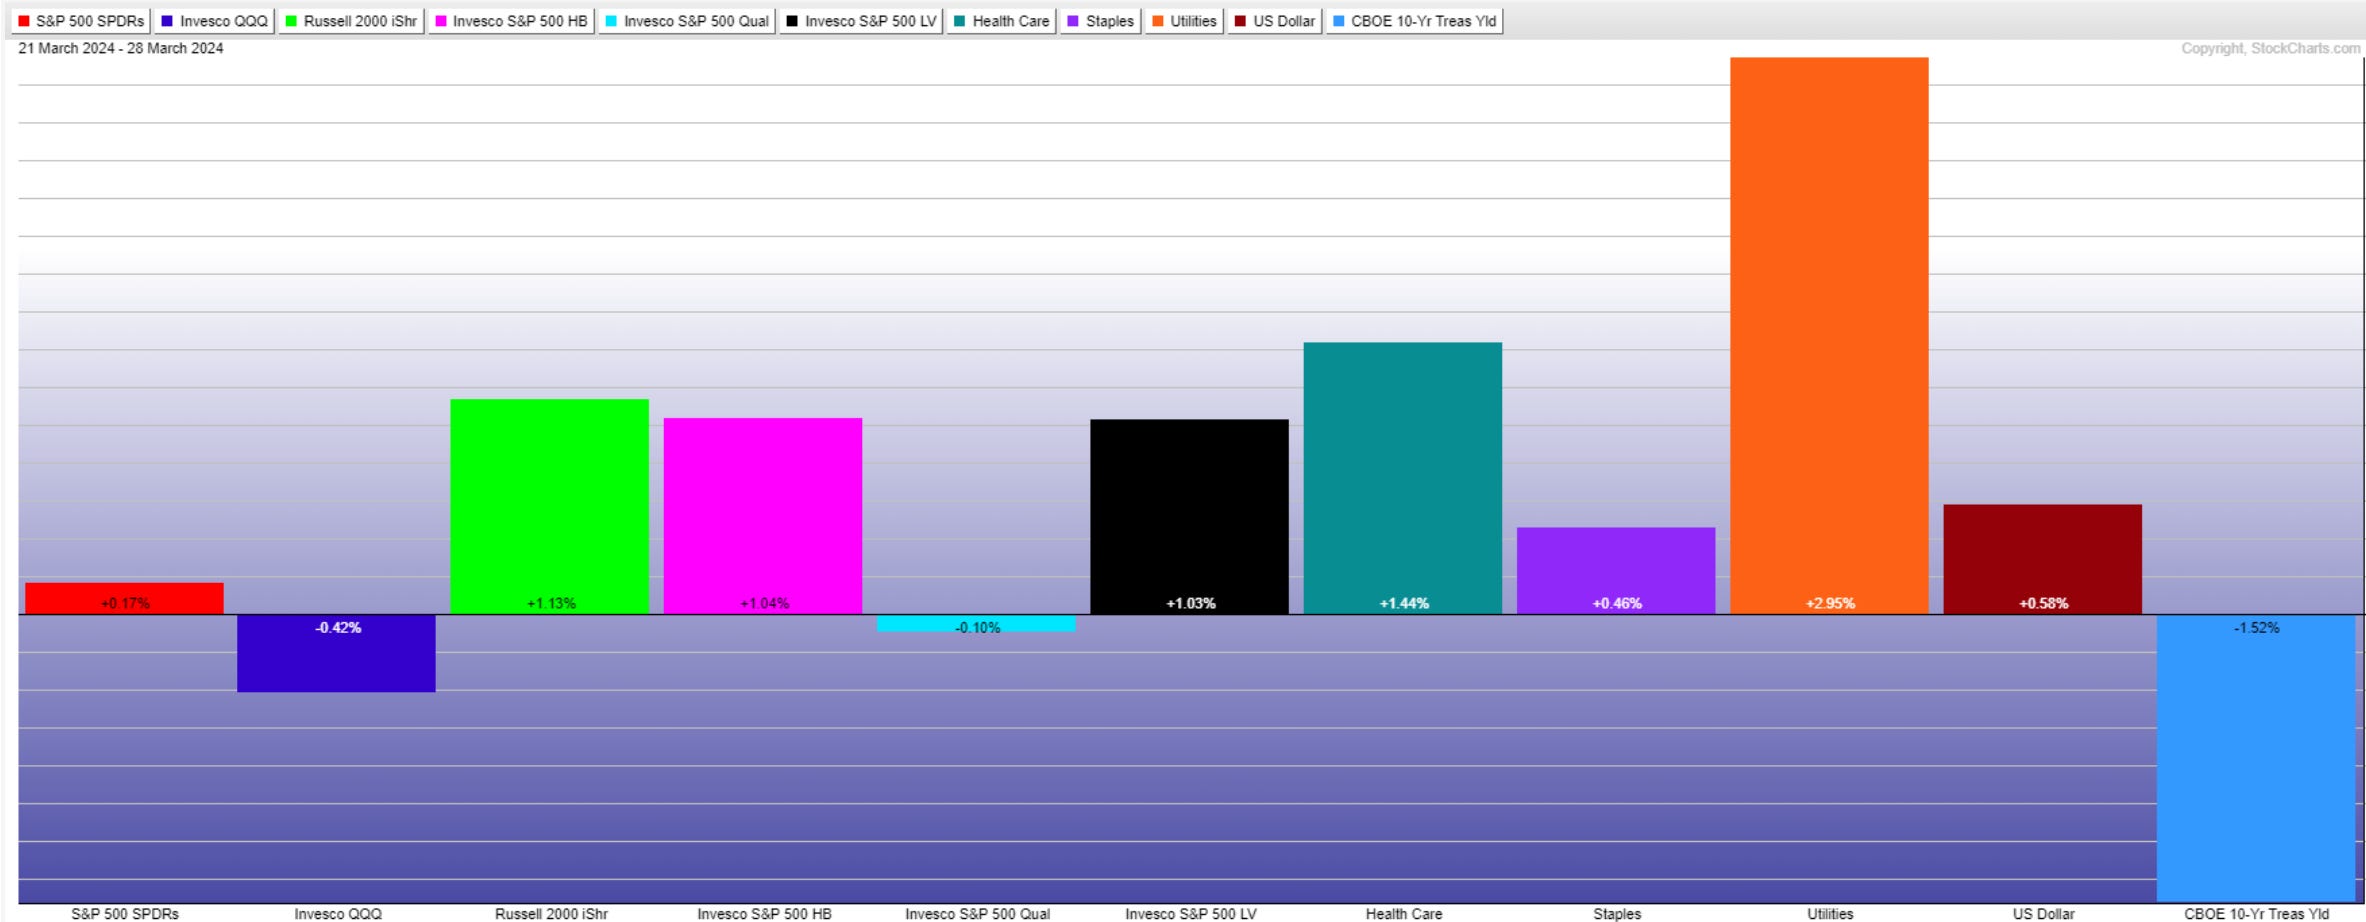
Market performance for this week is below.
Sentiment
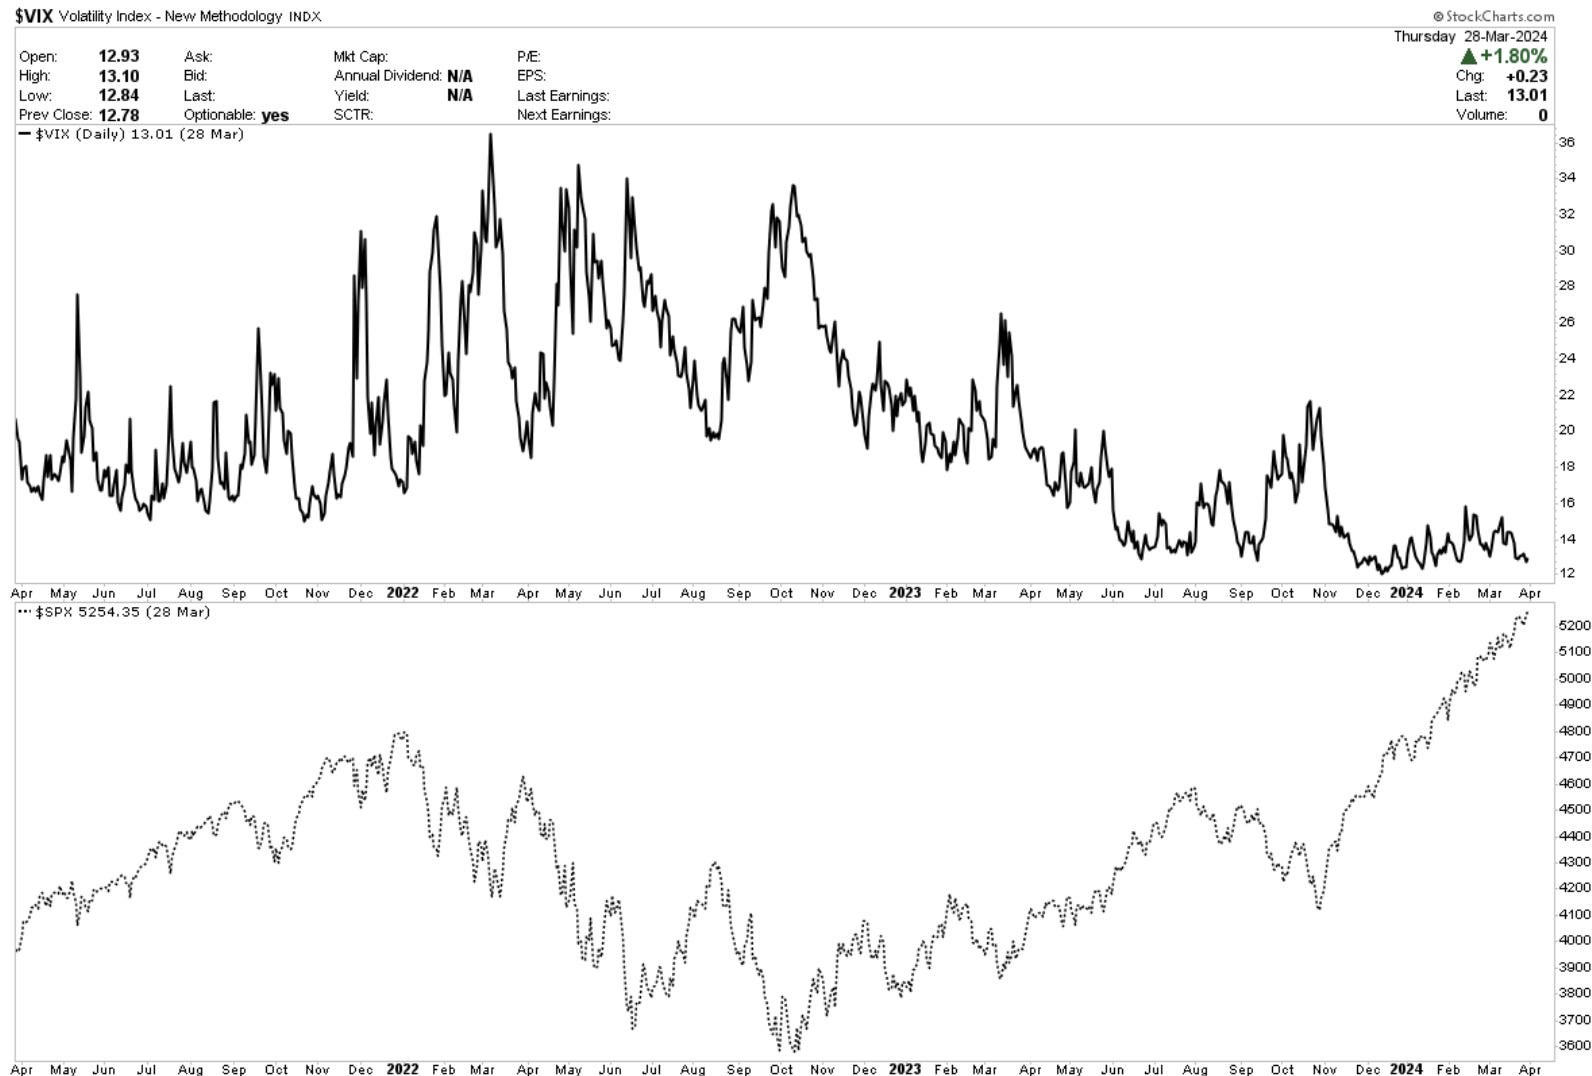
VIX remains low at levels corresponding with a trending market.
A pretty strong jump in the bulls-bear indicator this week, as individual investors remain excited about rising prices and growing portfolios.
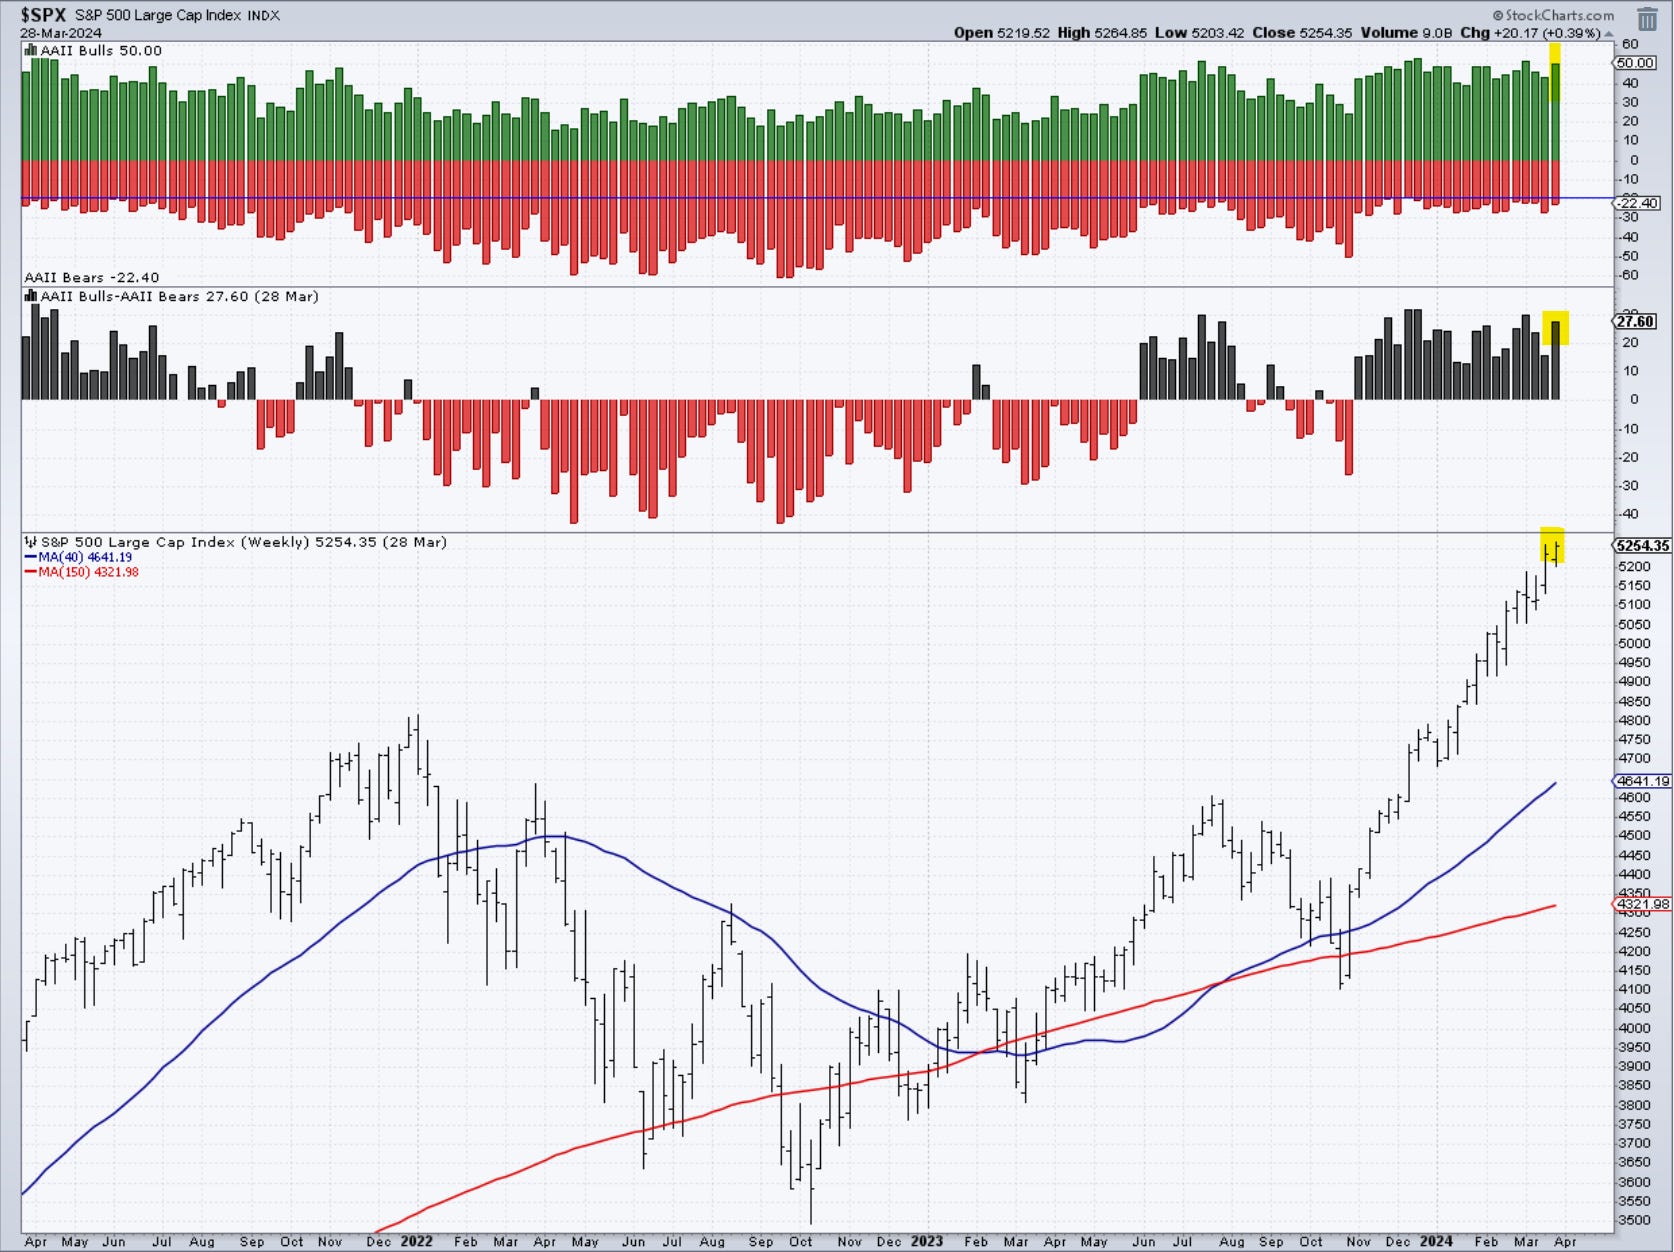
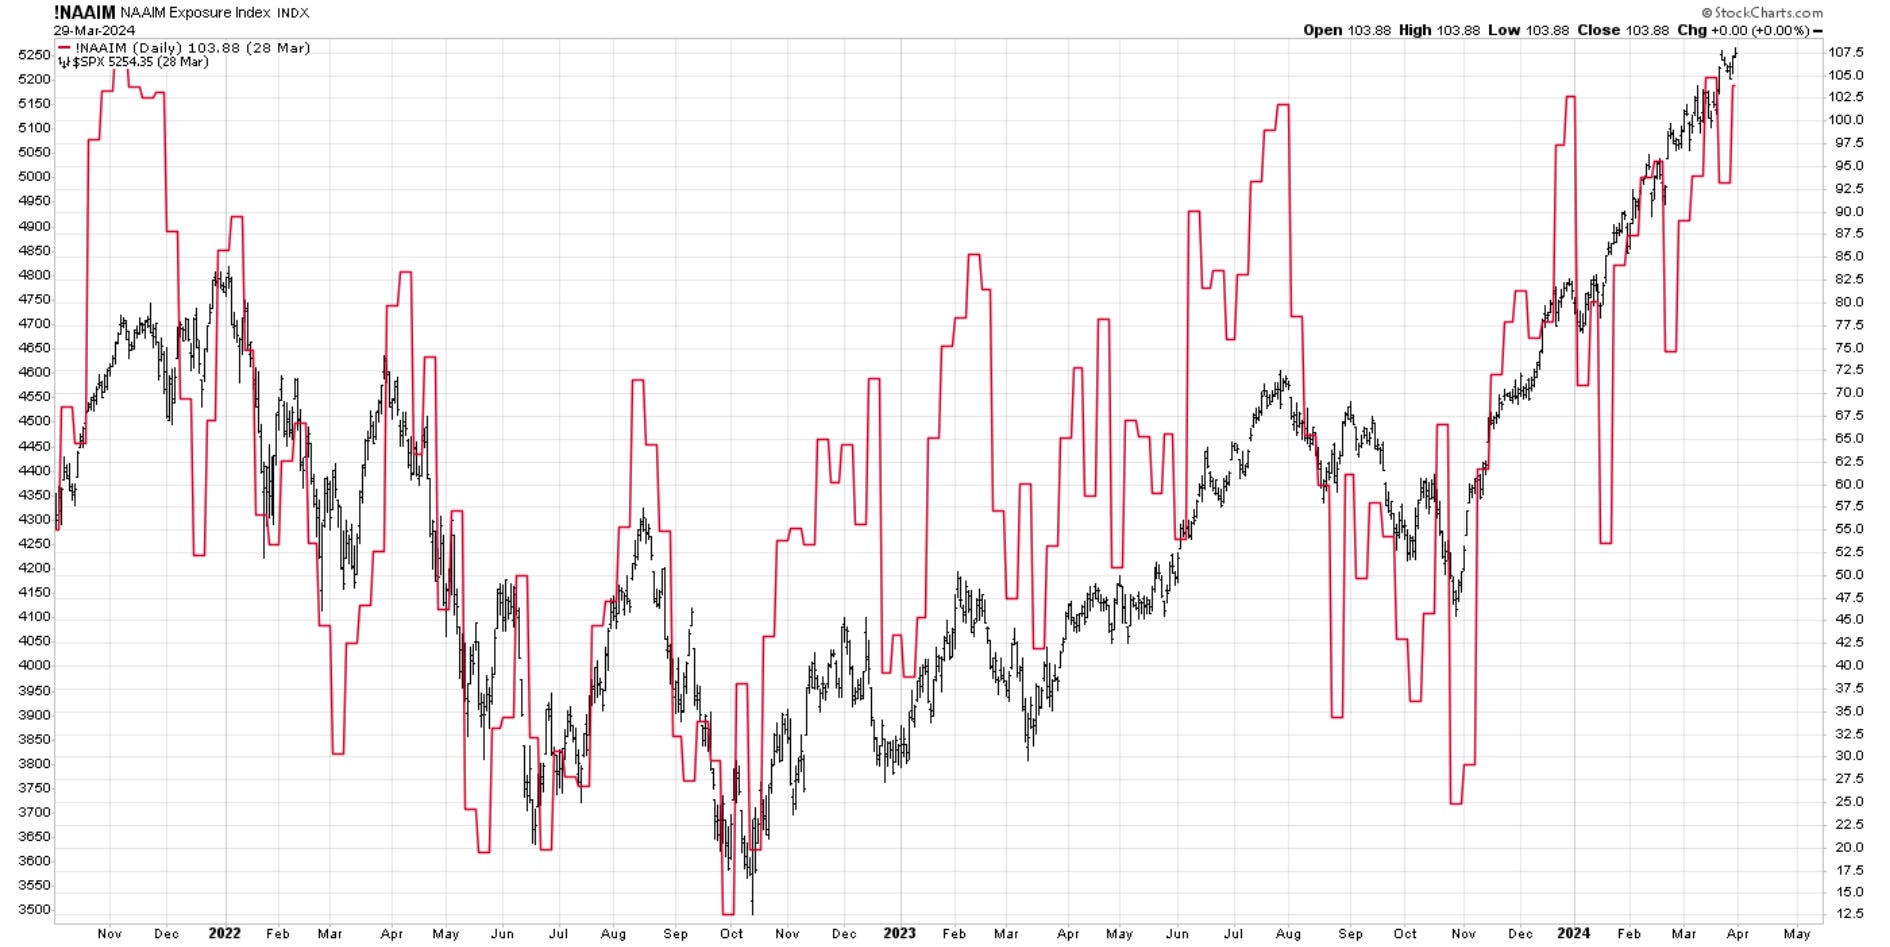
Investment managers continue making bullish bets on this market, remaining fully invested as markets close to new all-time highs.
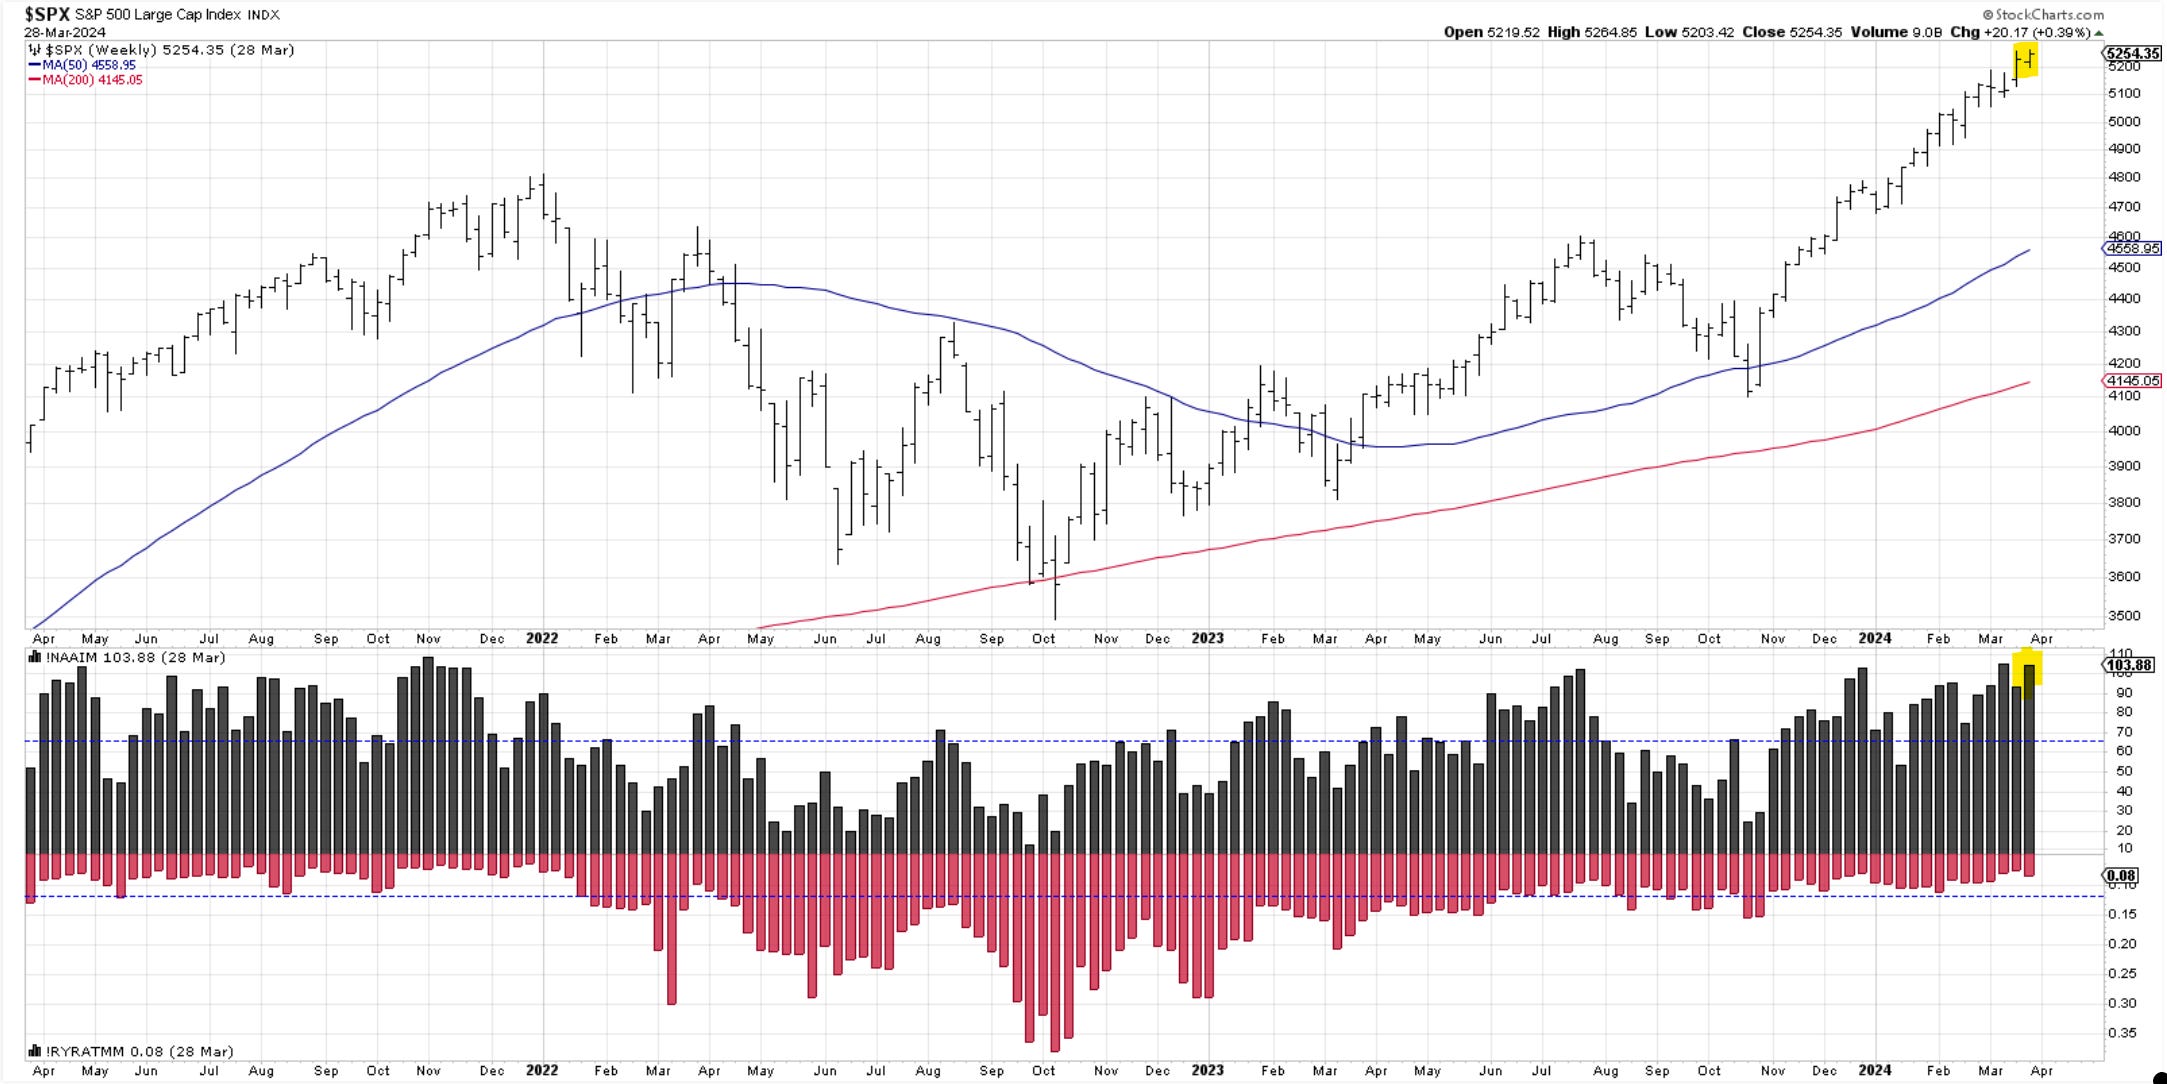
The red line is the percentage allocation. Here, you can see the swings overlayed on the Sp500 price.
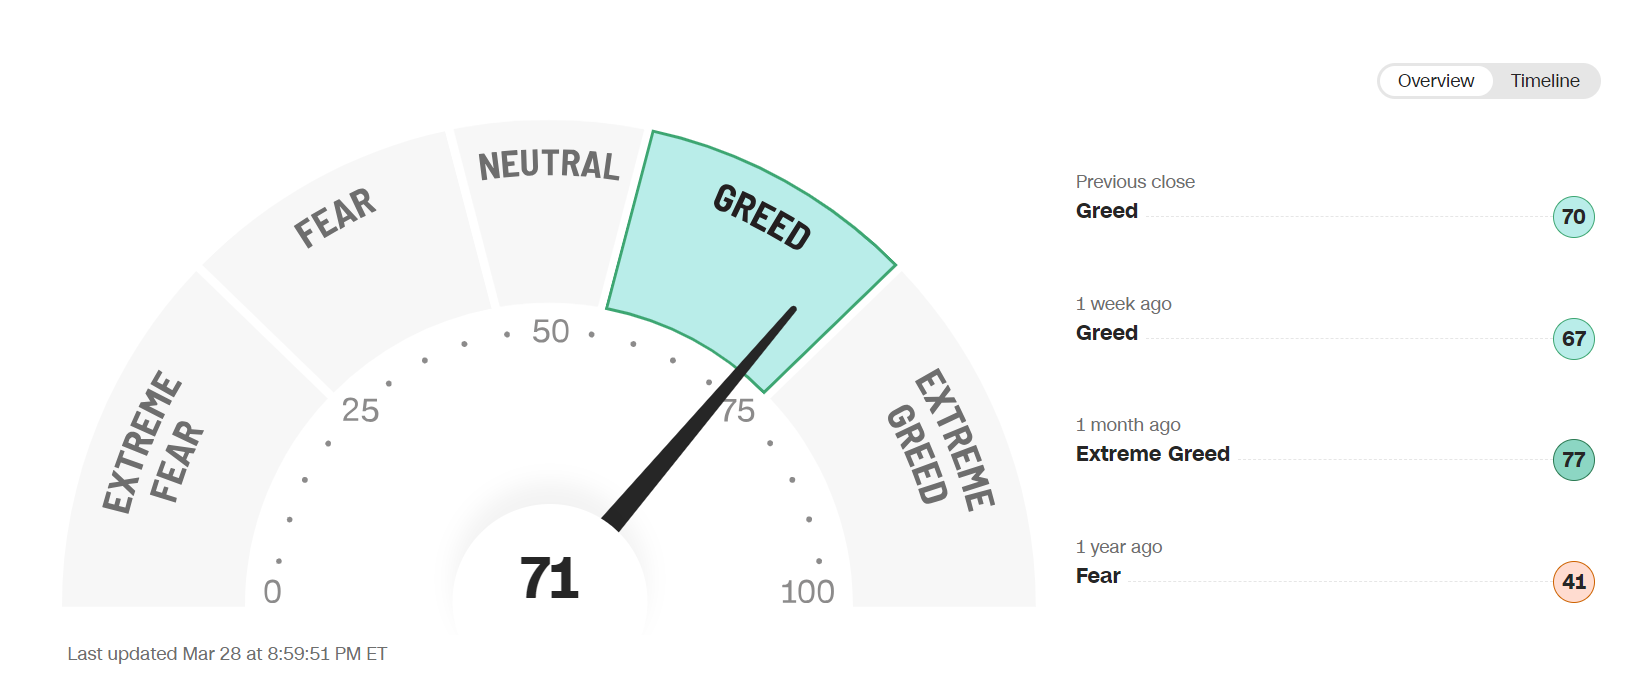
The sentiment section would not be complete without the CNN gauge of Fear vs. Greed.
There is no extreme greed in this market yet. The indicator has barely budged for the past several weeks. You would think it needs to be some kind of larger excitement to trigger a corrective pullback.
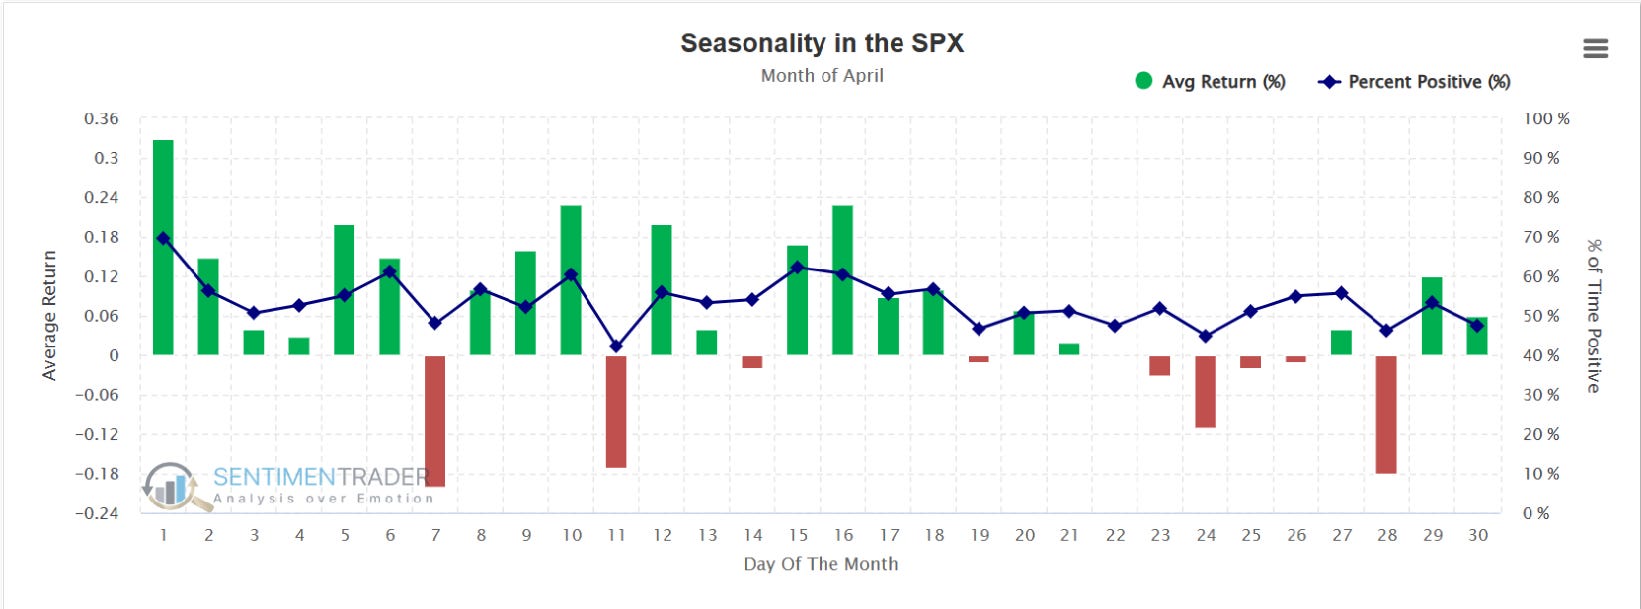
Seasonality
SP500. Here is the daily price action for April. Historically, April is a pretty decent month, especially in the first 20 days.
Price
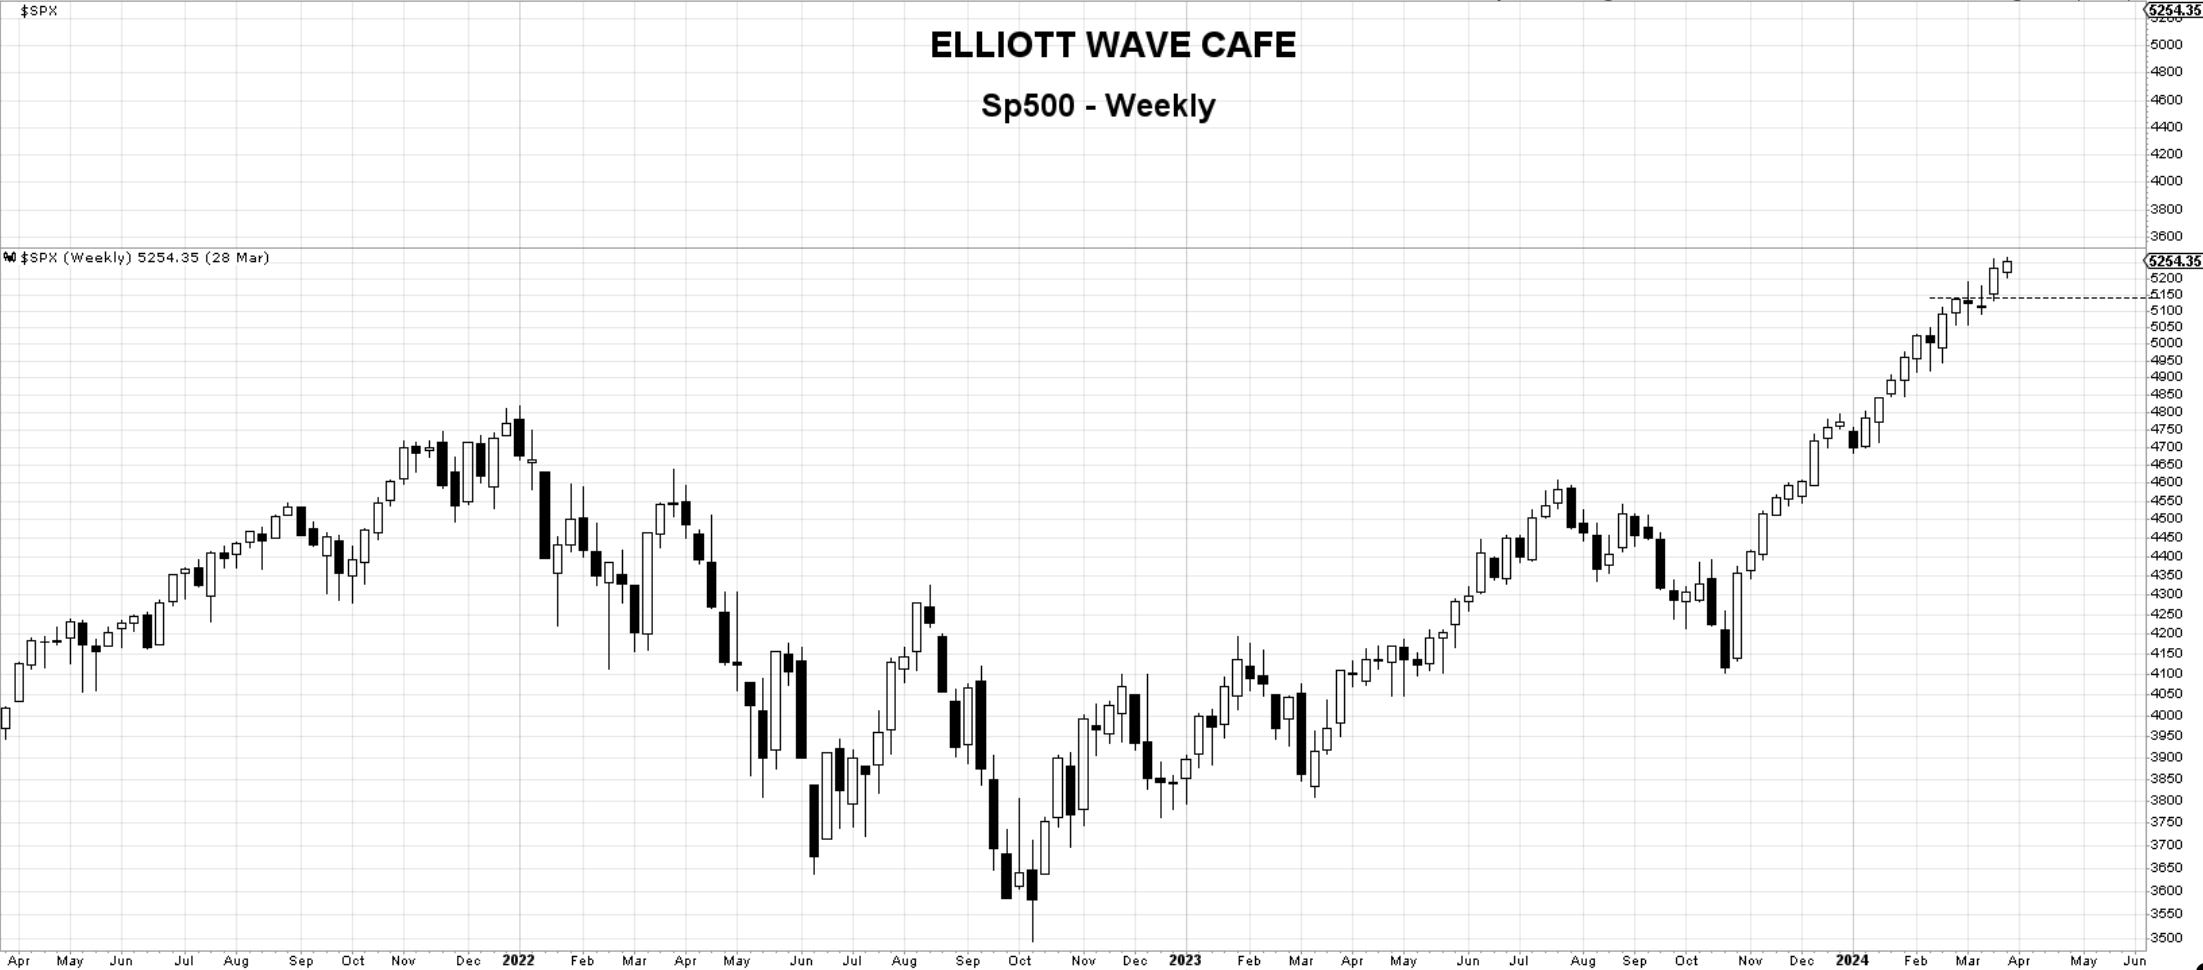
SP500. The most important index in the world has closed the week at new all-time highs. 5150 is the level to watch on any pullbacks, along with the violation of a trendline drawn from Oct 2023 lows. These weekly charts display no evidence yet of a trend interruption.
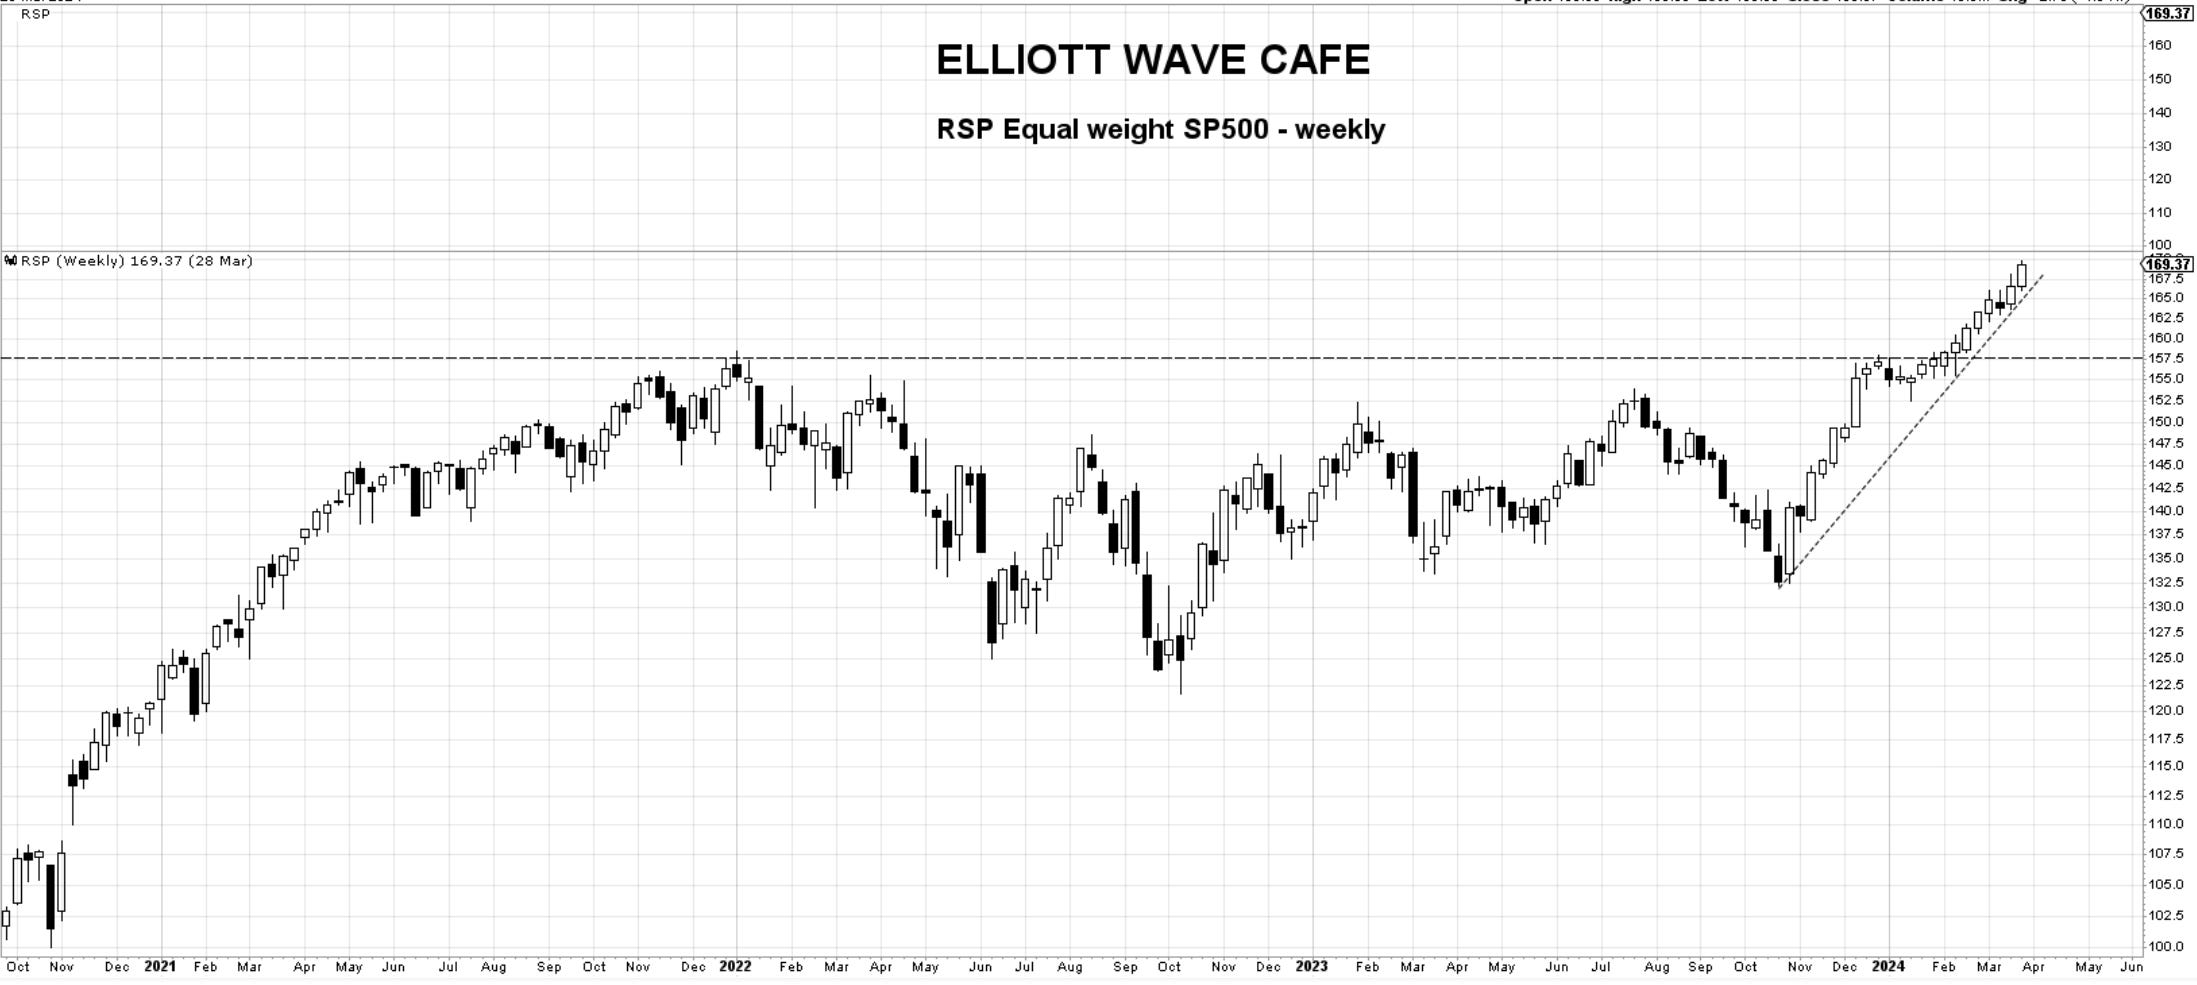
RSP - equal weight SP500. From an equal weight perspective, we’re getting more and more equilibrium, which hints at a healthy uptrend. An even more impressive close here vs the sp500 cap weighted.
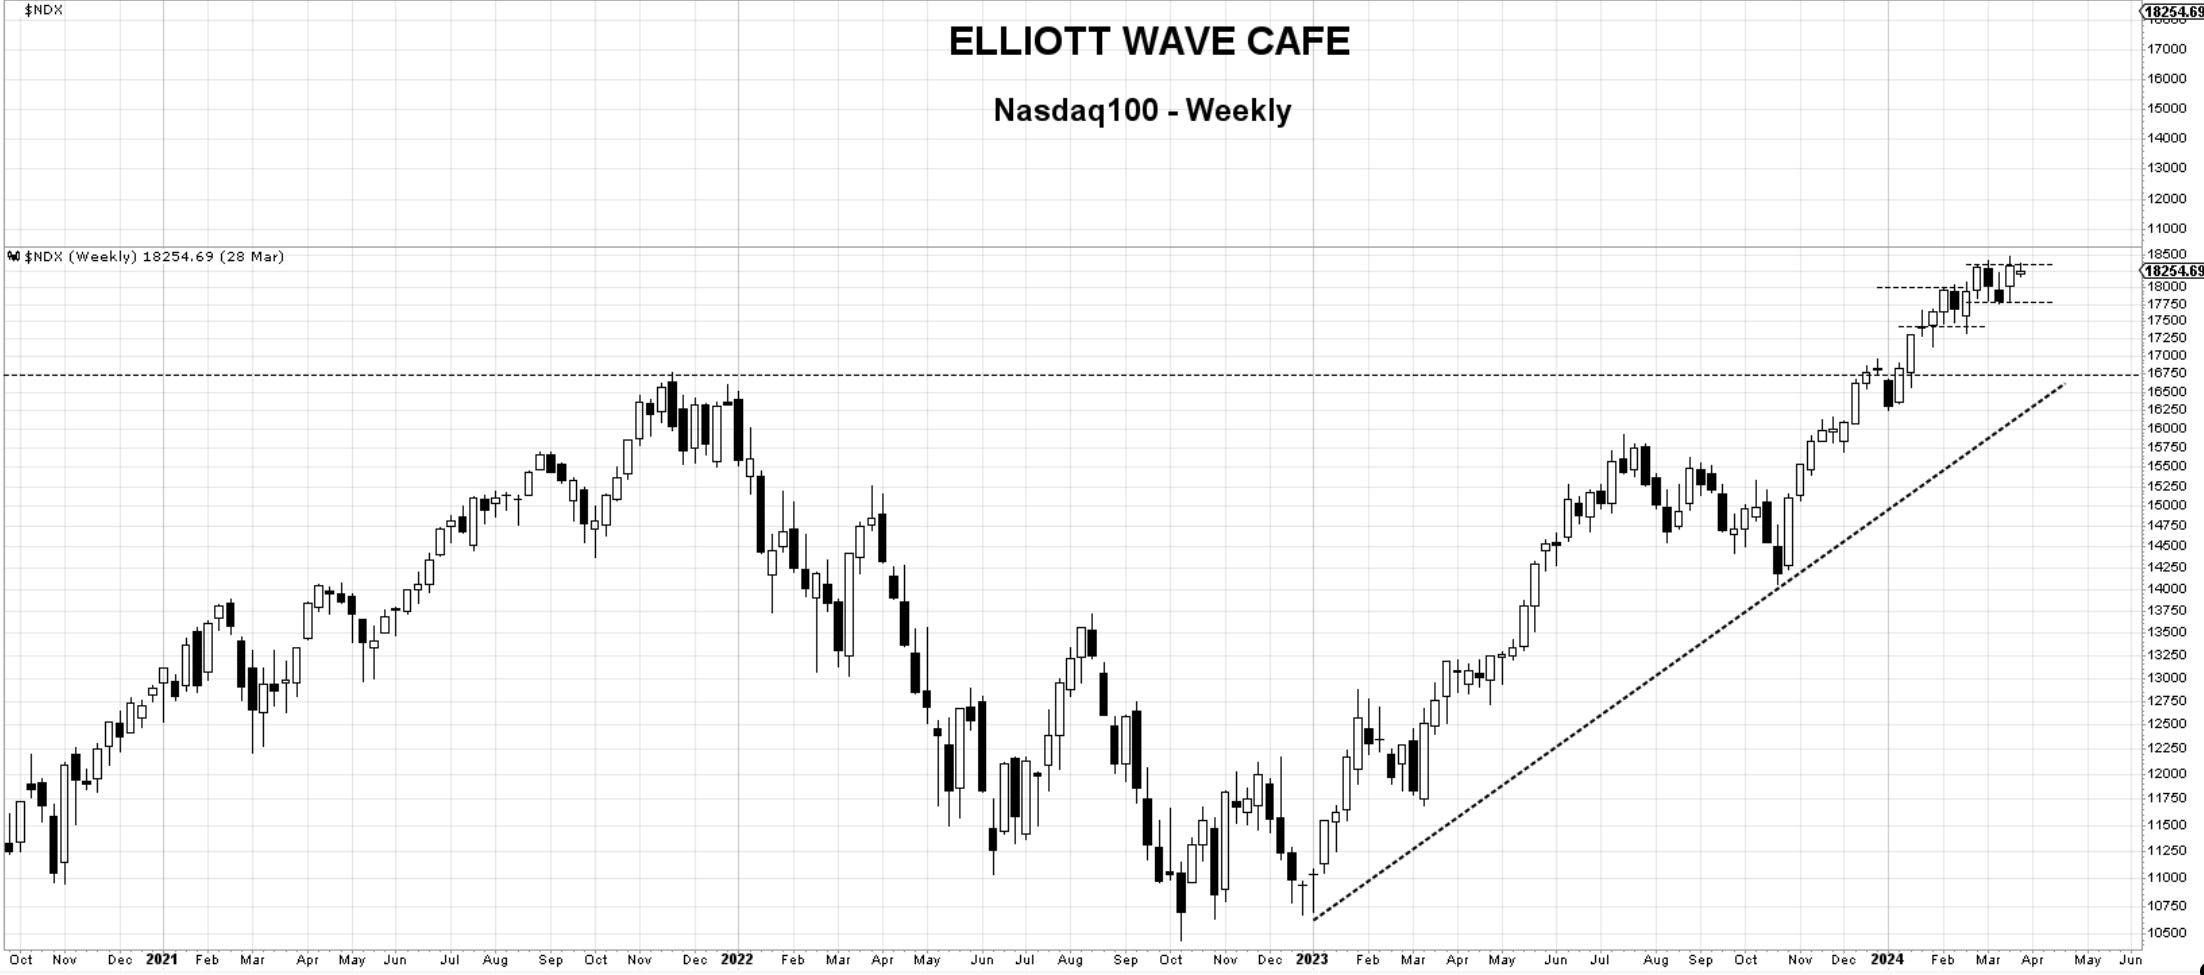
Nasdaq100. Nasdaq, with its tech-heavy weighting, has underperformed the broader market lately. There is clearly a shift from the strongest-performing index of the last five months to the underinvested areas, or as Wall Street calls it, rotation of assets. Notice below the two side-by-side consolidation areas. A break above would re-ignite the uptrend, while a loss of 17,800 would deepen the pullback towards 17,300.
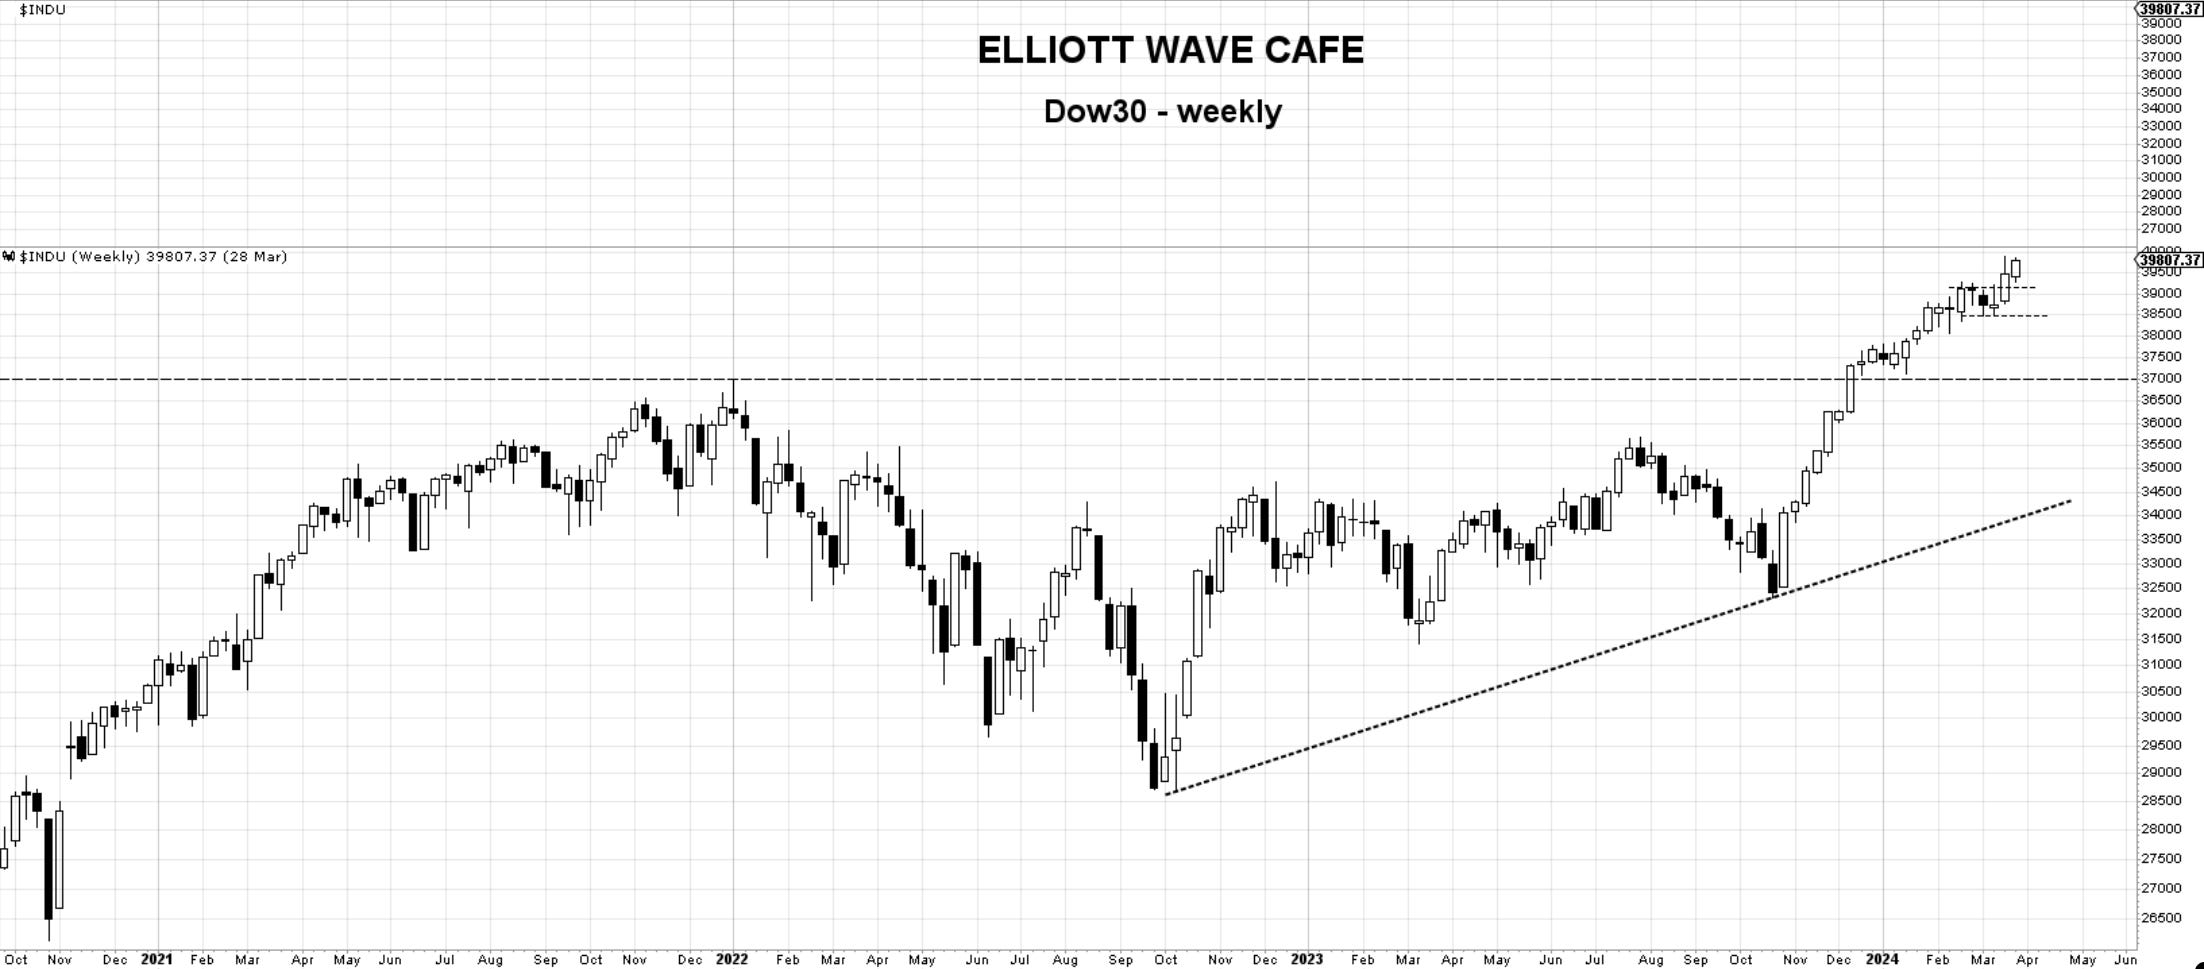
Dow Jones 30—This broader 30 large stock index has a new weekly closing high. After spending about 4 weeks backing and filling, we broke out last week and continued higher. We should be supported at 39,200.
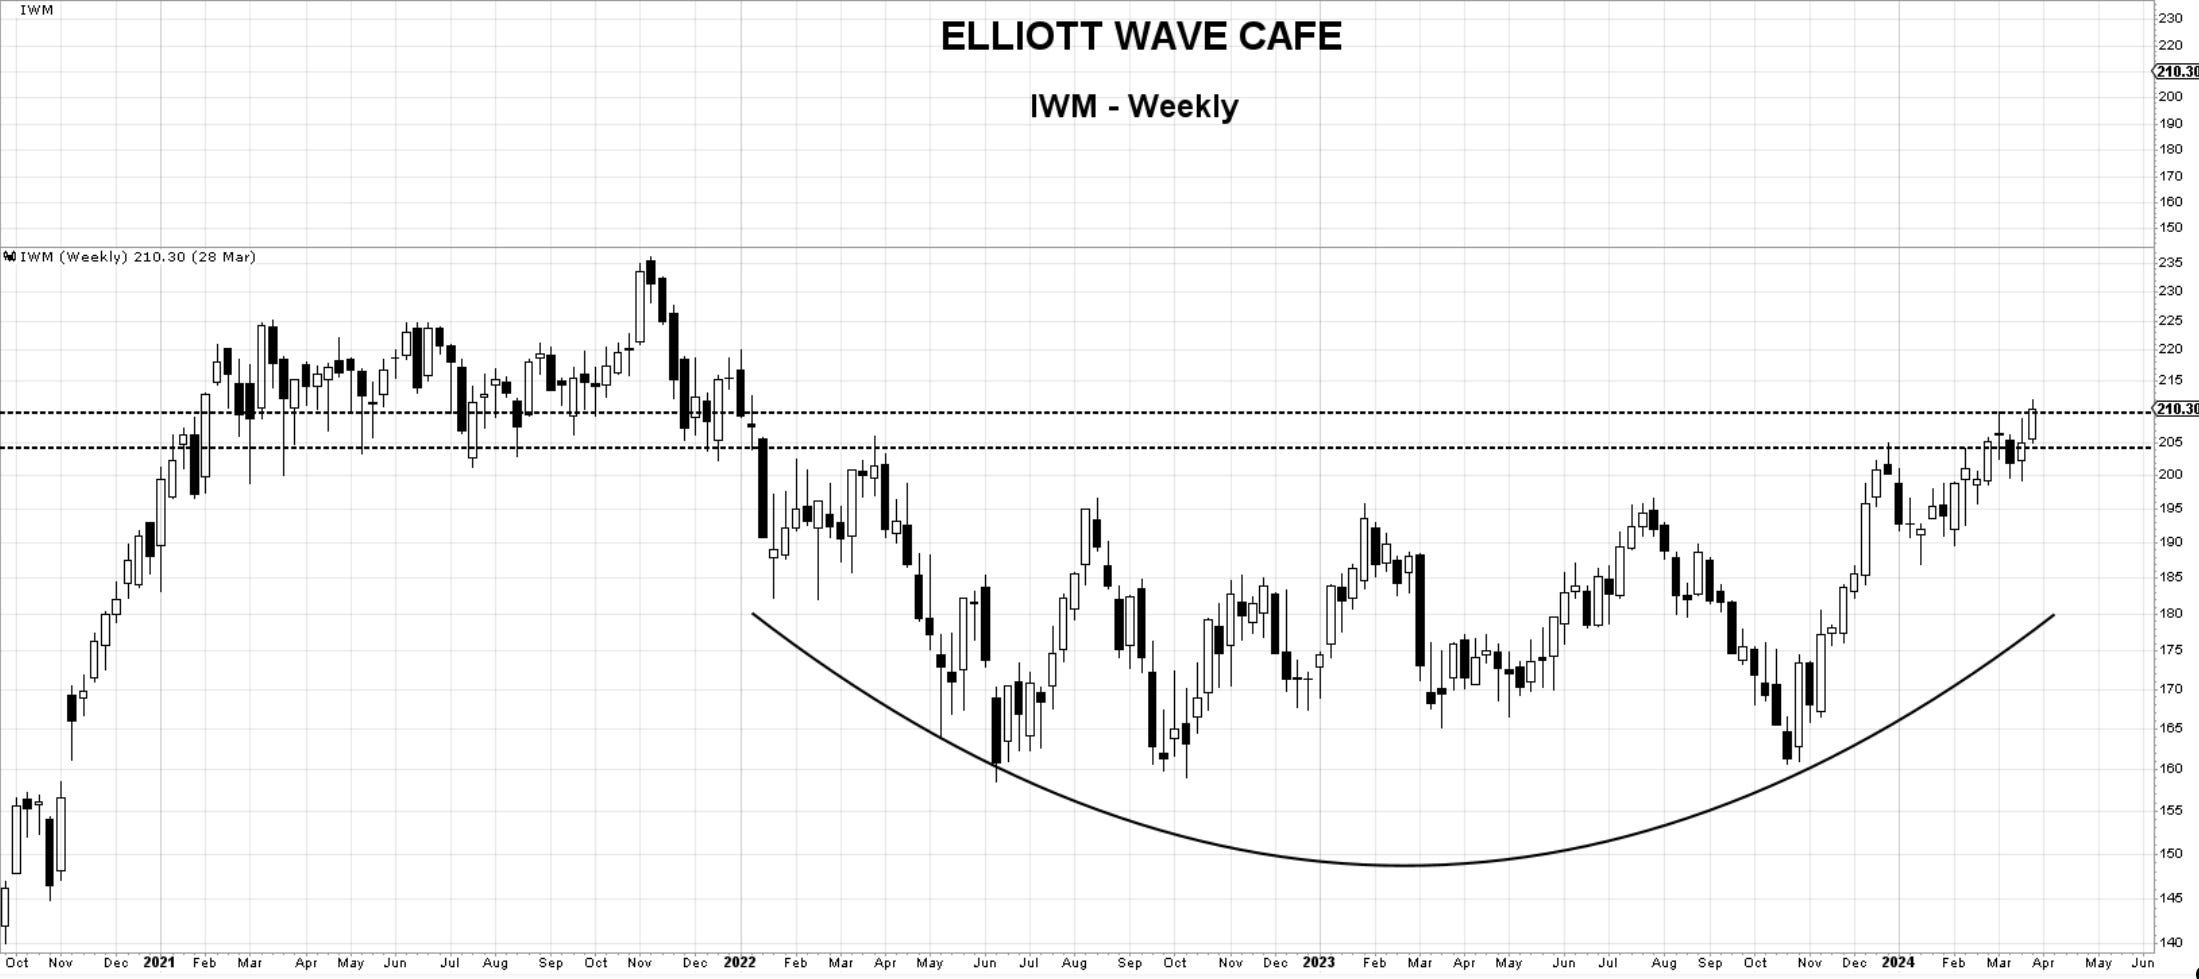
IWM—small caps. These 2000 small stocks are still about -11% from the all-time highs established in late 2021. This week’s close triggers a bullish signal with a defensive line below 200. Lots of potential here to really get going. Wrote about small caps in last Daily Drip update.
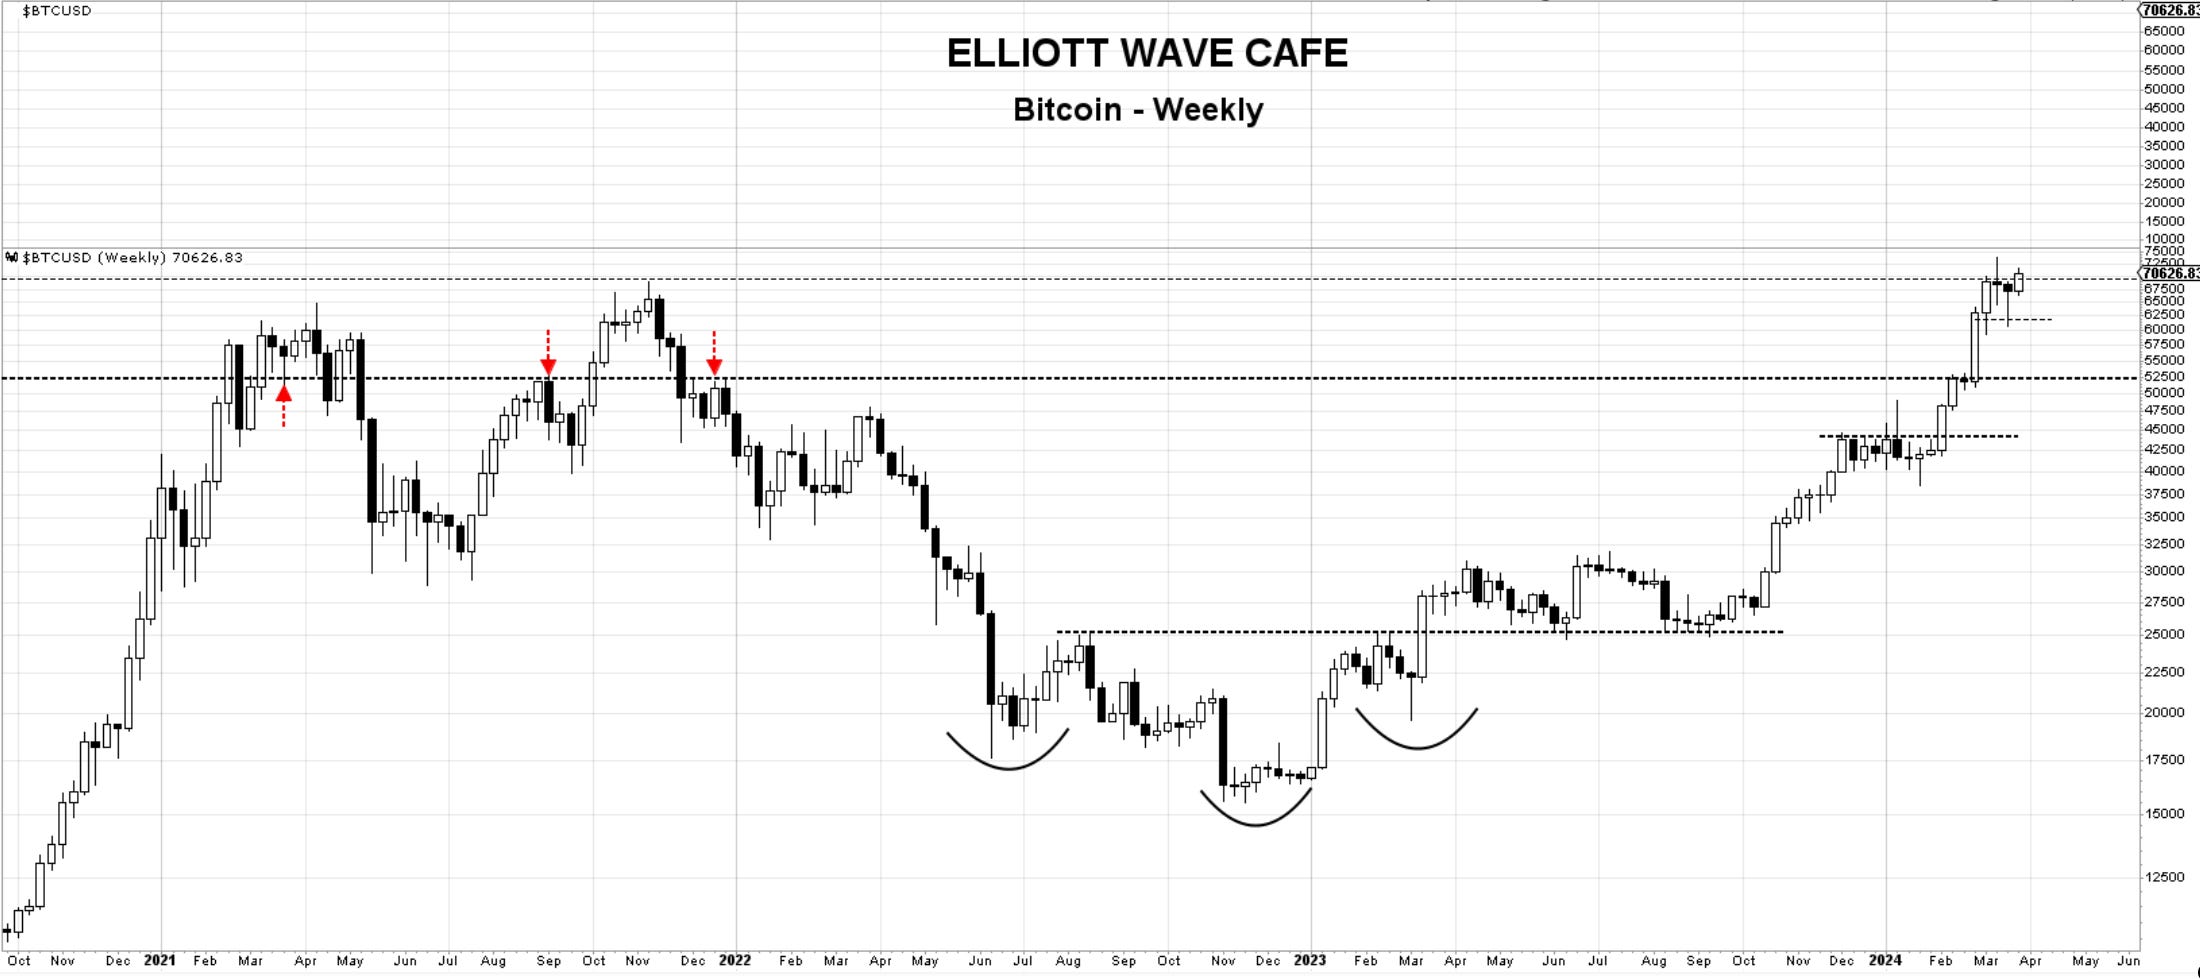
Bitcoin— 66,400 is this week’s low and support. It looks that we will be getting an all-time high weekly close after corecting the prior two weeks. The chart structure remains bullish, so I continue to look upwards towards 90k zone.
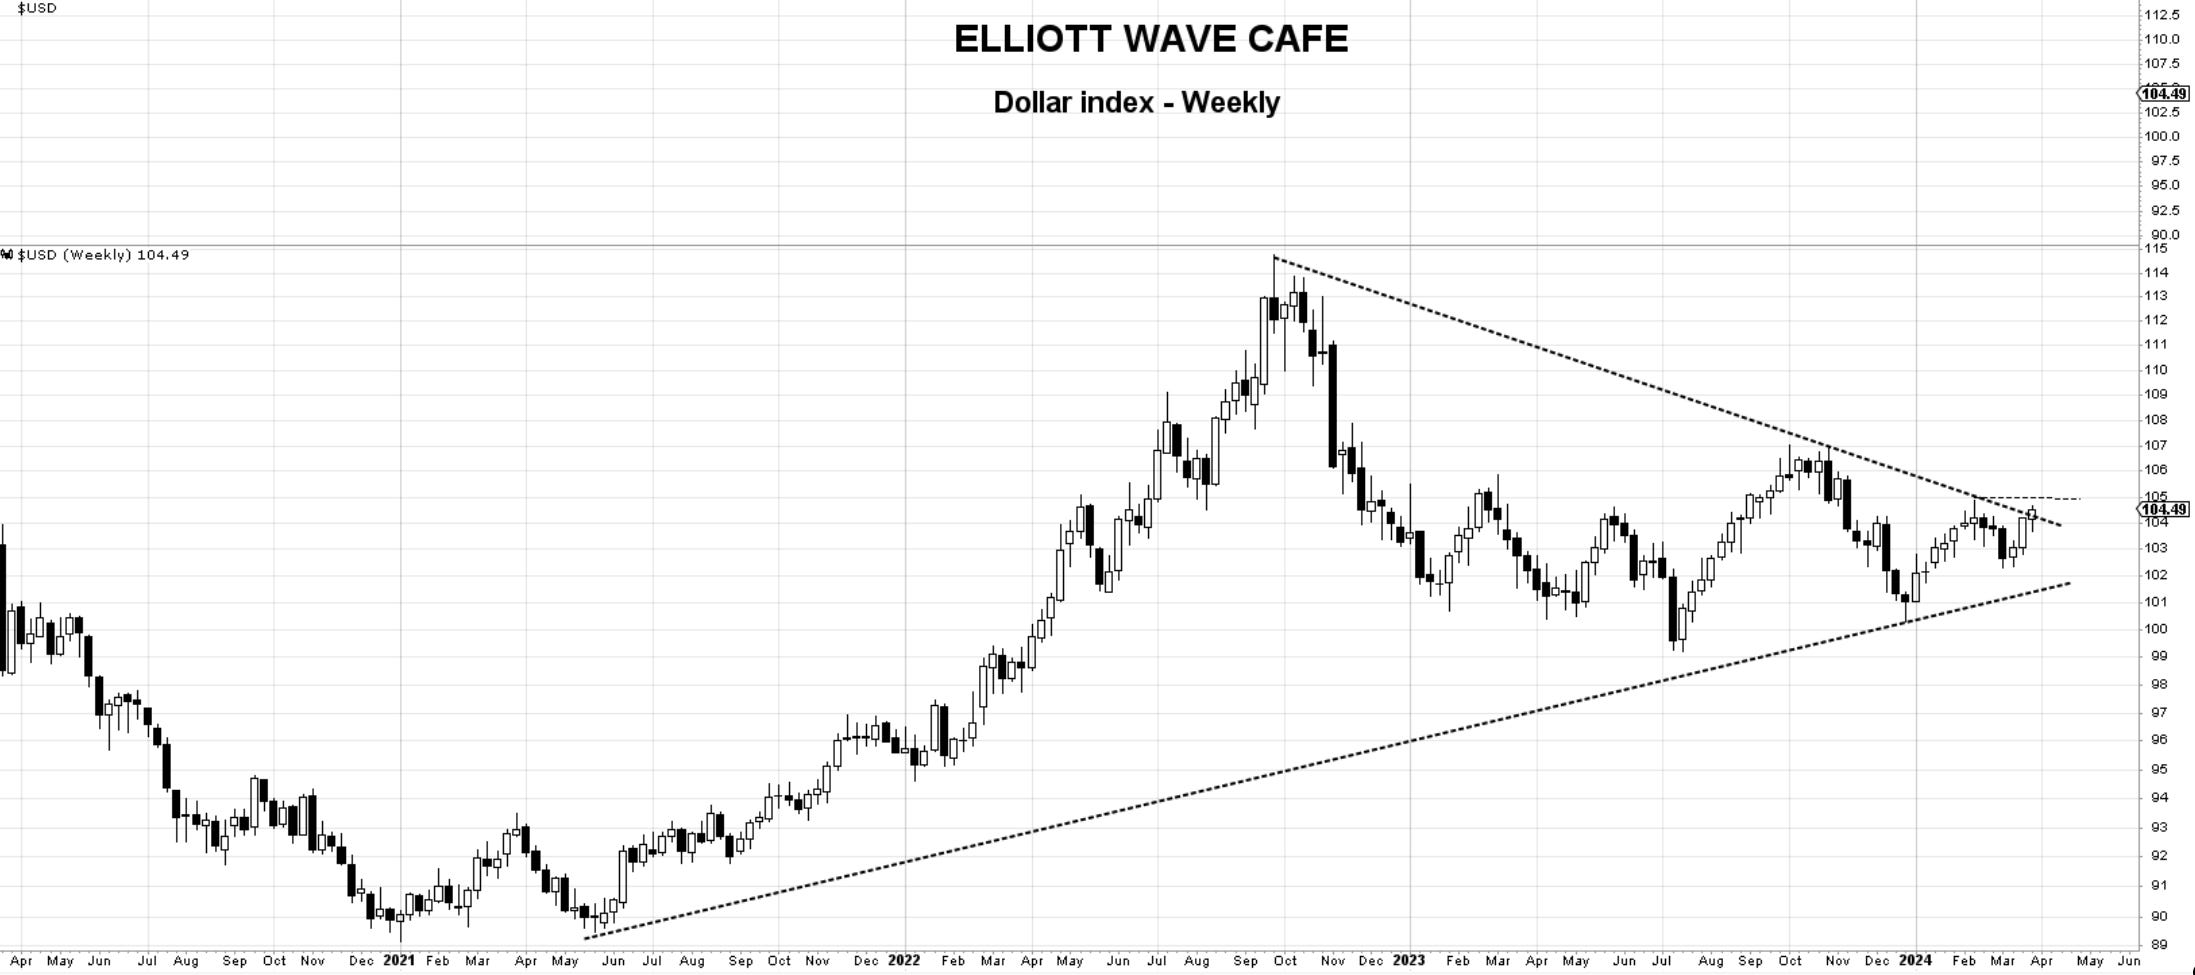
US Dollar - It broke just slightly the declining trendline. Three weeks for consecutive buying and it threantens to break the 105 level. If that happens, 107 becomes the next target. A larger acceleration in the greenback ( aka third wave) can put a dent in the bullish trends established in equities.
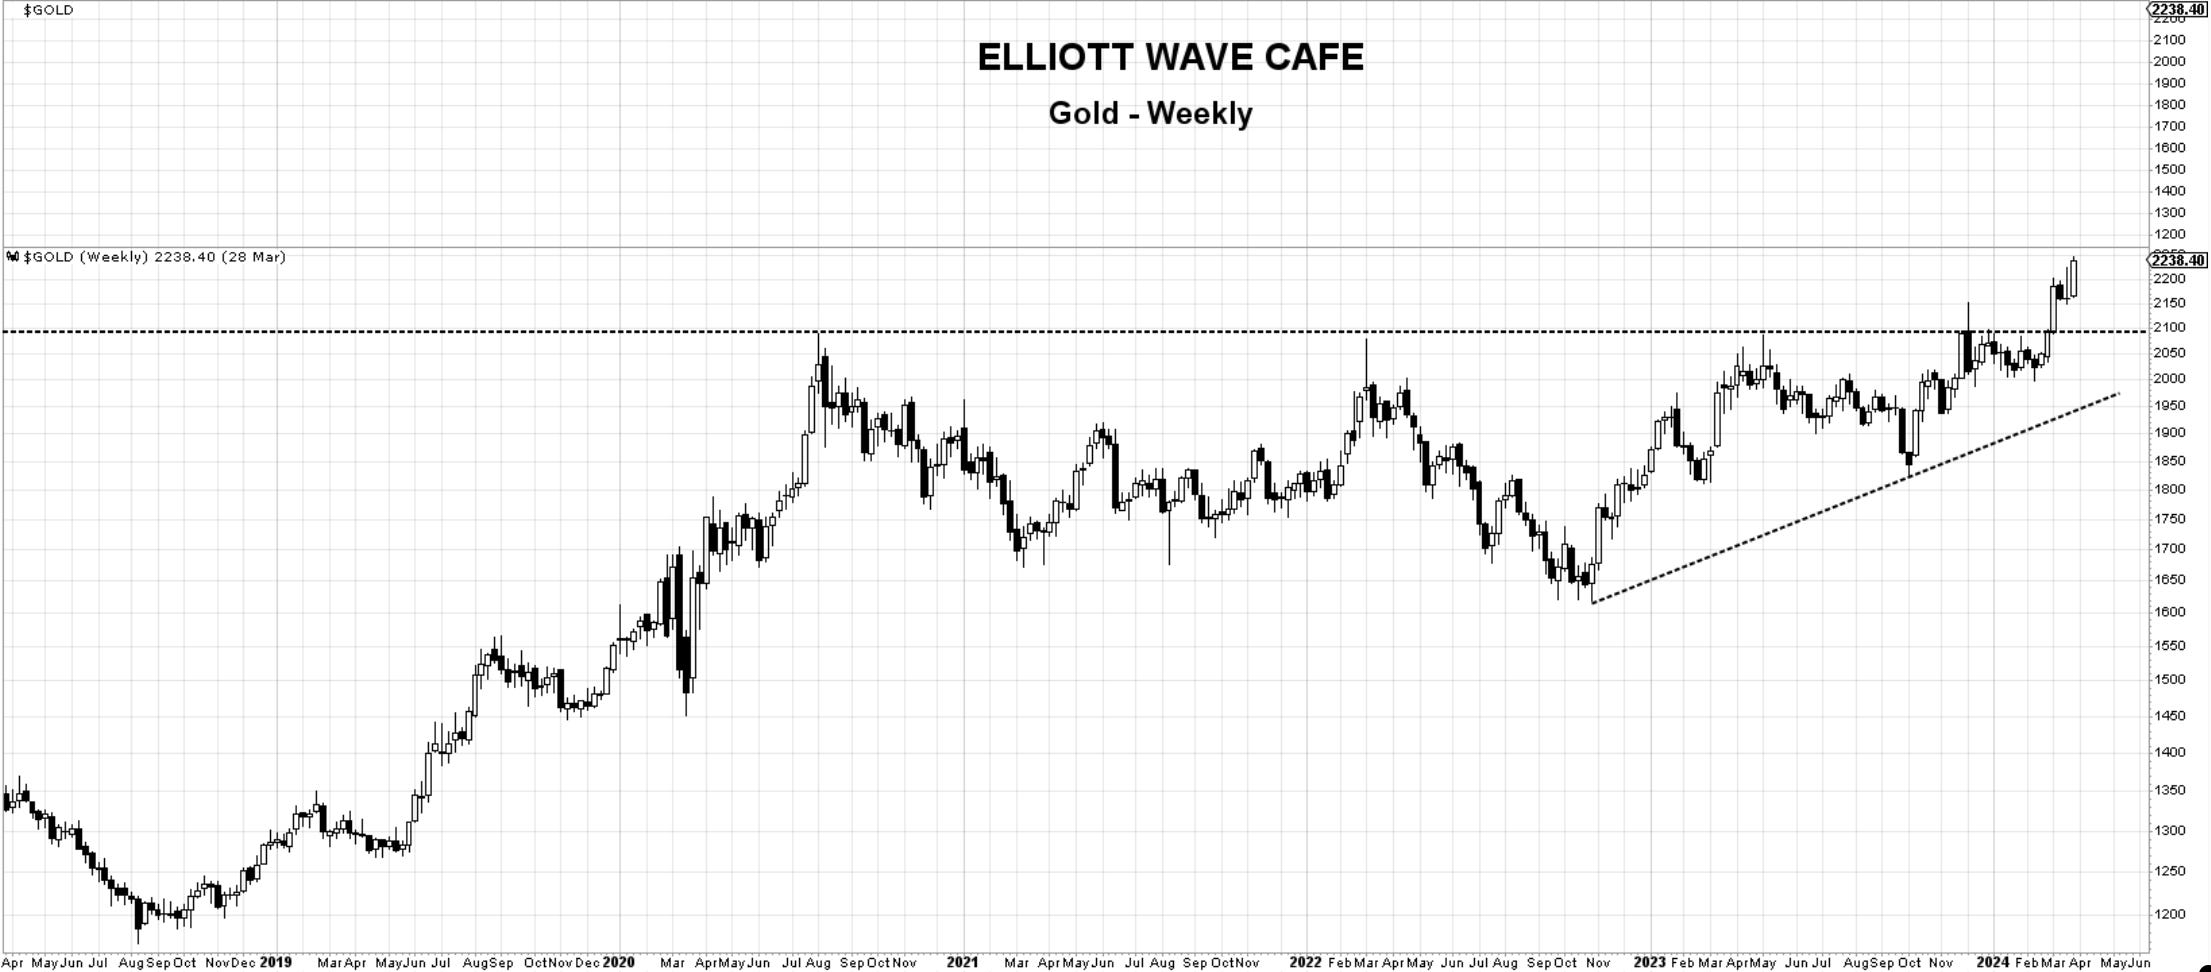
Gold—has failed to correct the initial advance more then a quick drop to 2150 and it closed to new all-time highs. 2200 is the level broken this week with a close above it. It should now be support. Gold has the potential to get going in a much larger third wave now that we’re well established above 2100.
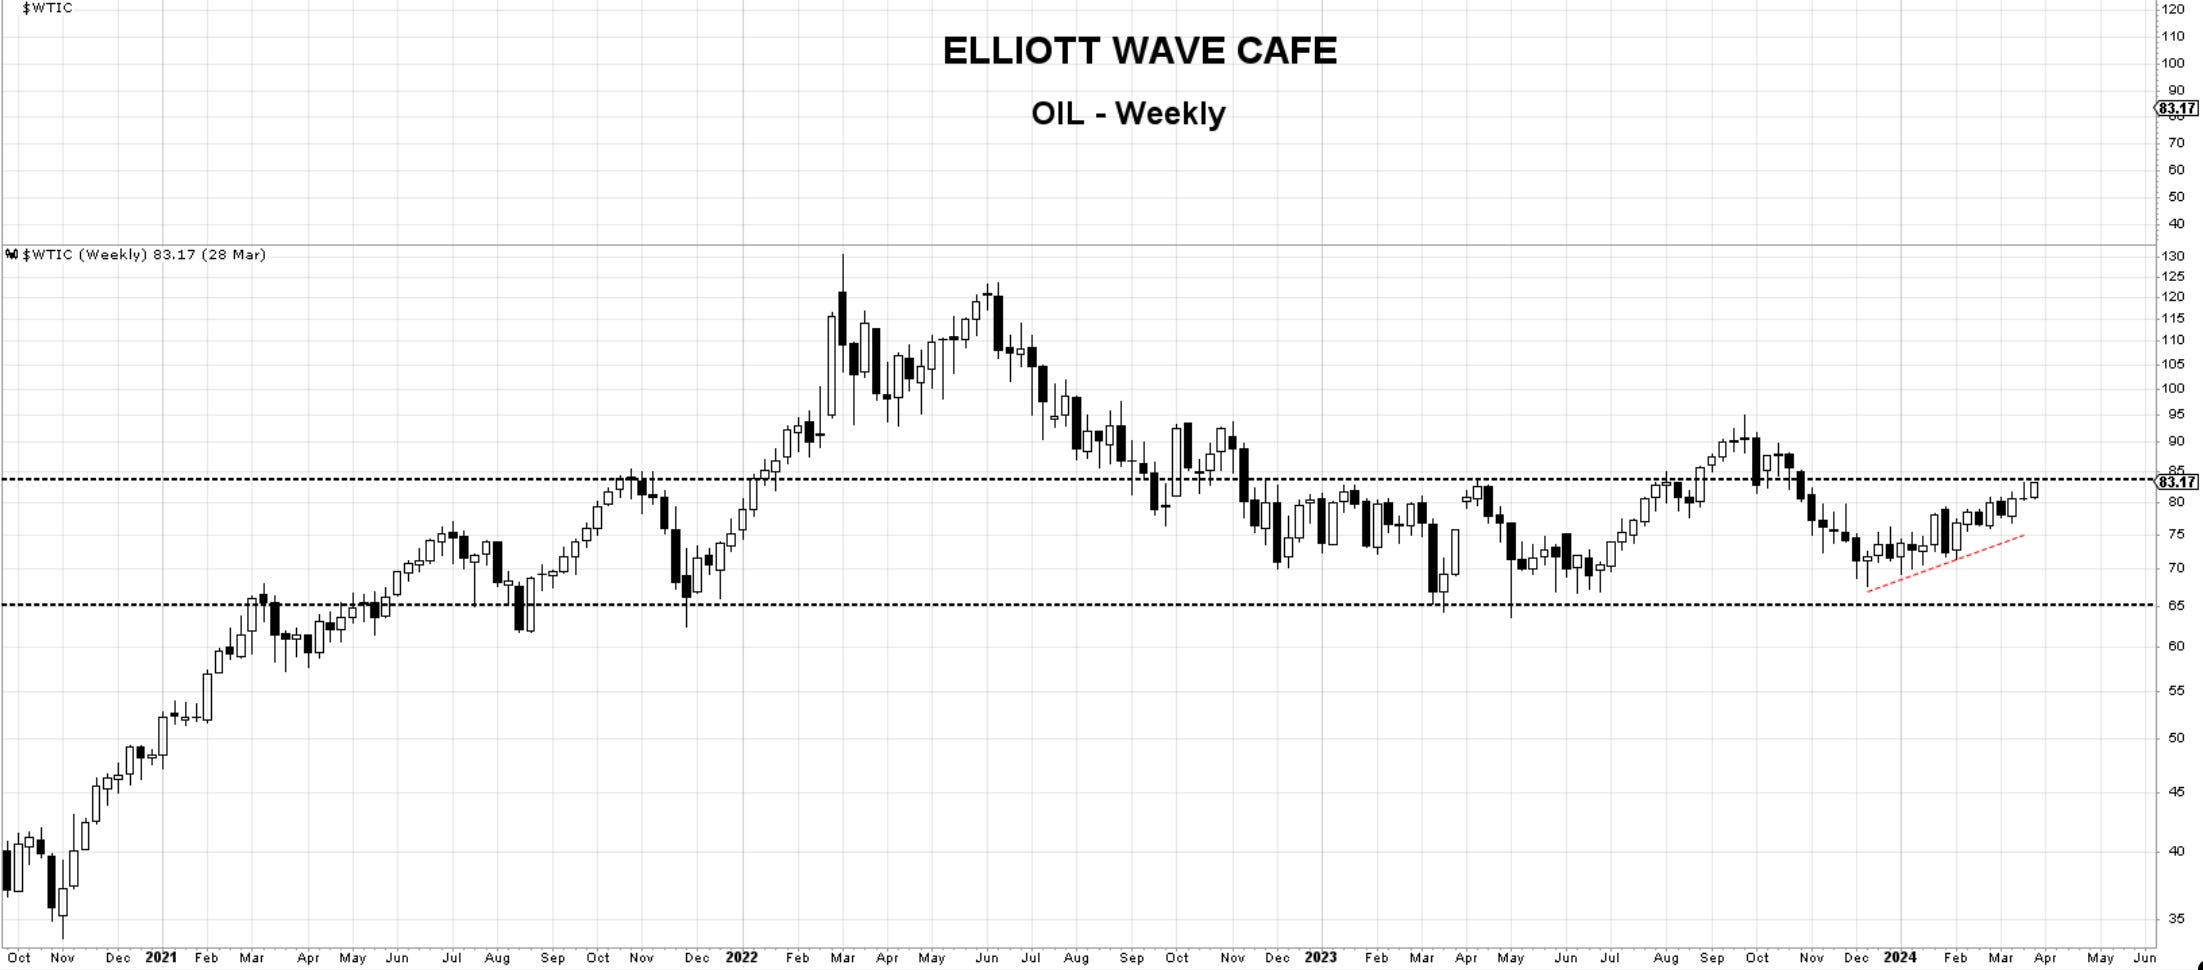
Oil — Oil is getting closer and closer to a break of the 84 level. If that happens we can say that 95 is the obvious target. Some of the energy stocks have been already moving and breaking higher in a possible anticipation of an oil breakout.
Thank you all for reading; I will see you next week. Leave a comment or suggestion below. Join our chat to discuss markets with fellow traders.
In the meantime, please consider subscribing and supporting EWCafe and read “The Daily Drip,” where I provide daily market updates, videos, and commentary on core markets.
Cris,
EWCafe
email: ewcafe@pm.me