
Weekly market review
A technical look at weekly trends in core markets.

This weekly report is free and provides a recap of the action in the core markets for the past week. For a deeper dive into market analysis, projections, elliott wave counts, technical reviews, and opportunities, check out the daily updates and videos. A 7-day free trial will give you access to my work.
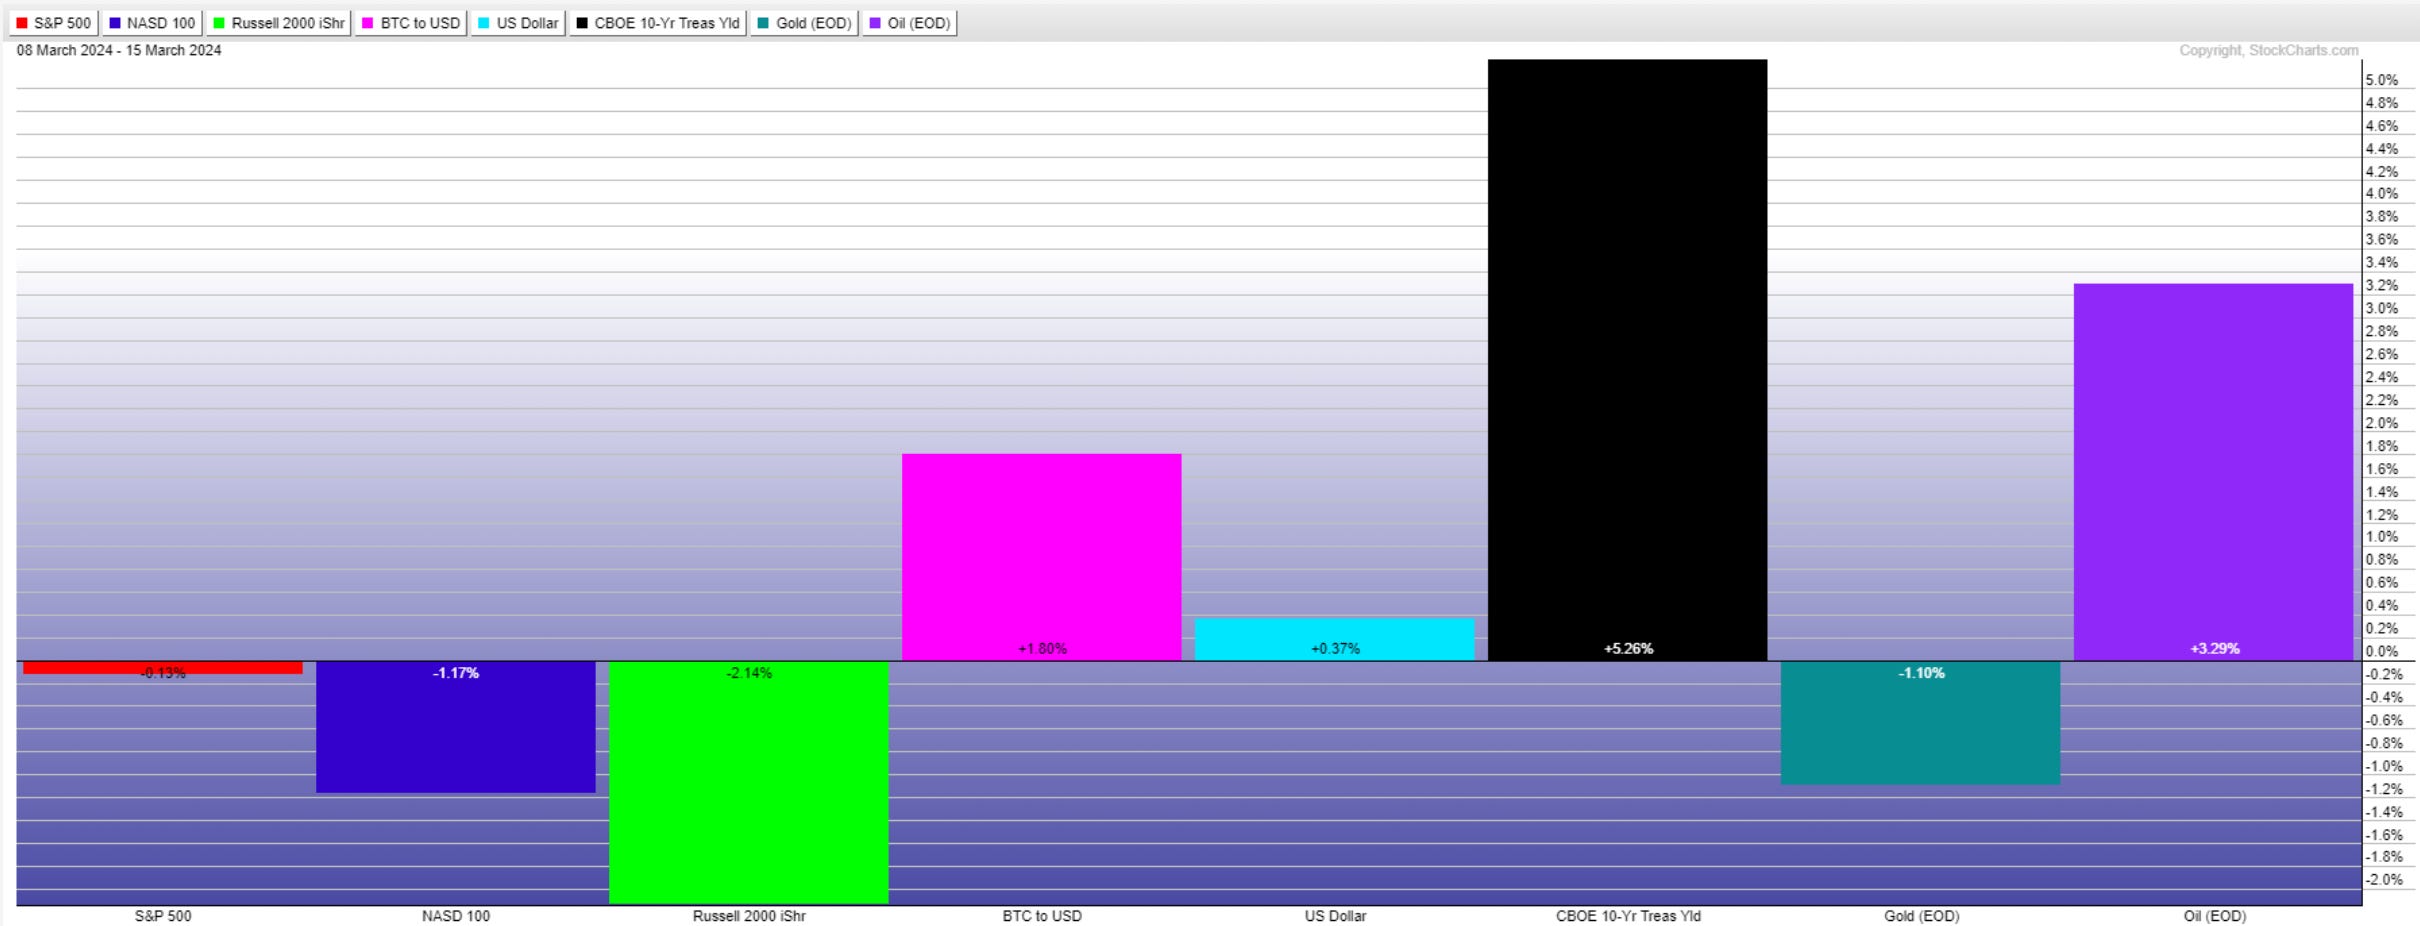
Market performance for the past week is below.
In last week’s update, we noted, “ Equity markets have retreated and are trying to signal a corrective period is approaching.”
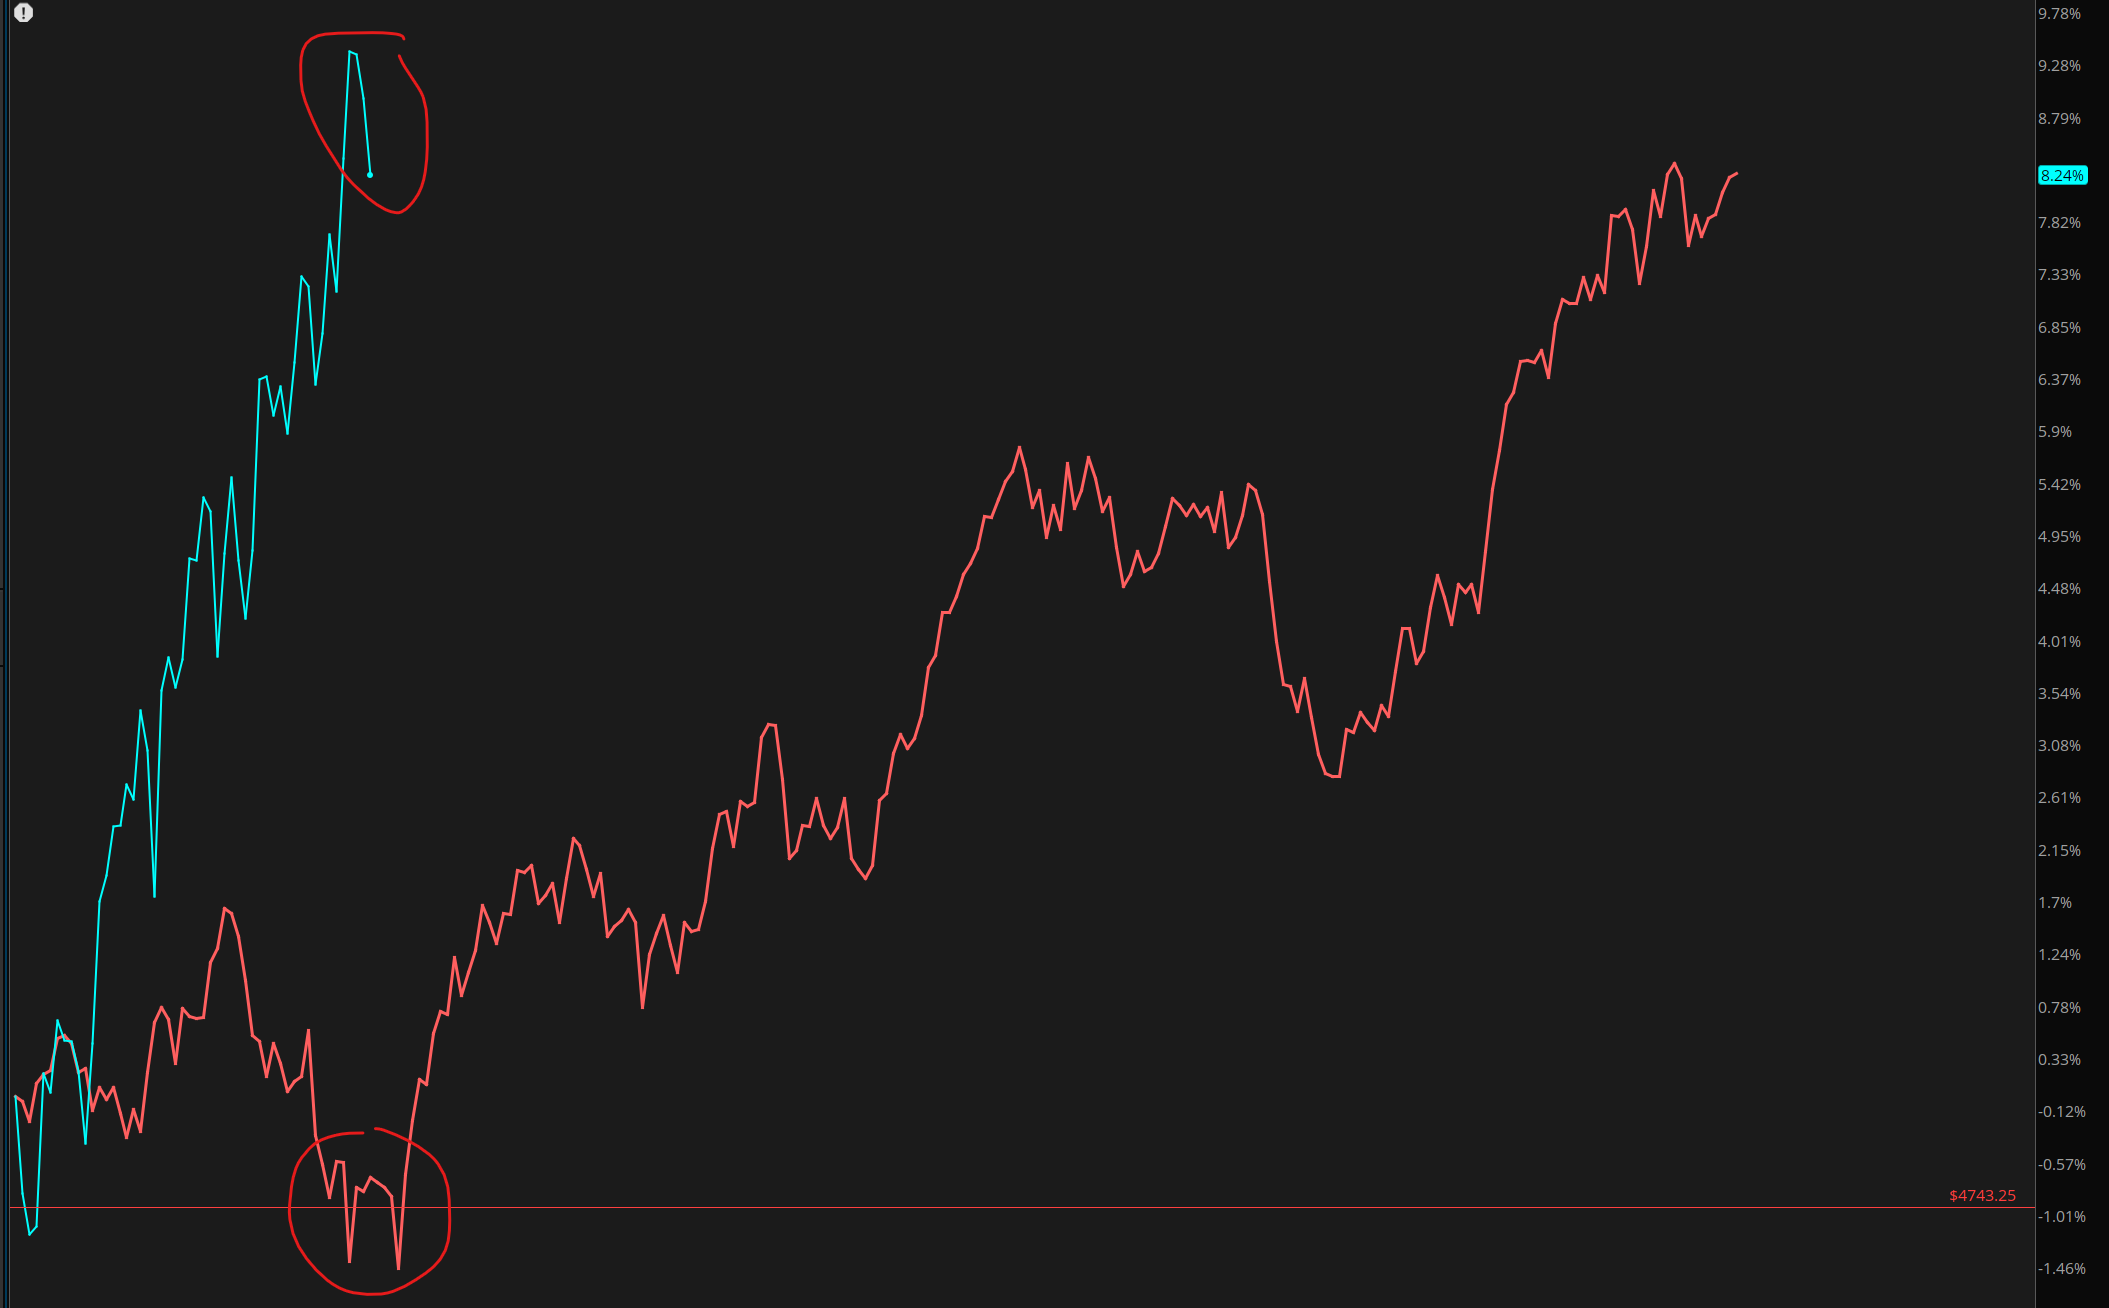
This week was followed by more of the same, and as you can see in the graph below, the rapid rise in the 10-year yields was likely the culprit for the timid market behavior. Traders found energy a place to park money during this very small downturn. Bitcoin gave back some gains as well after hitting 73,666.
Sentiment
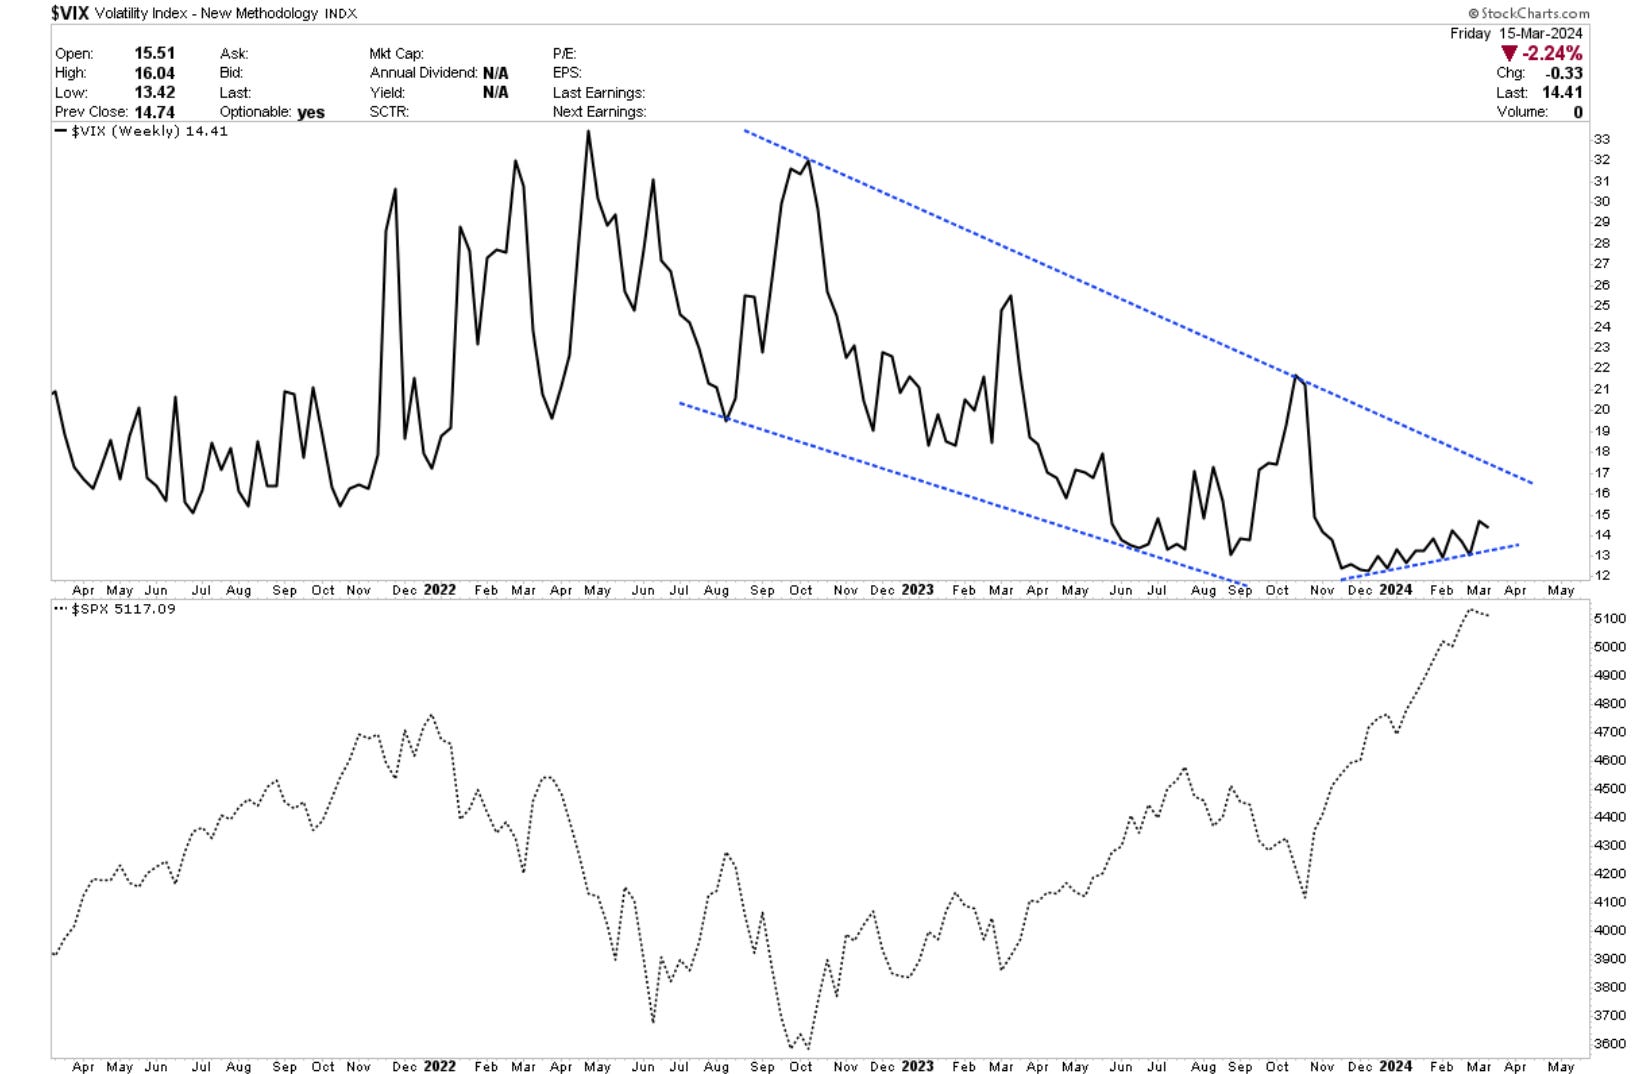
Volatility continues to creep higher week after week at a slow rate. Nothing too concerning yet but if we get above 16, action could become a bit more dramatic.
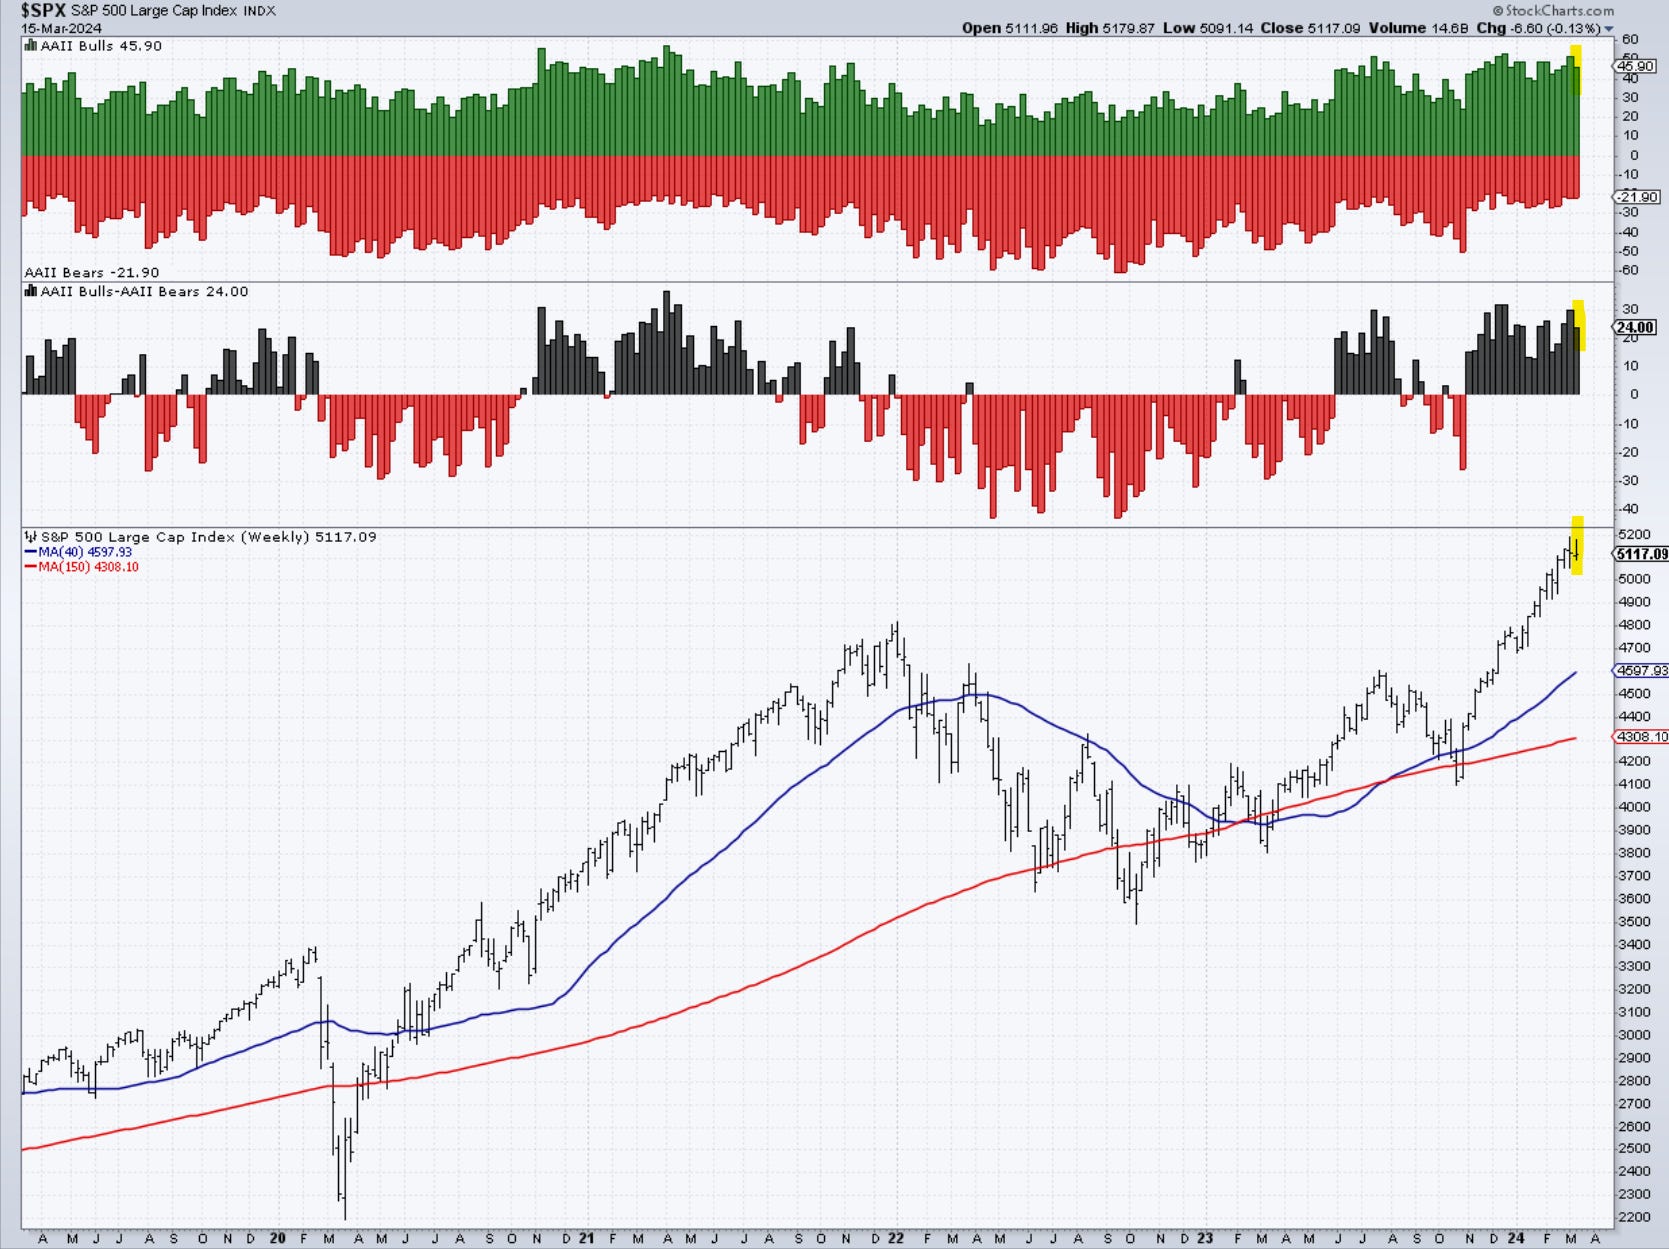
last week - The spike in the bull-bear spread this week is somewhat concerning and is trying to signal a nearby top approaching. It’s at the highest levels since December of last year.
update - bullish sentiment was slightly reduced this week, but continues to remain quite elevated. In case markets turn down from here, it will create a big surprise based on this sentiment tool.
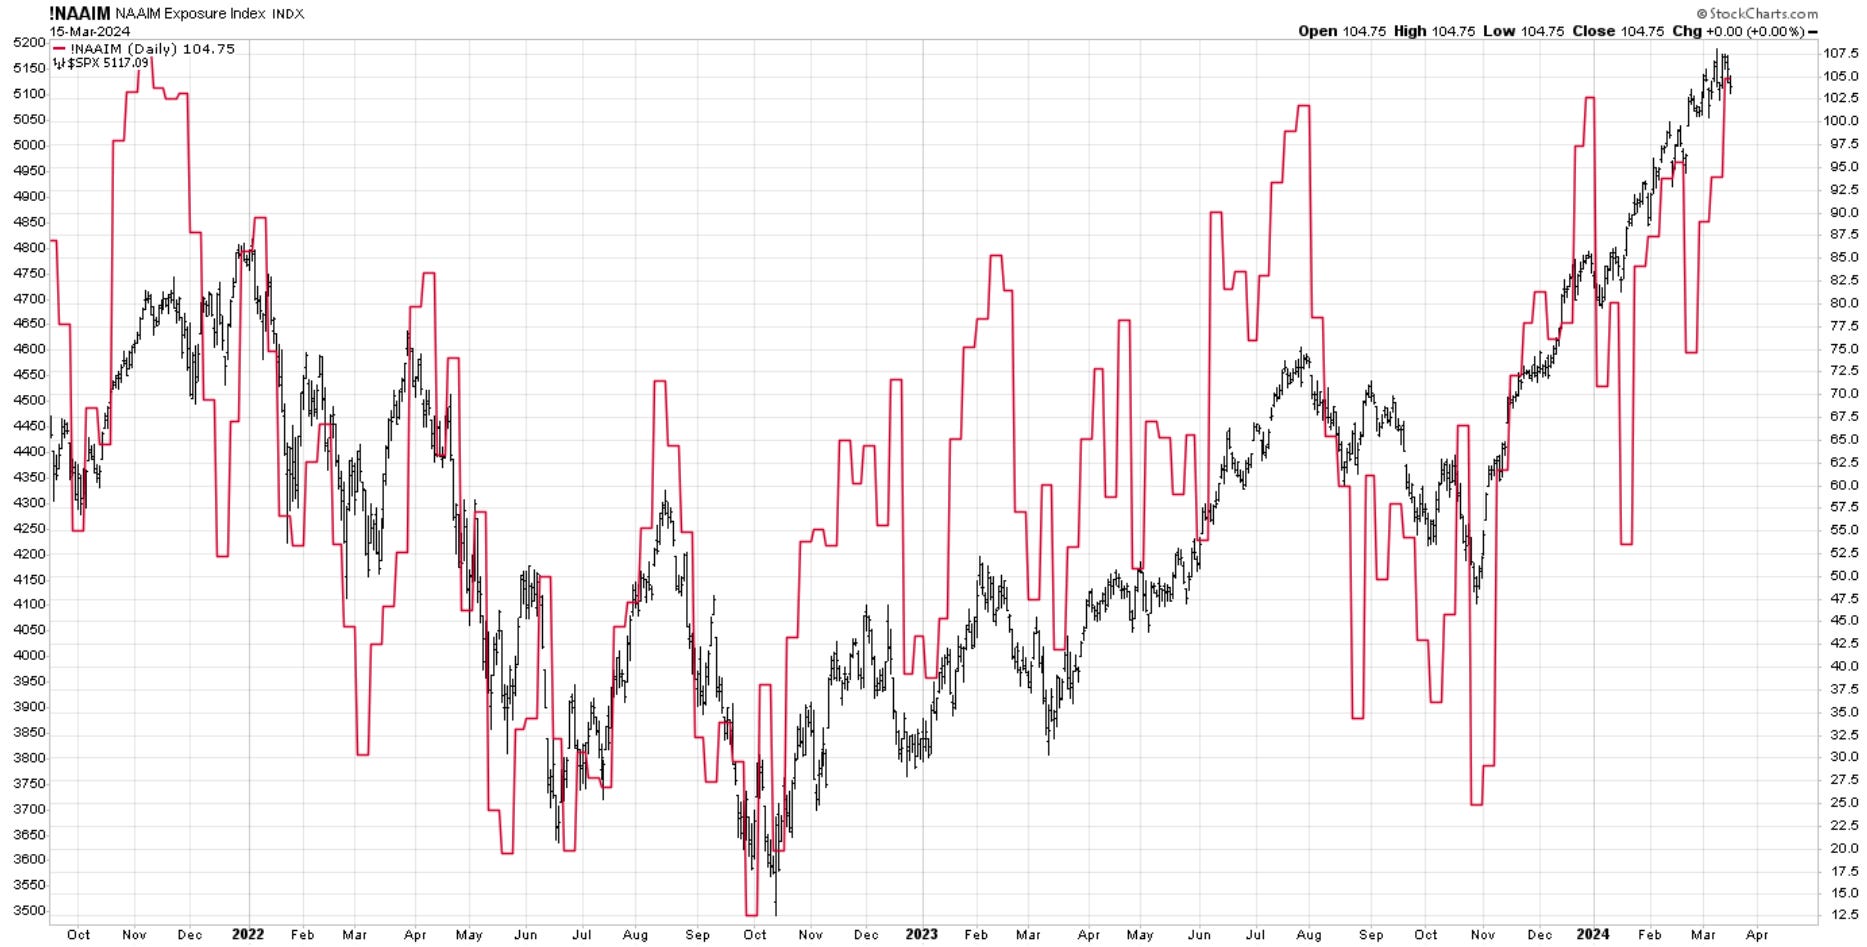
If you’re an investment manager and you want to chase the market, you might as well do it at all-time highs ( sarcasm). Look at the spike in exposure to equity markets. I would be very wary of this signal. It might not mean anything but a brief market dip to reset it, but it is flashing yellow.
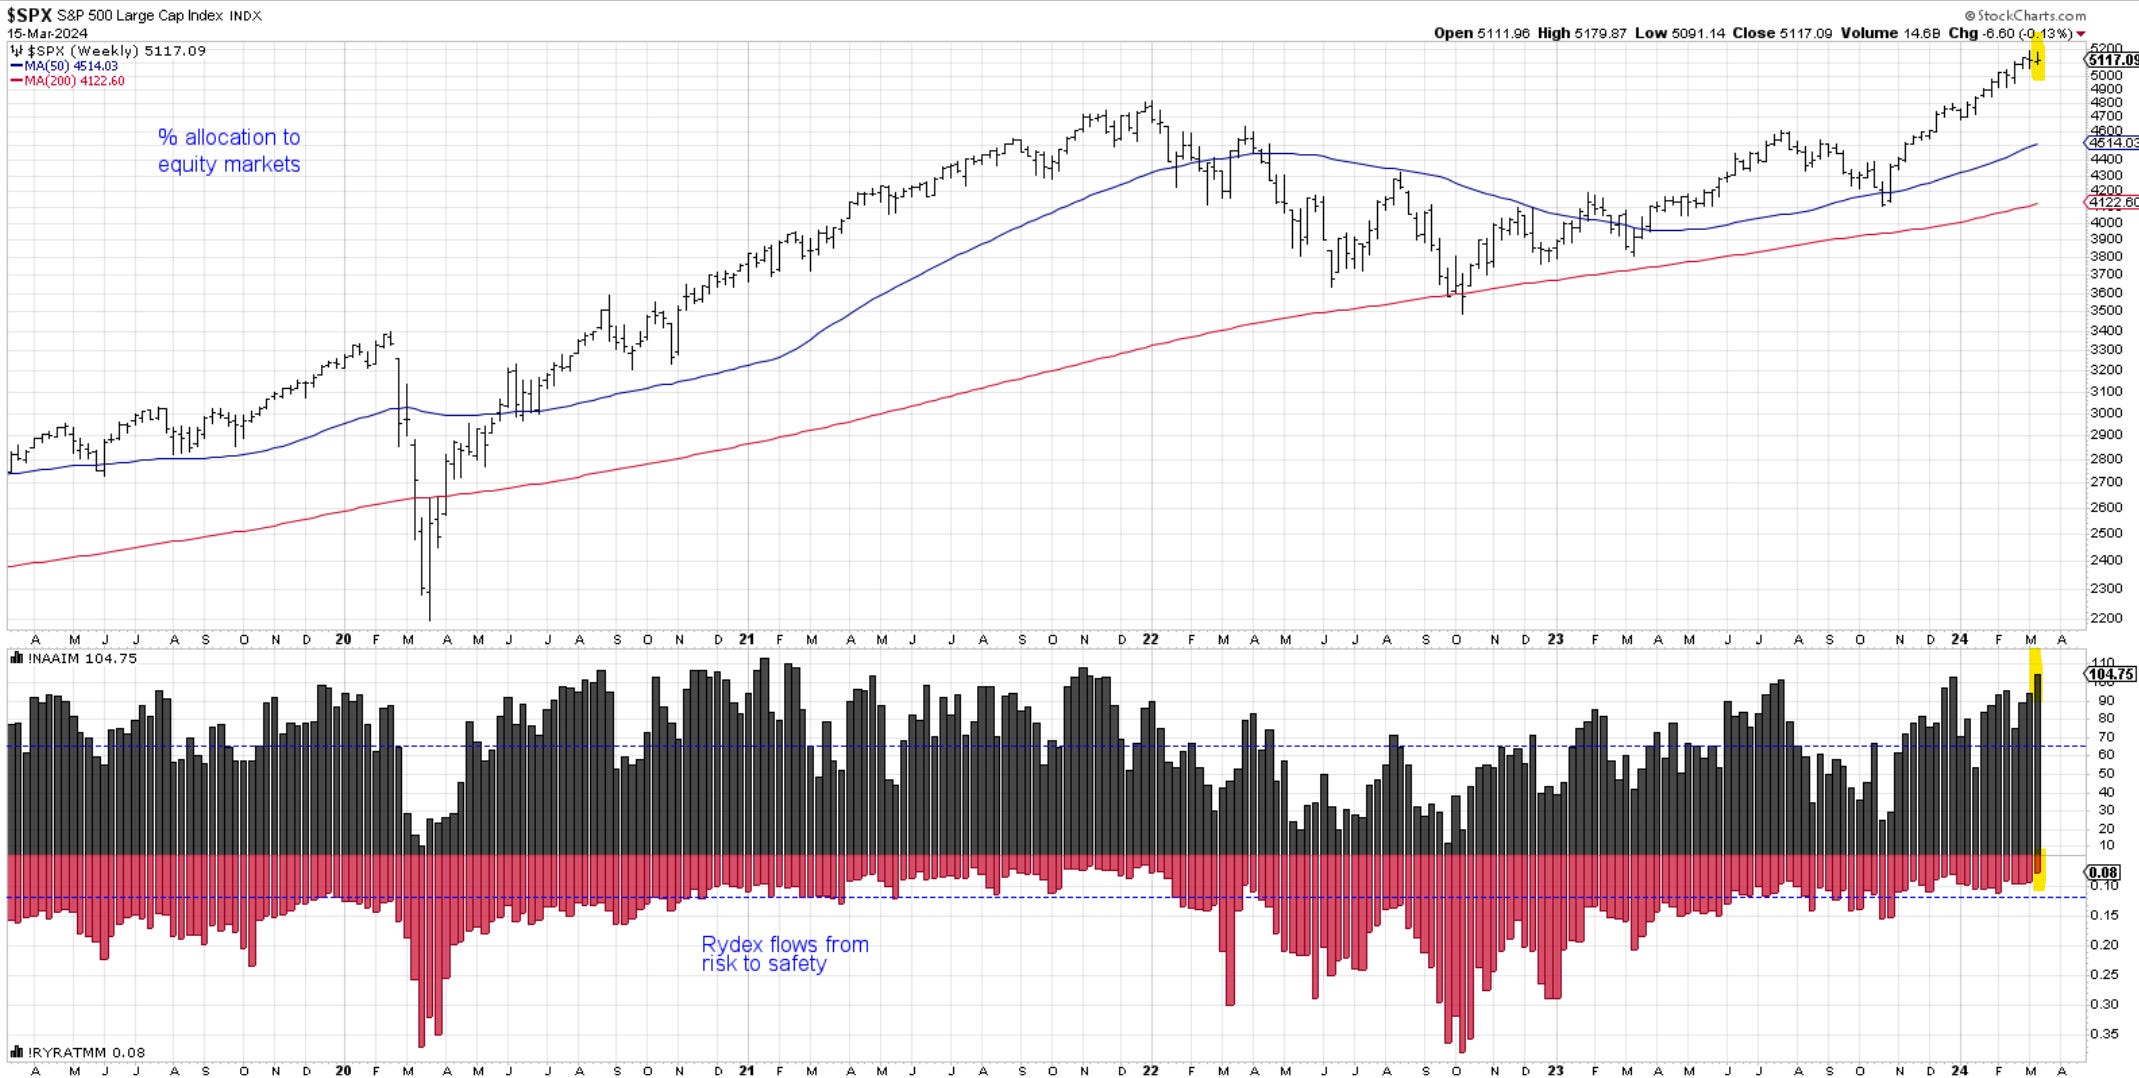
The red line is the percentage allocation.
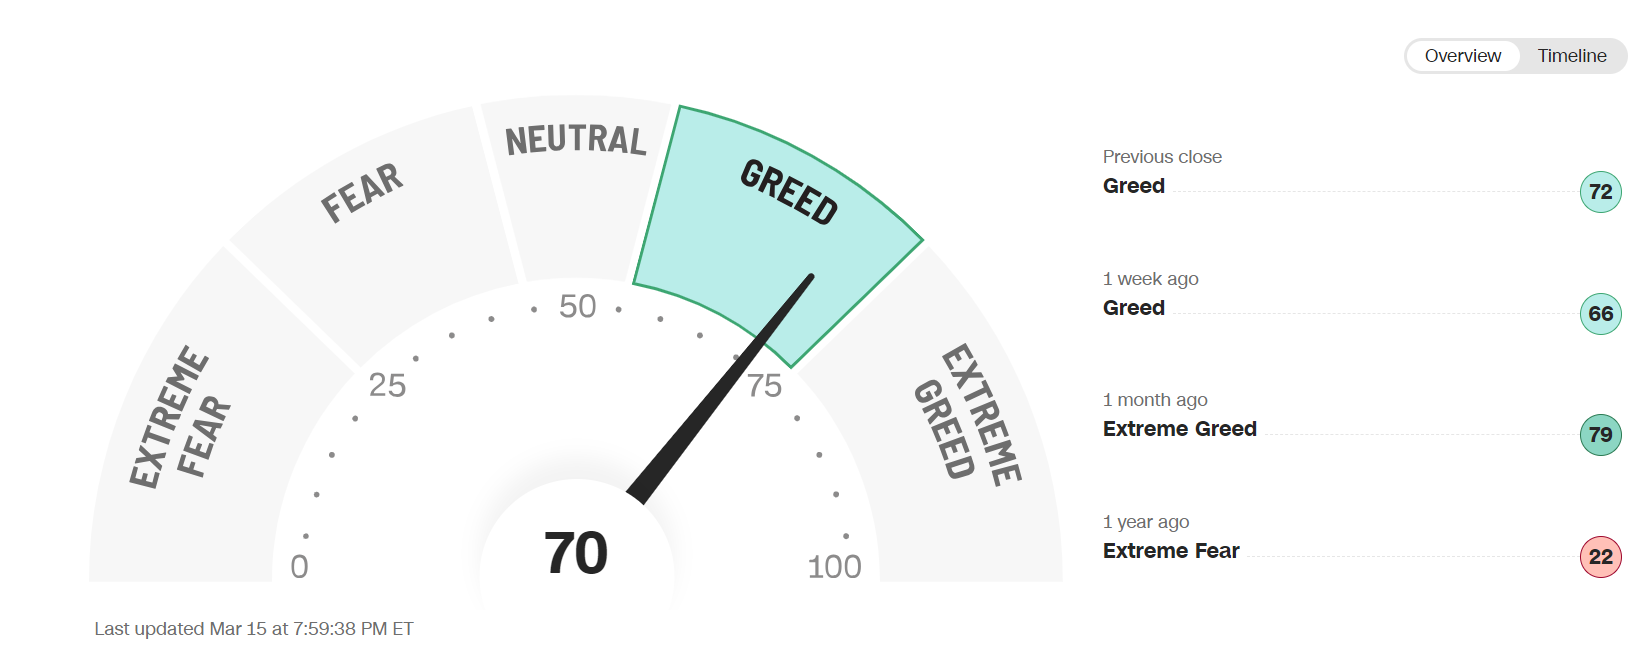
The sentiment section would not be complete without the CNN gauge of Fear vs. Greed.
Not a big change from last week, traders are somewhat complacent.
Cycles
Note: cycles refer to time projections only not price projections.
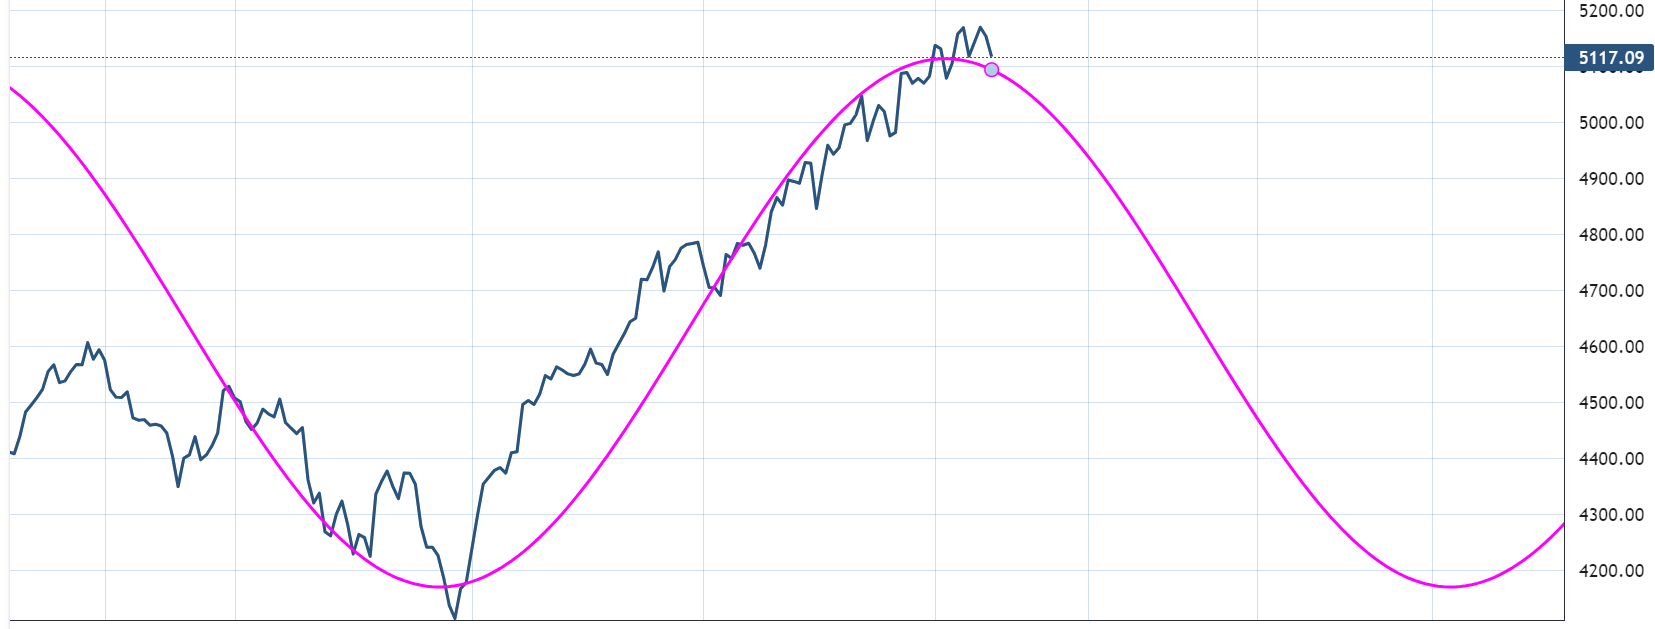
SP500 . The weekly cycle remains bullish into yearend.
last week note - The Daily suggests weakness starting to develop this month and lasting into May-June.
update - The 180-day cycle remains toppy.
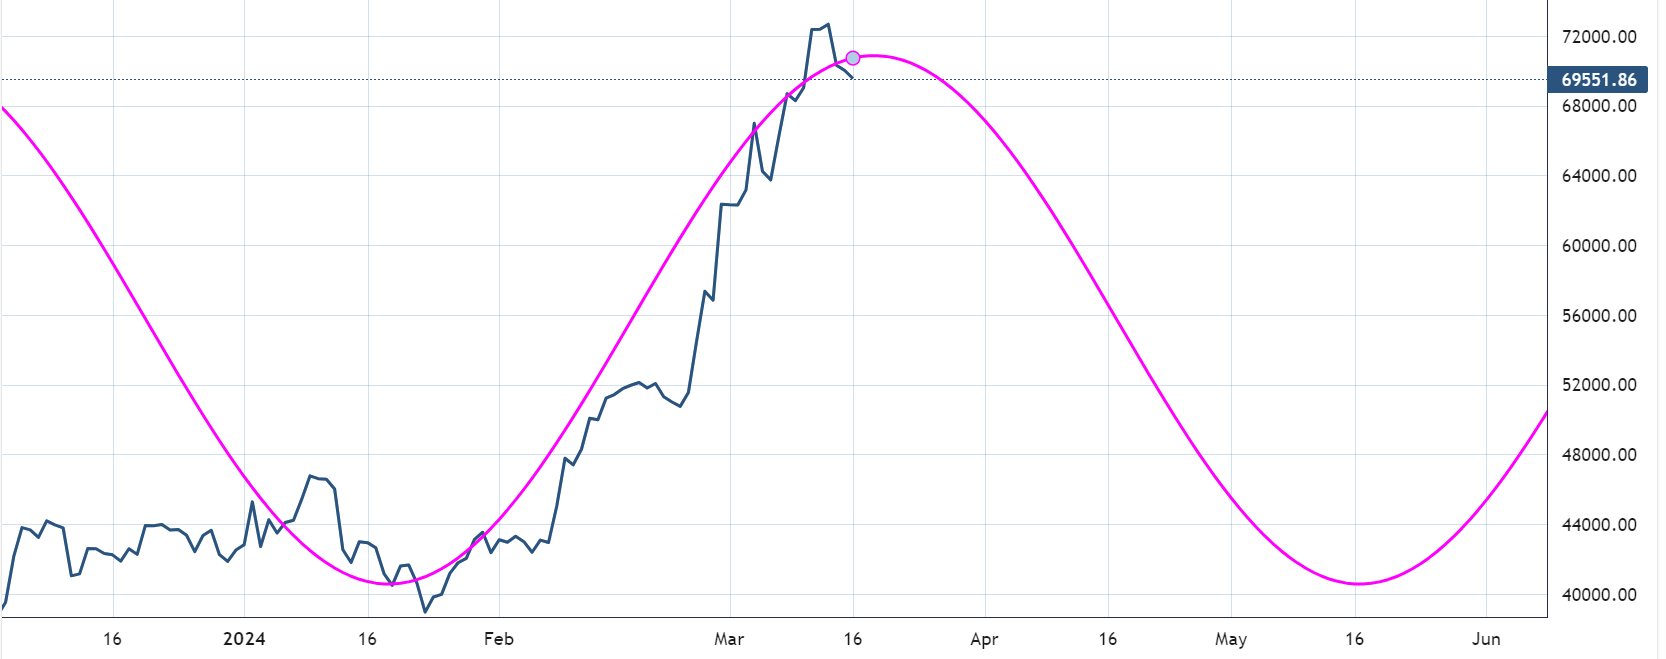
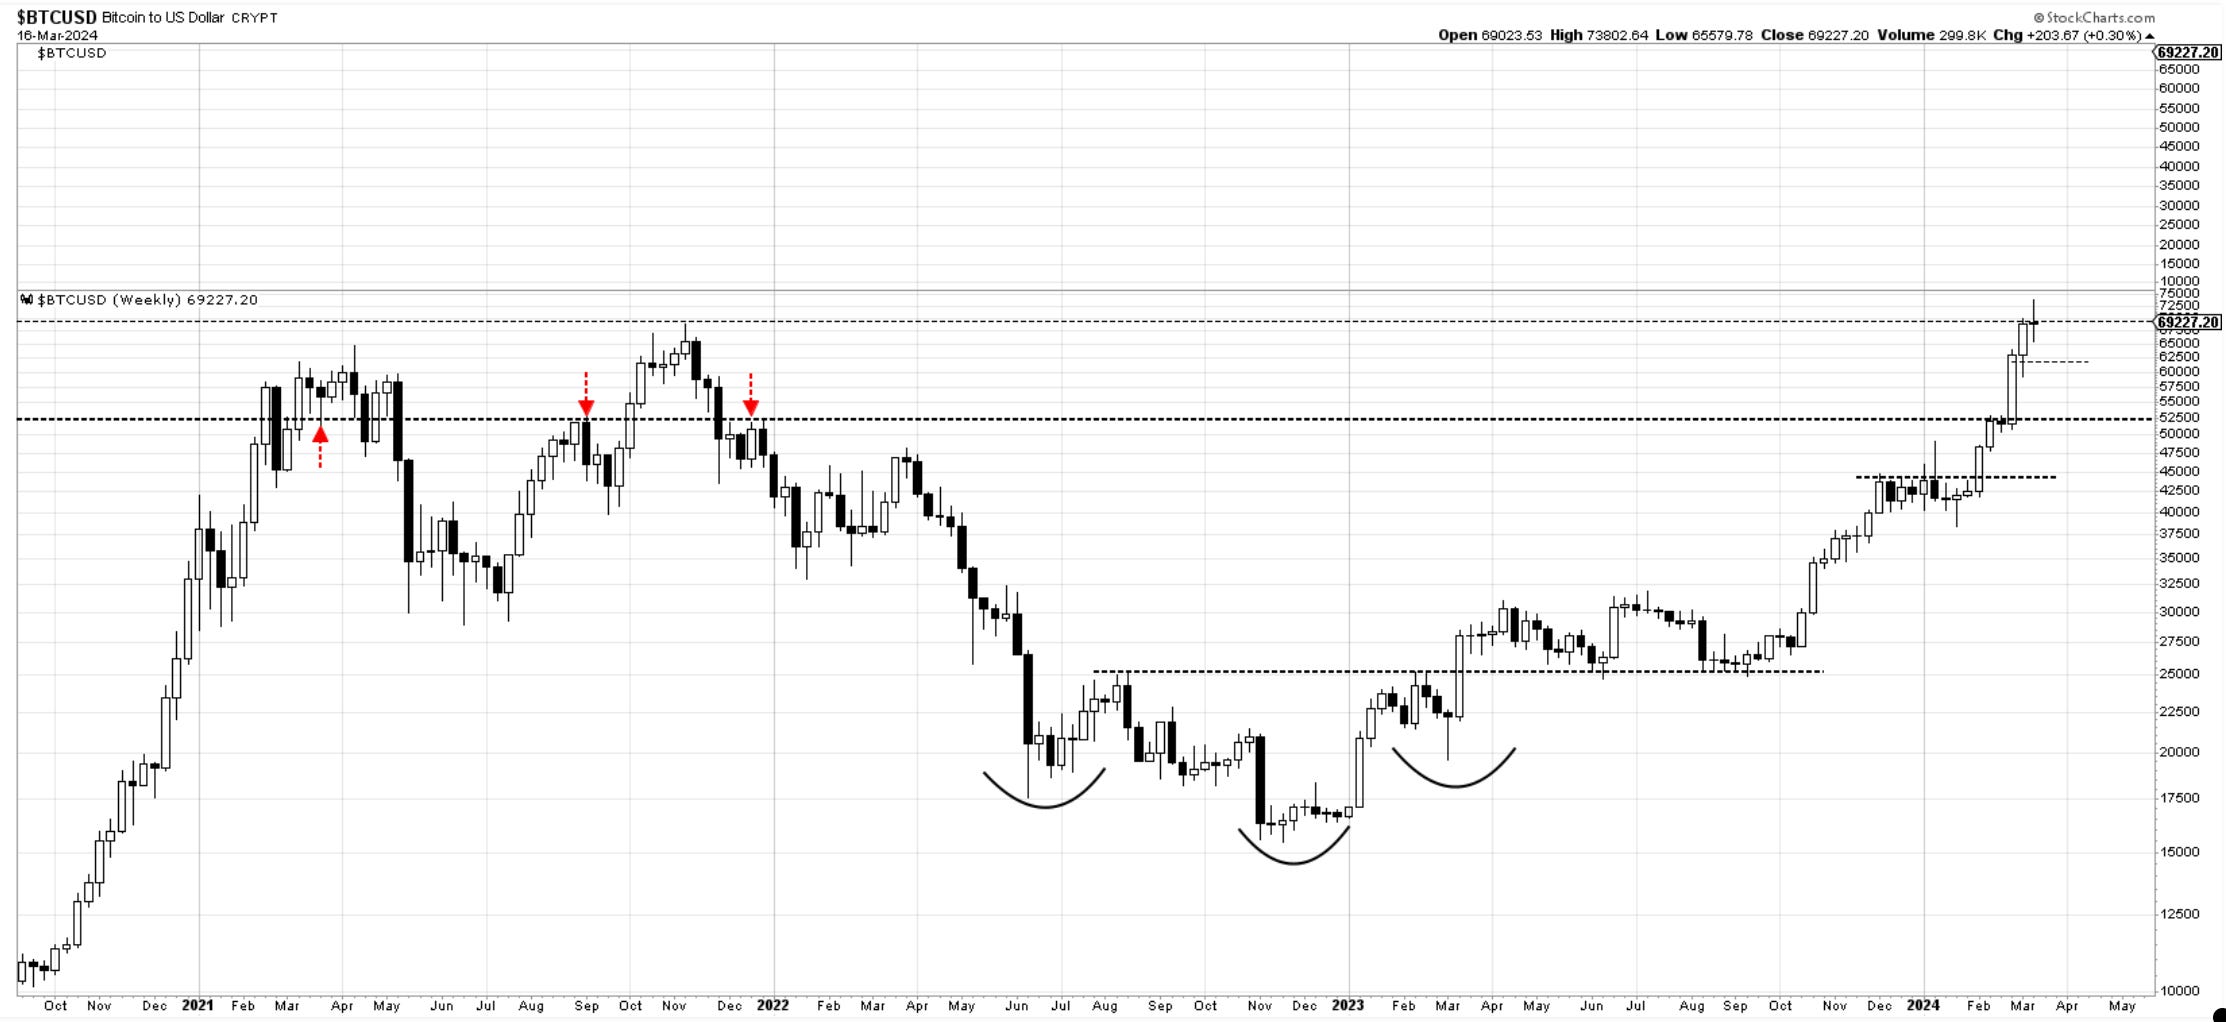
BTCUSD remains bullish, with a cycle-topping projection about 3 months away.
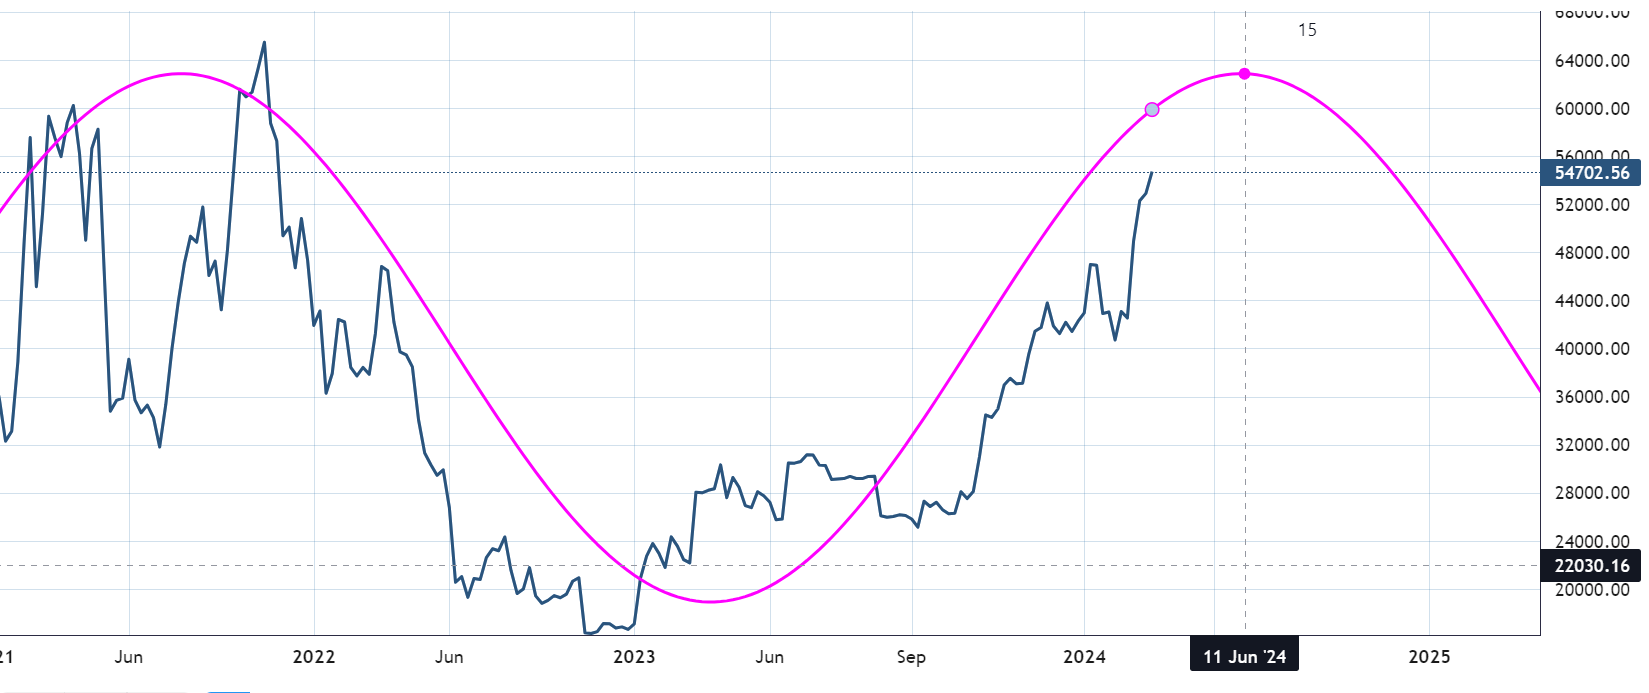
The daily cycles suggest a bit of caution near term. Probably, the chunk of the move was already made, and a corrective-sideways period is becoming more likely.
Breadth
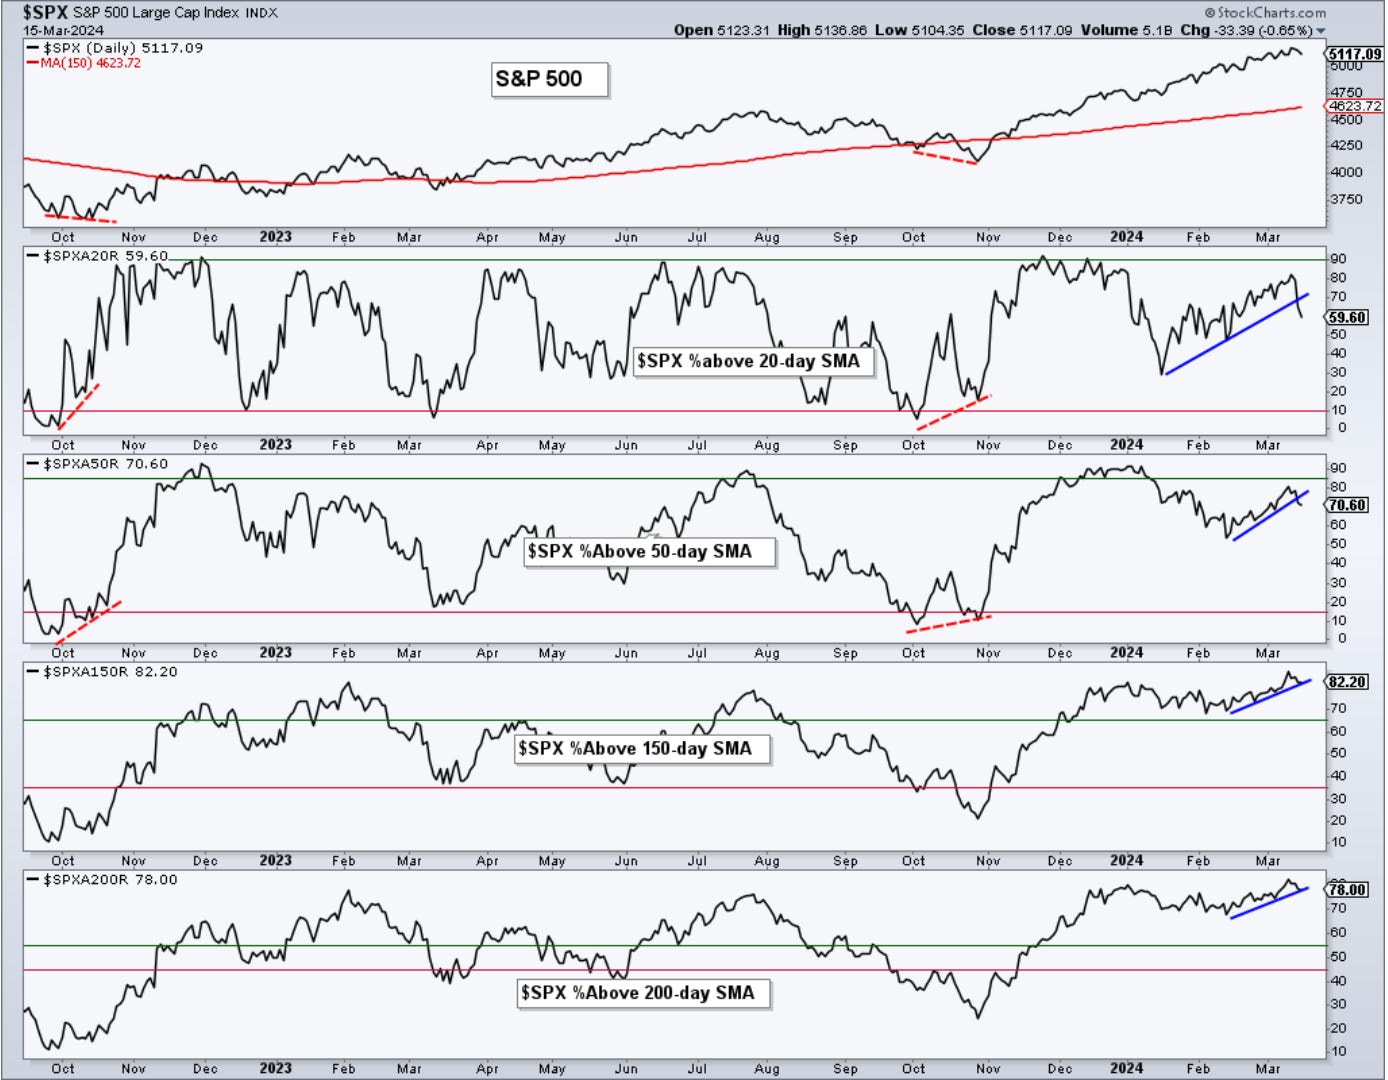
Here are percentages of stocks above key moving averages in the SP500.
last week - Most Stocks in the Sp500 remain established on bullish trends above their 200, 150, and 50-day moving averages. Percentages have increased since last week; however, at the smaller 20-day, we seem to be stalling. This metric will very likely be lagging price behavior, but I would keep a close eye on the daily updates if we start to lose more and more of the 20-day supports.
Update: We have lost quite a few stocks above their 20-day moving average, and we’re now at 59% from over 80%. Let’s keep an eye on the 50-day metric, as many money managers watch that as a line in the sand for selling out of positions. It has weakened.
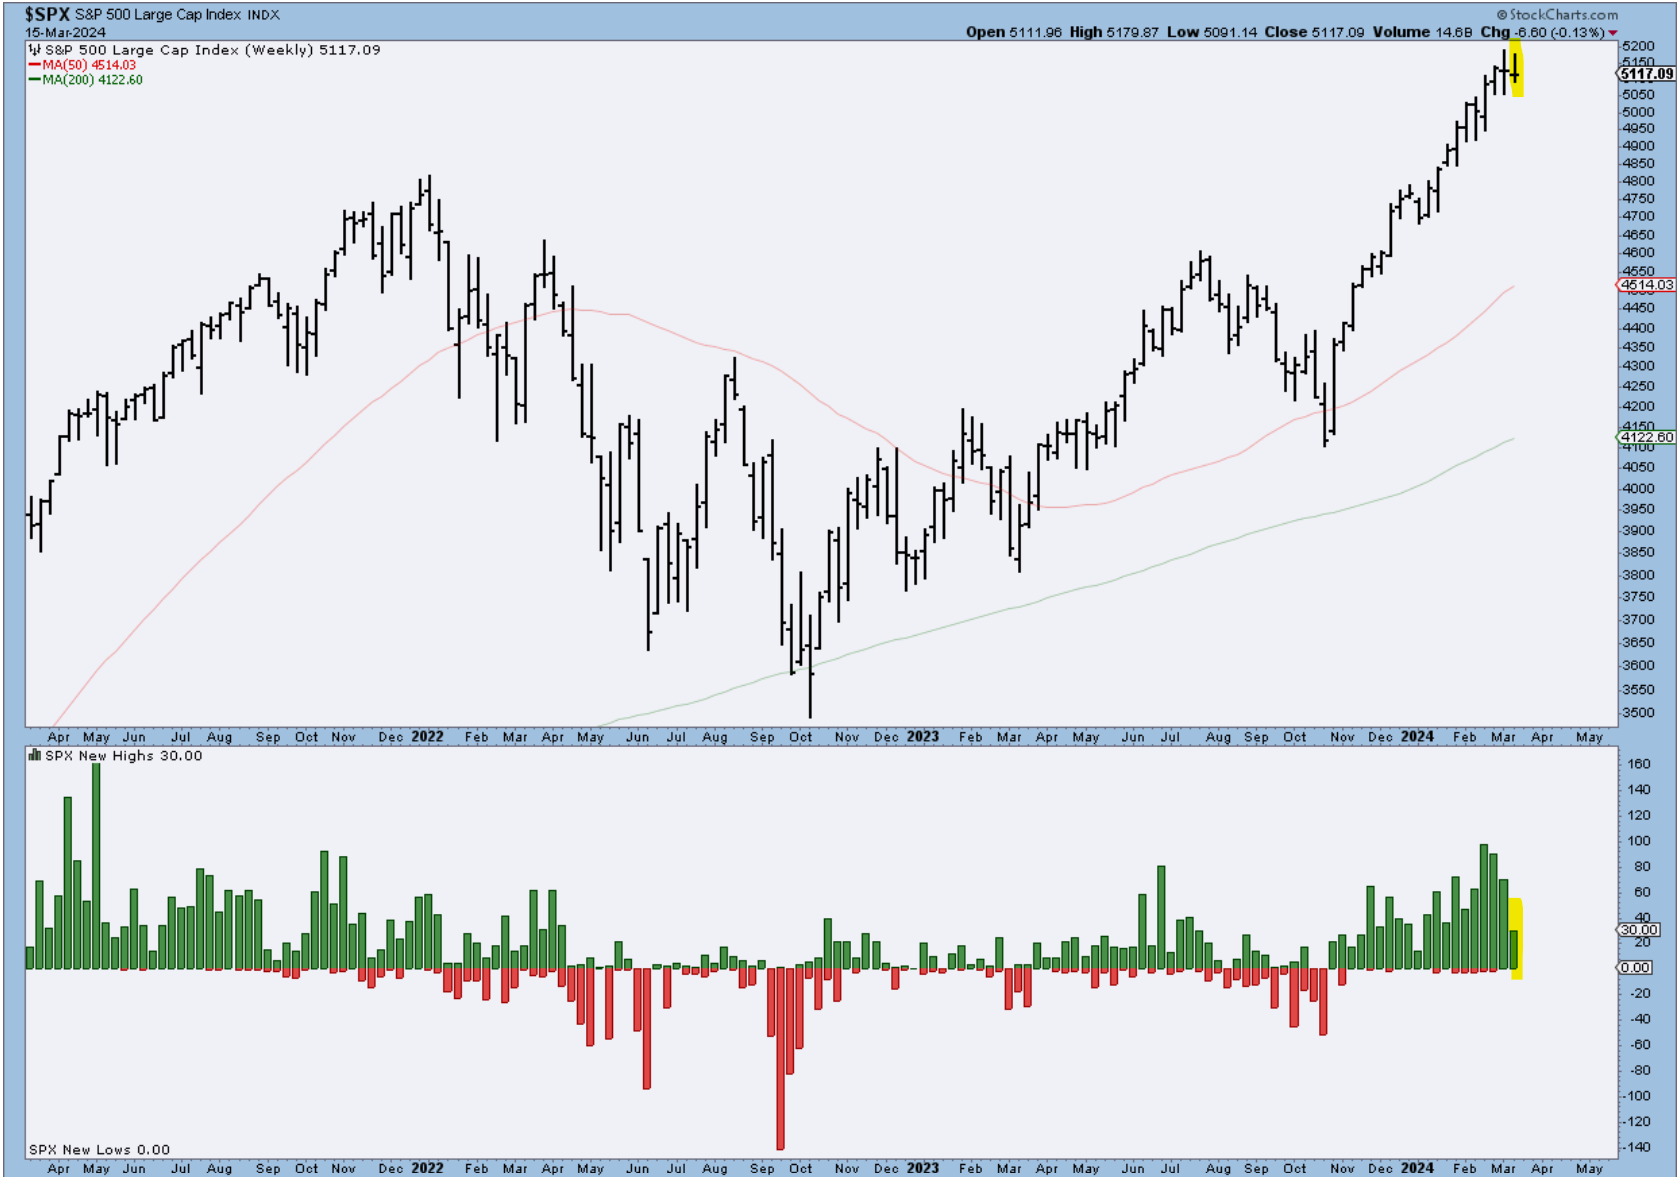
last week - Less 52-week highs this week and on the decline since the top 2 weeks ago. A small red flag, in my view, with price seemingly stalling into a doji formation. Losing 5050 in the Sp500 should bring additional selling.
Update: - only 30 new highs this week. Last week’s red flag continues to flutter in the wind.
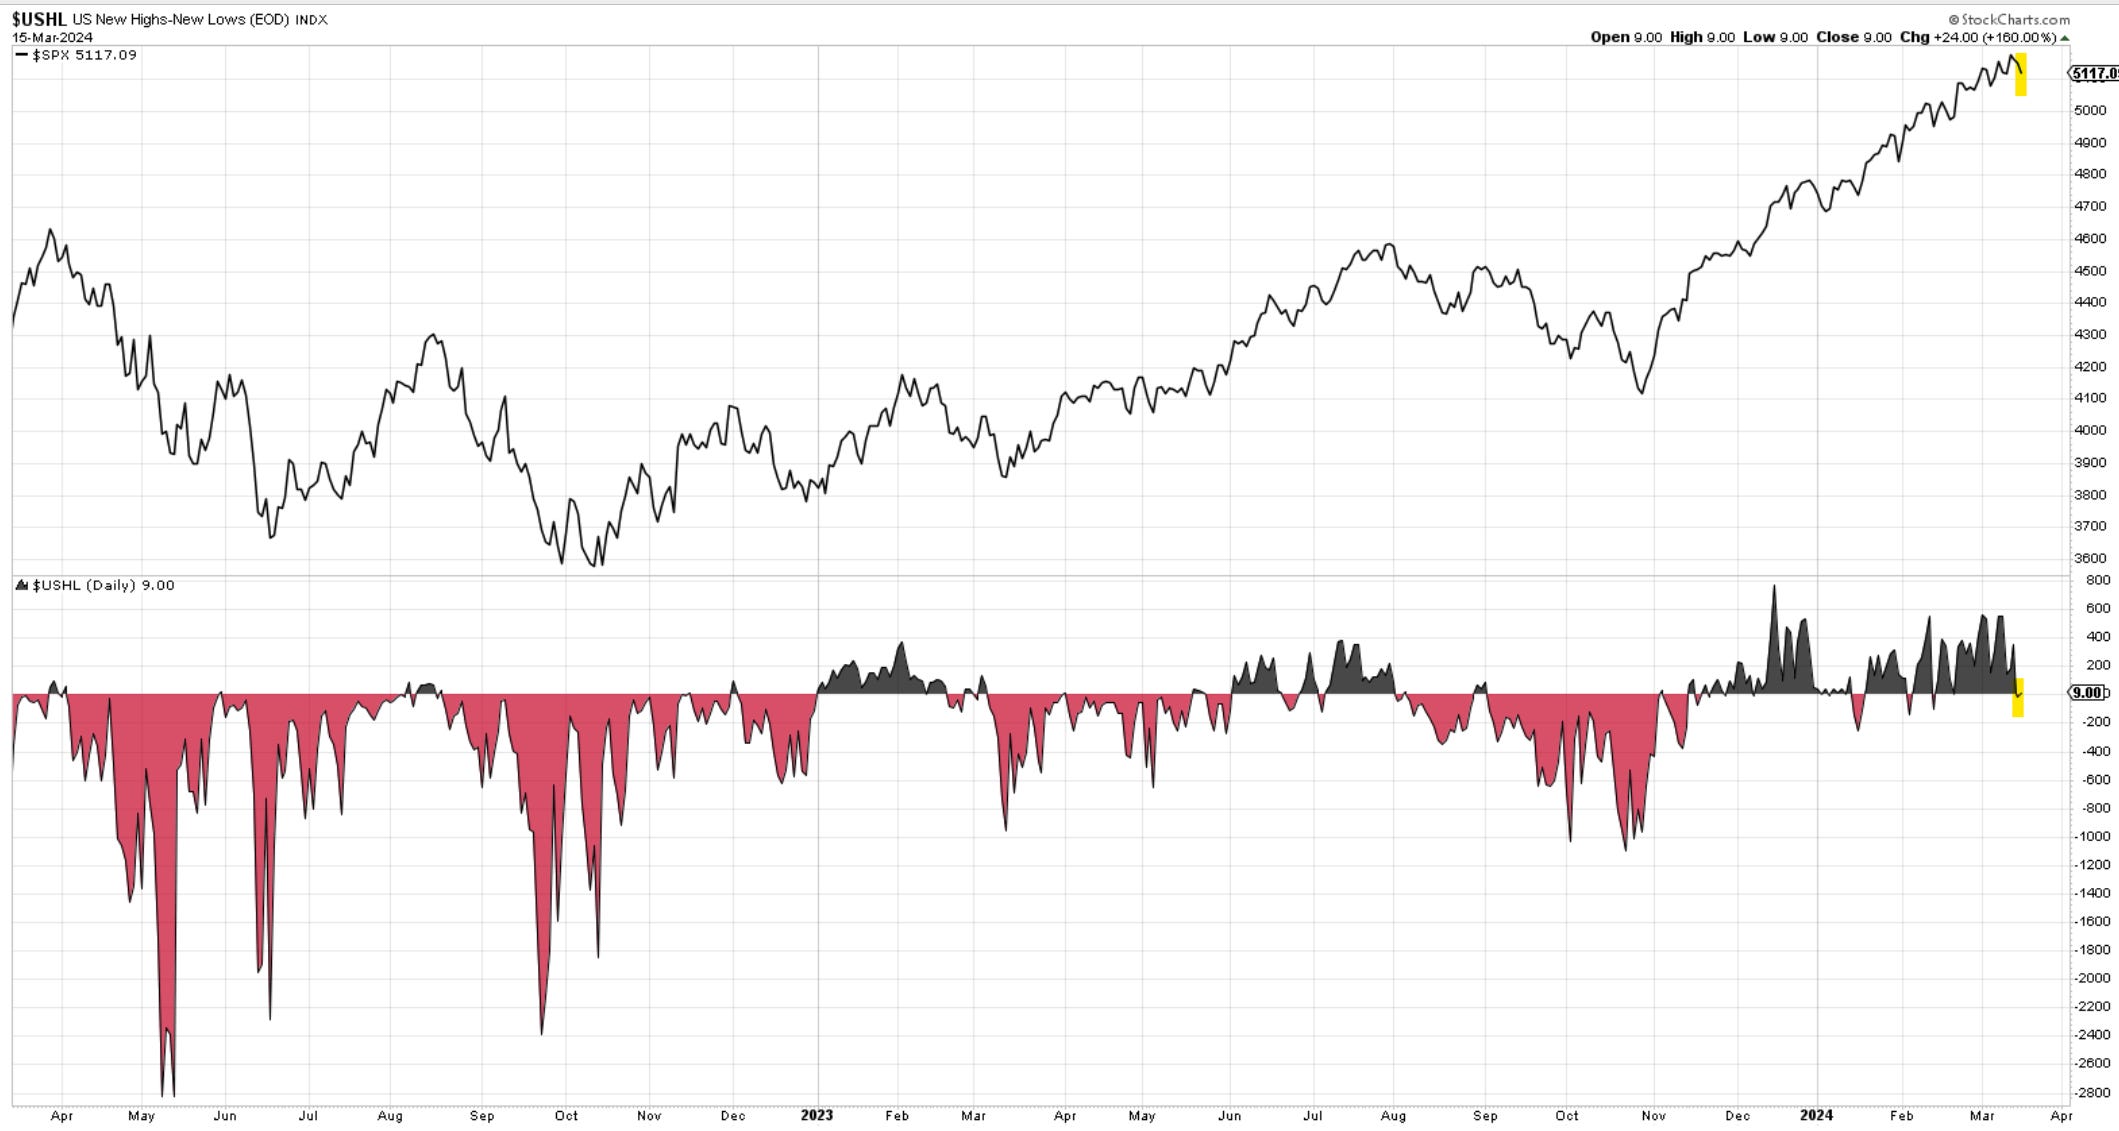
last week - Here is the total new US highs vs. new lows. Black is good, red is bad. 564 new highs last week and 558 this week.
update - only 9 . ouch.
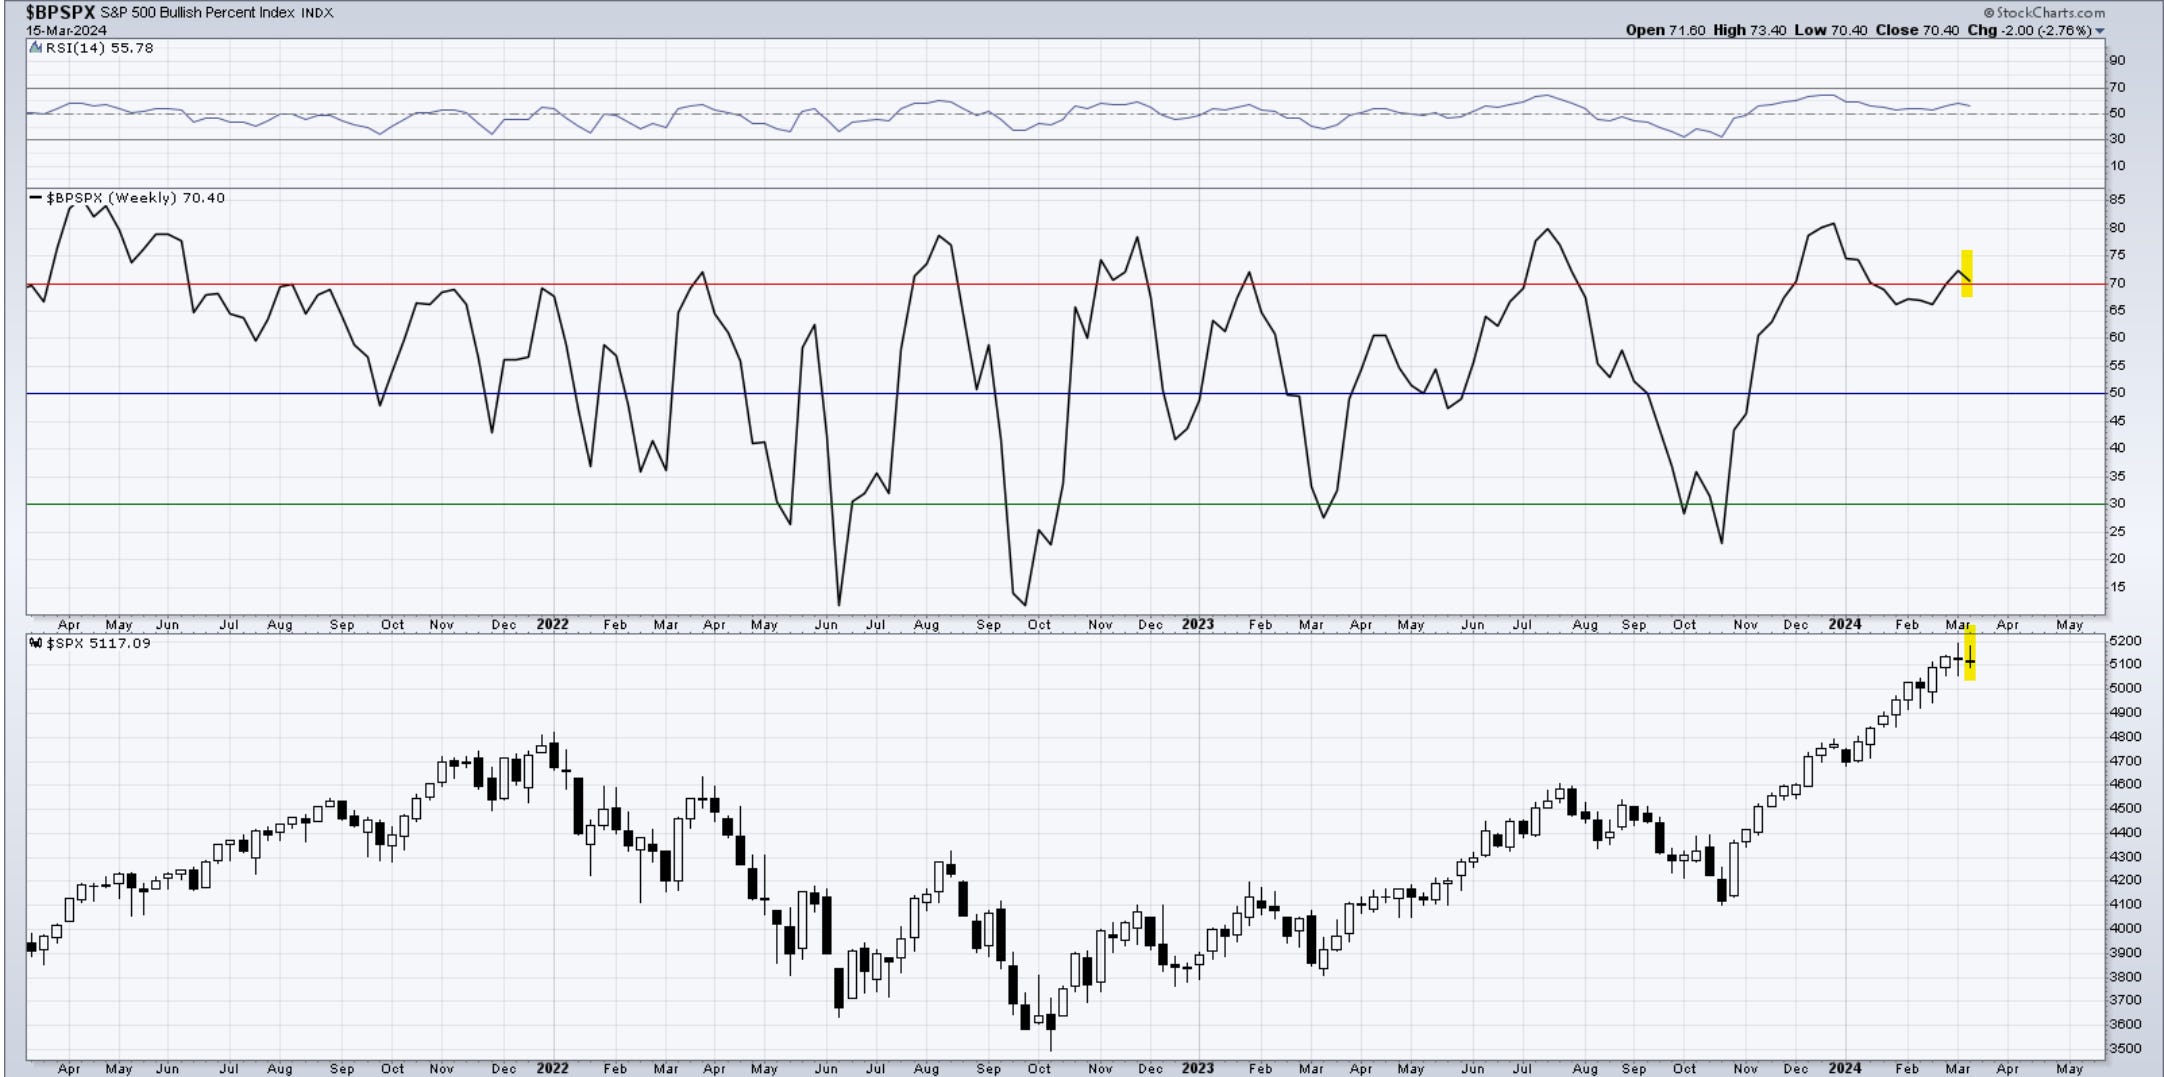
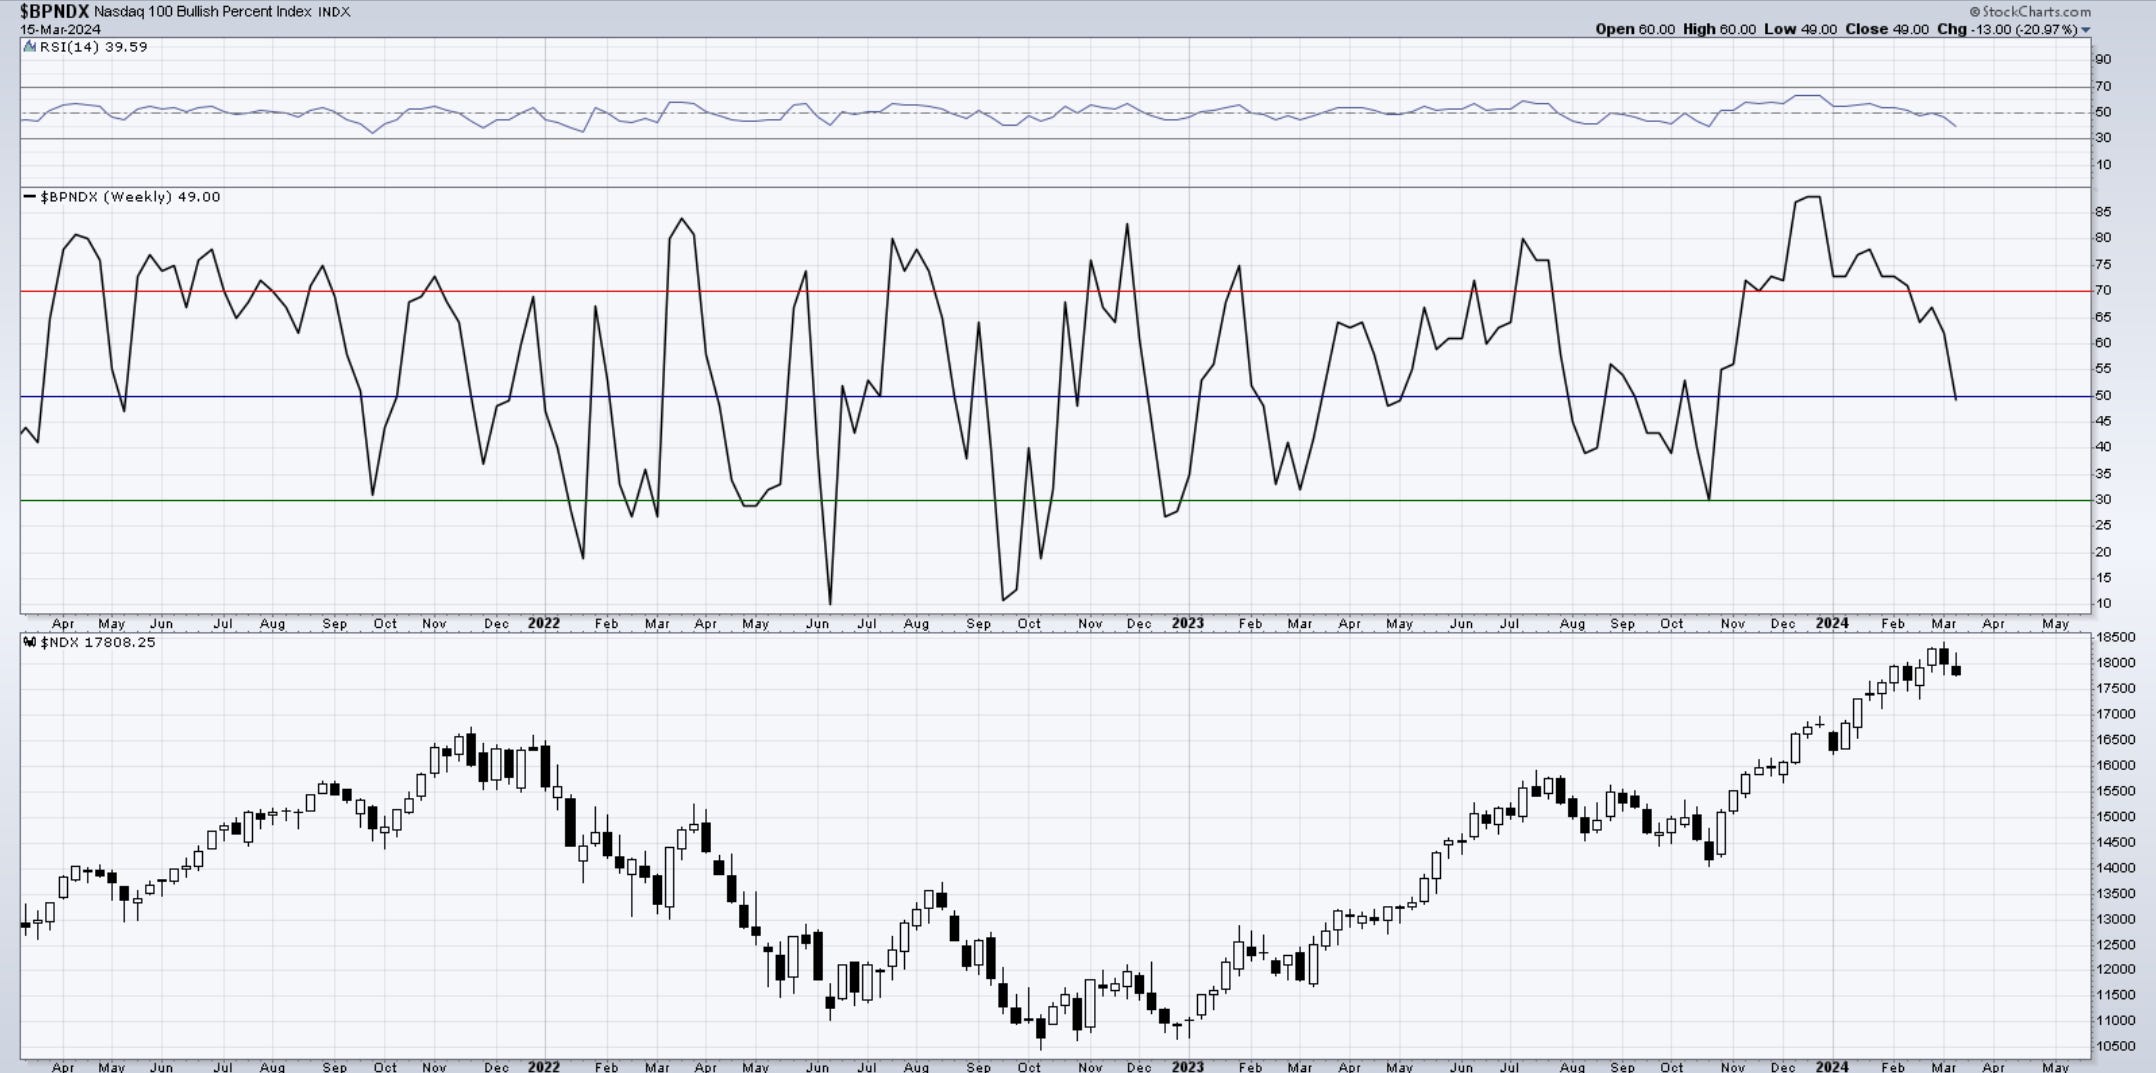
last week - The Bullish Percent Index has increased above 70 this week and remains in bullish territory. It needs to get below 50 to raise larger concerns.
Update: starting to turn near 70 on the SPX, but check out NDX below. Below 50 we’re getting into bearish setups territory.
Seasonality
SP500. Here is the daily price action during the month of March. The first half of the month tends to be more positive, followed by some weakness later on.
update- equity prices are starting to respond to this. We are now getting into a weak period until month end.
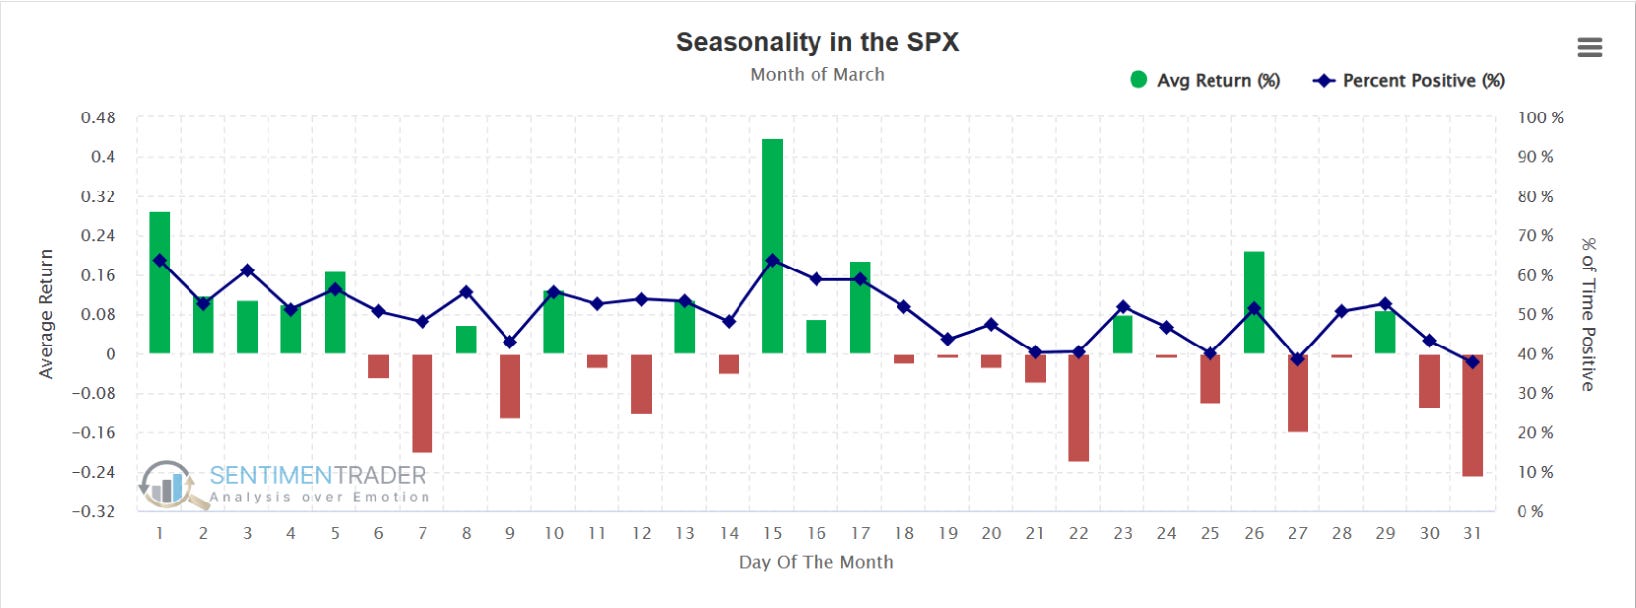
Seasonality was quite delayed or ignored from February until now. We still have until the end of March, and then the tendencies are bullish again.
Price
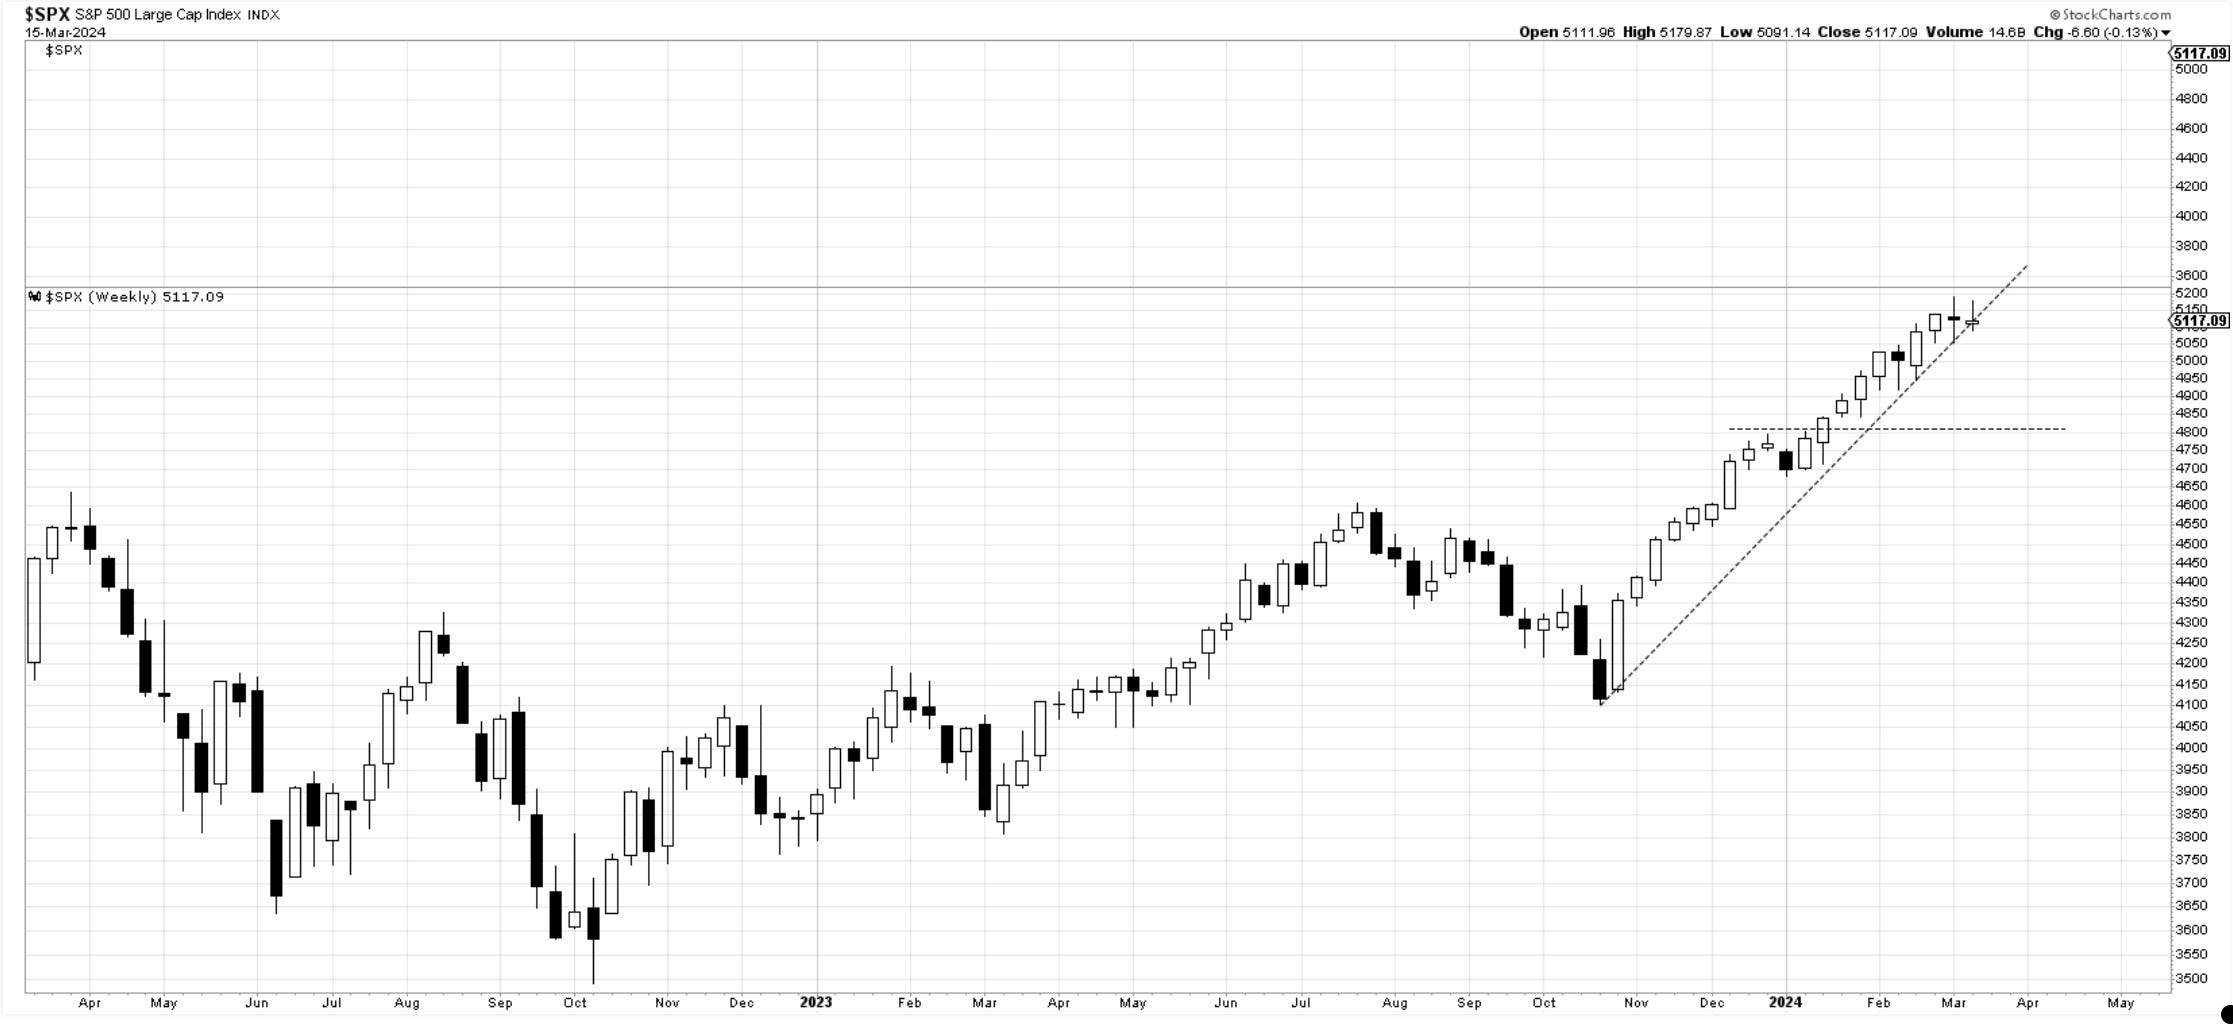
SP500. Not only did we not make another higher high, but we closed 6 points lower than last week. There is no clear violation of the uptrend here yet, but this stagnation is sounding a small alarm bell. Notice how both candles reject the 5180 level. If we overtake that, it’s game on once again. You lose 5050 and 4900 becomes a real possibility.
last week - If you haven’t seen this yet here it is in terms of contrarian sentiment indicators.
update : we’re keeping this on display to remind us of magazine covers.

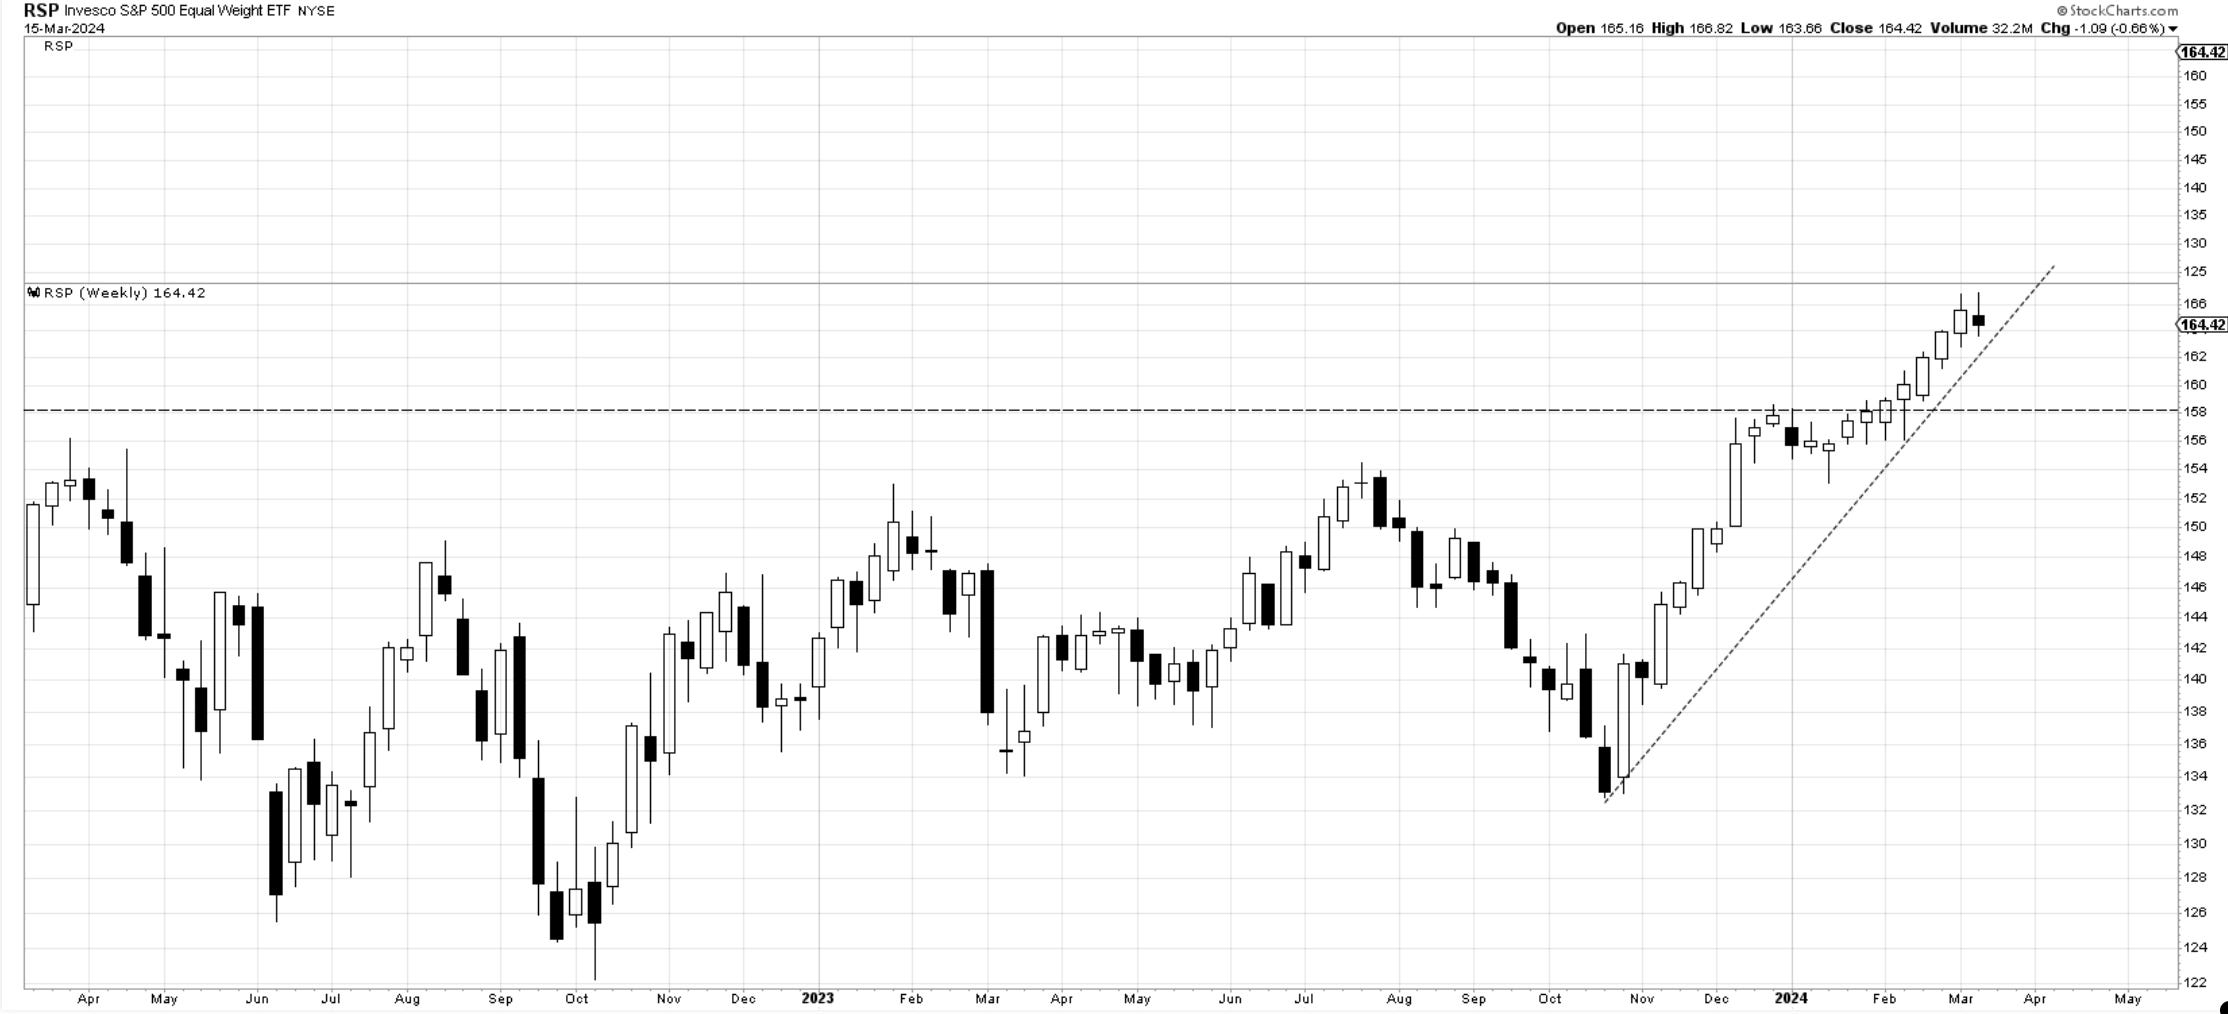
RSP - equal weight SP500. A small bearish close but no prices have gone below the prior week’s low. If we lose that, testing that horizontal line comes into focus.
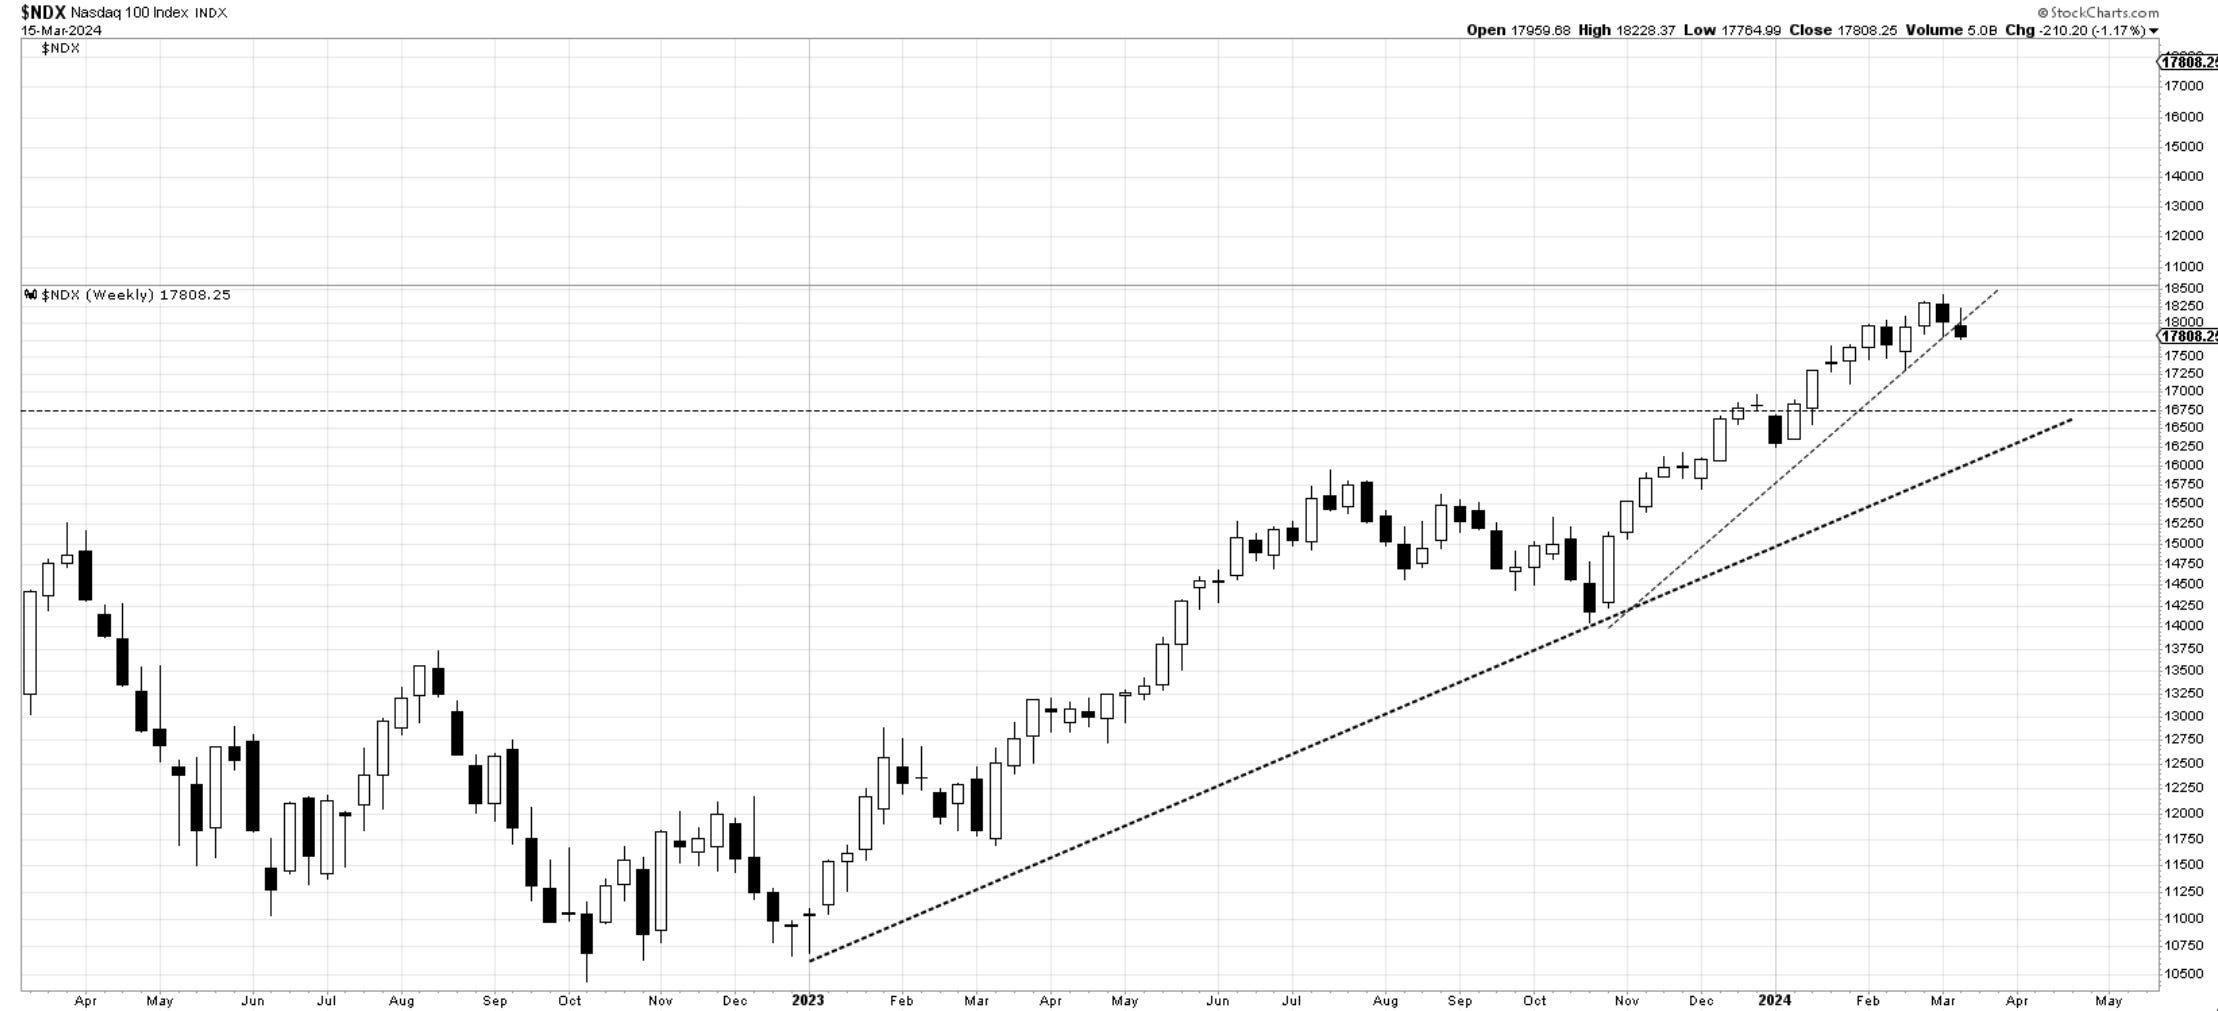
Nasdaq100. last week - There was some buying into the trendline, but it faded away. What happens this upcoming week with CPI reactions on Tuesday is important. A close below would likely send us towards 17k support.
Update: We have now closed below the trendline and near the candle's lows. Bears are in control for now, and initial expectations are for a continuation toward 17,300. This week’s high should not be re-taken. If it is, get out of the way. As simple as that.
Nasdaq composite: Last week - The Nasdaq composite failed to continue closing higher after the bullish close last week. This is not a major signal, but “caution warranted.”
Update: we have not fully lost this uptrend just yet, but this close is bearish. Expect 15,600.
Last week - The Dow Jones 30 index has shown persistent weakness for the past two weeks. This week’s close doesn't inspire confidence. If a corrective move is starting, it will likely get us to 37000.
Update: The trendlines have lost their luster for now with the last 4 weeks being mostly sideways. This week shows a rejection of higher prices once again. If we lose 38,500 , then we should hit 38,000 quickly.
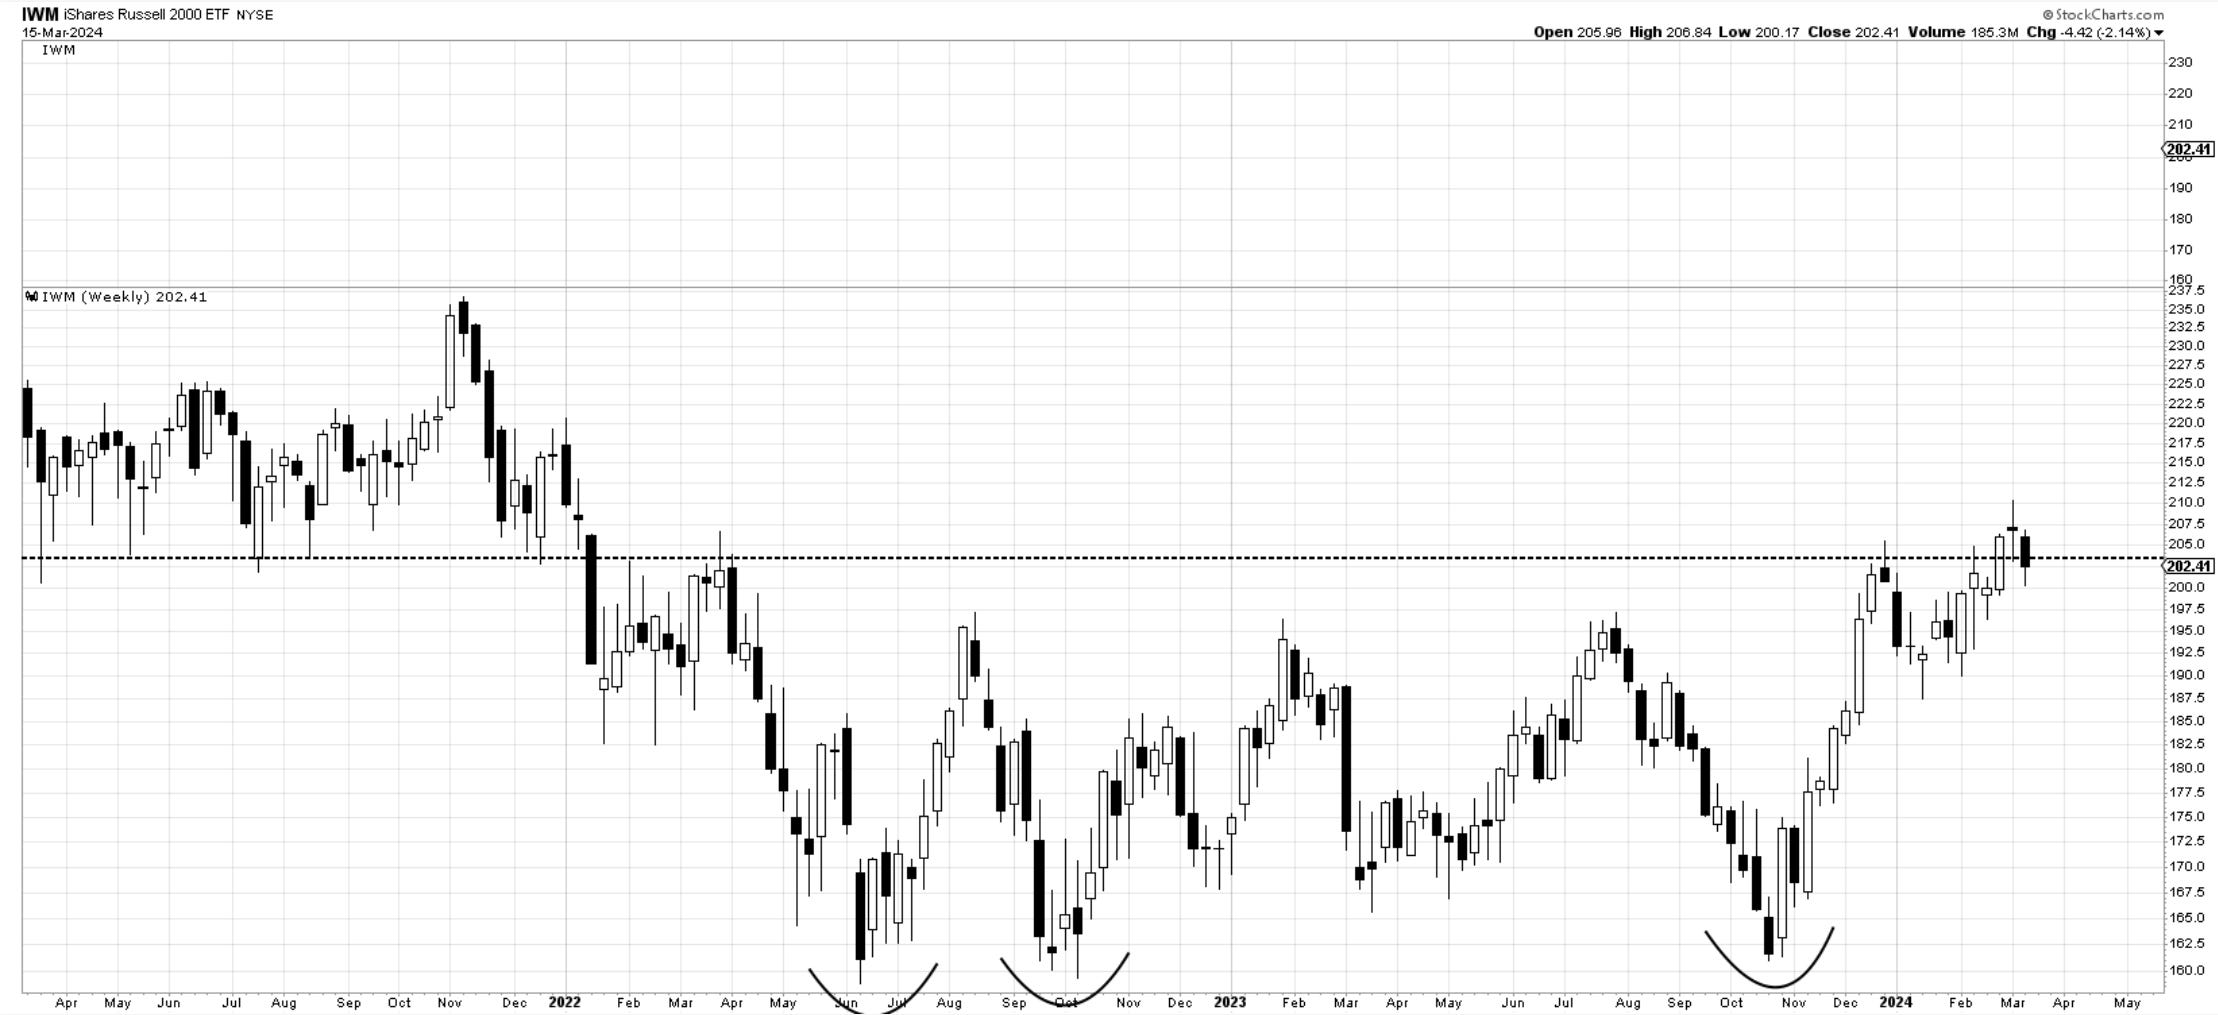
IWM—small caps. For a bullish perspective, I am not a big fan of the candle formation over the past 3 weeks. Break-stall-reverse. Not good. We did not close below the 200 but we did get back below that horizontal line. I would consider this a failed breakout and get out of the way for now. Plenty of time to re-join this index if it proves itself.
Bitcoin—We continued this week with a hunt for 74k. Let’s see how we close on Sunday, but if we get a doji, it’s likely we can continue to stall for a while, as shown in the cycle charts above. The overall trend remains bullish; just remember that traders will be persuaded to take profits seeing this behavior. 61k remains a good level to get bids working, in case we get down there. See the wave counts on daily notes for perspective.
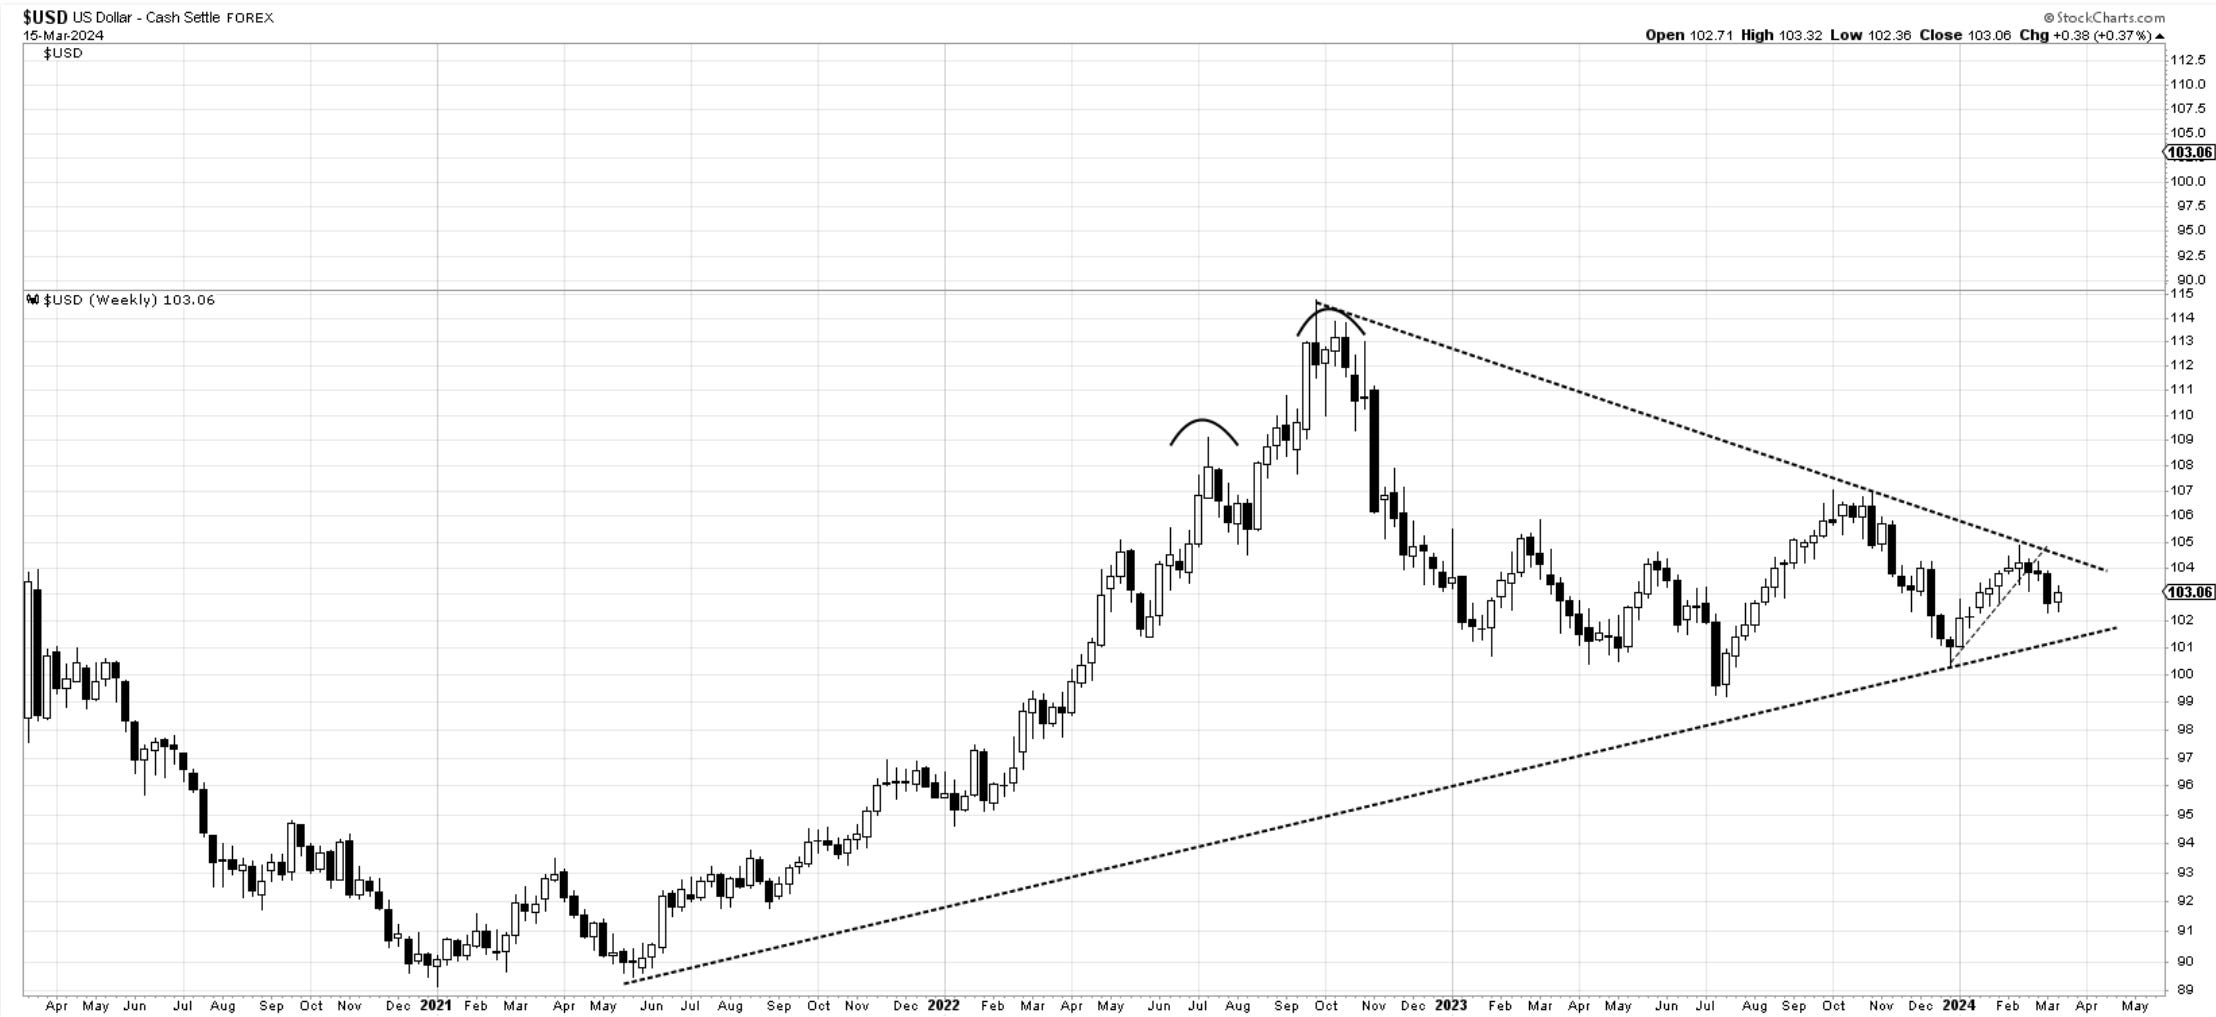
The US Dollar - remains in a state of equilibrium near 104. There are head and shoulder arguments since May 2023 peak with a head Oct 2023. Usually, these formations need to reverse something, and there is nothing apparent to reverse. Looking as a continuation pattern, it would suggest a break lower, but realistically until 101 gives way, there is not much to do here but observe.
Update- The dollar was bid this week with the rise in yields. The equilibrium continues until we lose 101 or we overtake 105.
10y Yields - they did a complete 180 and reversed from 4% support. Now attacking the top side of the range near 4.3%. My wave counts suggest this is corrective against the larger drop, but we need to see above 4.4% before potentially turning back lower. Very sensitive to Fed and economic data. A fast rise can spook markets.
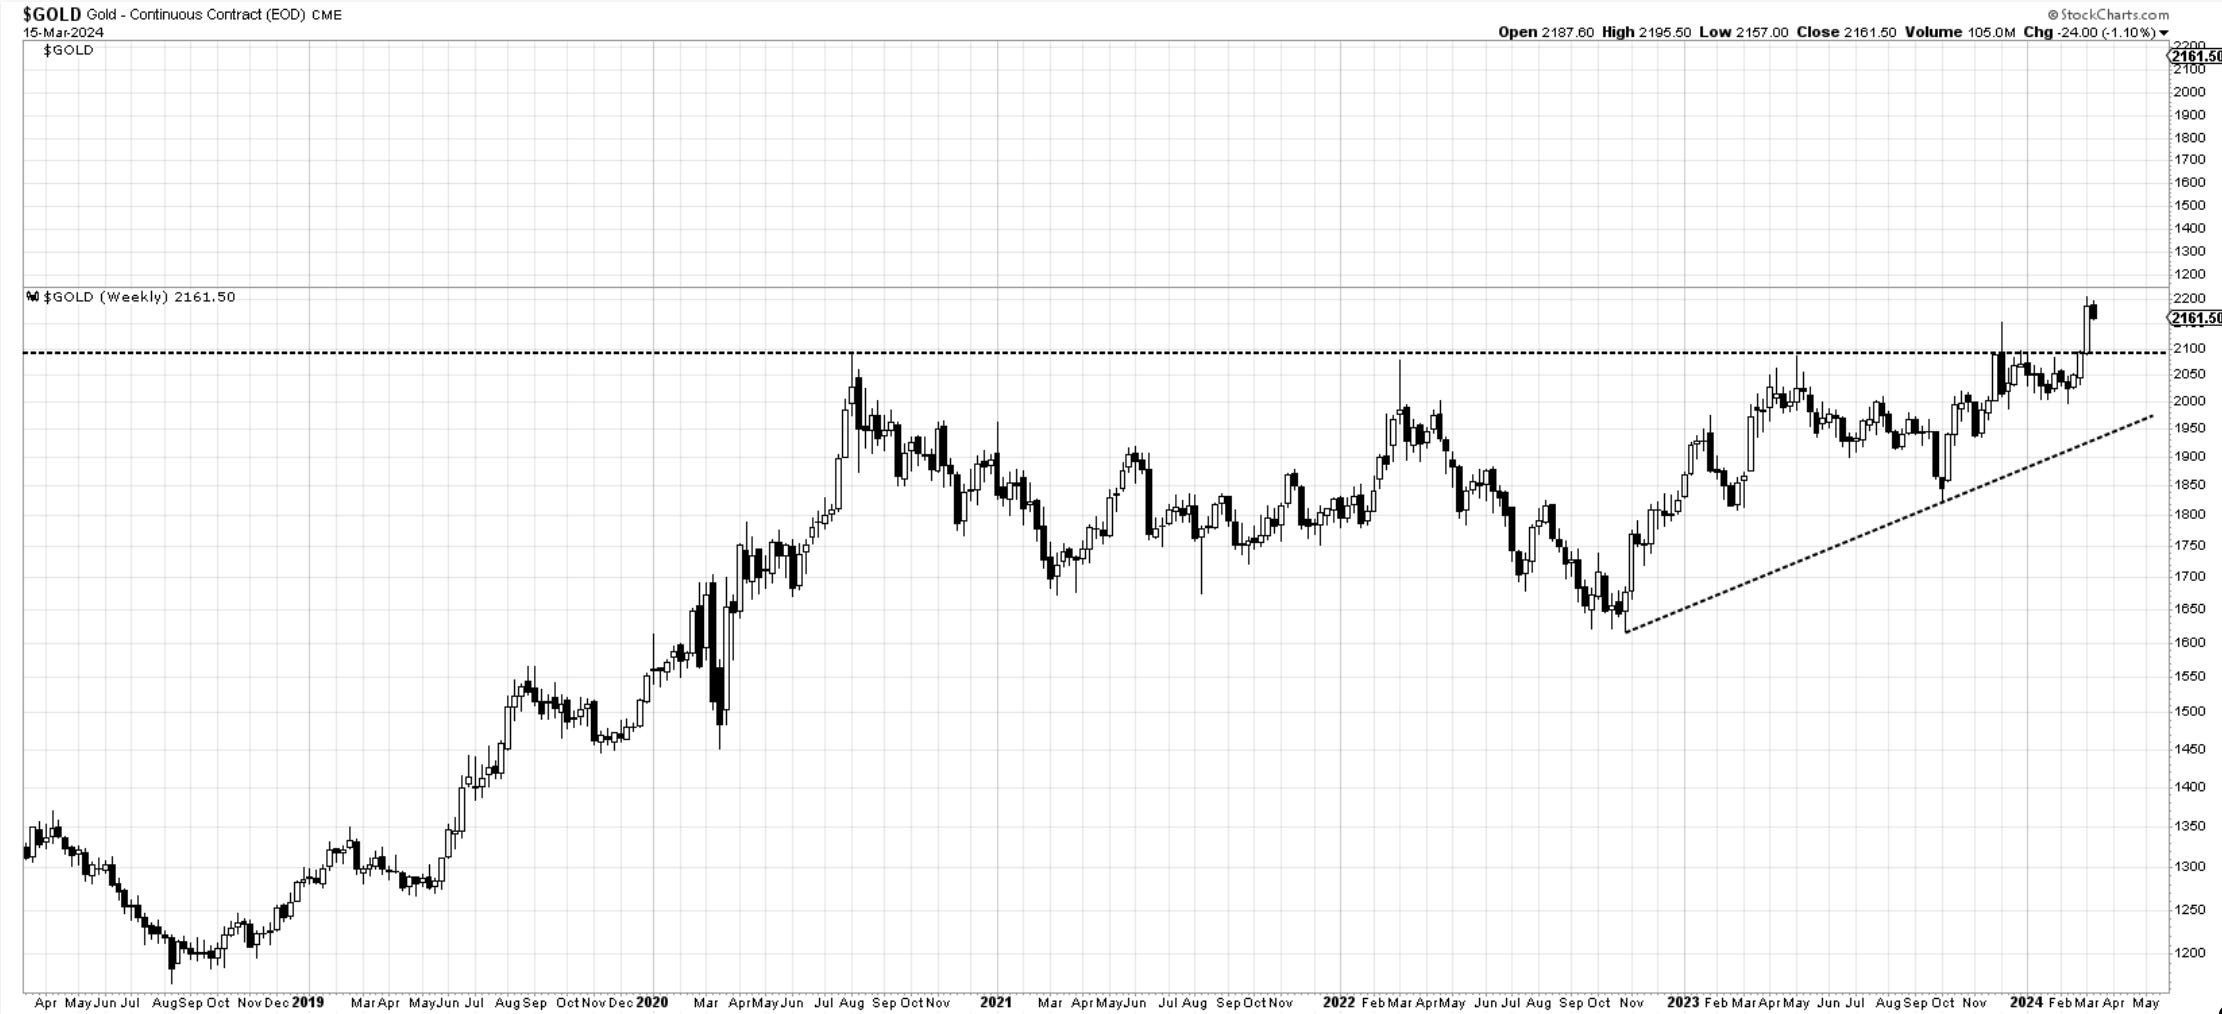
Gold—the breakout remains valid, and even if we did not continue this week, unless we drop below 2100, I would remain focused on the upside. Wave counts suggest a small wave four in progress.
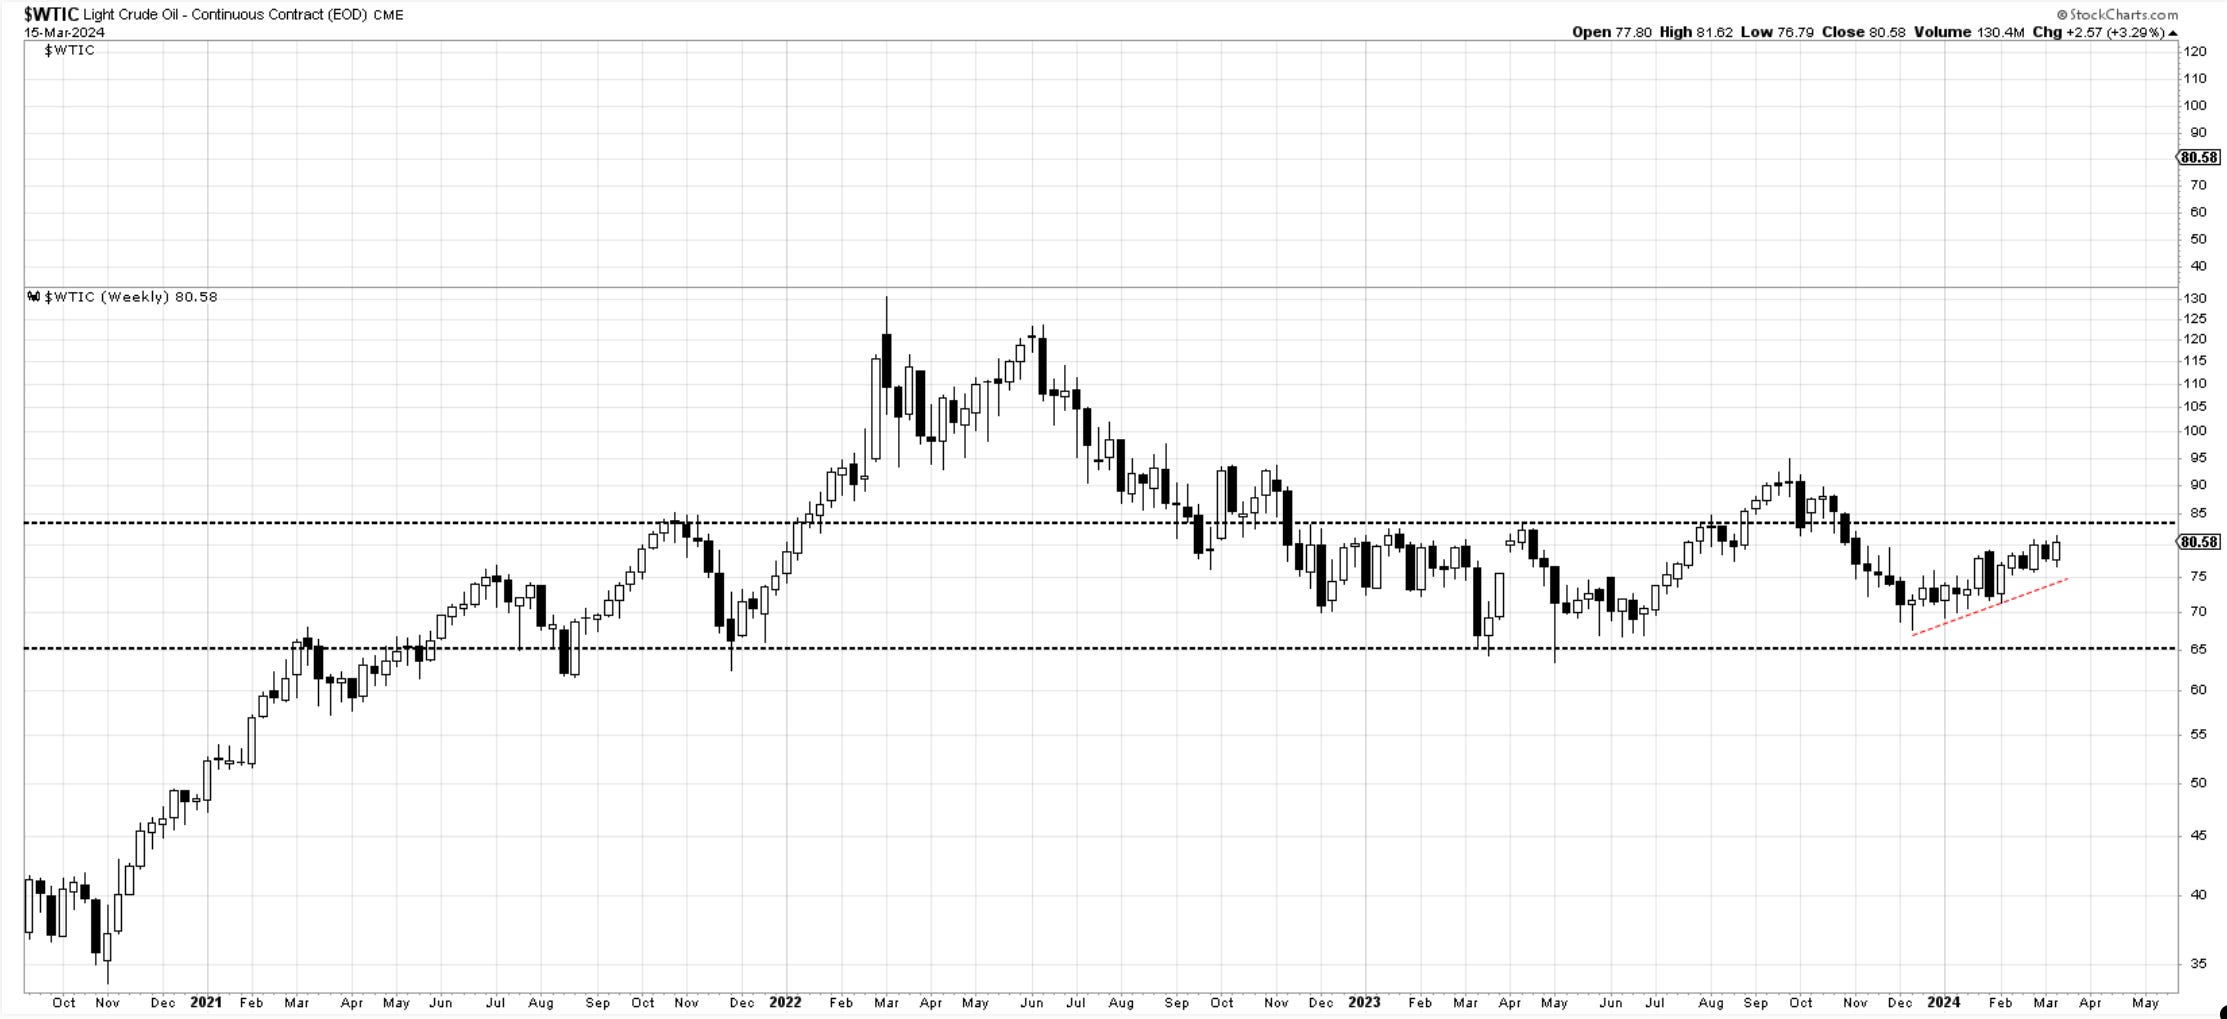
OIL—It remains in a tight upward channel with a support trendline seen below. I am still neutral until either the upside horizontal level gives way or we break the trendline.
Update: It continues to build up an up-trending channel. A break of 84 is bullish. Until then, there is nothing to do.
Thank you all for reading; I will see you next week. Leave a comment or suggestion below. Join our chat to discuss markets with fellow traders.
In the meantime, please consider subscribing and supporting EWCafe and read “The Daily Drip,” where I provide daily market updates, videos, and commentary on core markets.
Cris,
EWCafe
email: ewcafe@pm.me