
Weekly market review
A technical look at weekly trends in core markets.

This weekly report is free. Check out our brand-new low-cost payment plans for those who want our daily written and video reports.
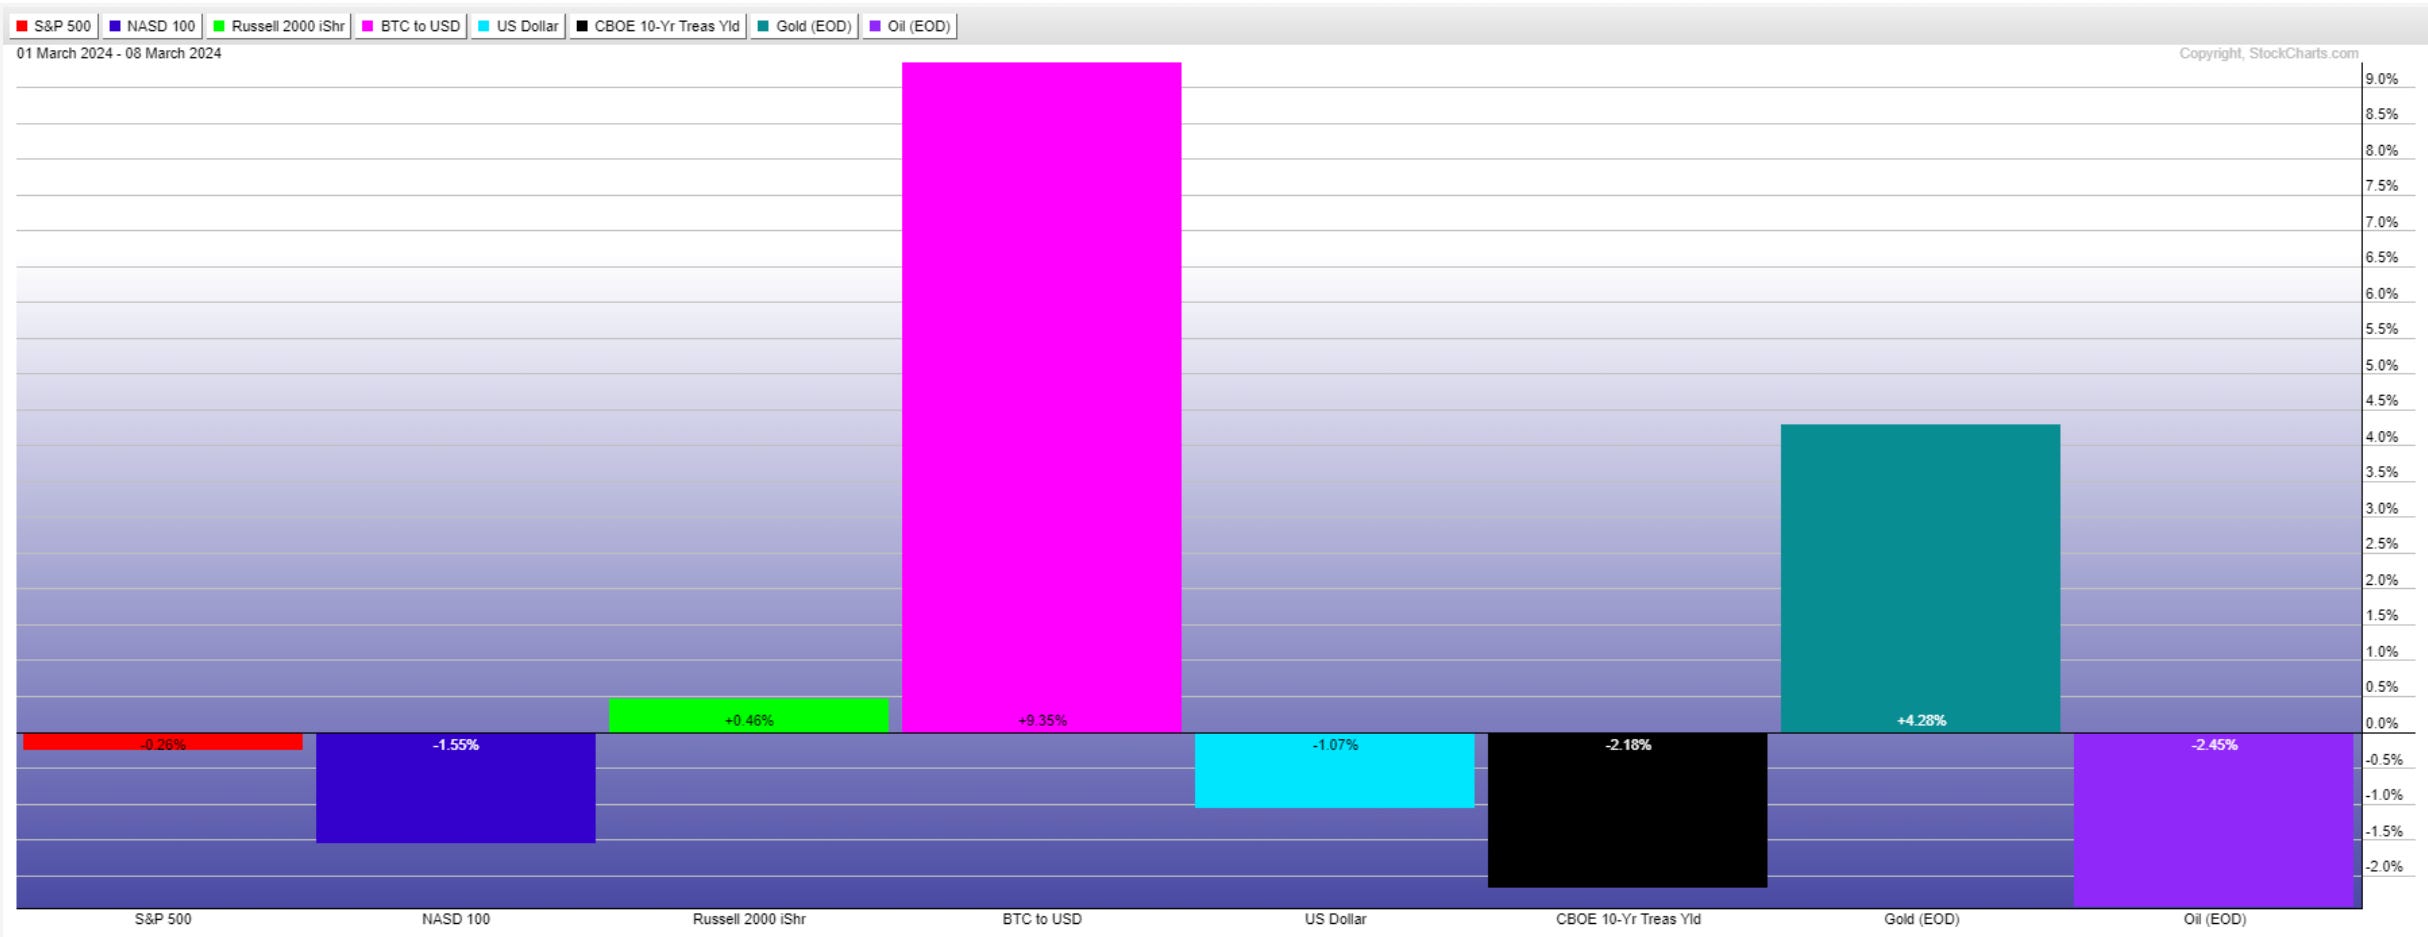
Market performance for the past week is below.
Once again, BTC is the outstanding performer this week, with +9.35%. I mentioned Gold last week on a buy setup, and it performed well as a close second to BTC. Equity markets have retreated and are trying to signal a corrective period is approaching.
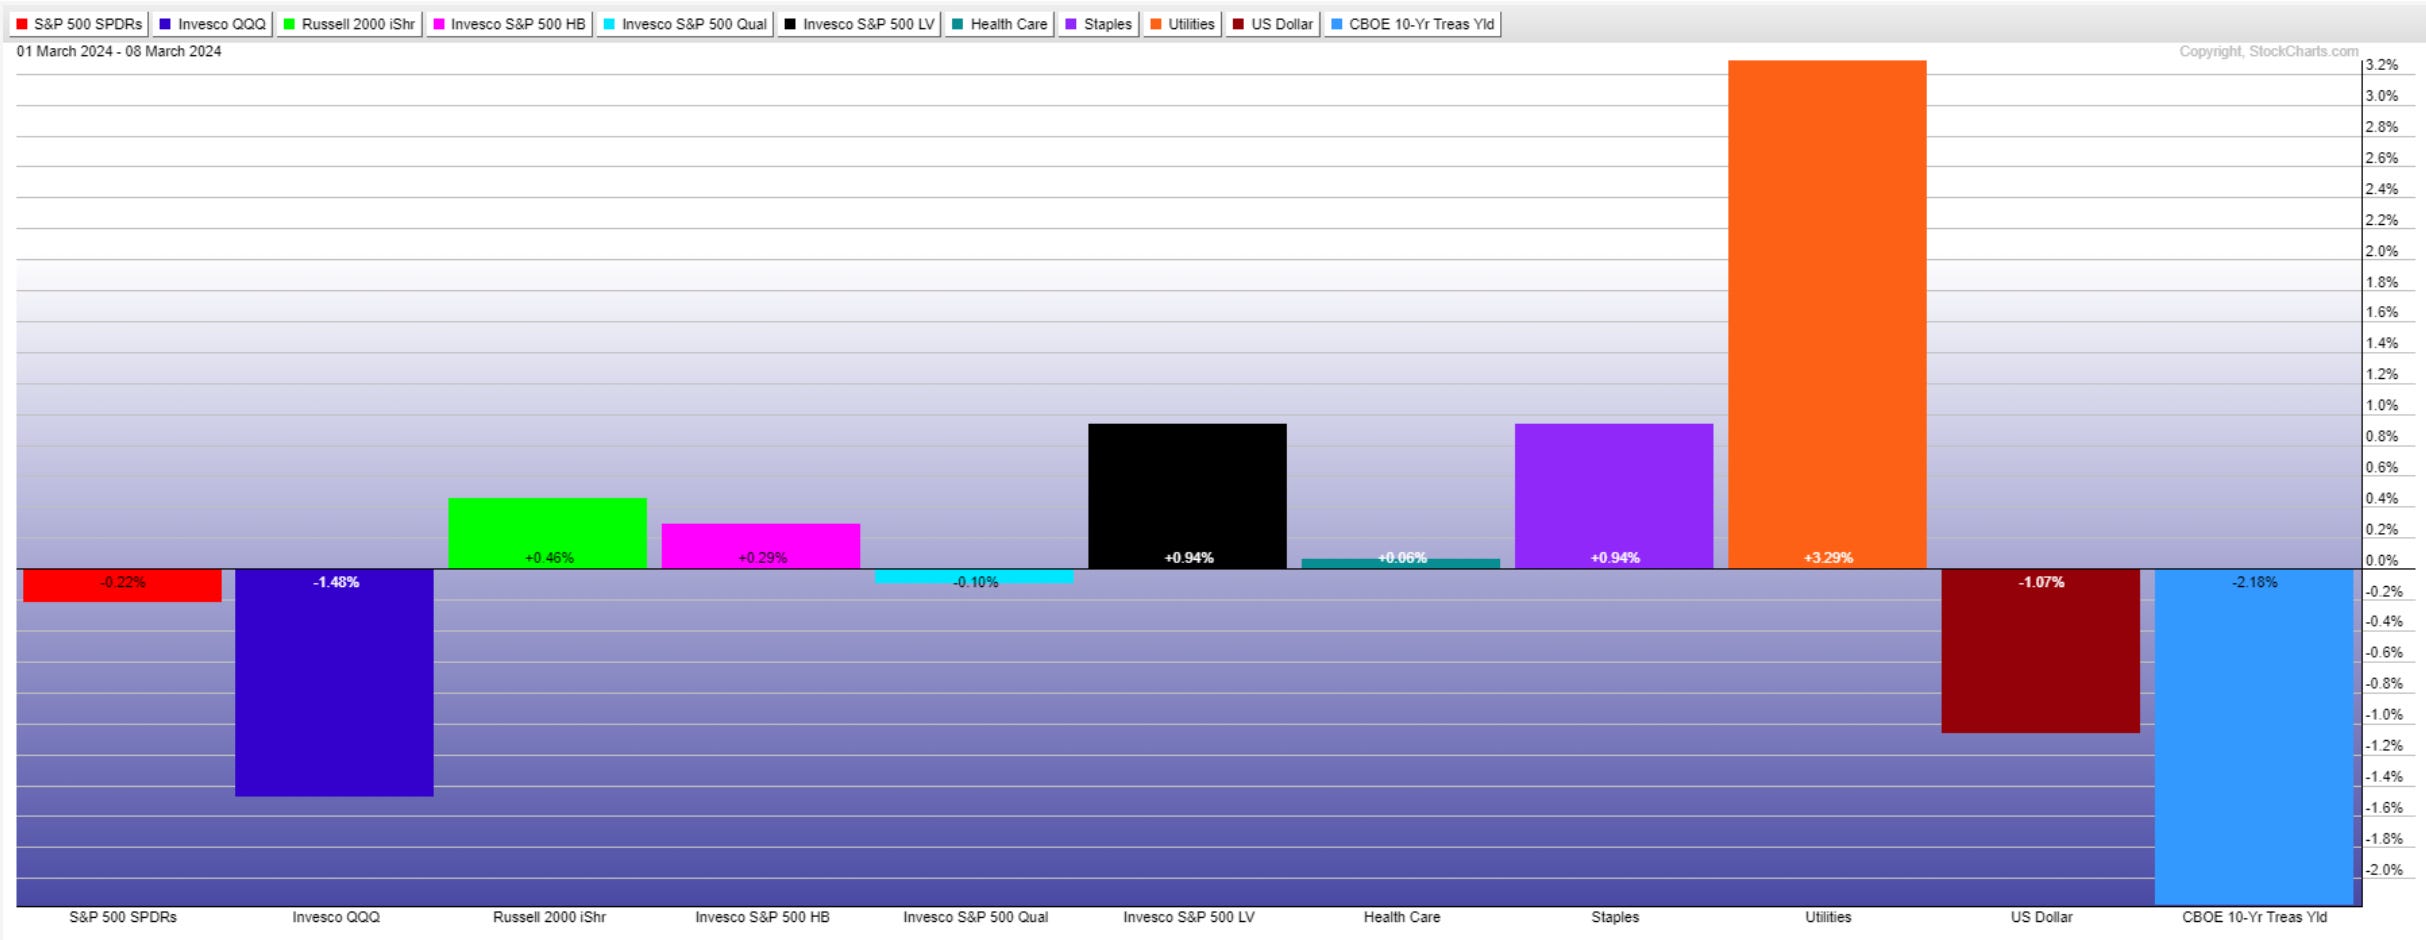
When Utilities and Staples perform well along with low volatility etf’s, you can sense the defense posture building up.
Sentiment
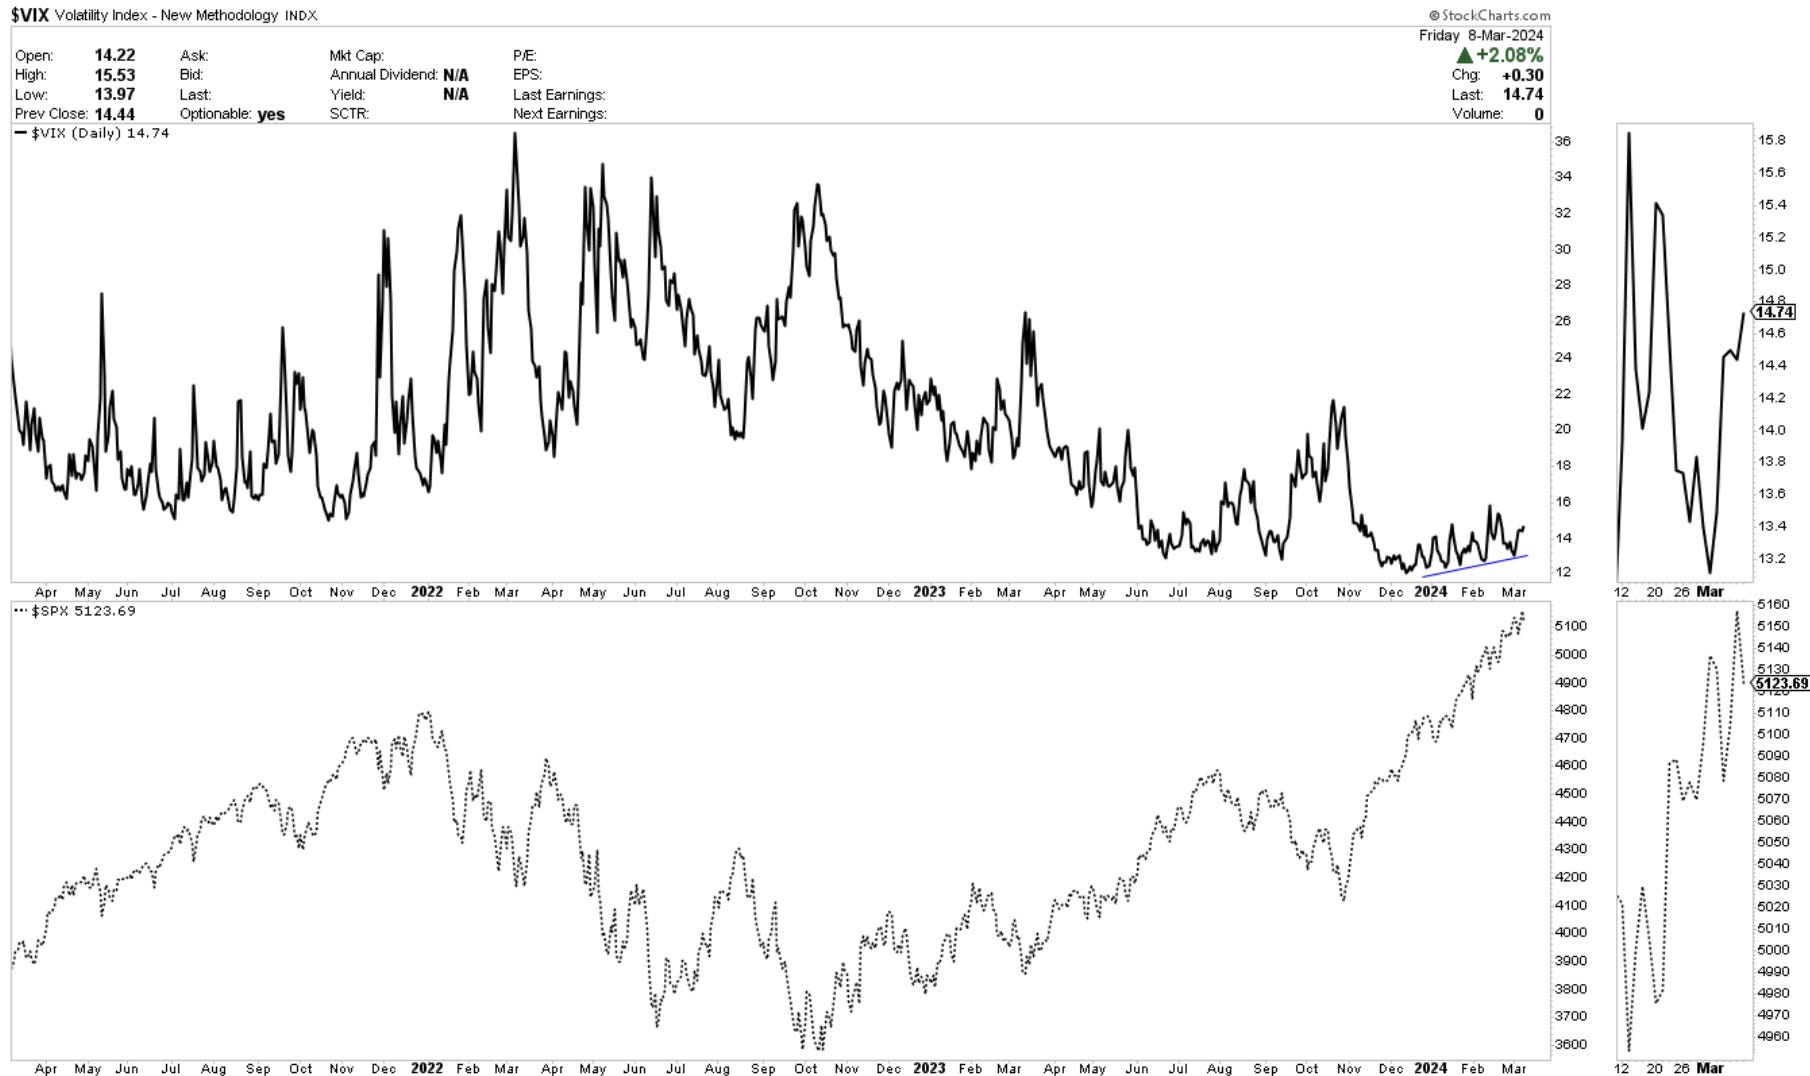
On the chart, you can see that volatility has been creeping higher week after week since the start of the year. I would watch 16 here as the line in the sand for risk building.
The spike in the bull-bear spread this week is somewhat concerning and is trying to signal a nearby top approaching. It’s at the highest levels since December of last year.
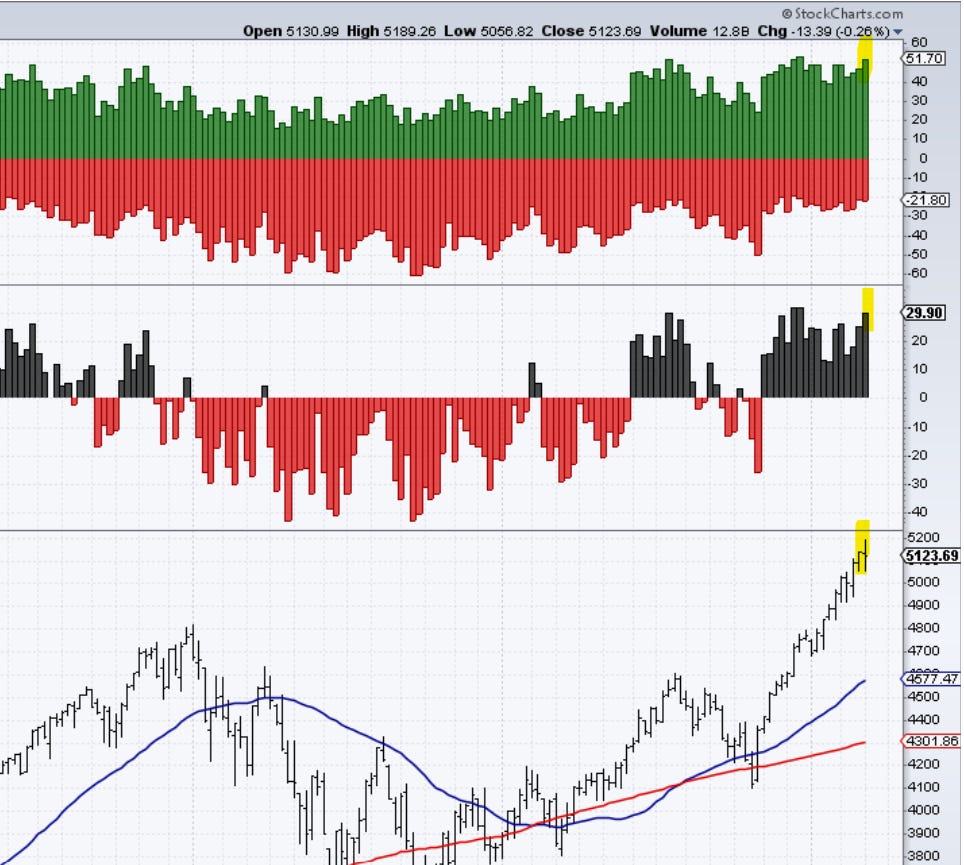
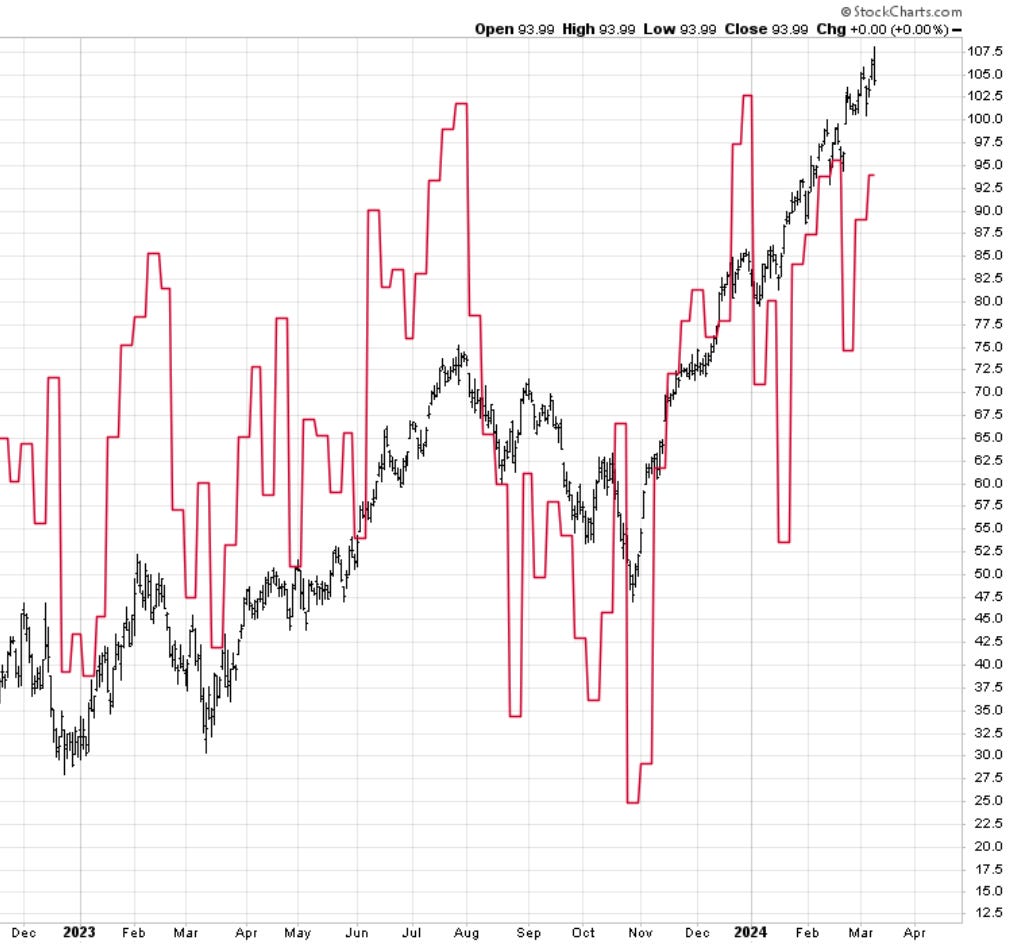
Investment managers have chased this week, however, at a lower rate than in February and, for that matter, December last year. Their allocation remains at 94% bullish equities.
The red line is the percentage allocation.
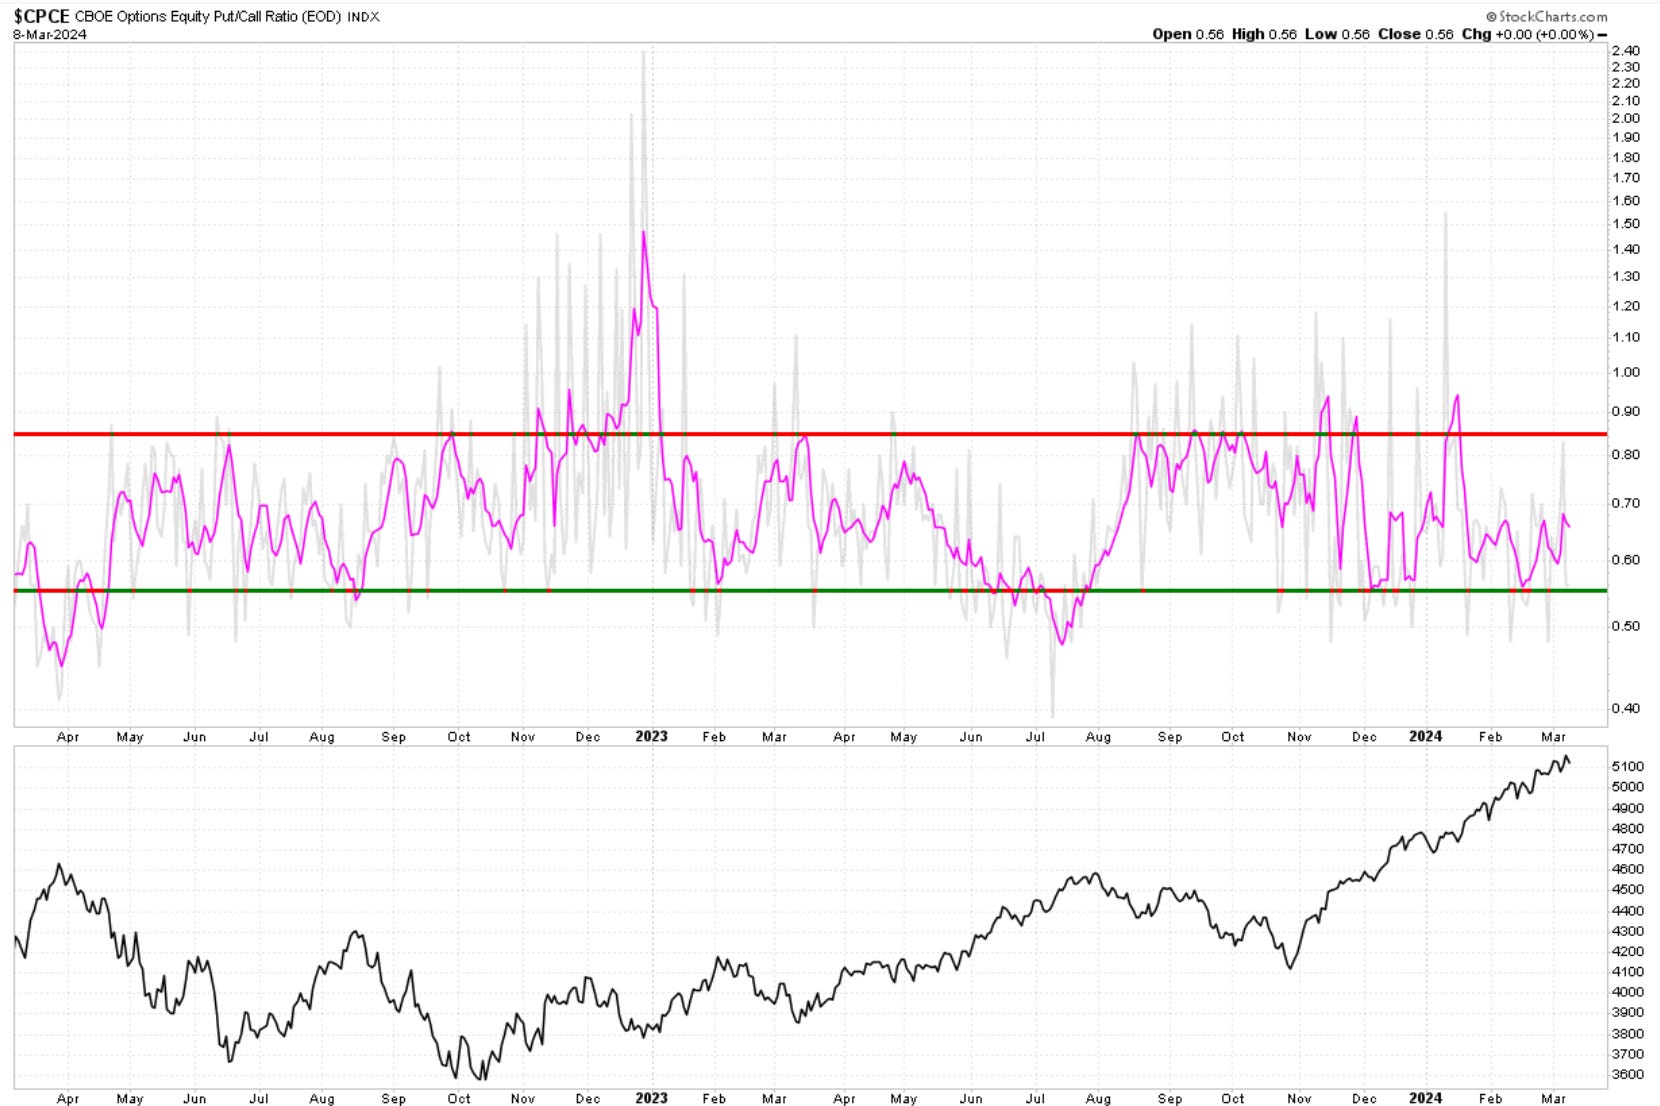
There are no significant extremes in the Put/Call ratio. Notice a slight increase in put buying. Nothing worth noting signal wise here.
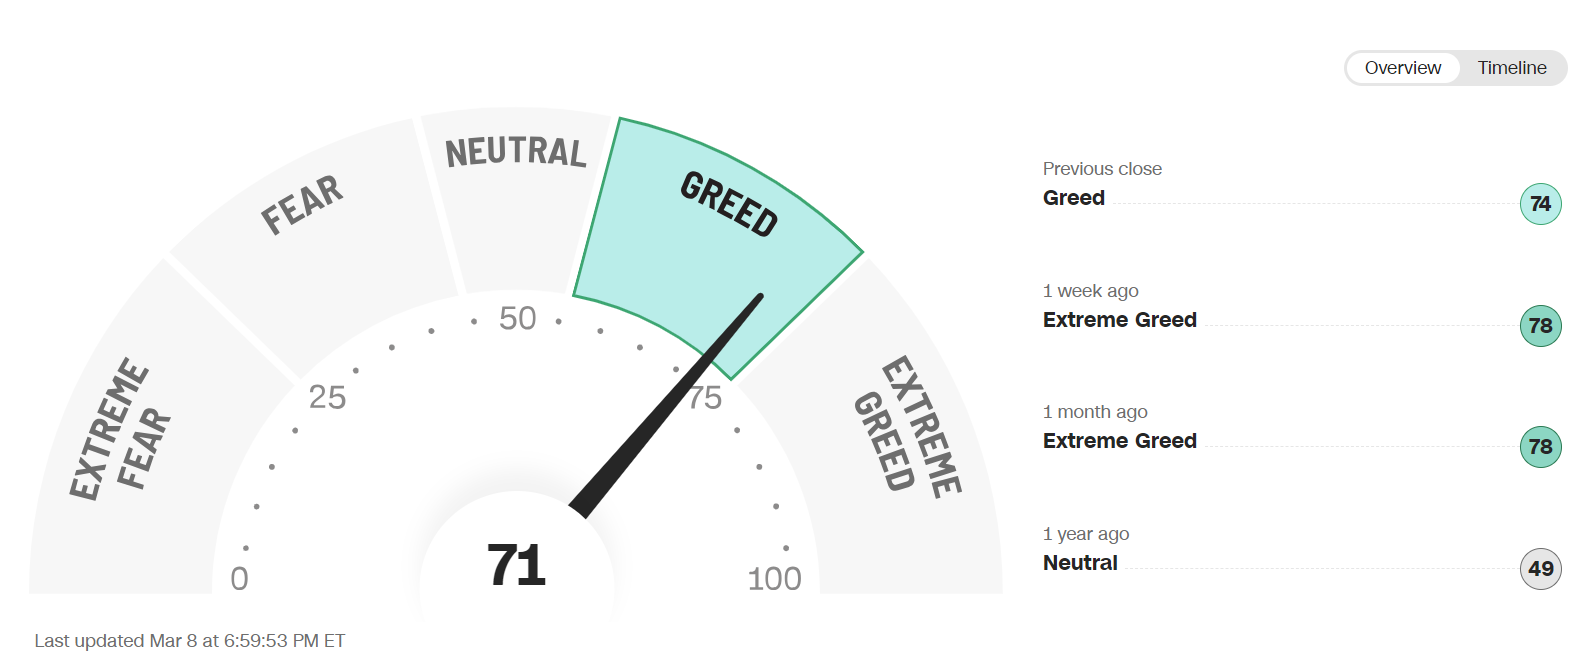
The sentiment section would not be complete without the CNN gauge of Fear vs Greed. We droped into a lower greed sector this week as markets cooled off a bit. My read here is that traders are growing cautios.
Cycles
Note: cycles refer to time projections only not price projections.
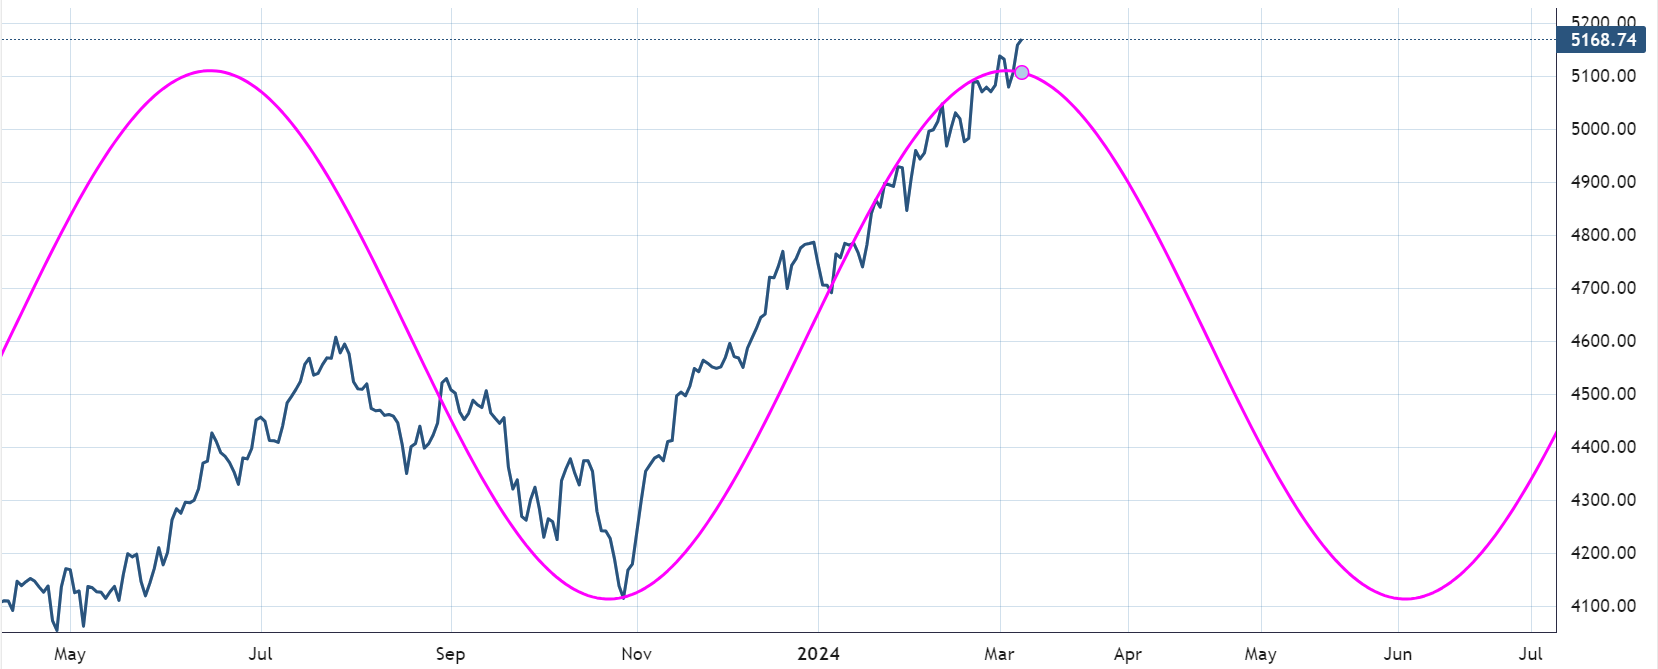
SP500 . The weekly cycle remains bullish into yearend.
The Daily suggests weakness starting to develop this month and lasting into May-June.
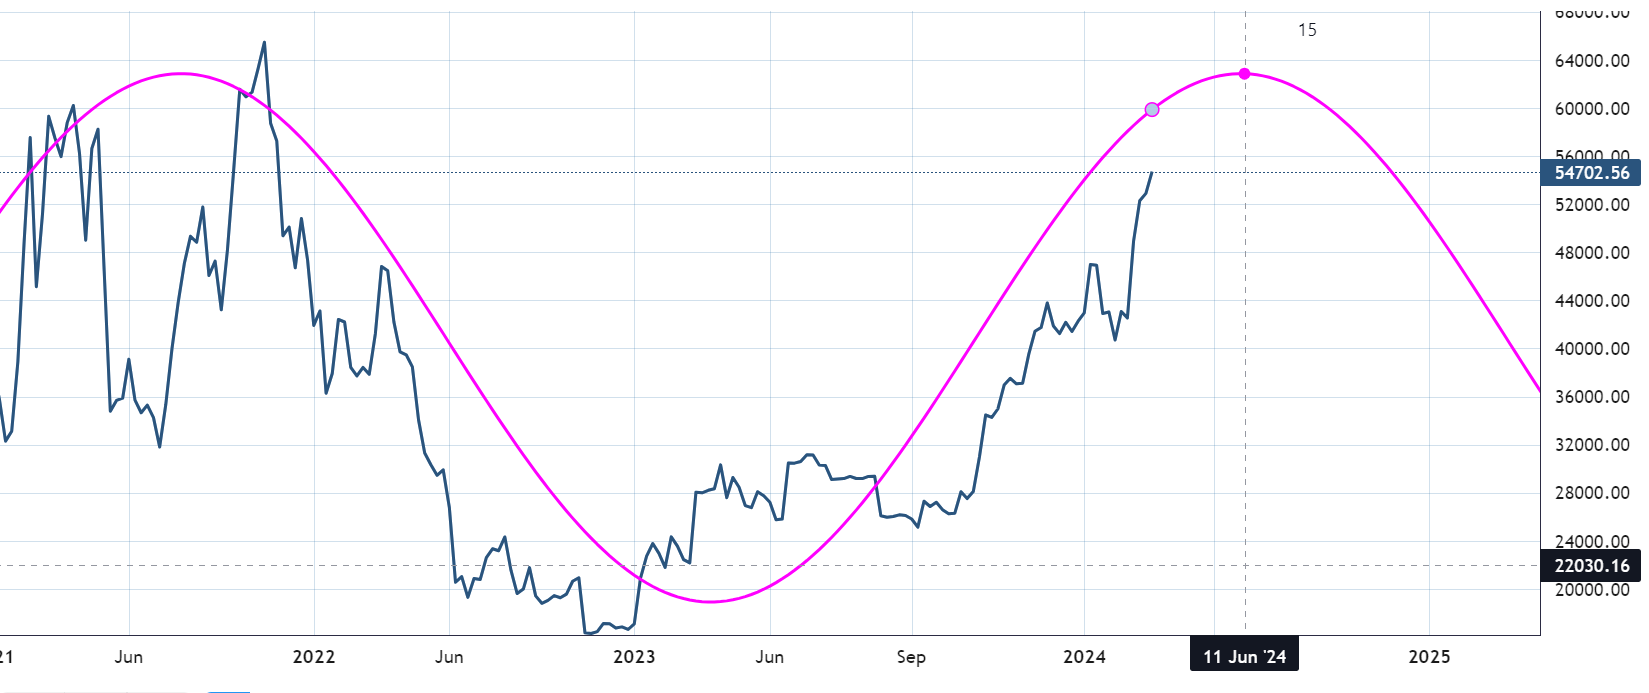
BTCUSD remains bullish with cycle topping projection about 3 months away.
Breadth
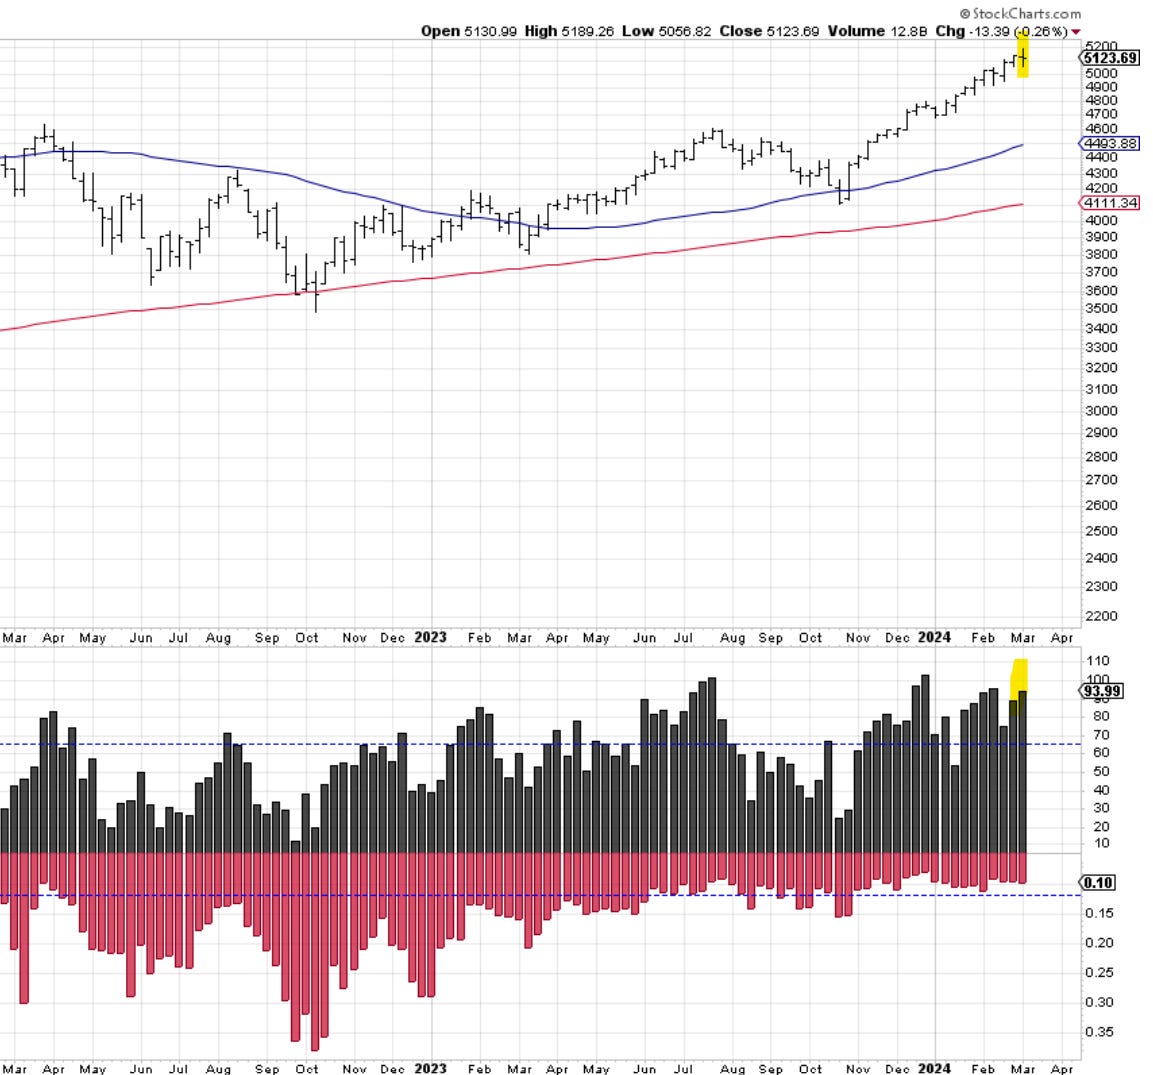
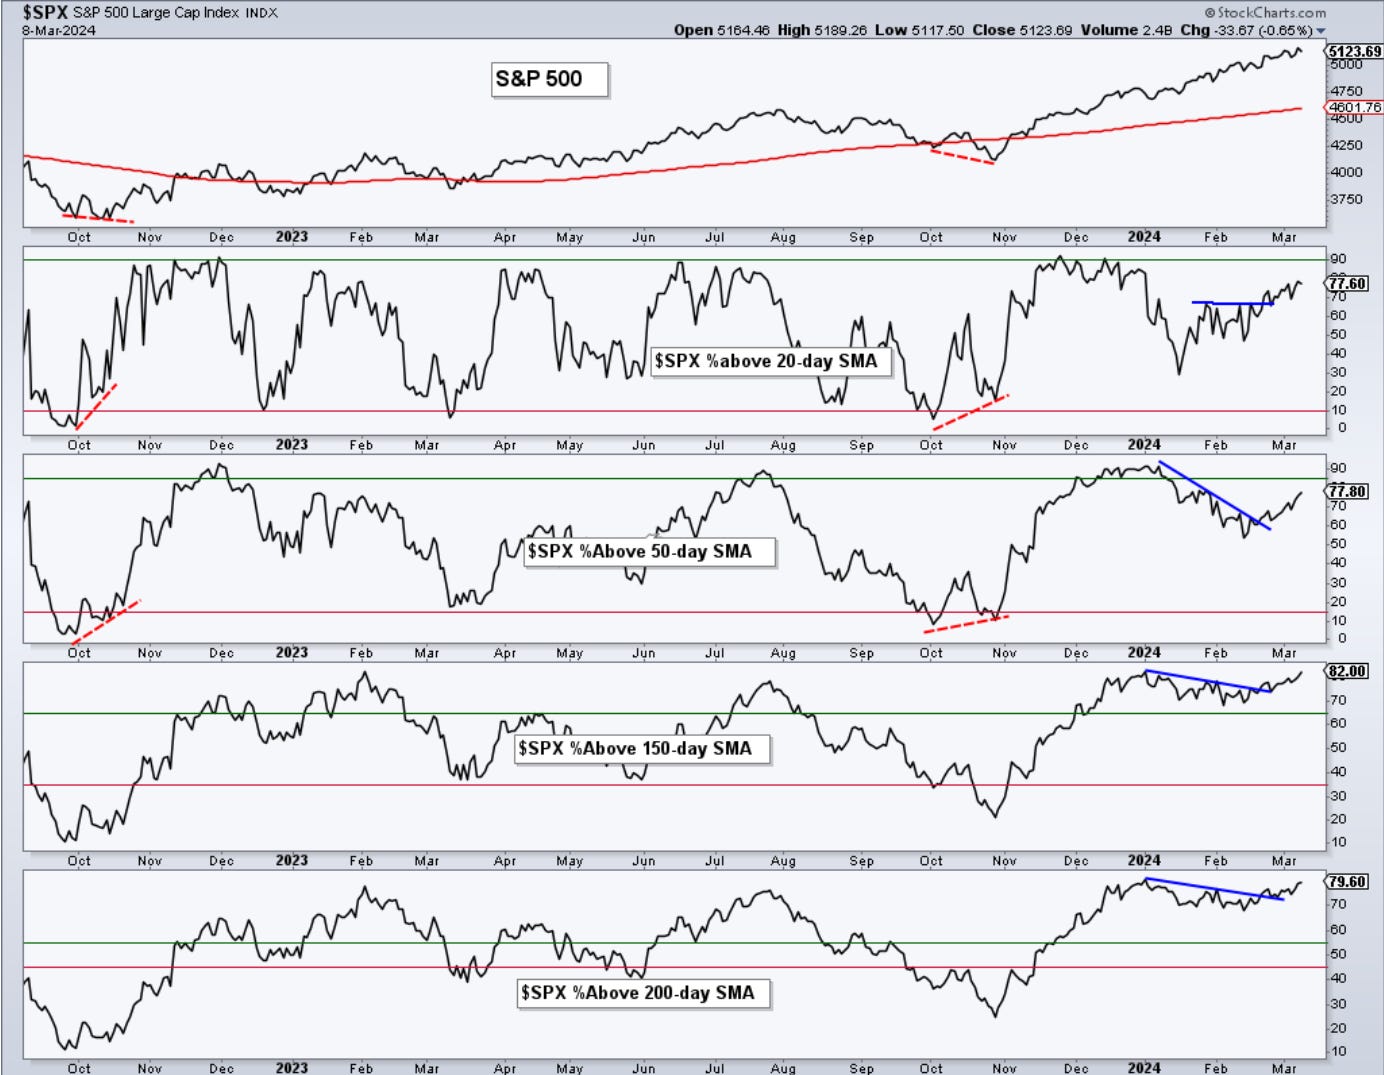
Here are percentages of stocks above key moving averages in the SP500.
Most Stocks in the Sp500 remain established on bullish trends above their 200, 150, and 50-day moving averages. Percentages have increased since last week; however, at the smaller 20-day, we seem to be stalling. This metric will very likely be lagging price behavior, but I would keep a close eye on the daily updates if we start to lose more and more of the 20-day supports.
Less 52-week highs this week and on the decline since the top 2 weeks ago. A small red flag, in my view, with price seemingly stalling into a doji formation. Losing 5050 in the Sp500 should bring additional selling.
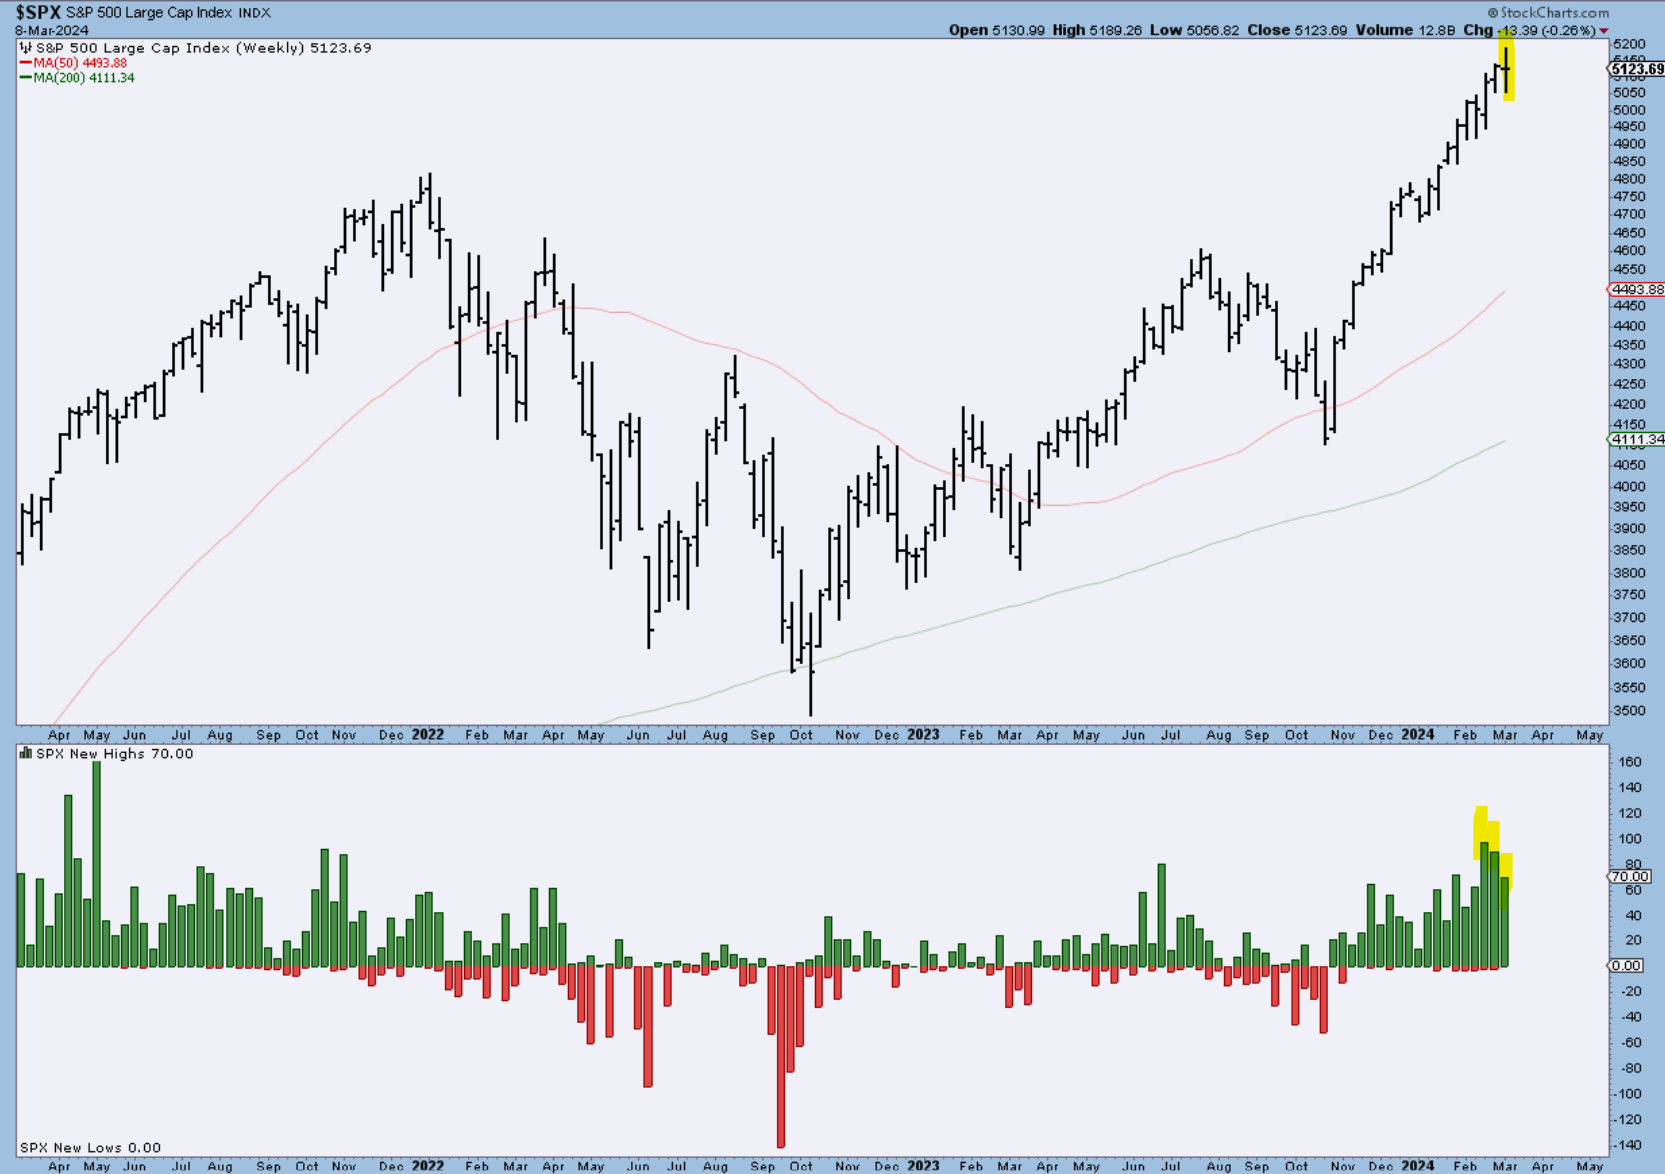
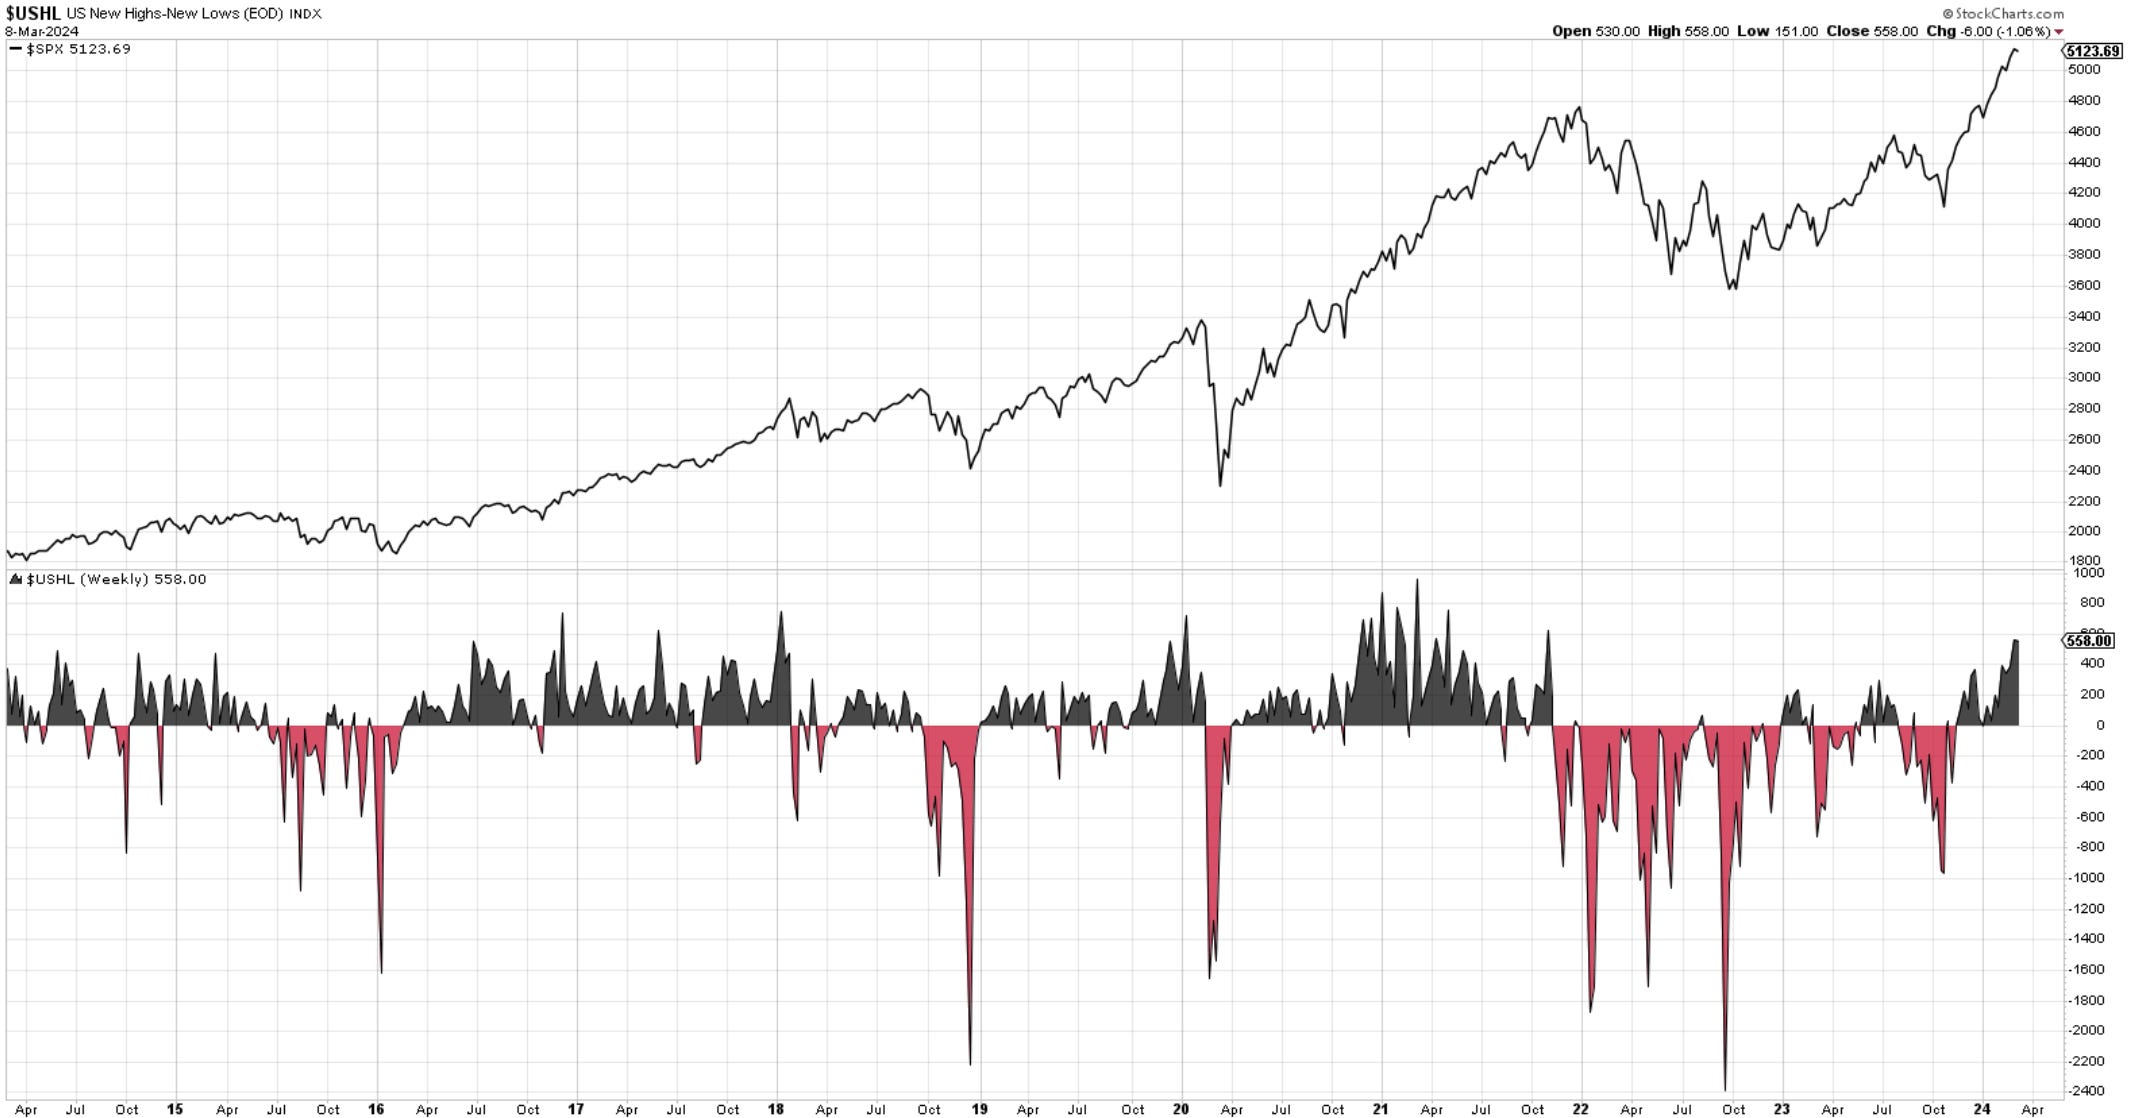
Here is the total new US highs vs. new lows. Black is good, red is bad. 564 new highs last week and 558 this week.
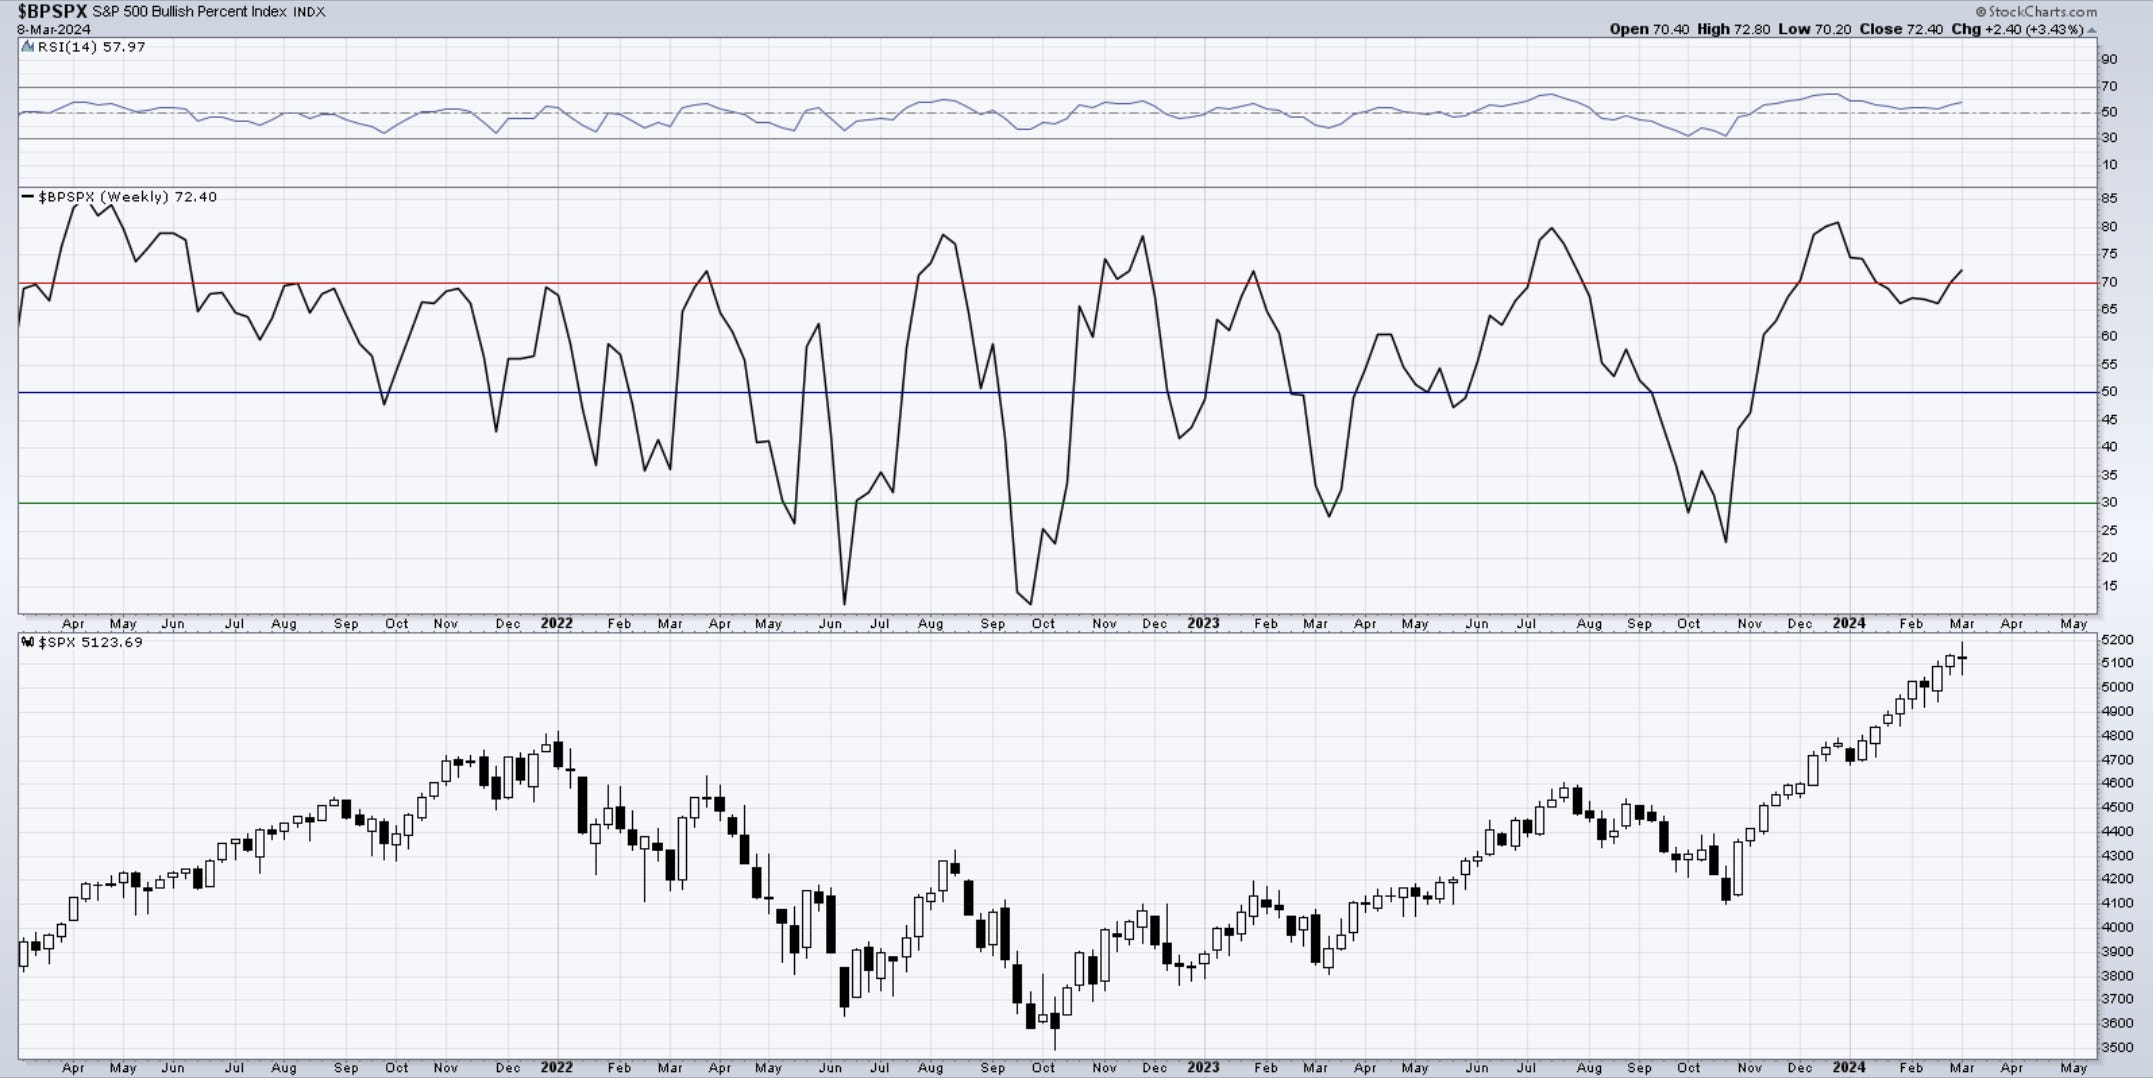
The Bullish Percent Index has increased above 70 this week and remains in bullish territory. It needs to get below 50 to raise larger concerns.
Seasonality
SP500. Here is the daily price action during the month of March. The first half of the month tends to be more positive, followed by some weakness later on.
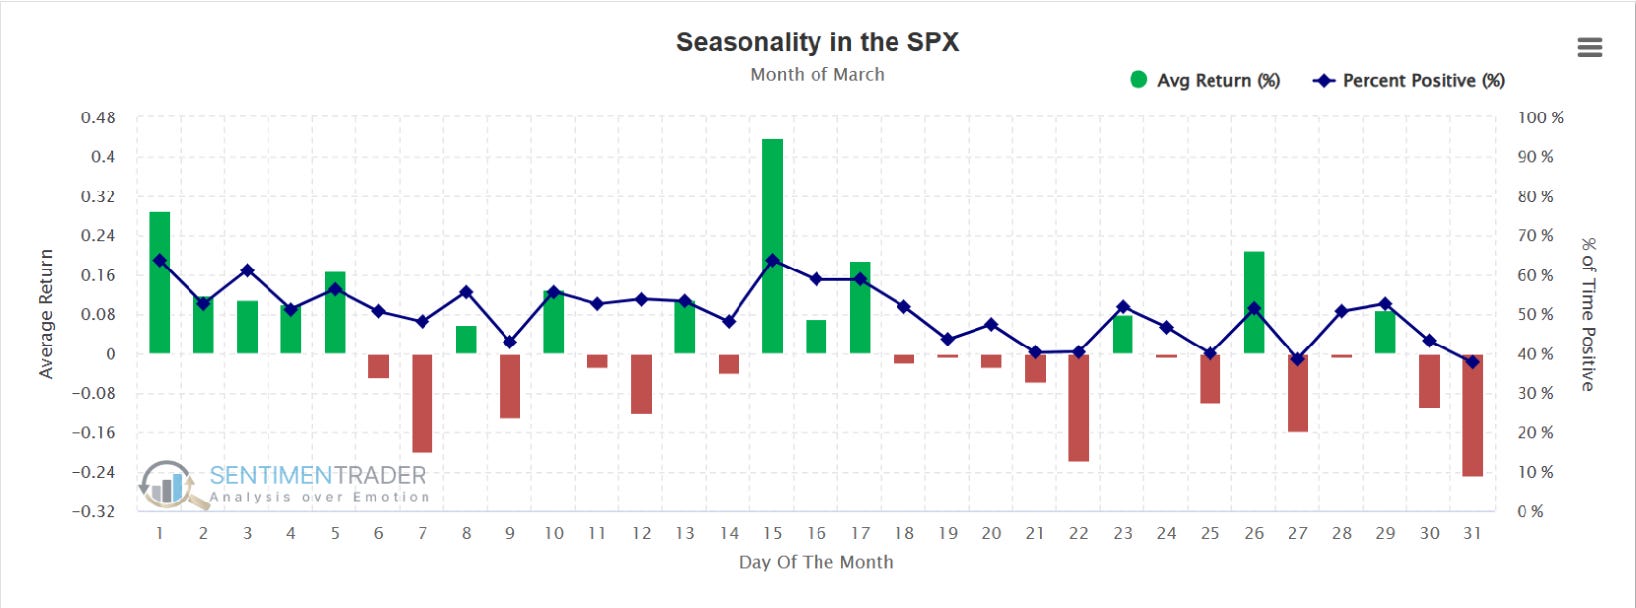
Seasonality was quite delayed or ignored from February until now. We still have until the end of March, and then the tendencies are bullish again.
Price
SP500. A new weekly high was made this week, but we have failed to stage another higher close. For further confirmation, let’s watch for a weekly close below the trendline. 5050, once again, is that line in the send.
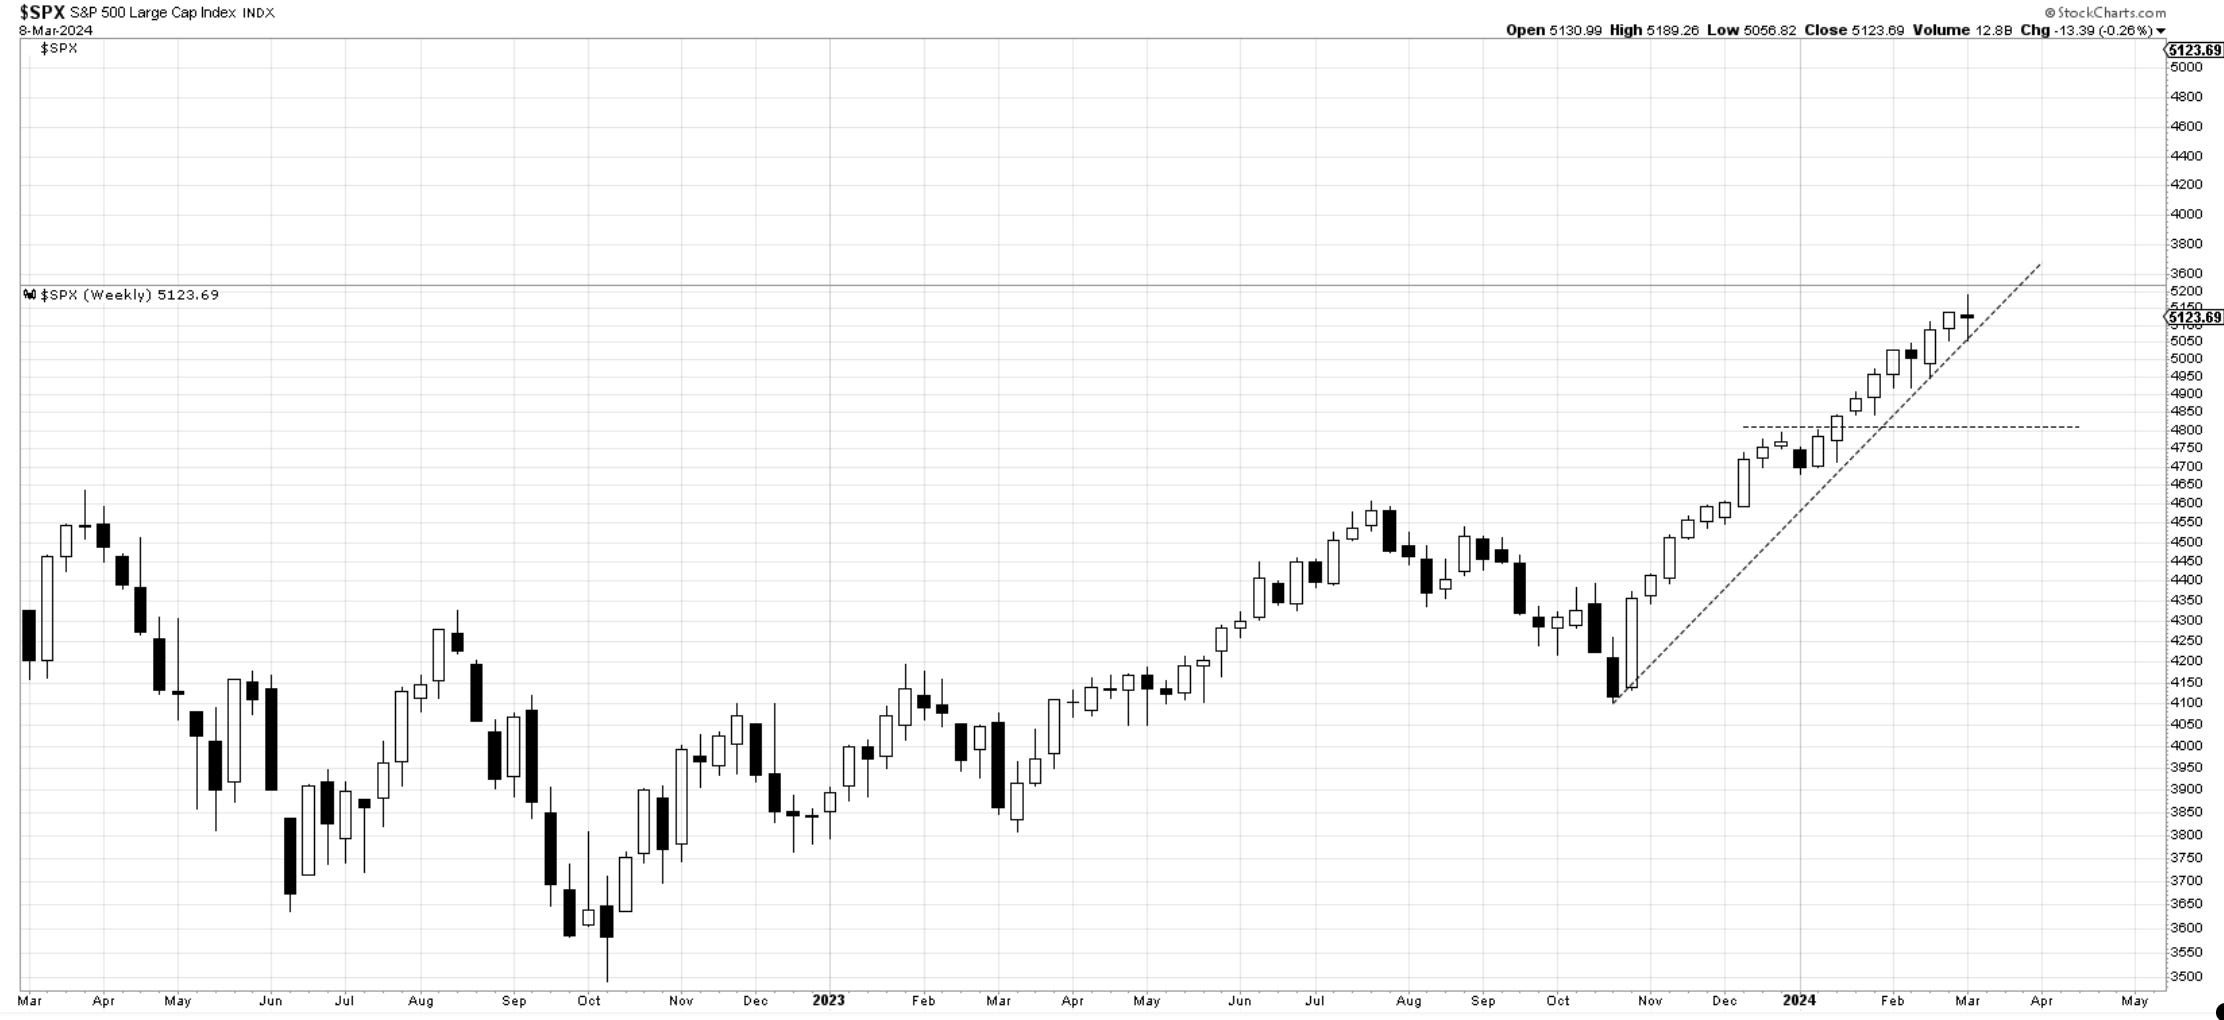
If you haven’t seen this yet here it is in terms of contrarian sentiment indicators.

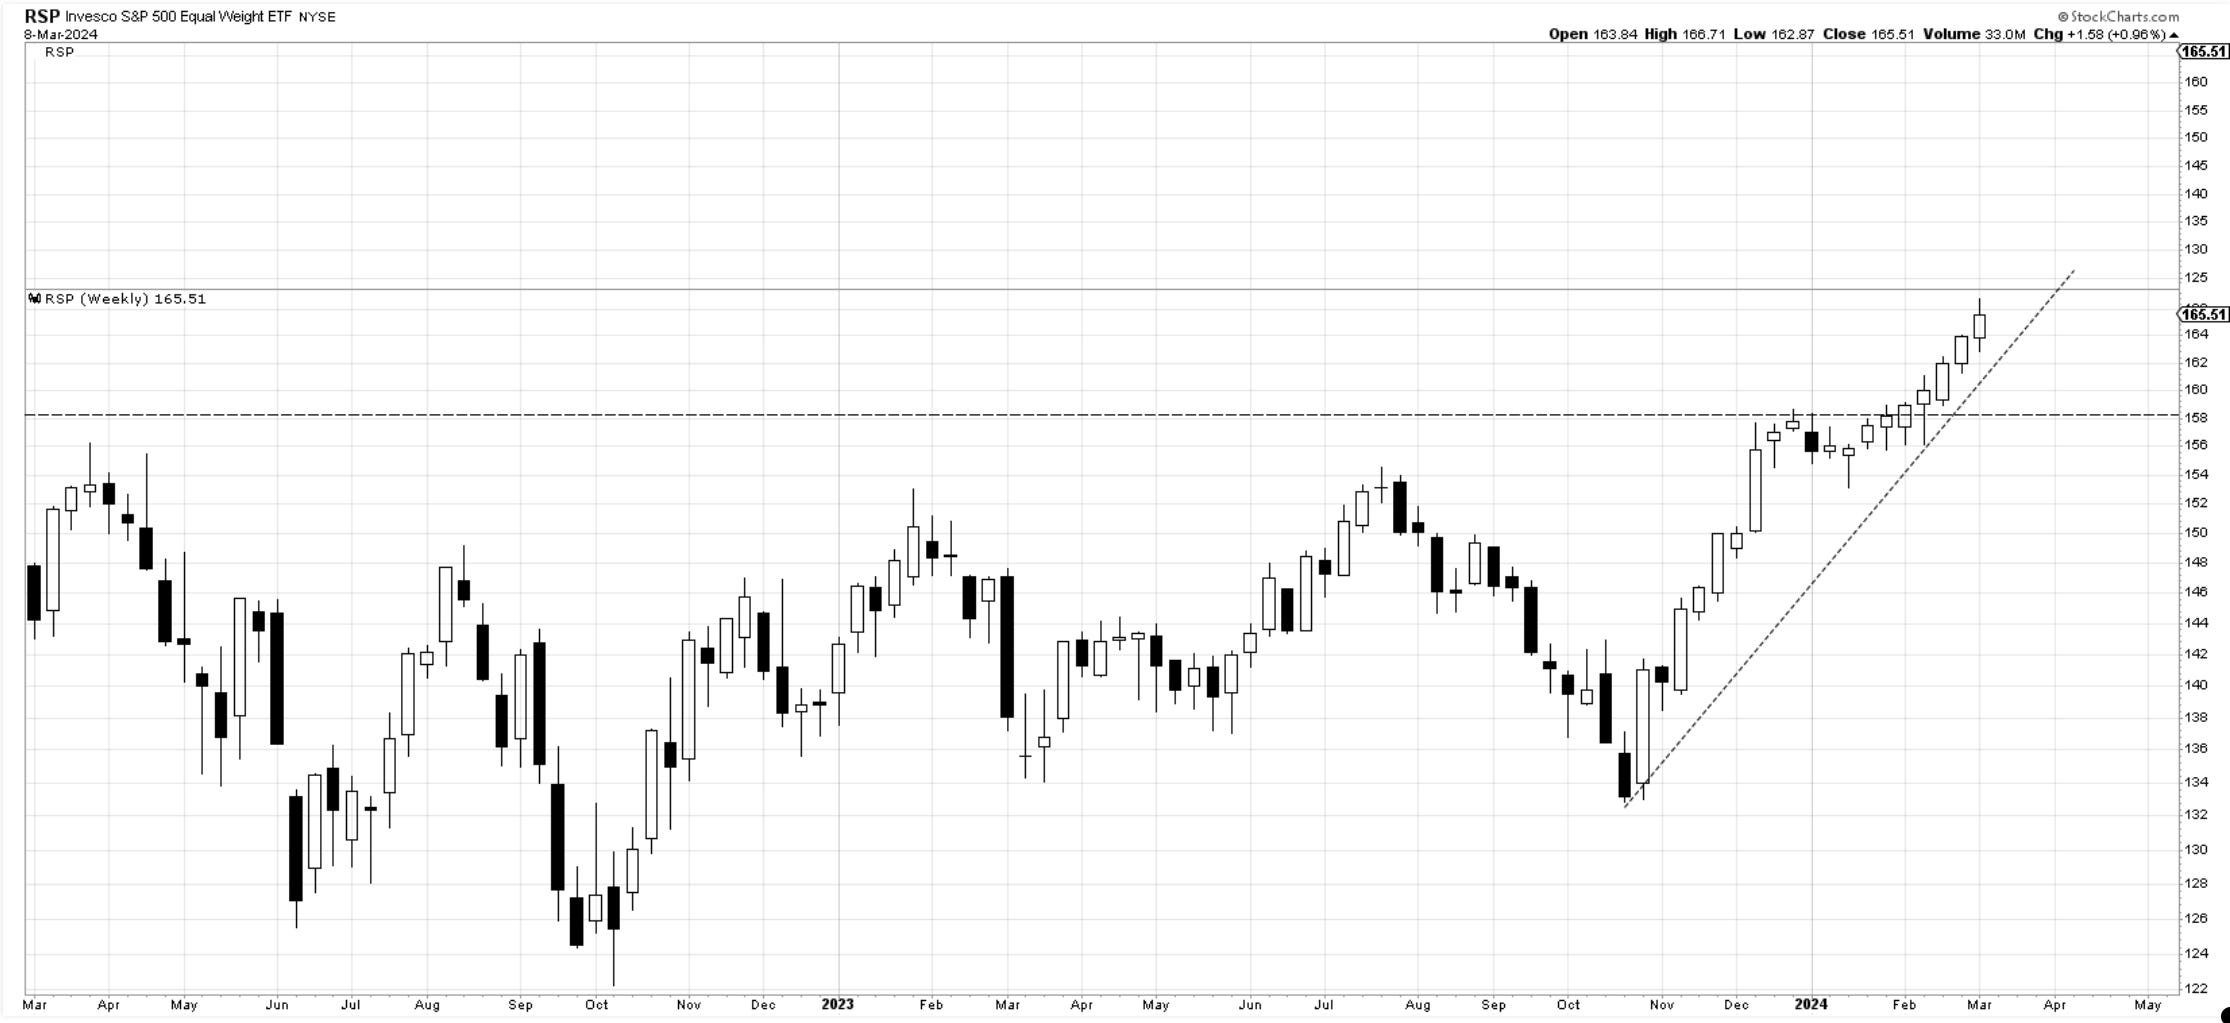
RSP - equal weight SP500. This index shows greater participation from other stocks and exposes the weakness we have seen in large-cap names this week. It's another decent all-time weekly close. For those that play defense this might be a way to do it and still keep exposure to markets.
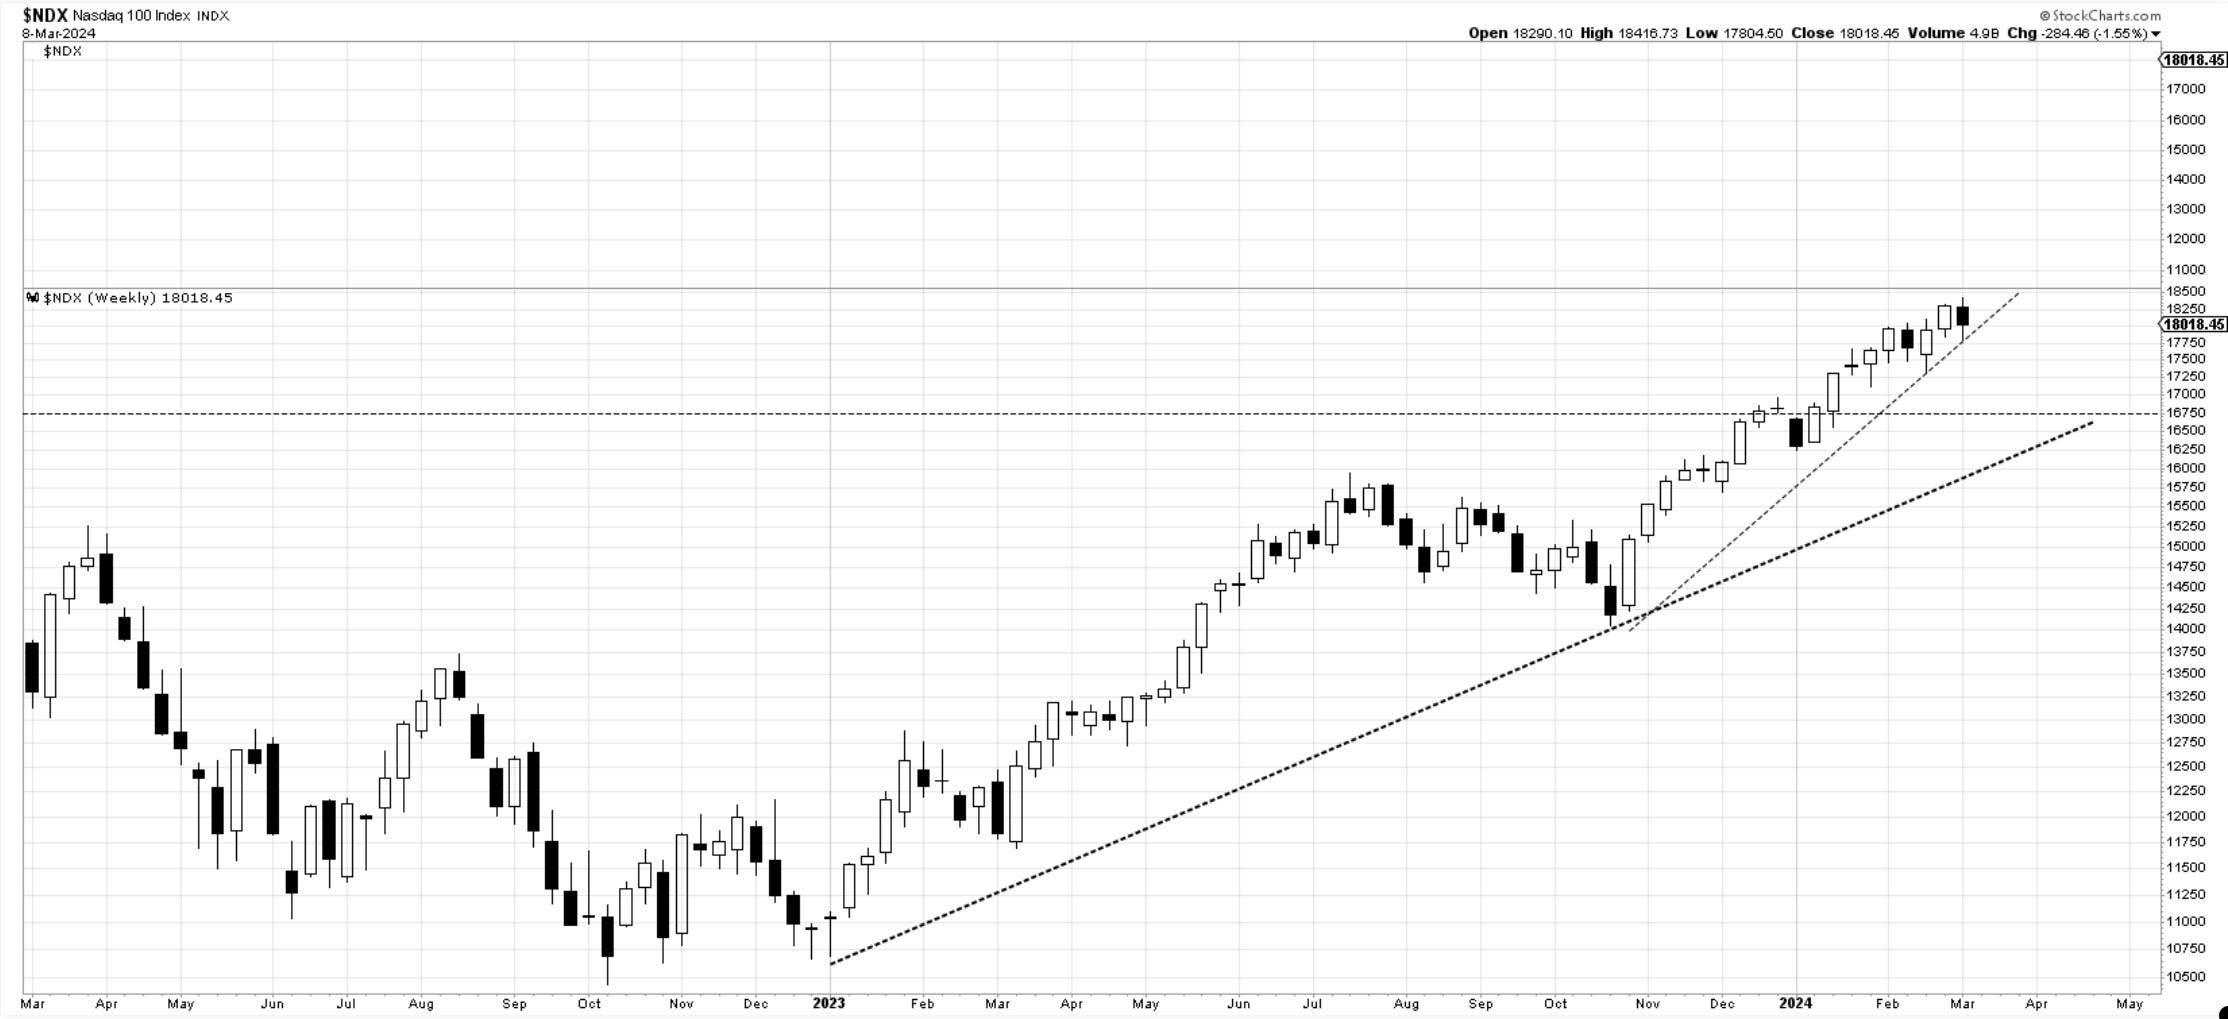
Nasdaq100. There was some buying into the trendline, but it faded away. What happens this upcoming week with CPI reactions on Tuesday is important. A close below would likely send us towards 17k support.
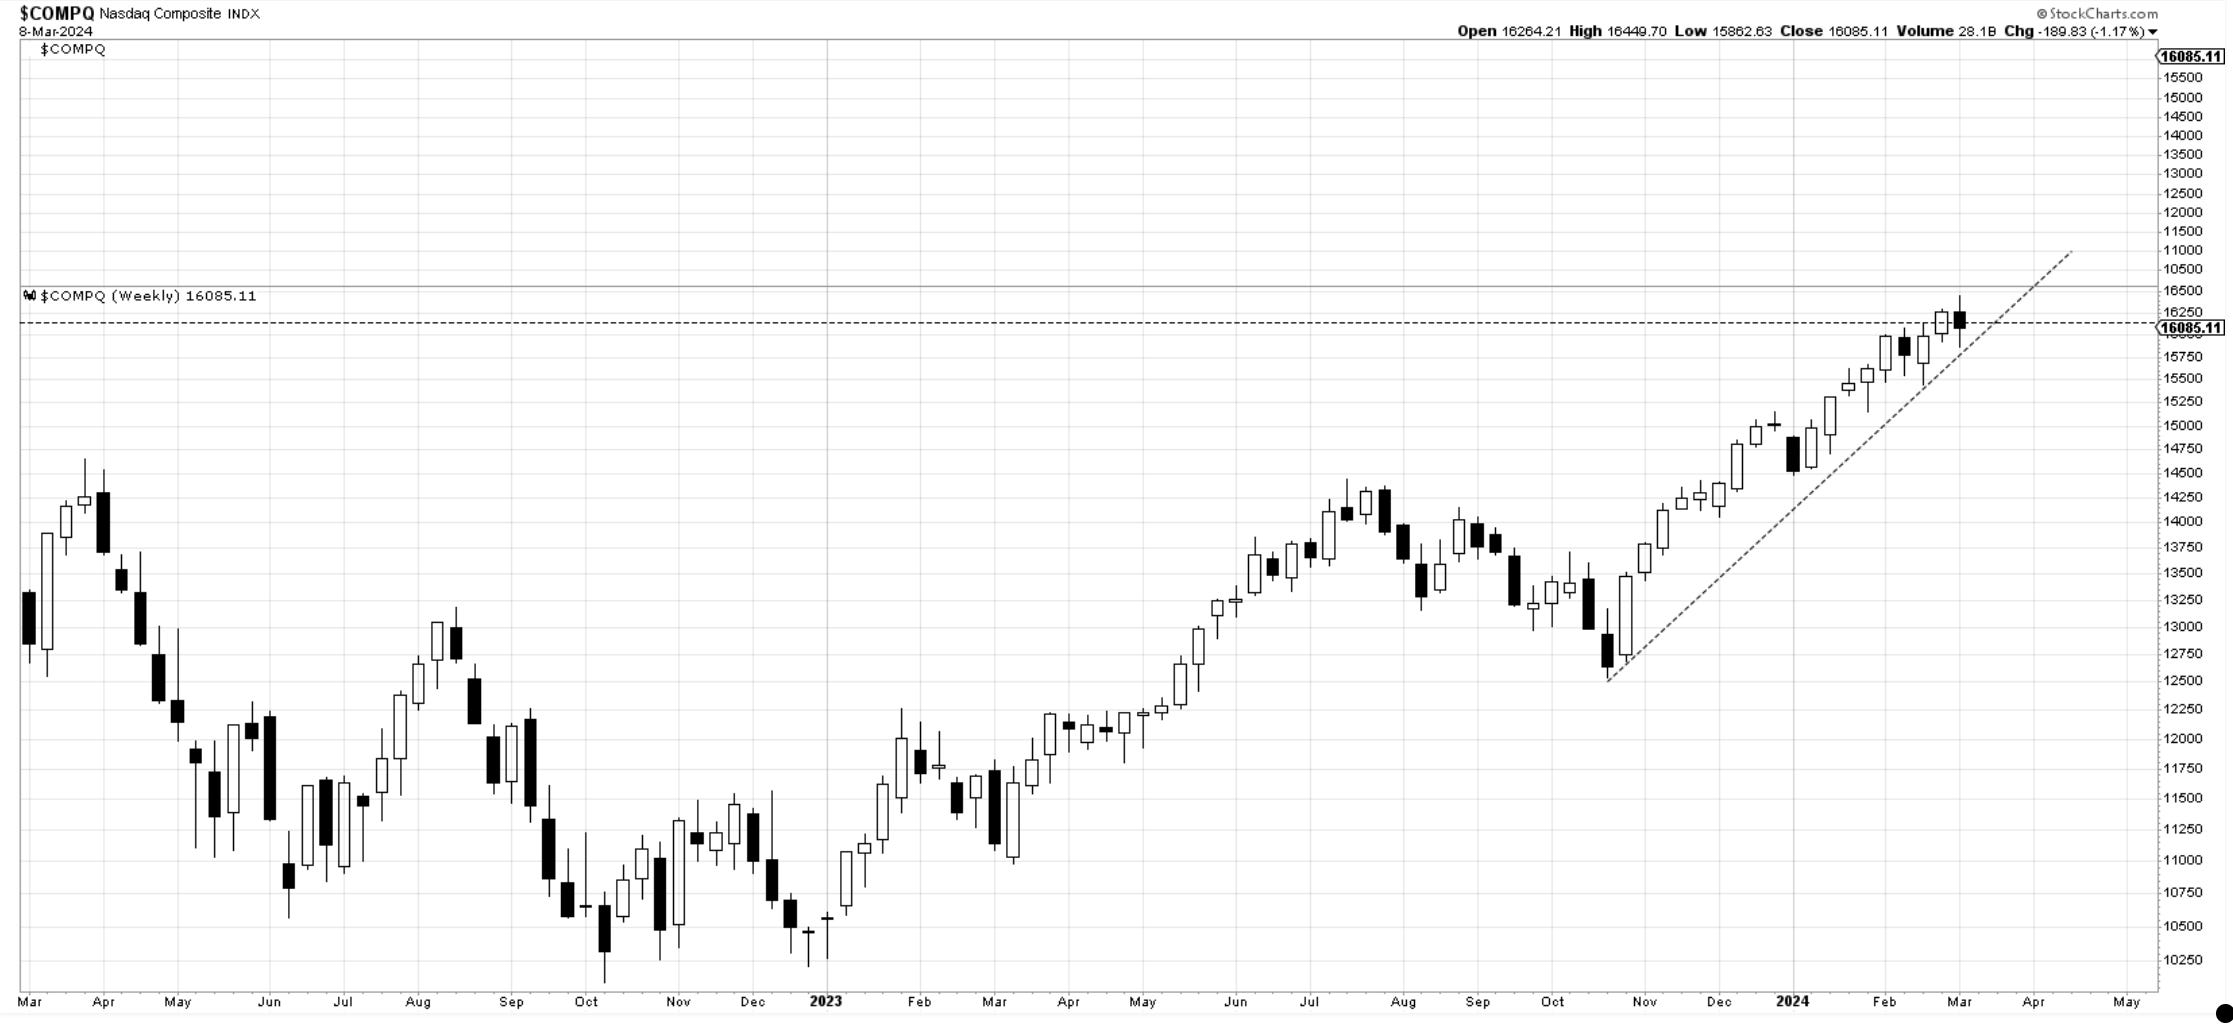
Nasdaq composite: The Nasdaq composite failed to continue closing higher after the bullish close last week. This is not a major signal, but “caution warranted.”
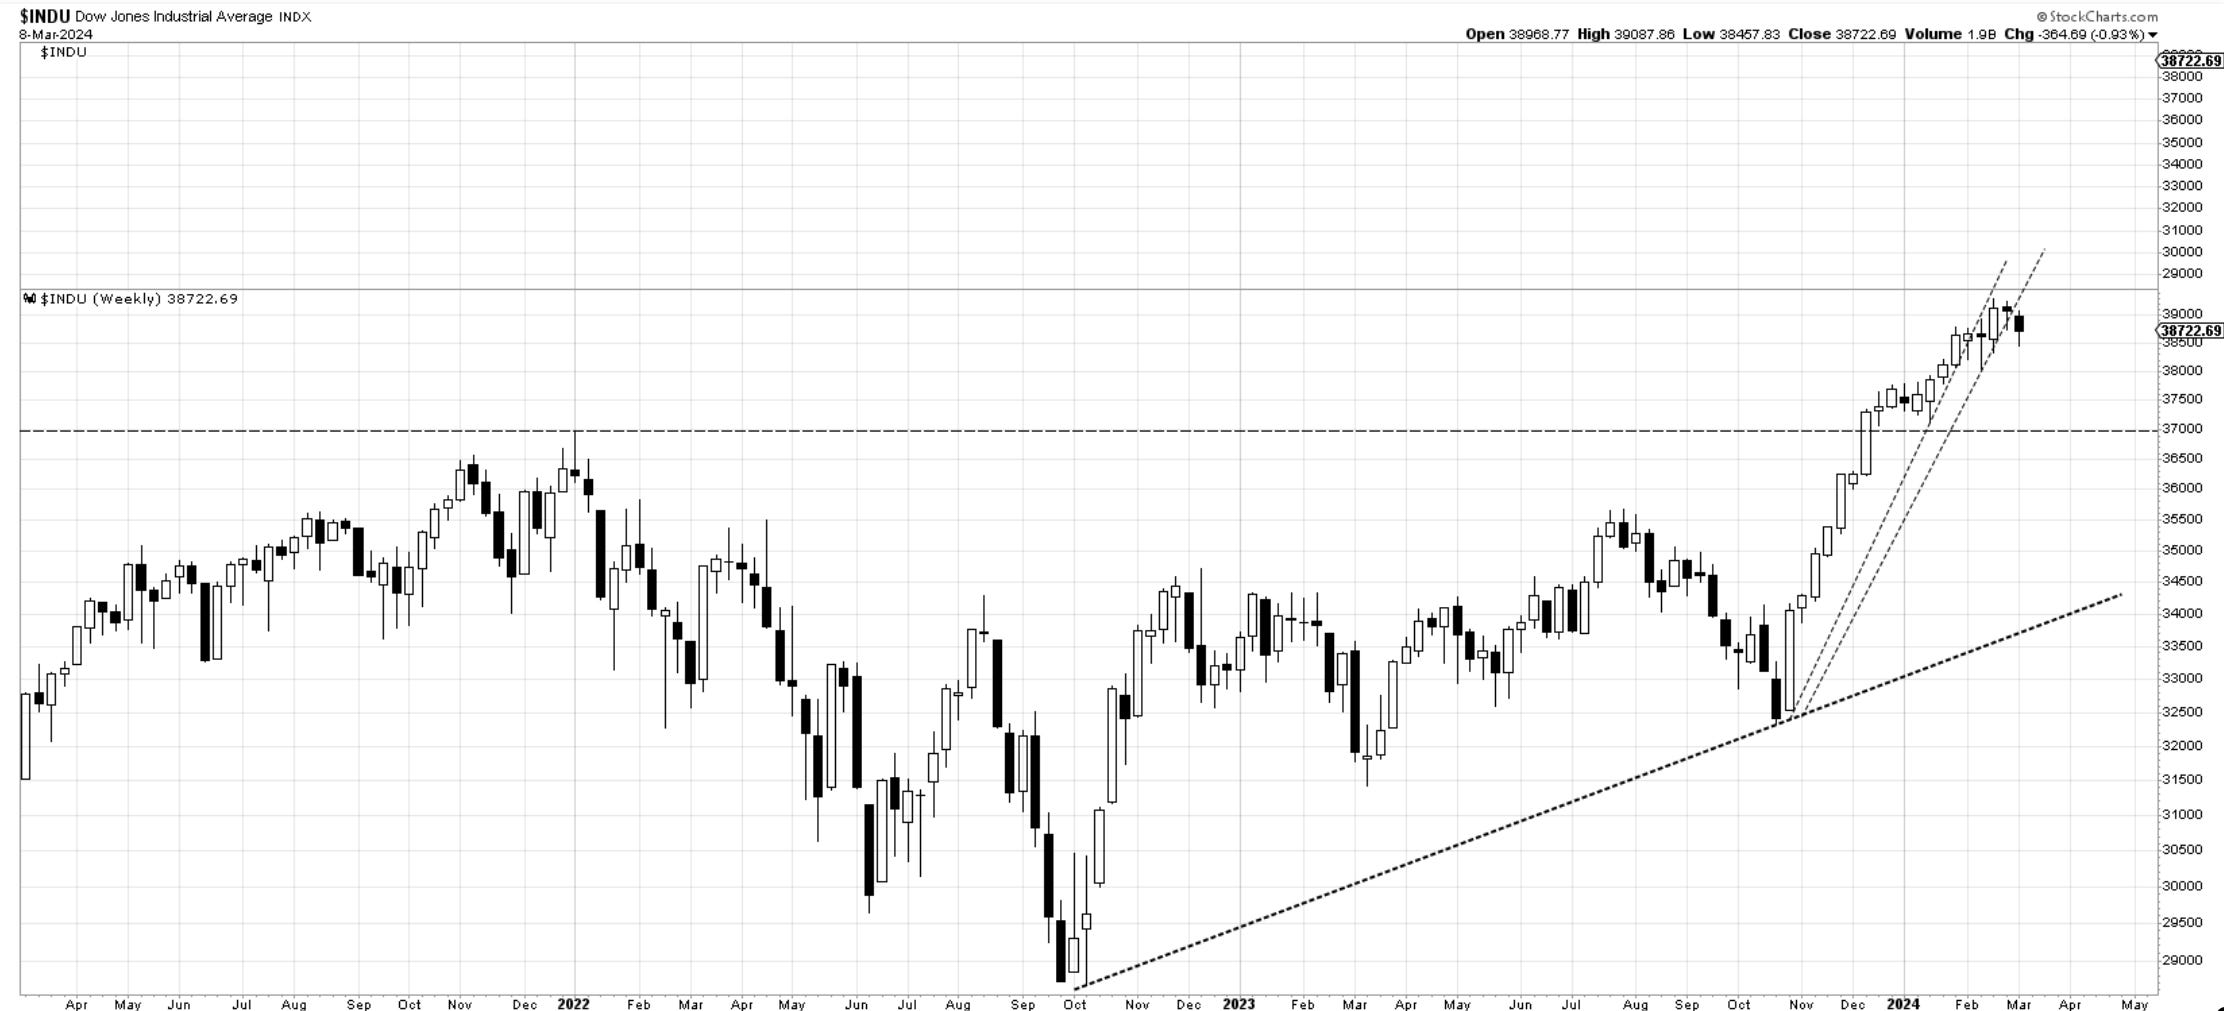
The Dow Jones 30 index has shown persistent weakness for the past two weeks. This week’s close doesn't inspire confidence. If a corrective move is starting, it will likely get us to 37000.
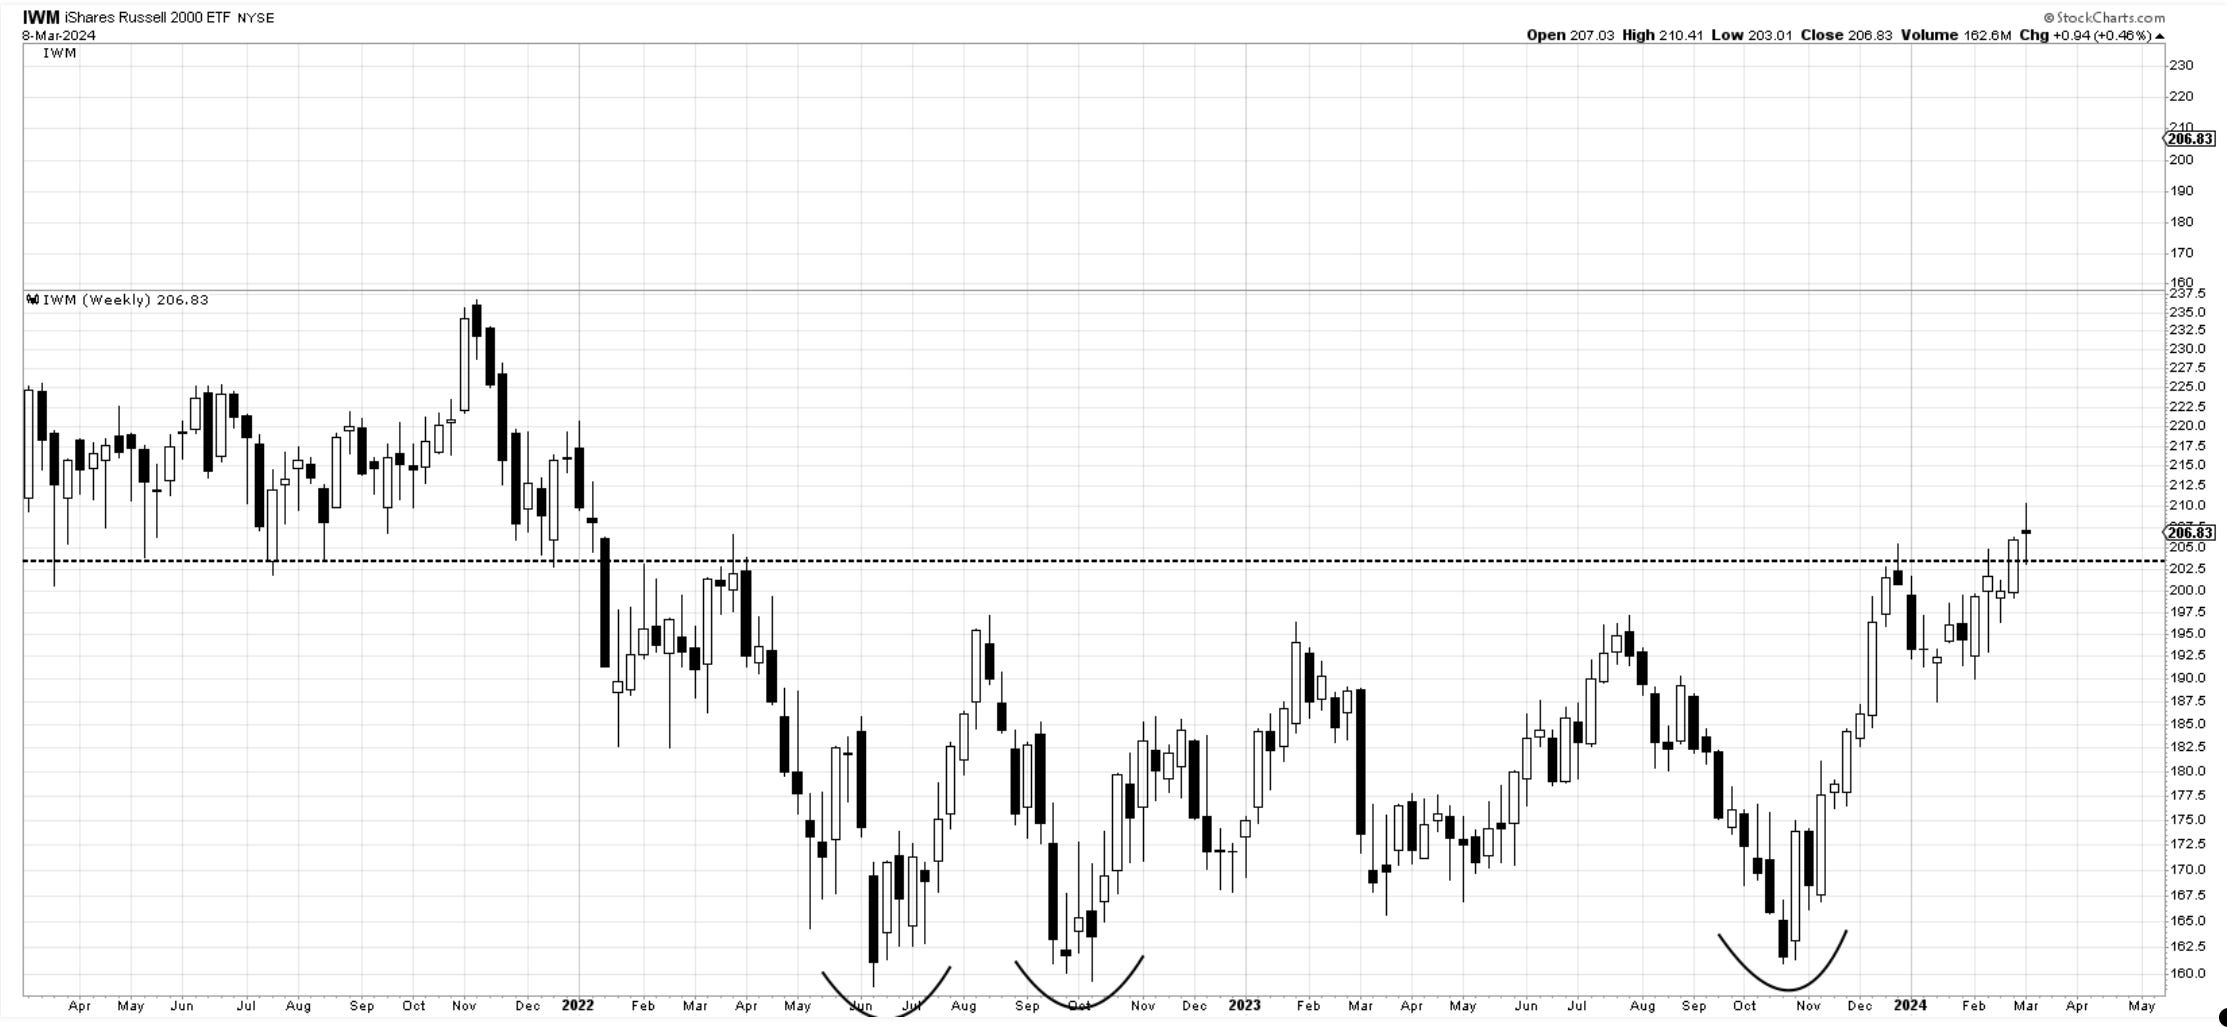
IWM—small caps. This index, which has been severely underperforming, made new 52-week highs. It’s one area of the market that can stage significant returns going forward, especially on a rate-cutting cycle. This week’s close was flat but unless we close back below 200 I would not be terribly concerned. Curious how it will behave if the other markets are taking a breather.
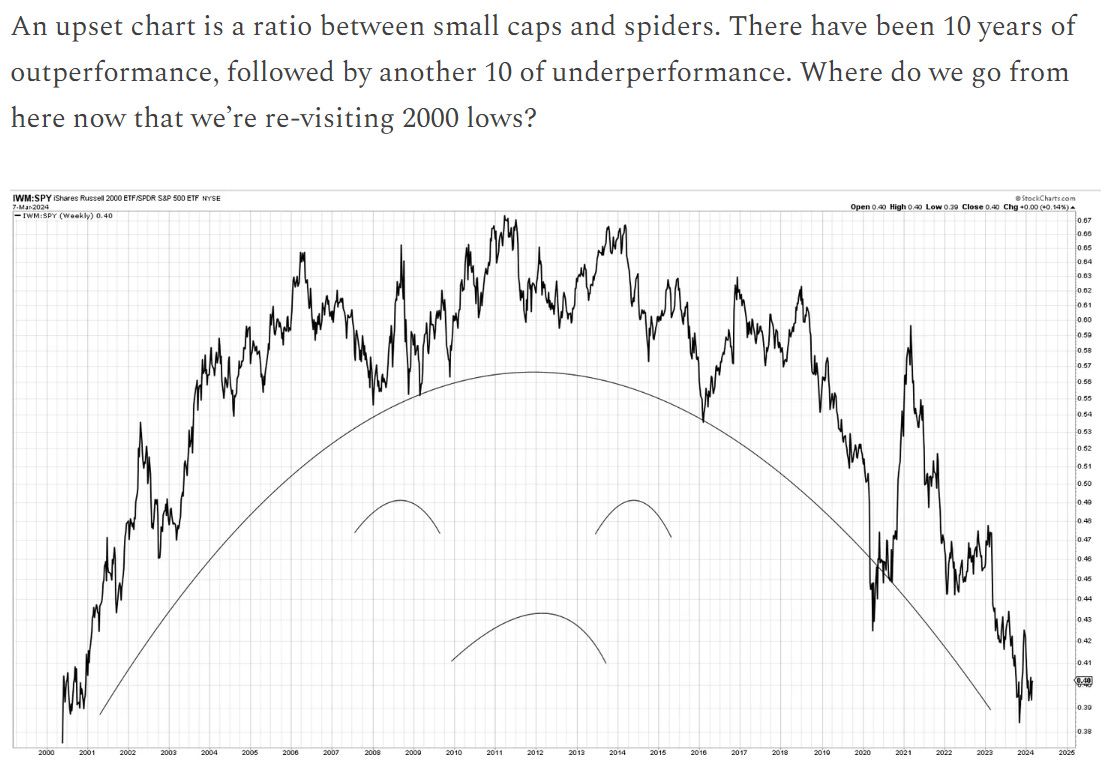
I have shown this chart below in the daily updates.
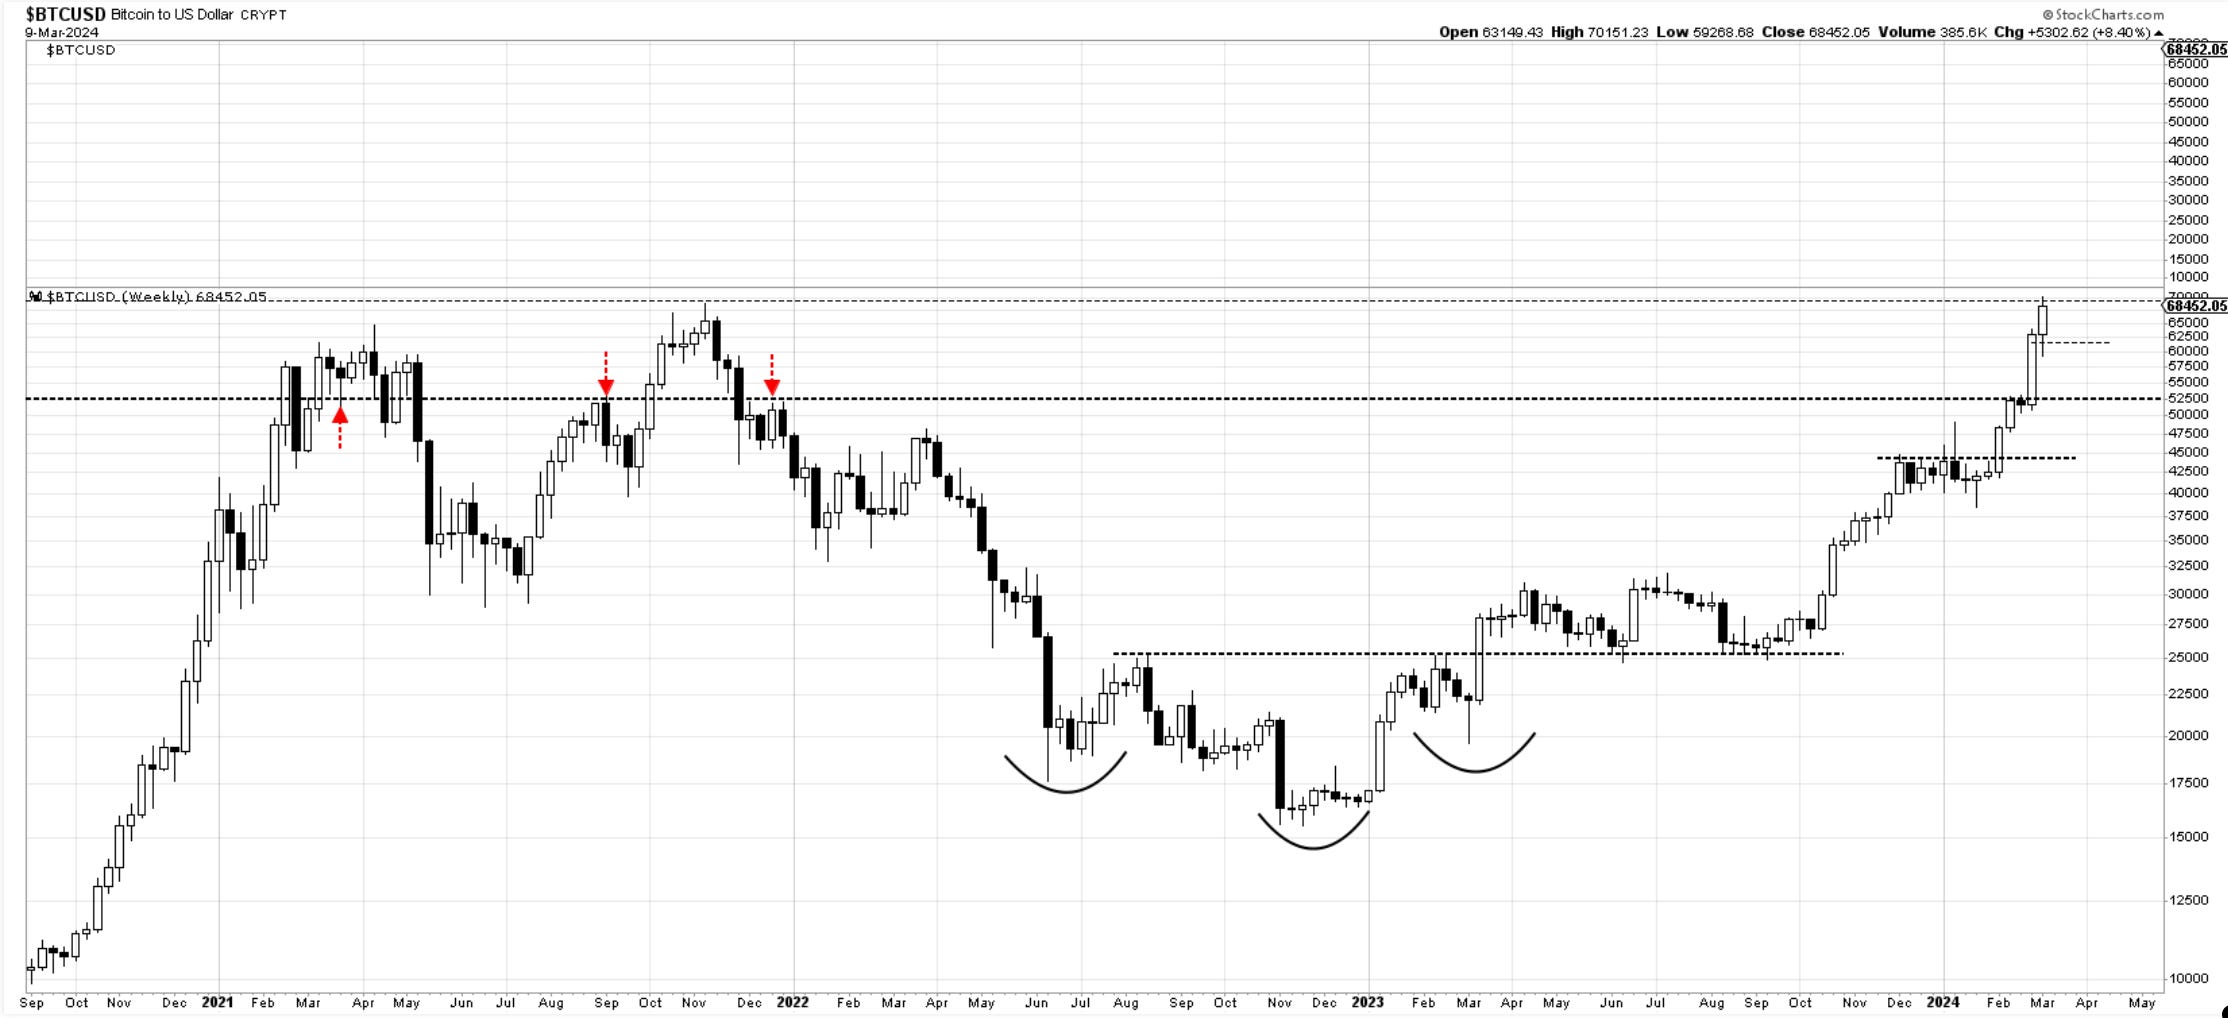
Bitcoin - it seems likely that we will be closing at new all-time highs this week. The price action here on the weekly charts remains bullish. I discuss this on a daily basis through written and video updates via “The Daily Drip” updates. Support is near 61k. Dips are likely to continue getting bought into that level.
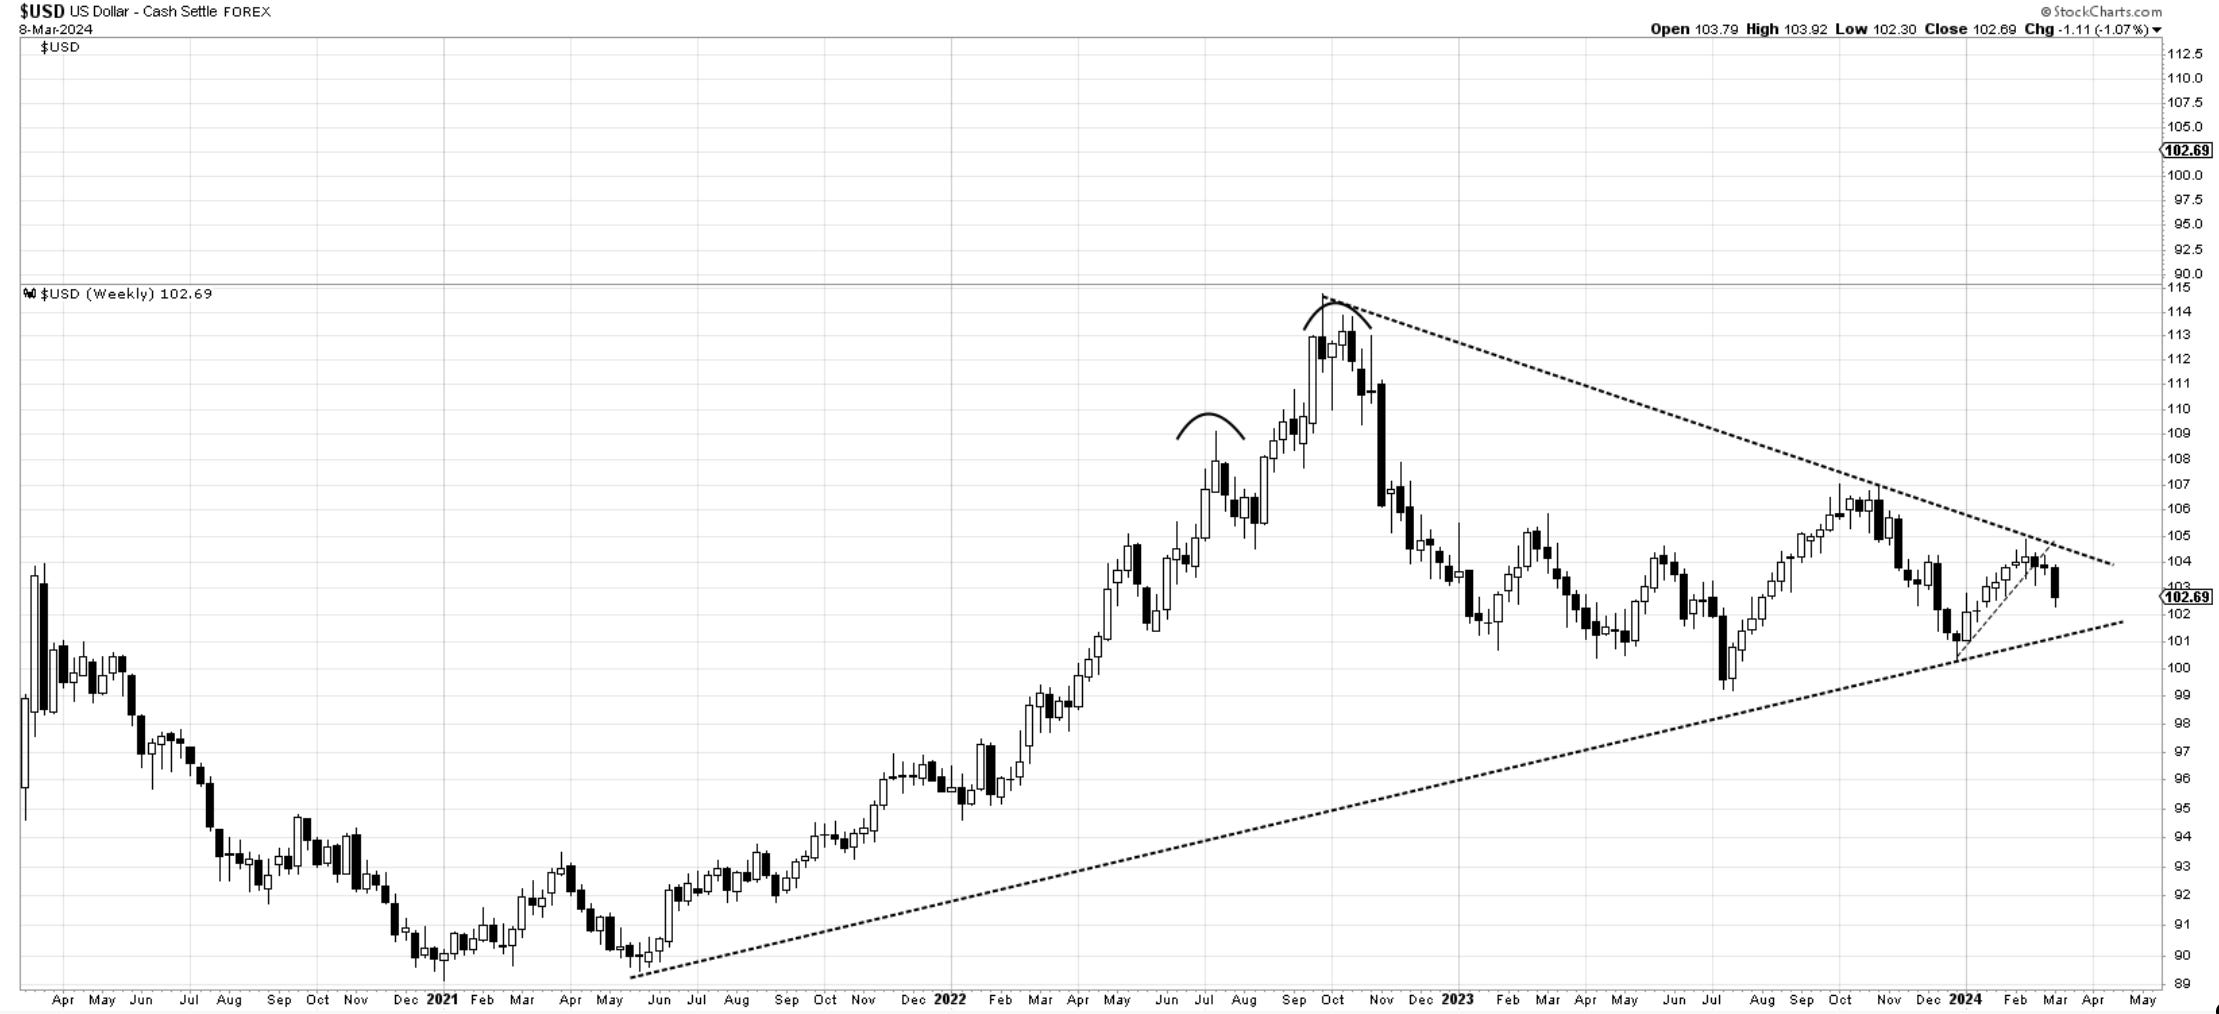
The US Dollar - remains in a state of equilibrium near 104. There are head and shoulder arguments since May 2023 peak with a head Oct 2023. Usually, these formations need to reverse something, and there is nothing apparent to reverse. Looking as a continuation pattern, it would suggest a break lower, but realistically until 101 gives way, there is not much to do here but observe.
update- dxy broke lower this week. Support coming in at 101. Take a look at the wave counts in daily updates, where the chances of a larger 3rd wave decline are developing.
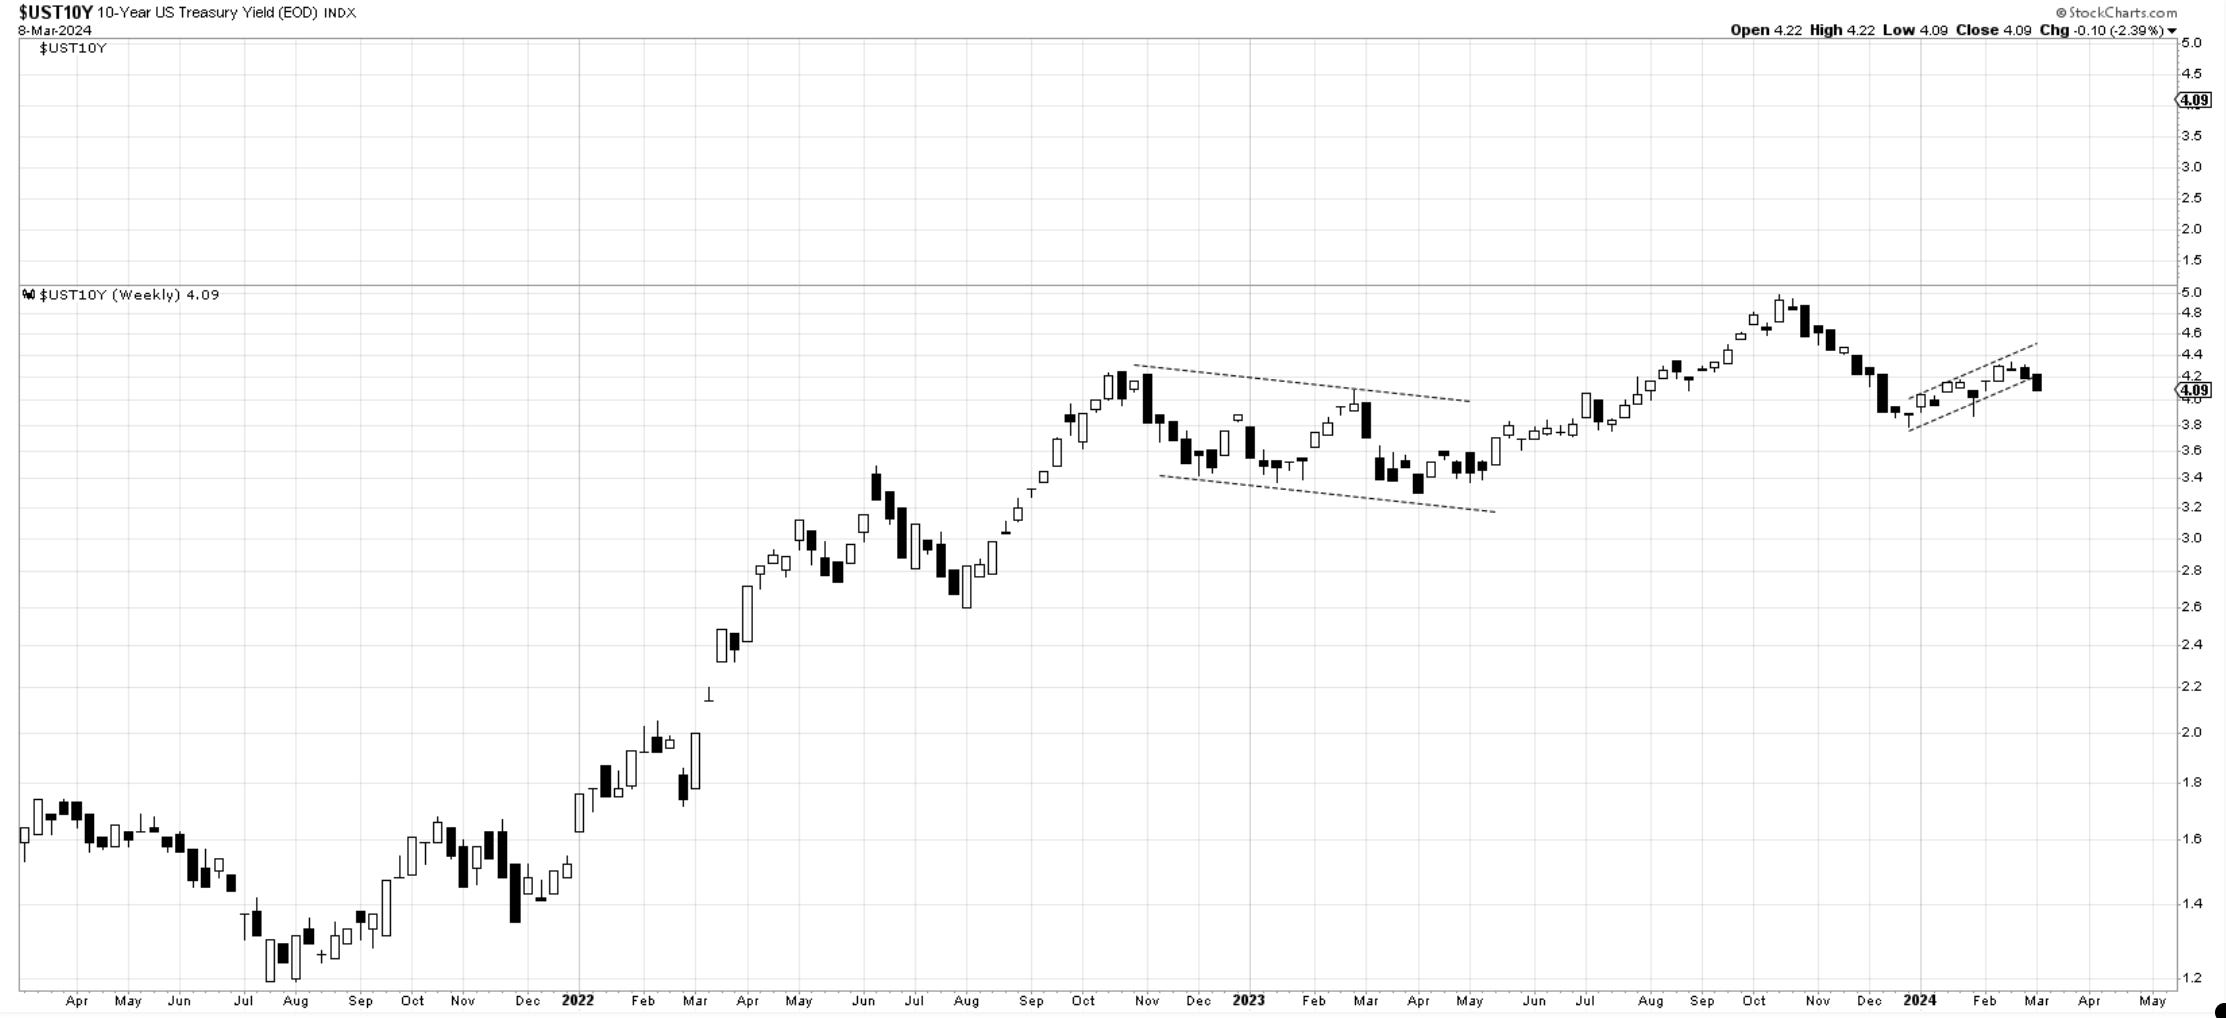
10y Yields - this small weekly bearish flag in yields is a must-watch. If we lose 4% is quite likely we will make new lows. The implications for markets are debatable depending on speed, but lower yields will help risk assets, especially small caps which depend on borrowing.
Update: - We have not lost 4% yet, but based on this week’s close, it is becoming quite likely. 3.8% are next targets.
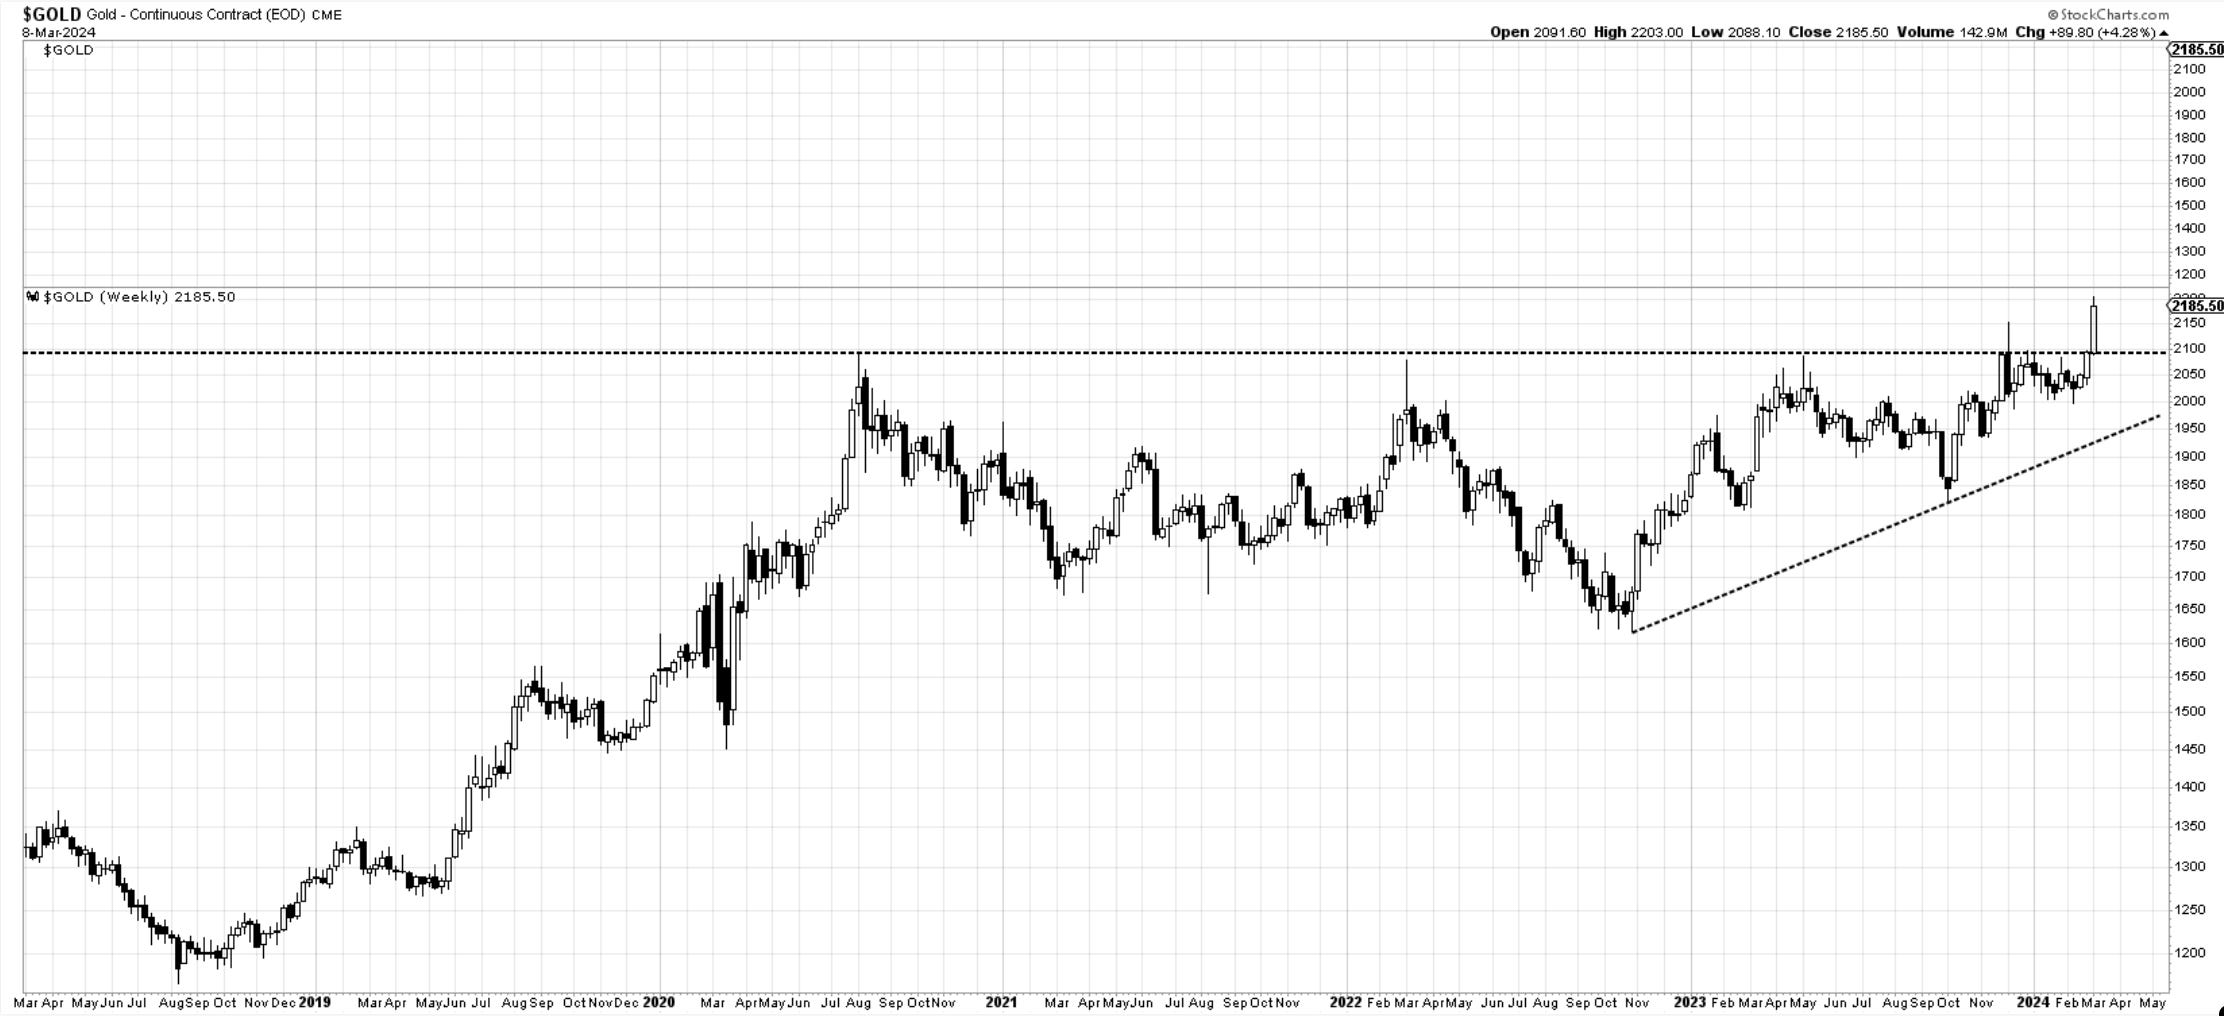
Gold - has now made a new all-time closing high at 2,095.70. I would take this as a very bullish development that has the potential to move the yellow metal towards 2200 and above. Would love to see follow thru next week.
Update: I recommended Gold at the close of the prior week but did not expect such a quick move higher. It is a stunning breakout after more than three years of consolidation. Support and bids will be layered at 2100 but now Gold is saying much higher prices ahead.
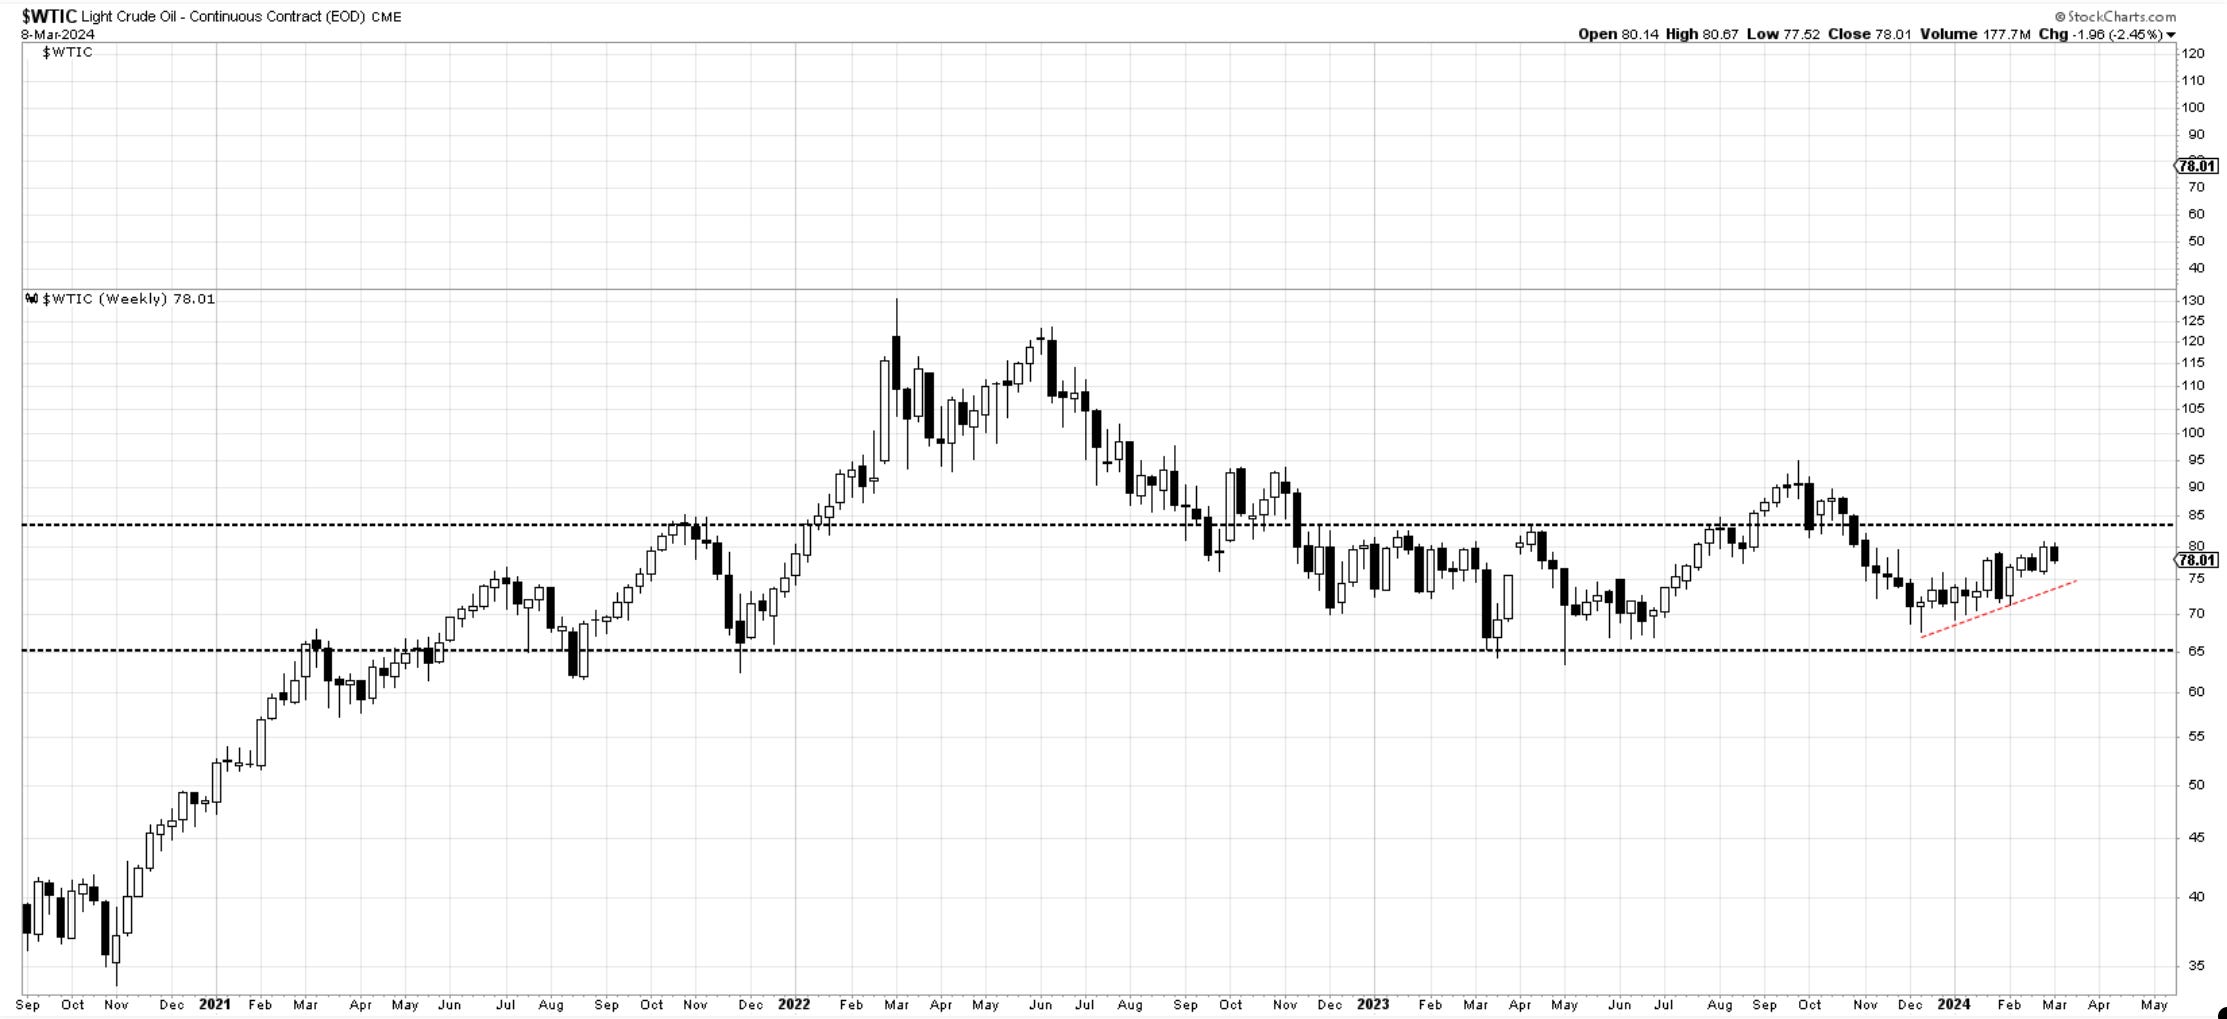
OIL - it remains in a tight upward channel with a support trendline seen below. I am still neutral until either the upside horizontal level give way , or we break trendlne.
Thank you all for reading, I will see you next week. Leave a comment or suggestion below. Join our chat to discuss markets with fellow traders.
In the meantime, please consider subscribing and supporting EWCafe and read “The Daily Drip,” where I provide daily market updates, videos, and commentary on core markets.
Cris,
EWCafe