
Weekly market review

This weekly report is free. Check out the new updated payment plans for the daily market updates.
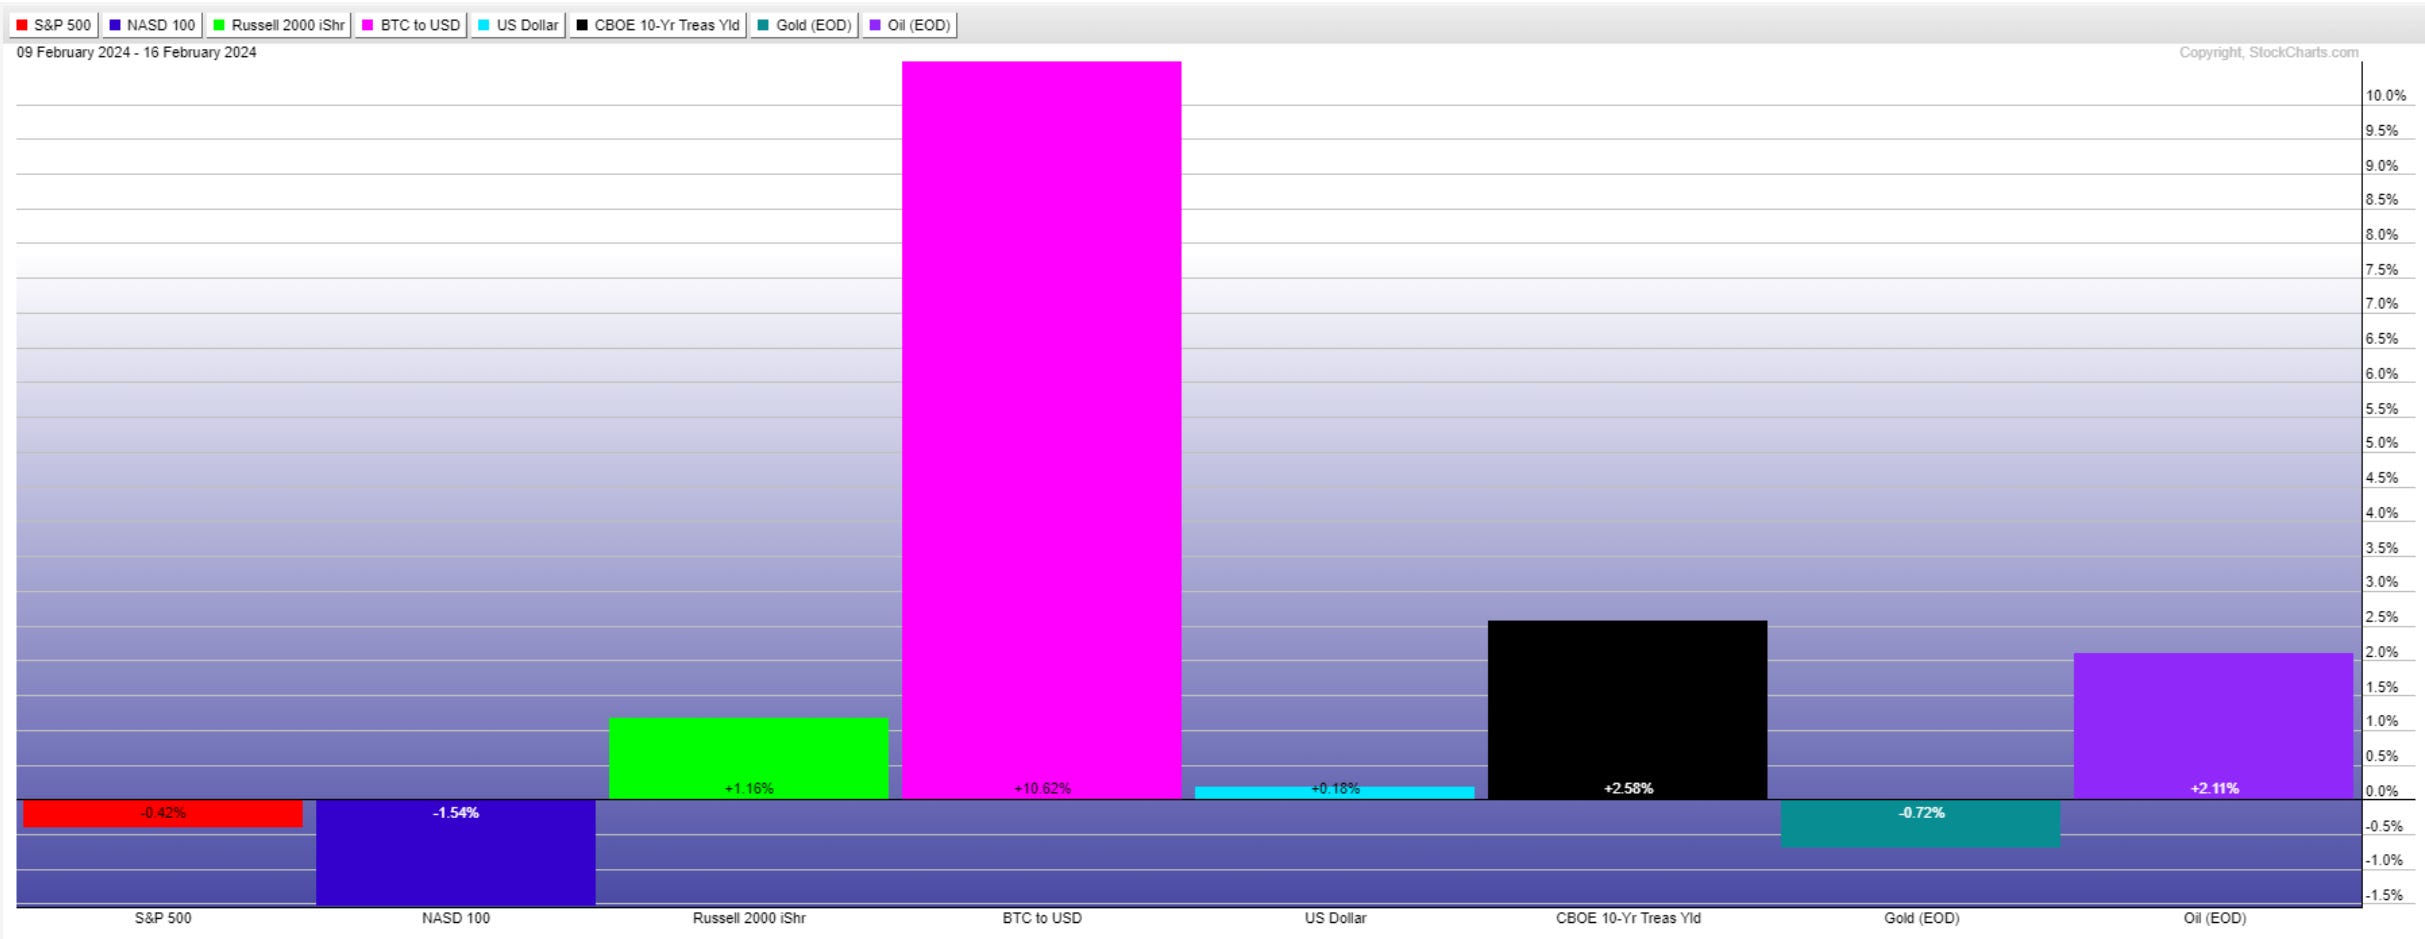
Market performance for the past week is below.
Bitcoin is a clear winner at +10.6%, followed by 10Y treasury yields and Oil. Small caps have also put in a decent performance. Large caps fell with QQQ at -1.54%.
Sentiment
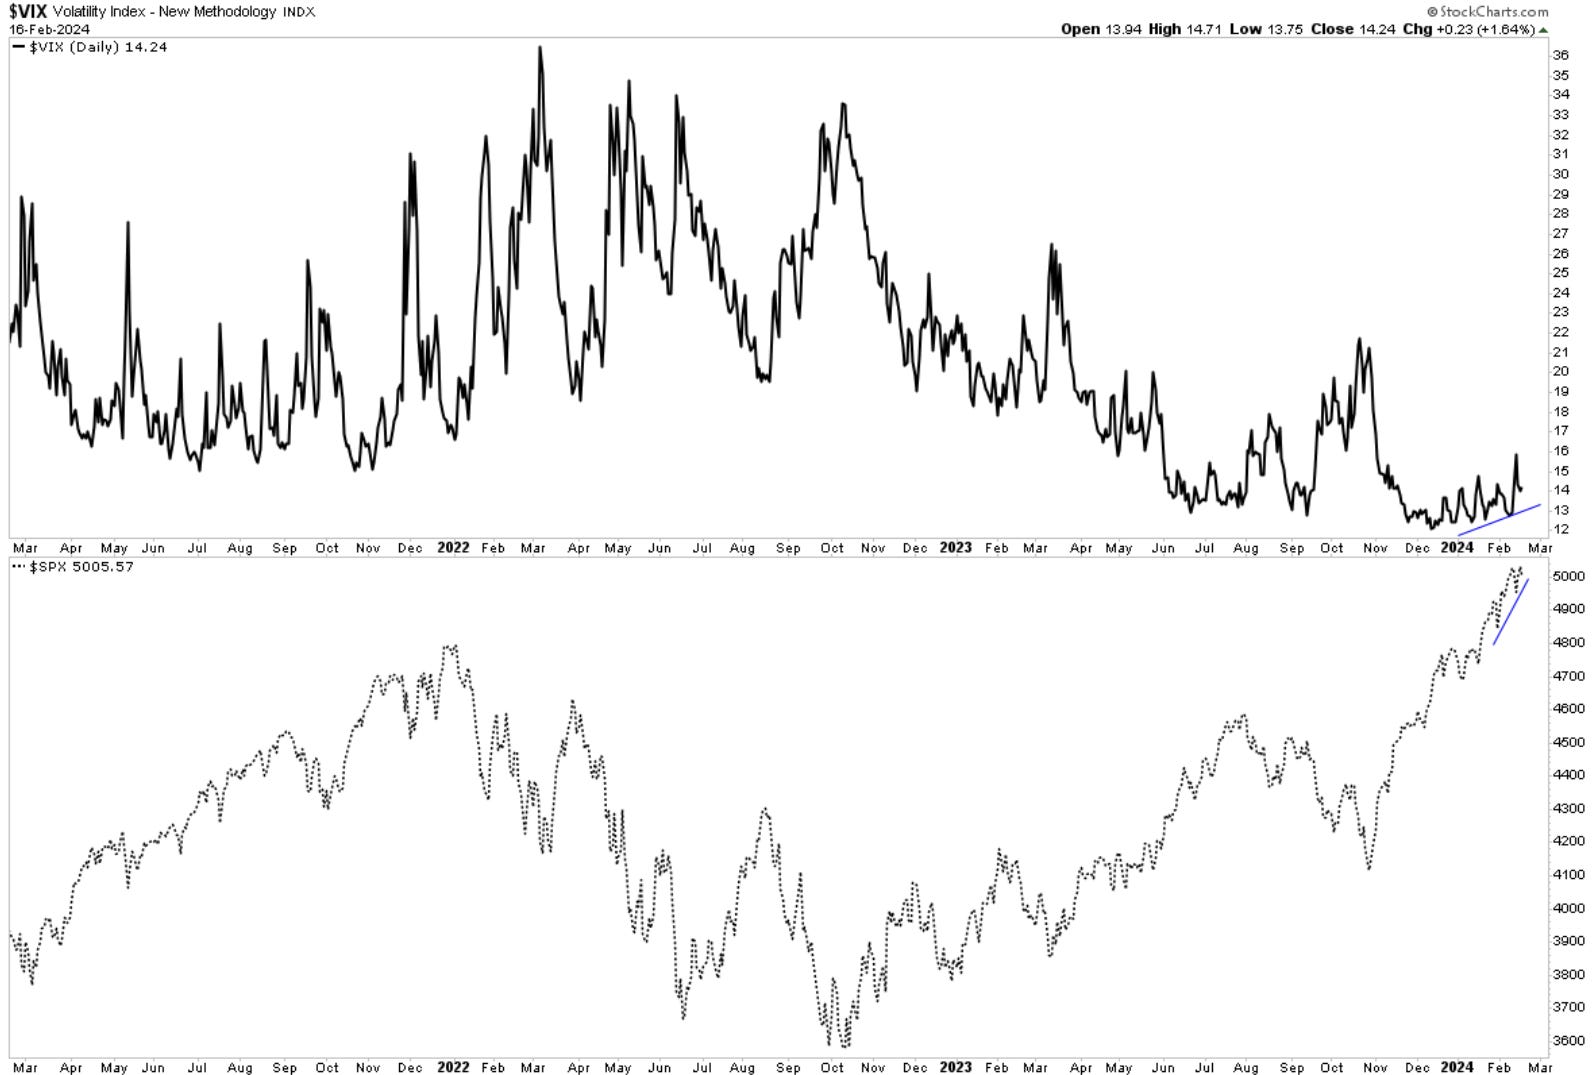
There was a slight increase in VIX in a series of higher lows from the start of the year, with the market rising as well. It is a bit odd and a small warning sign for risk appetite.
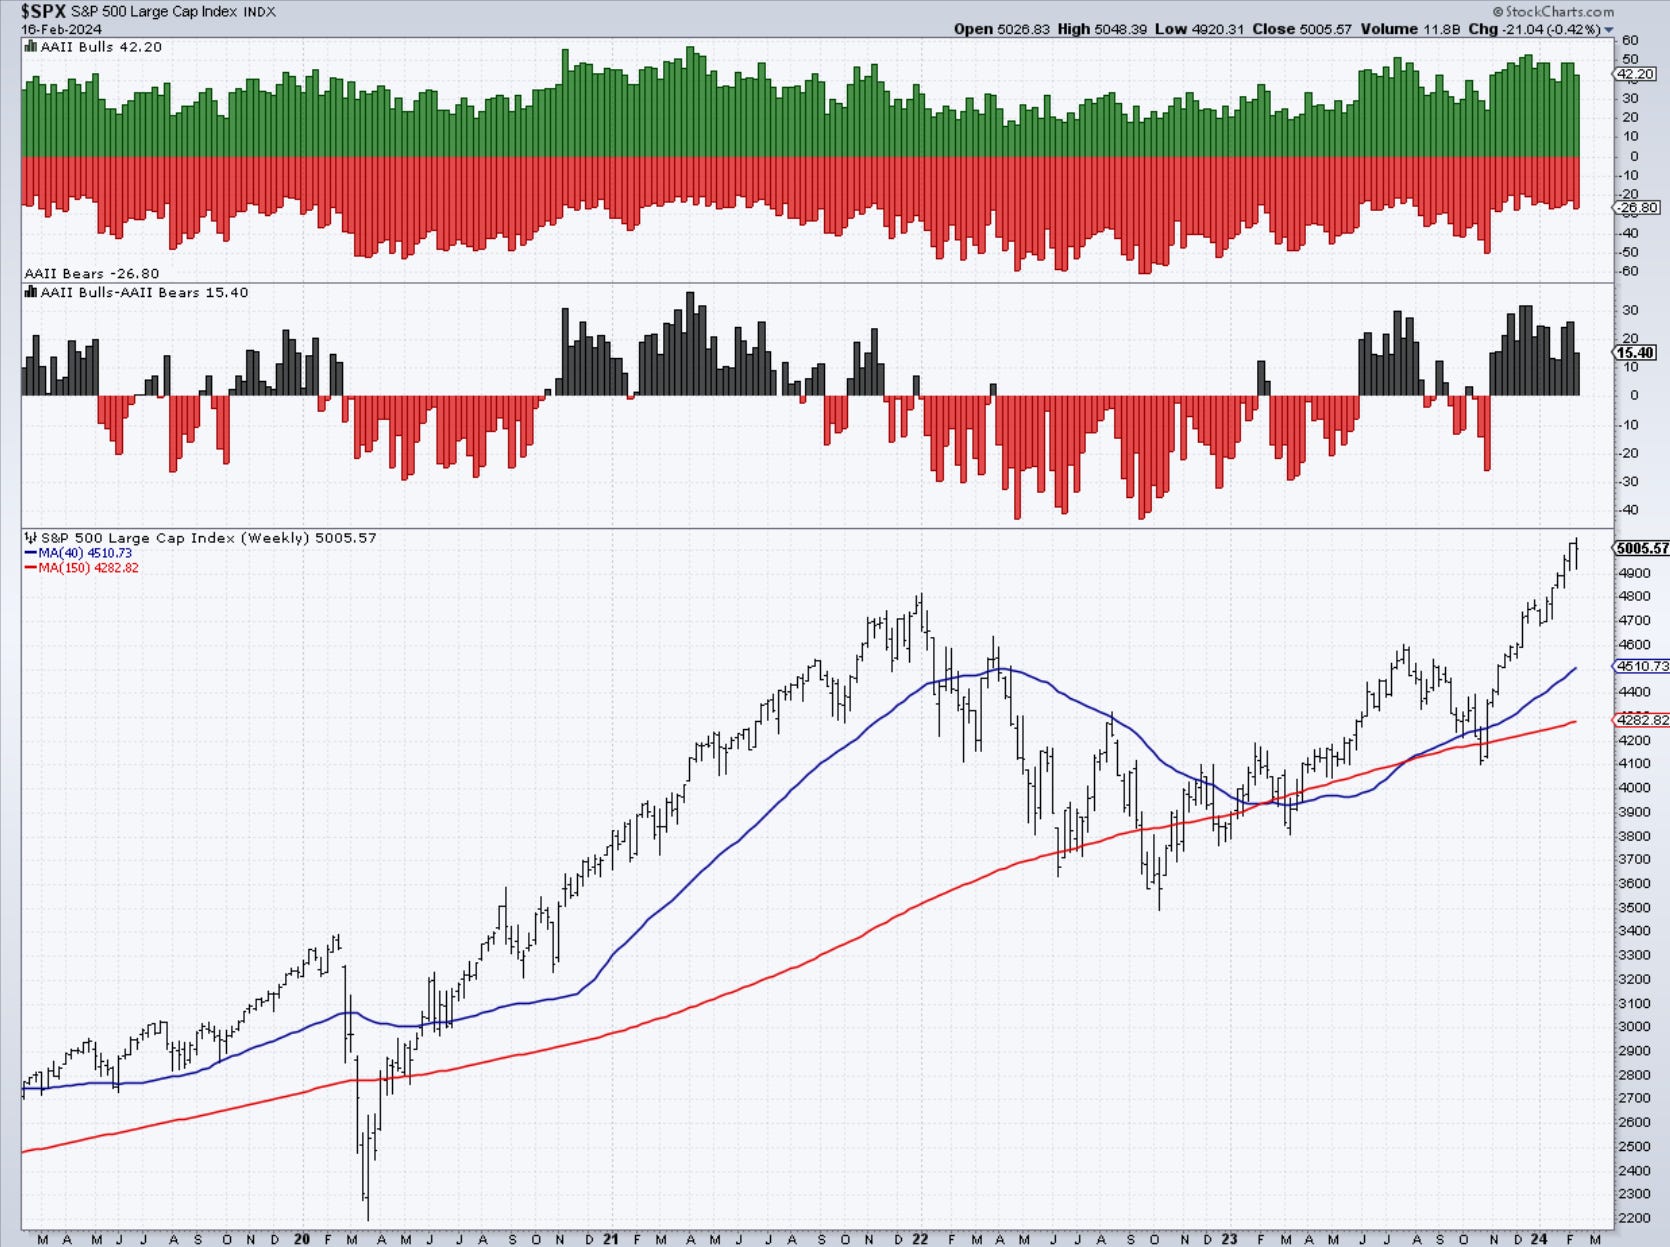
The AAII spread has decreased slightly this week but remains well above 0. Notice the high in sentiment was the week of Dec 18th 2023.
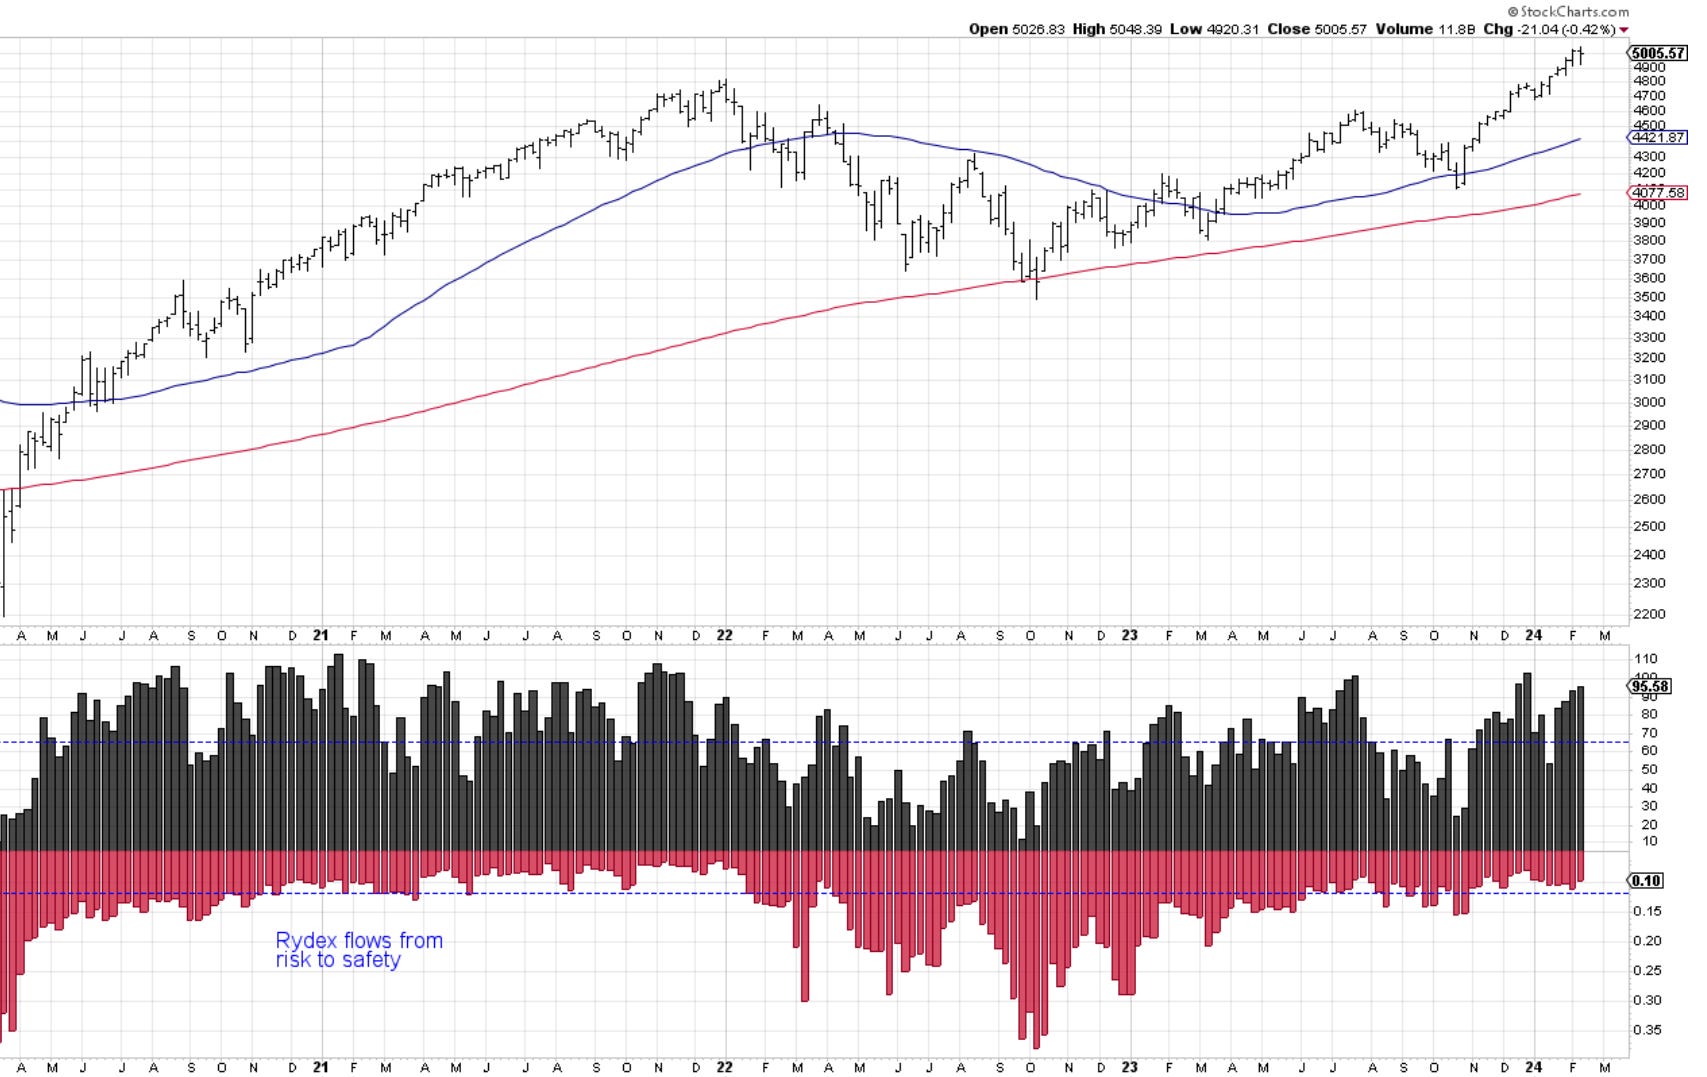
Investment managers continue to have large exposure to equities, although a bit lower than at the end of 2023. Flows to safety are being reduced as well.
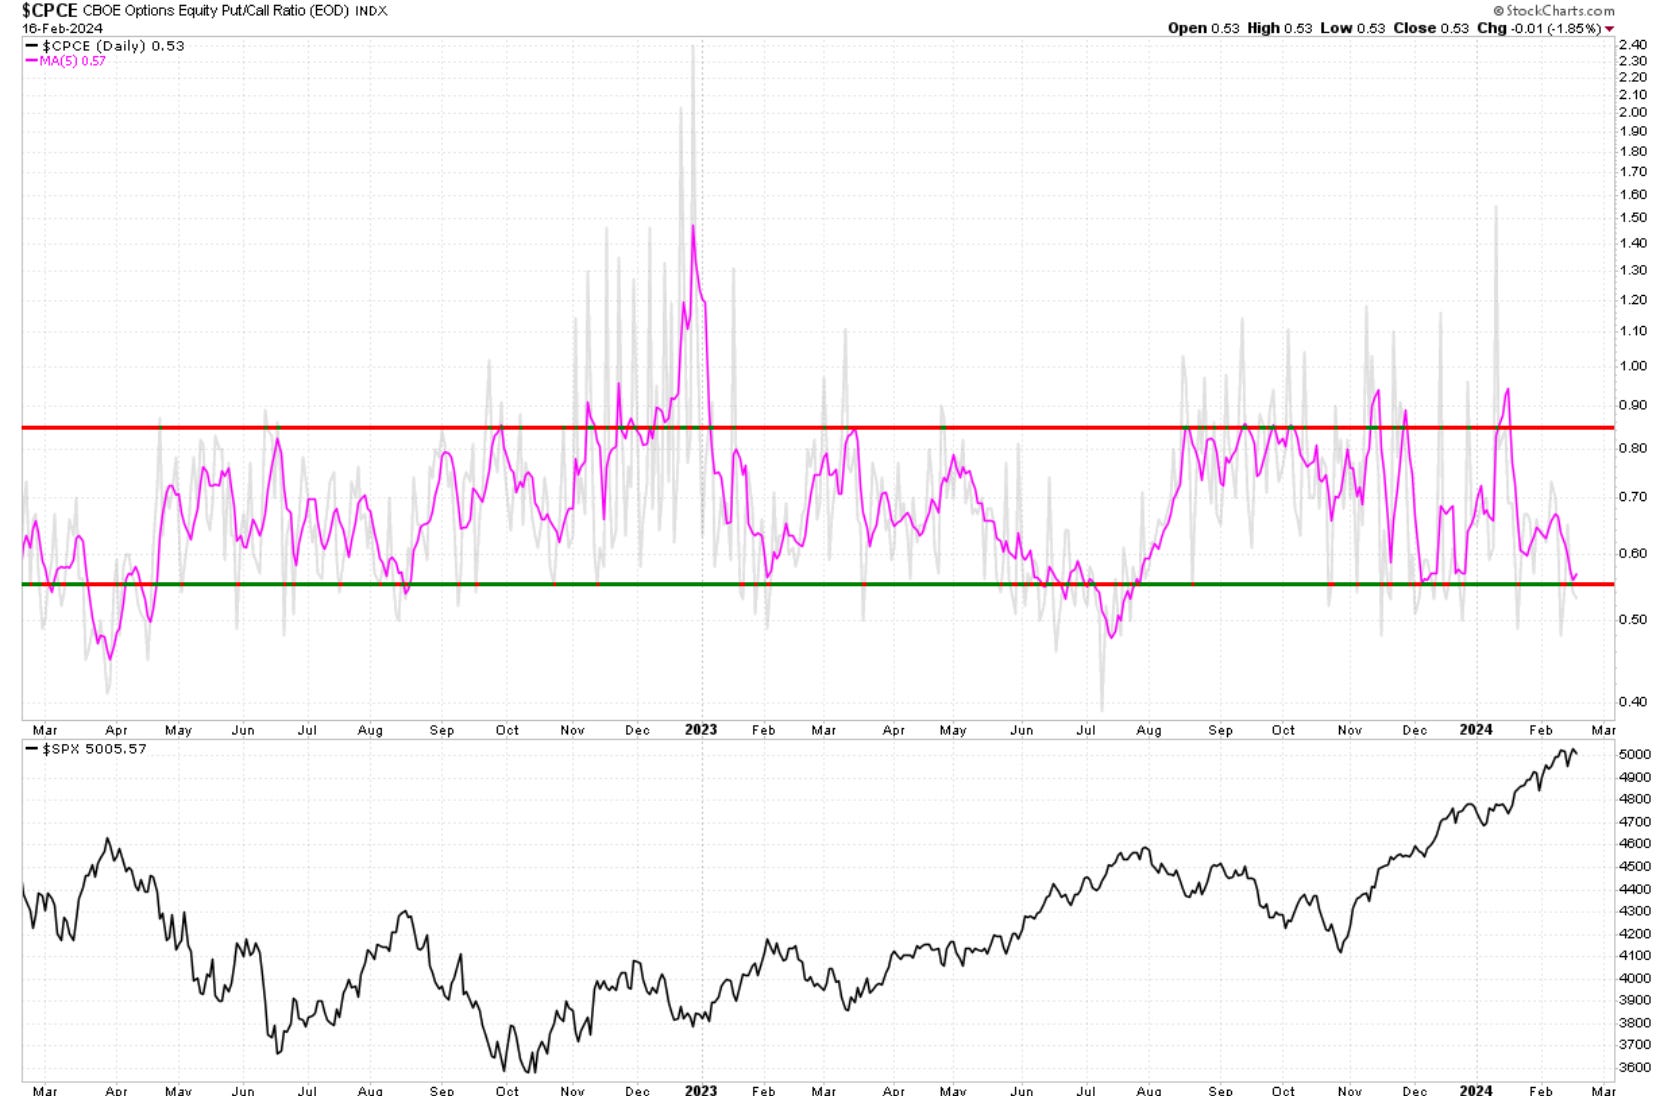
The 5-day average of the Equity put/call ratio is back in an area that traditionally coincides with “a bit too much excitement out there” sentiment.
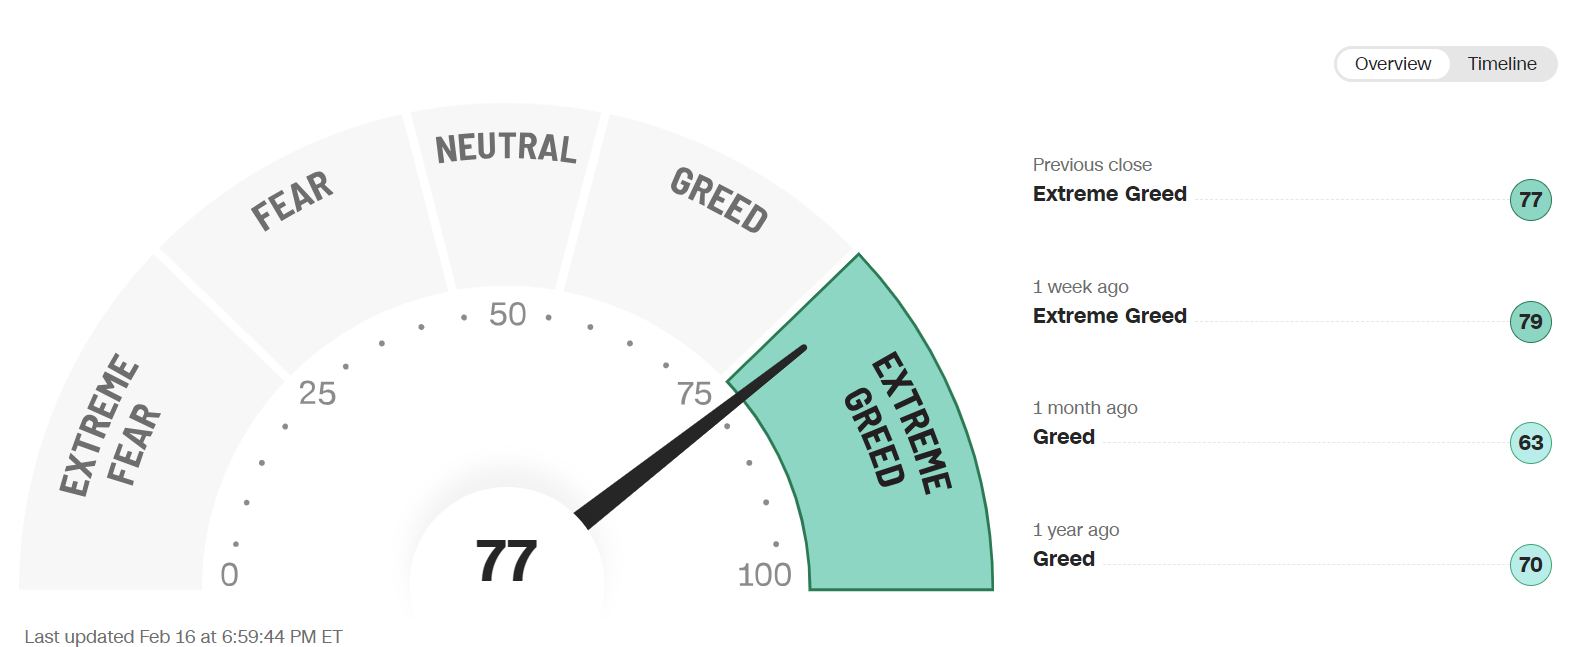
The sentiment section would not be complete without the CNN gauge of Fear vs Greed. Some say it’s not a good gauge overall, but I find it quite accurate.
Cycles
Note: cycles refer to time projections only not price projections.
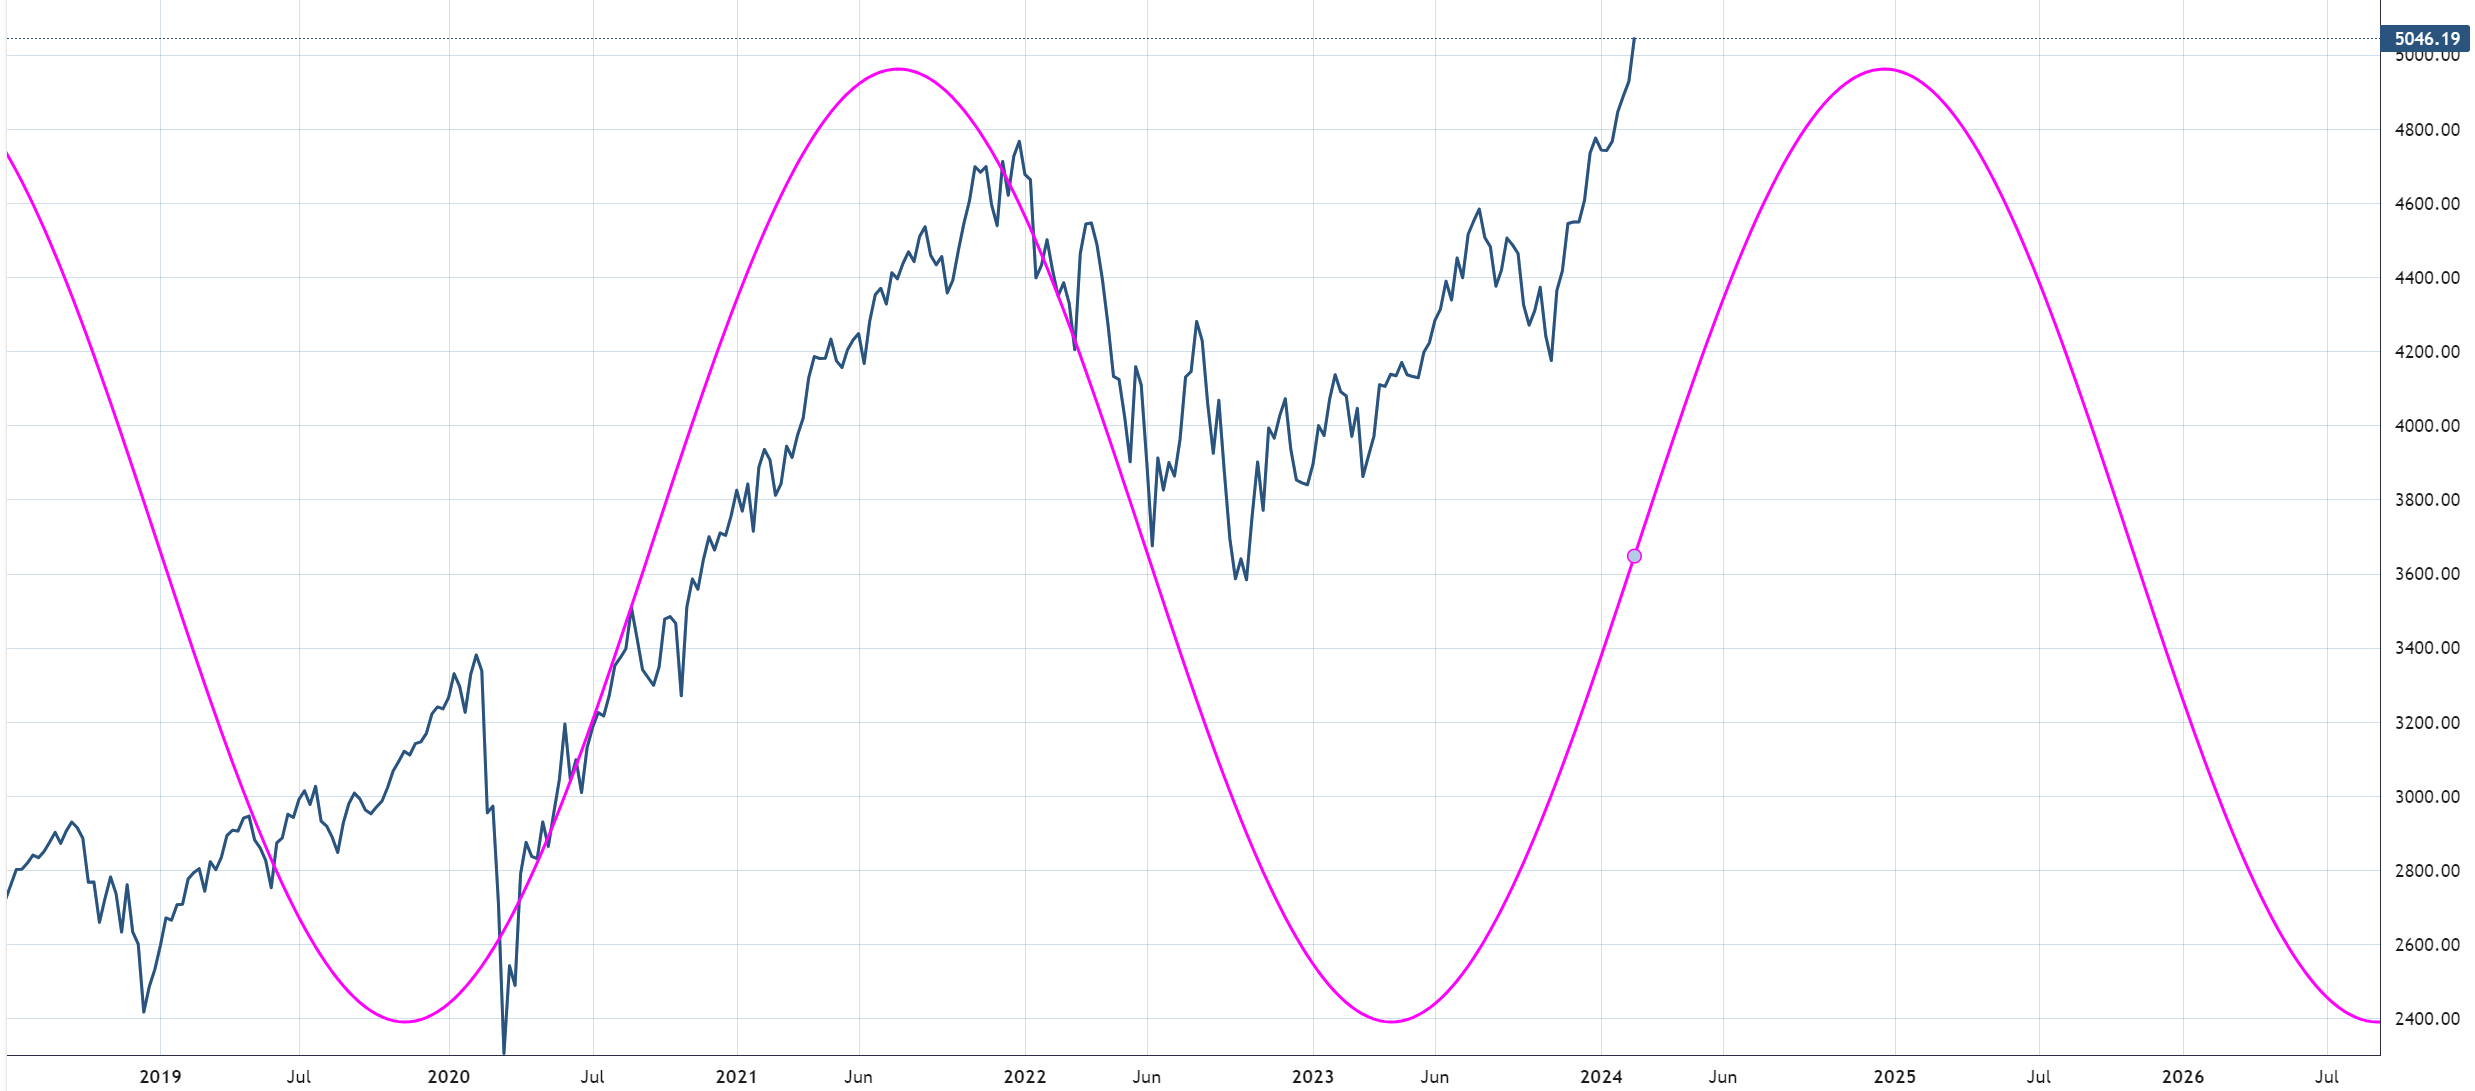
SP500 . The 180-day active weekly cycle continues to show an elevated market for the rest of the year. There are daily swing cycles of around 80 days within this which show corrections within this larger picture.
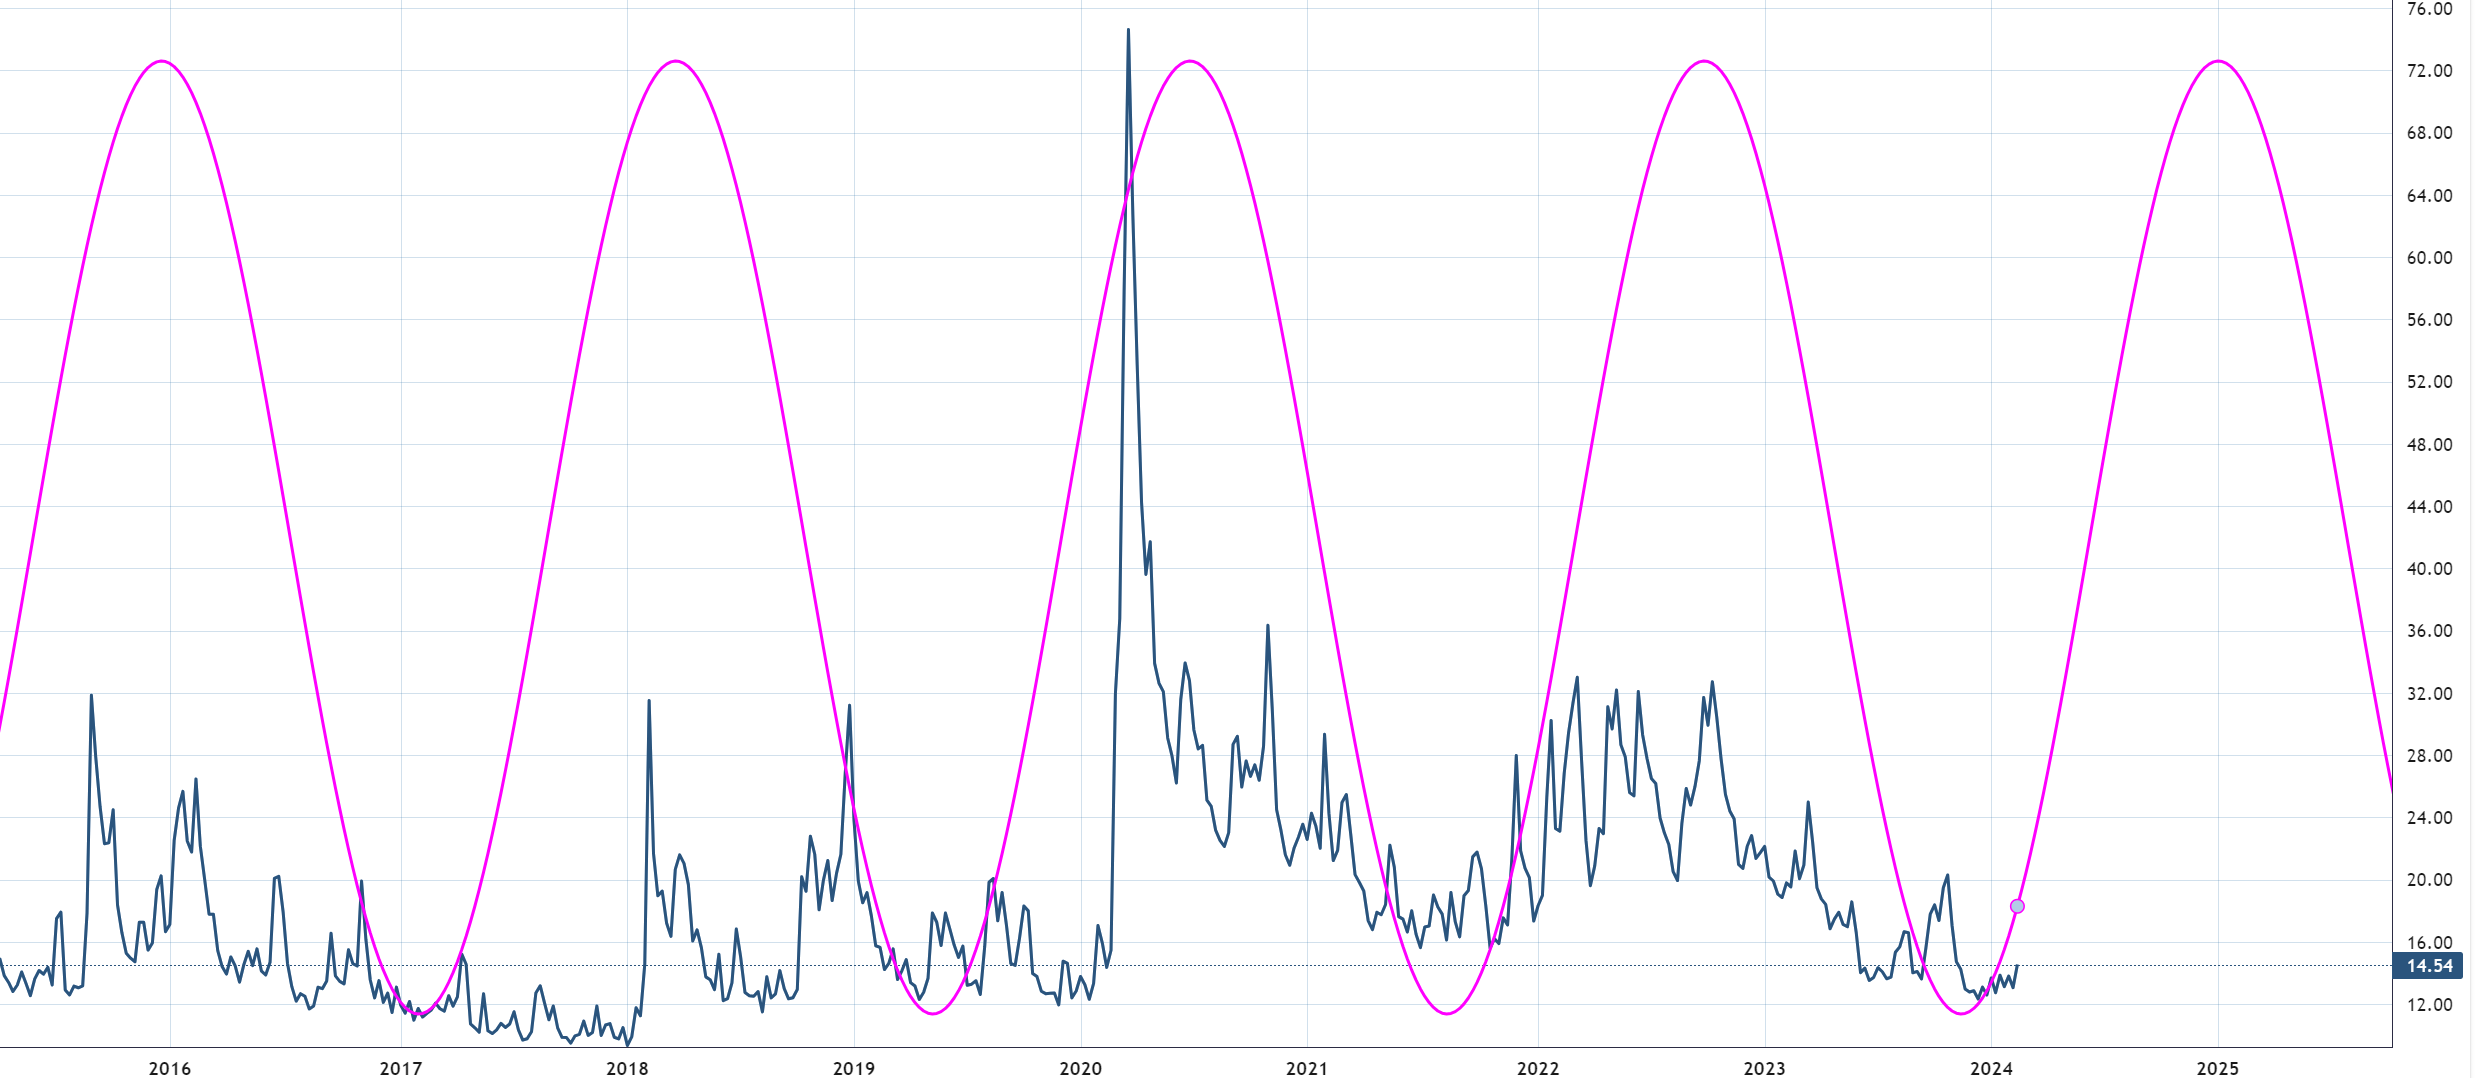
VIX is at 120day active weekly cycle and shows increasing volatility swings for the remainder of the year.
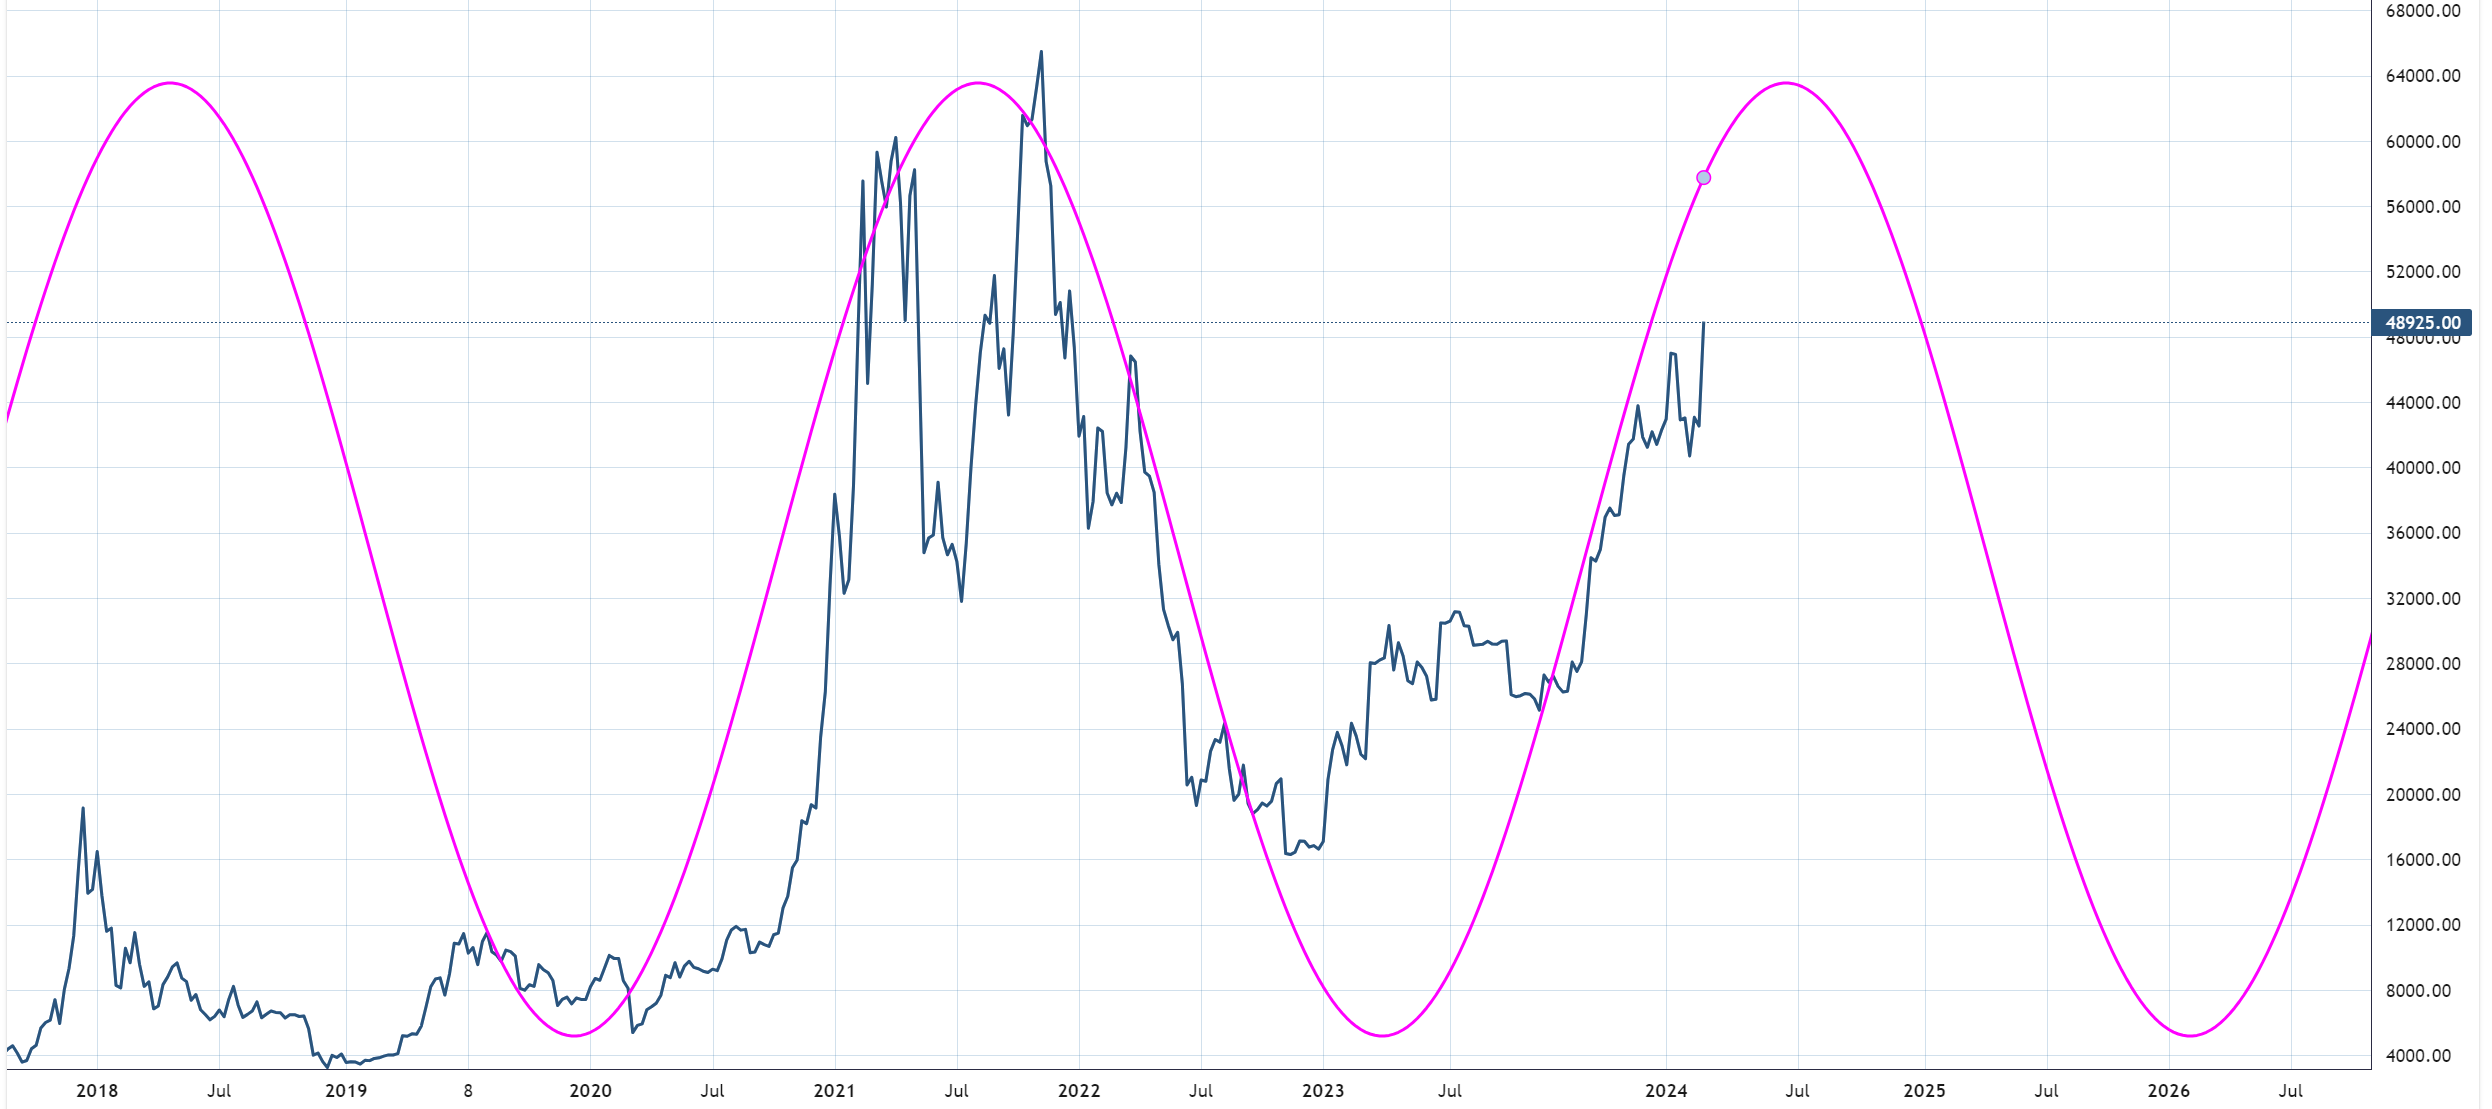
BTCUSD is at a 172-week active cycle and shows upward momentum to continue until roughly the summer of this year.
Breadth
Here are percentages of stocks above key moving averages in the SP500. It shows deterioration in the 20 and 50 but maintaining above key levels in the 150 and 200day.
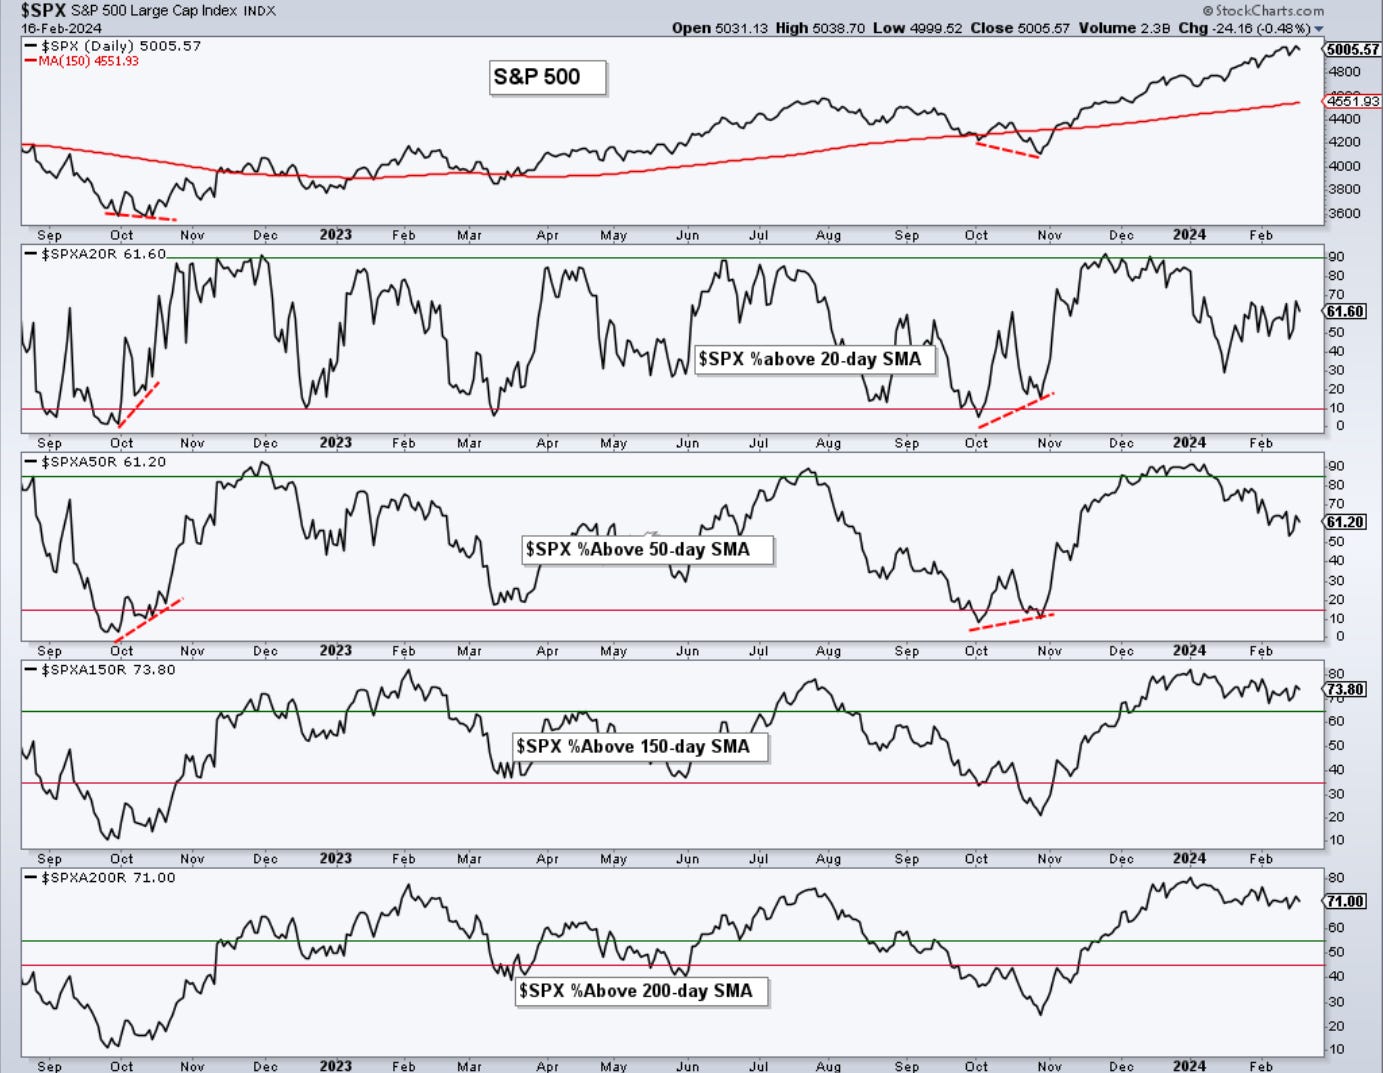
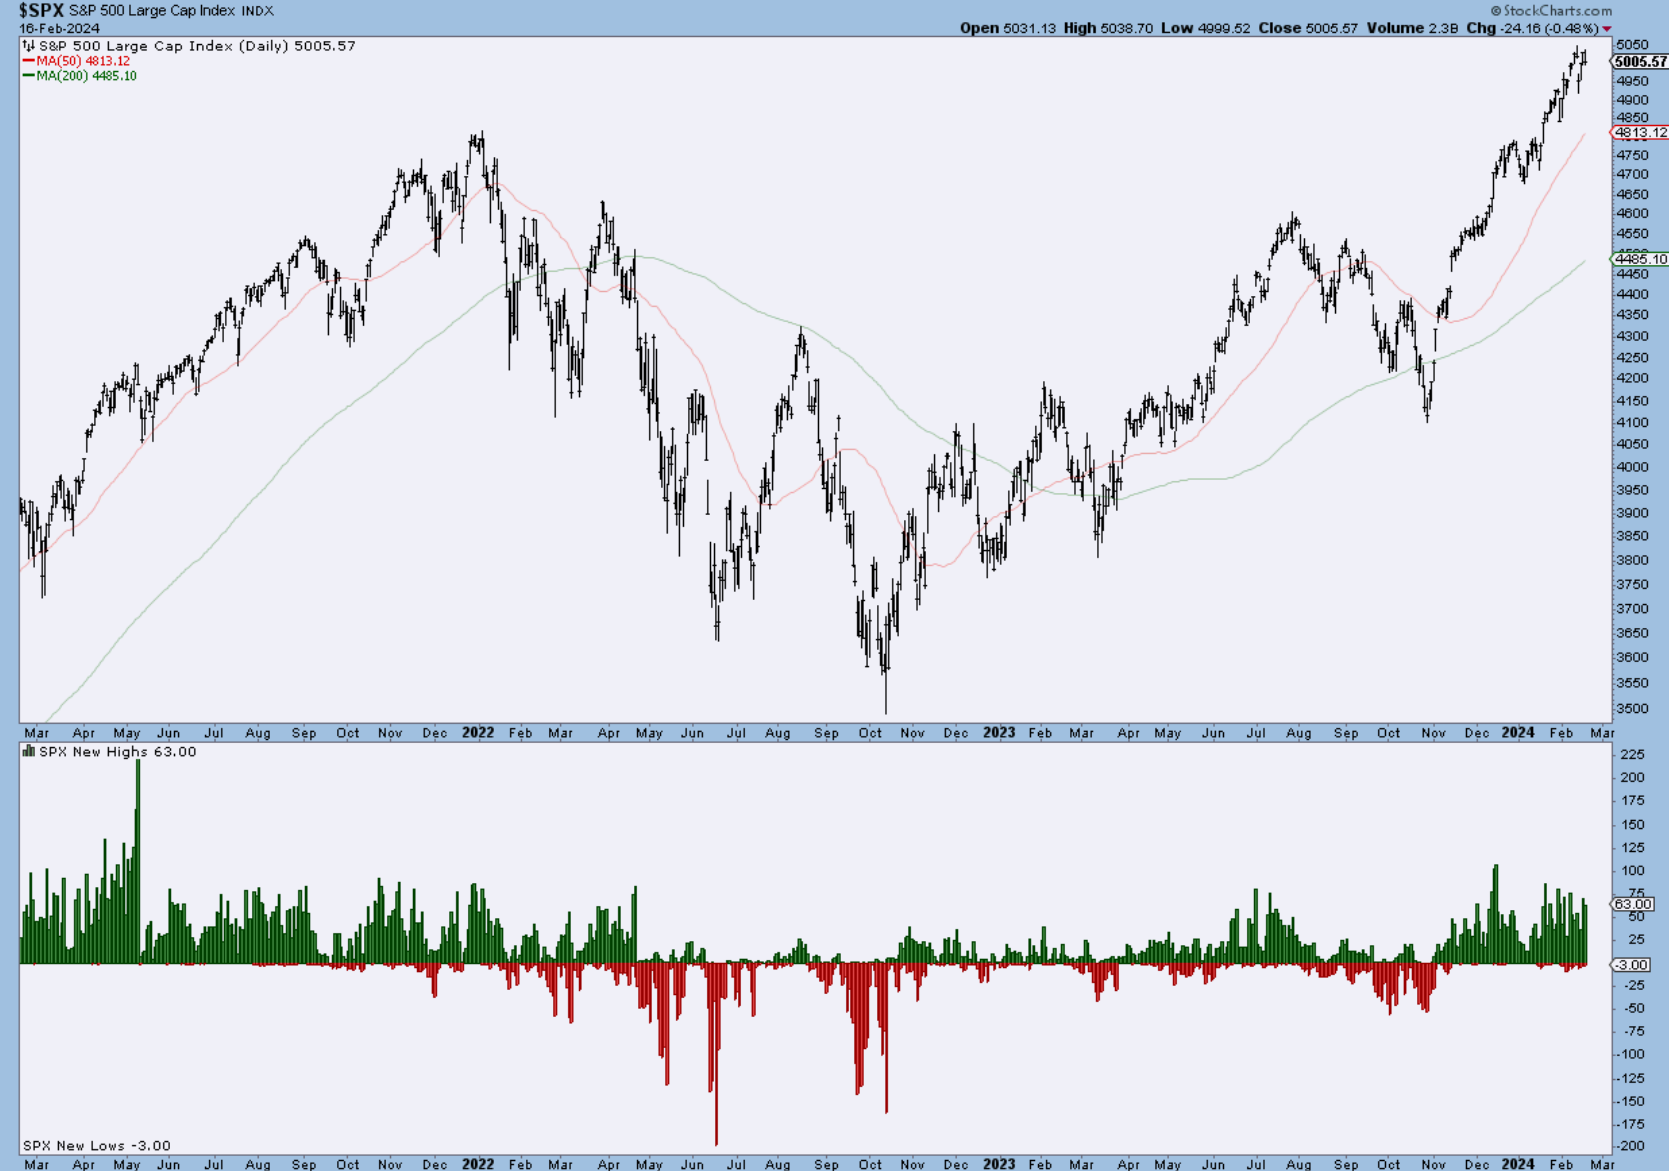
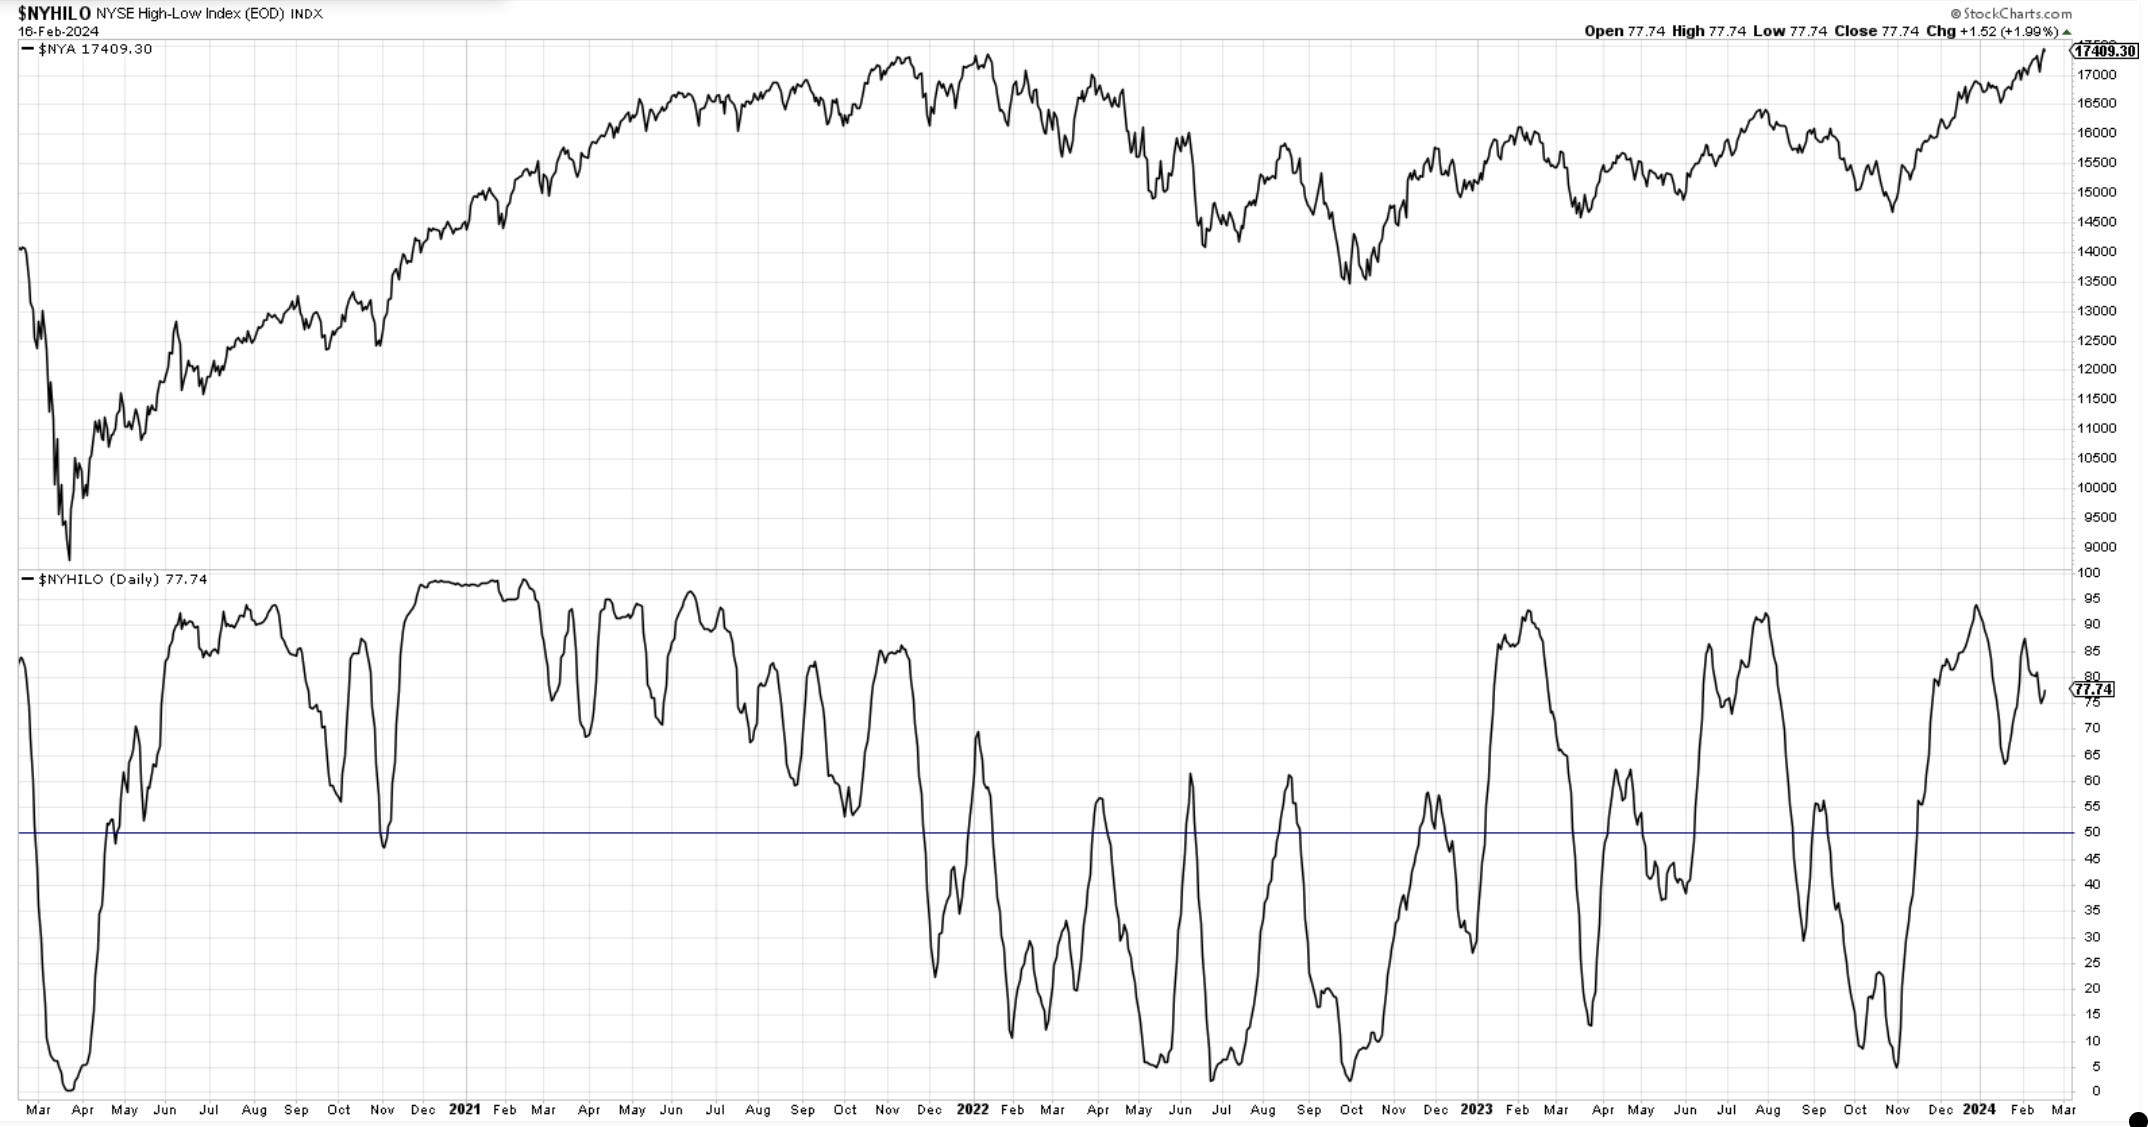
New highs vs new lows are well into green. It has peaked in Dec 2023 and slowly declined since then. Not necessarily alarming.
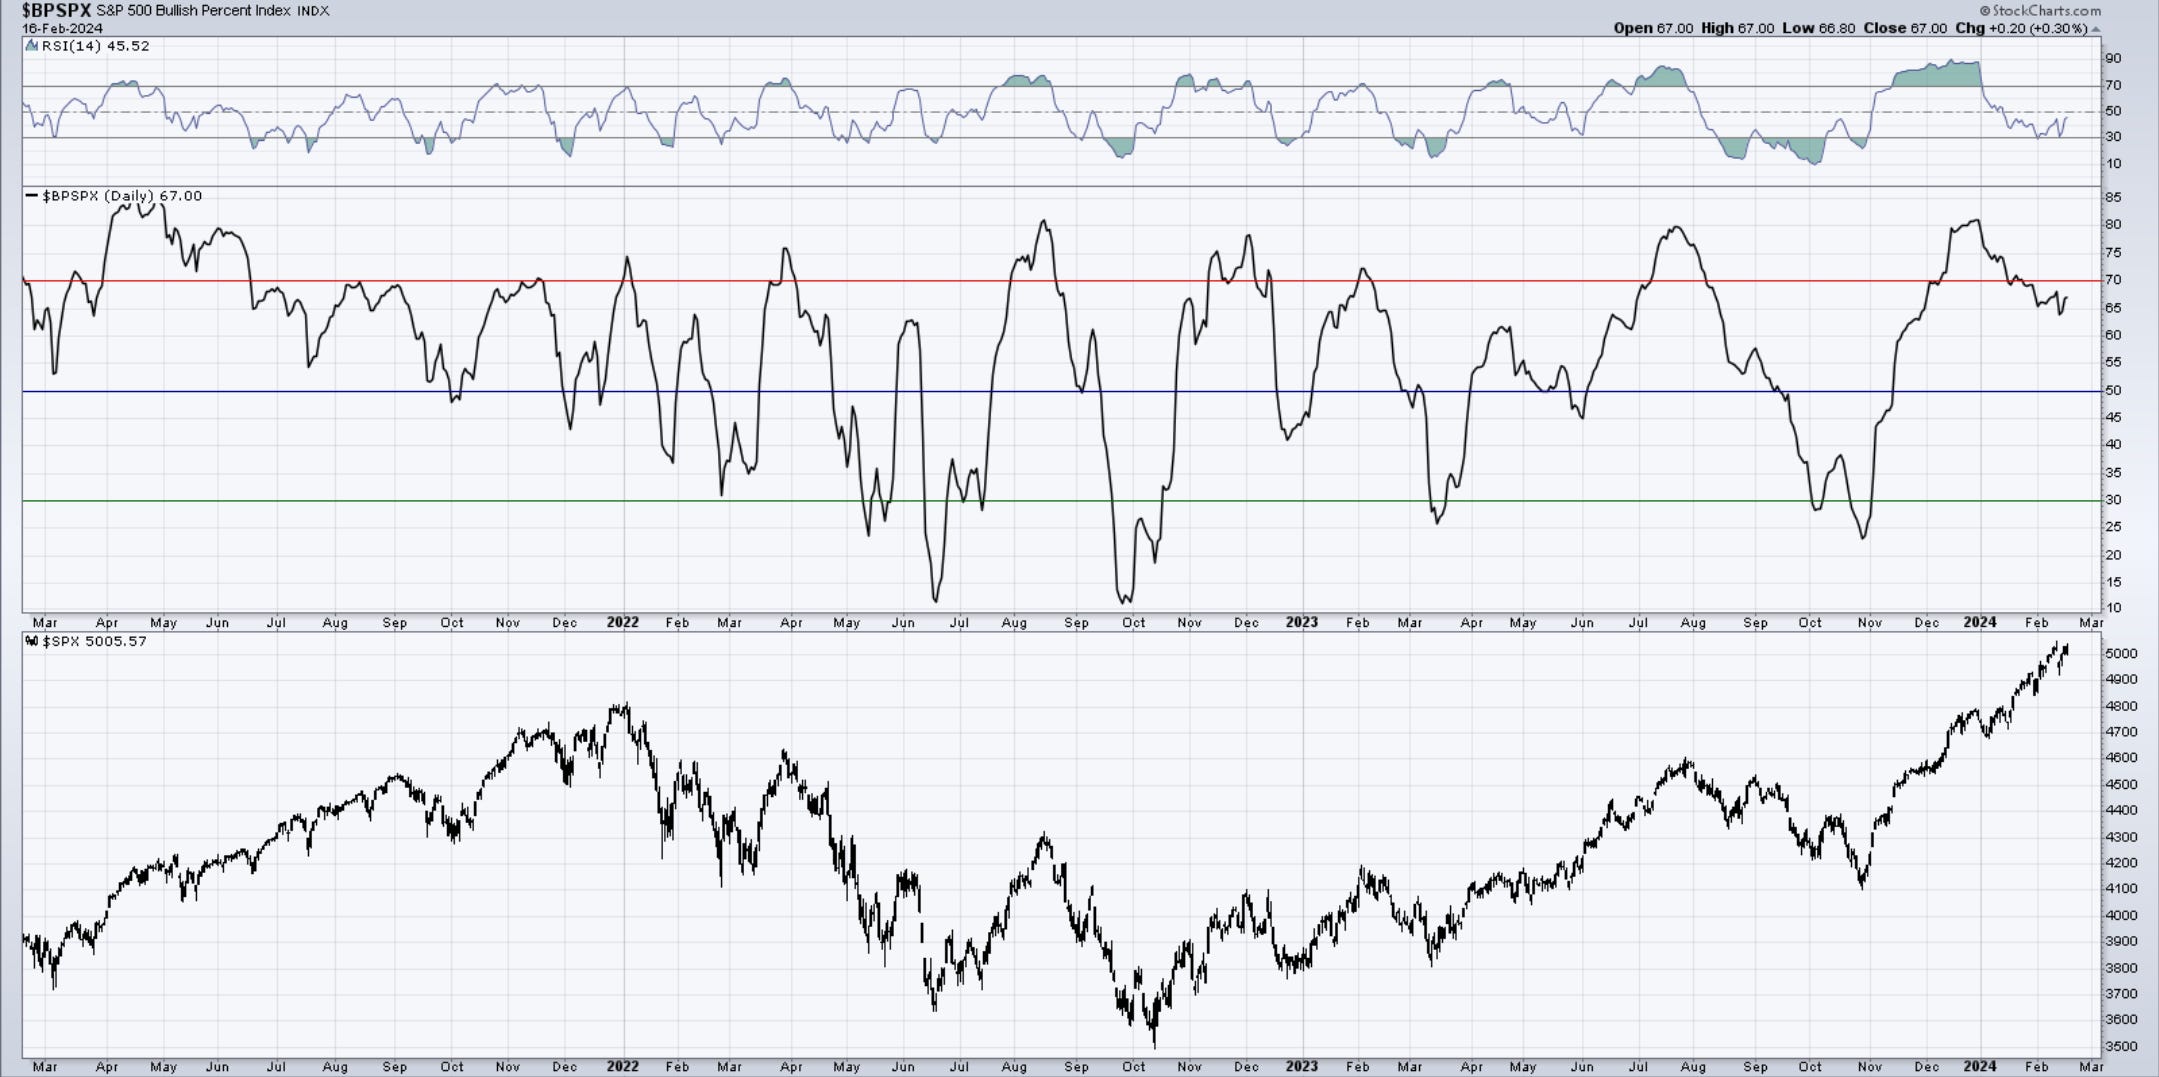
The Bullish Percent Index has been declining as well but continues to be bullish above the 50 mark.
The spread between new highs and new lows on the NYSE has been declining after topping in Dec 2023.
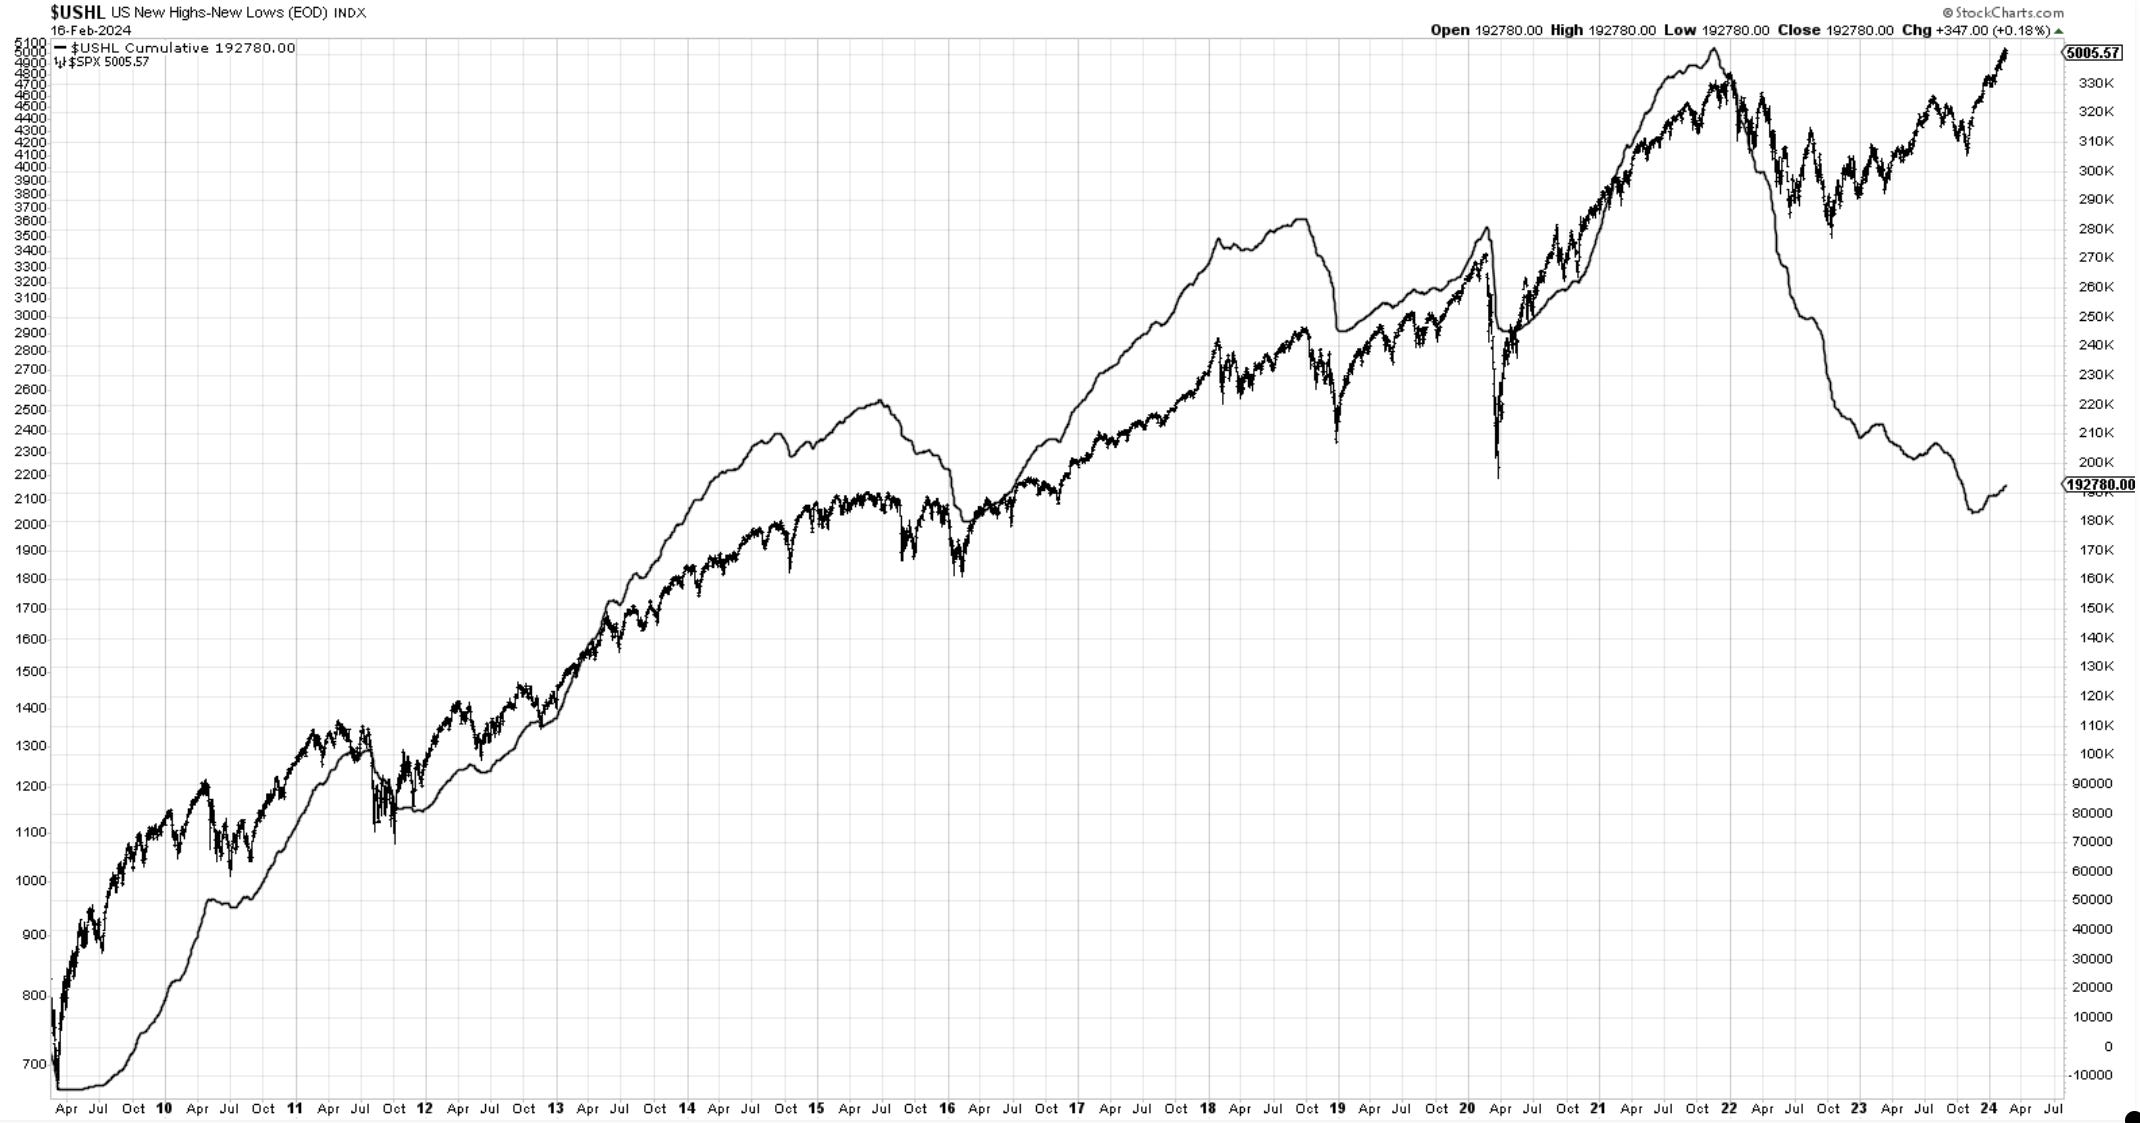
A very worrying sign is the cumulative chart of US new highs-new lows, showing a large discrepancy between how the SP500 behaves and the ability of the rest 2500 and more stocks to follow along. Notice how these lines have been pretty much sisters through time. Not the case since the Oct 2022 lows.
Seasonality
SP500. Here is the daily price action during the month of February. Notice it is heavily skewed towards a negative tape for the remainder of the month.
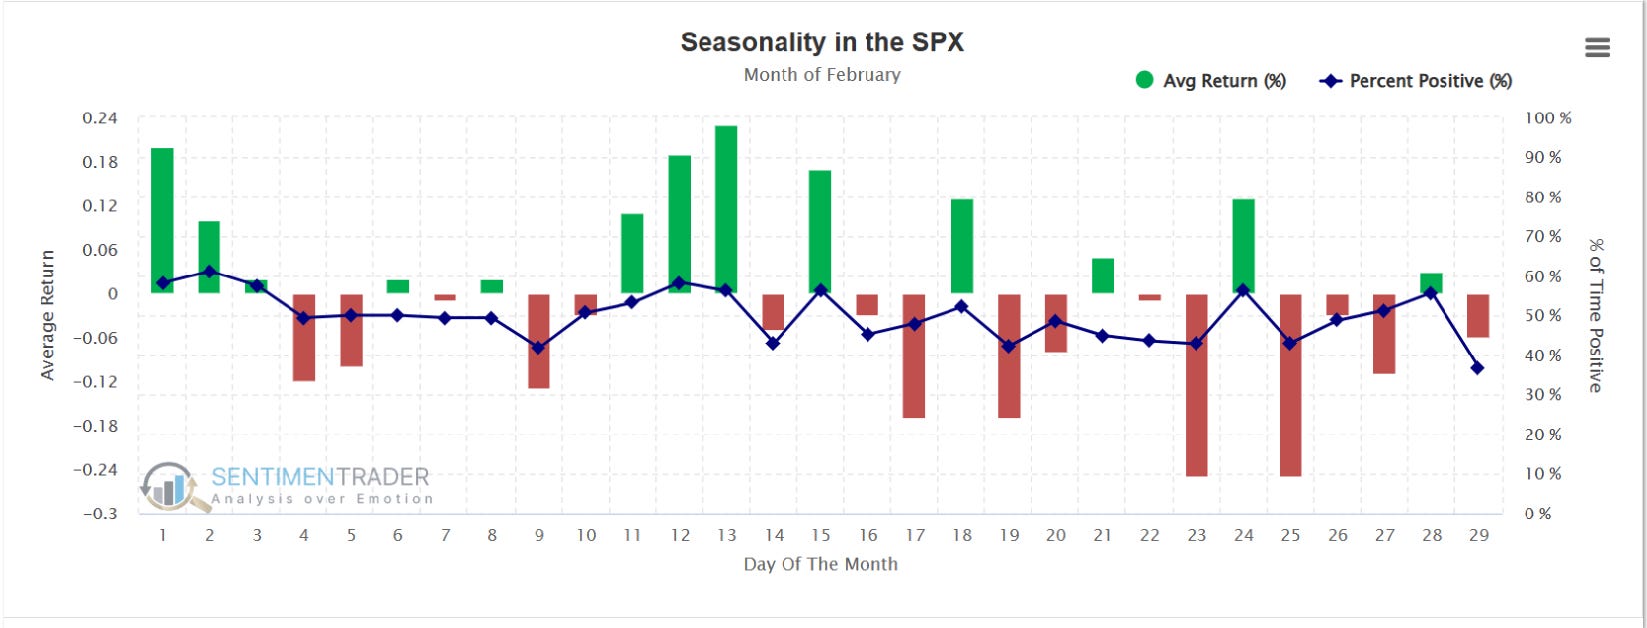
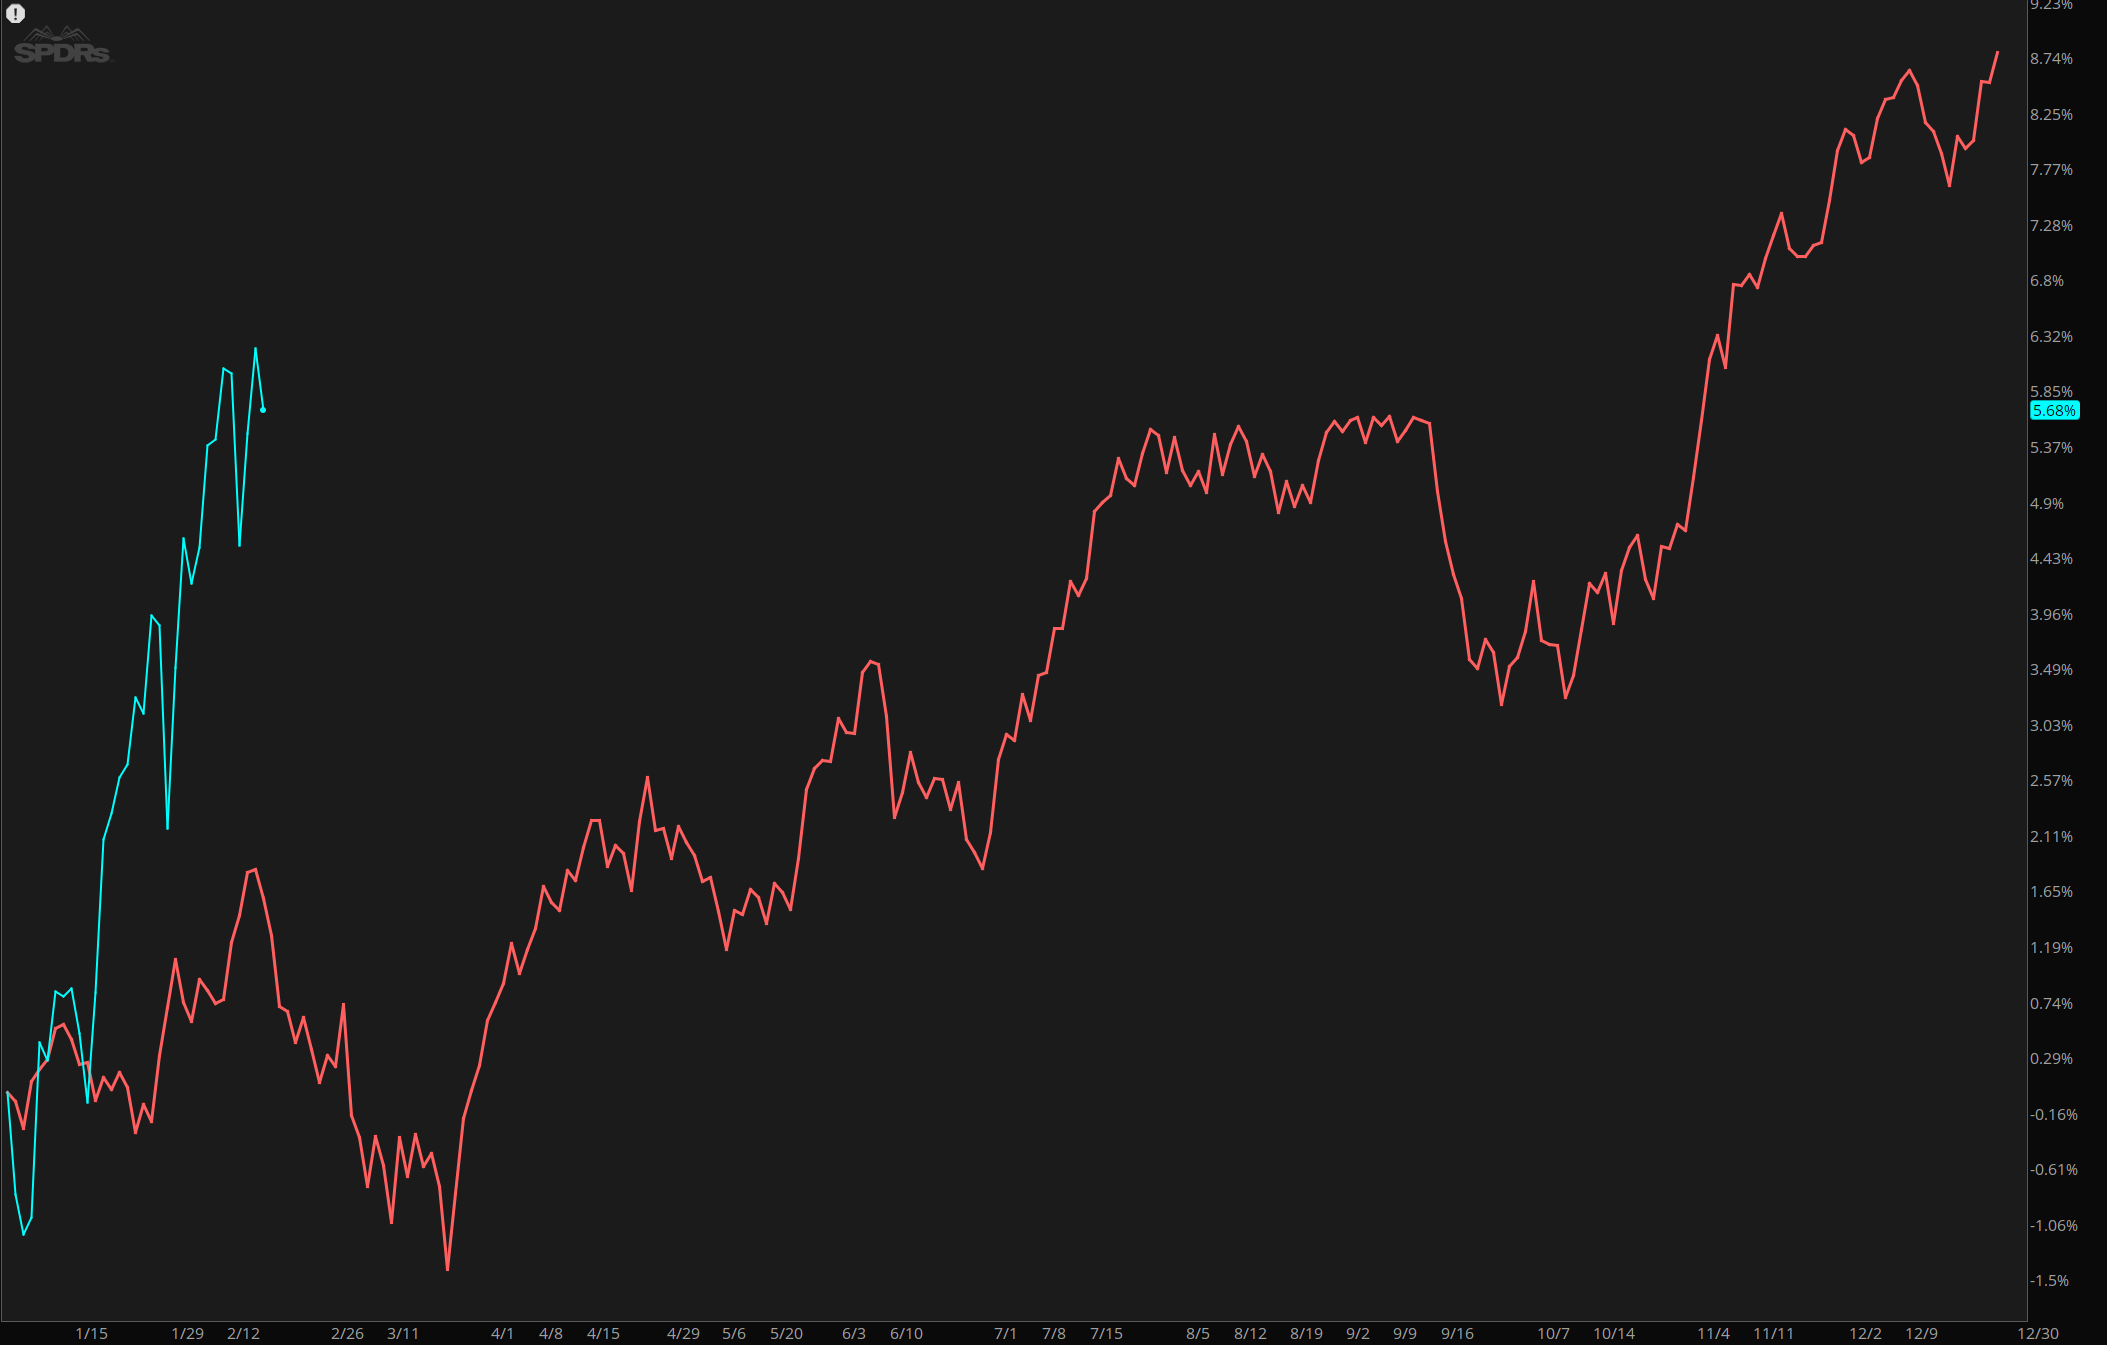
Here it is having the whole year outlook. We are now entering a weak period until March 20th.
Price
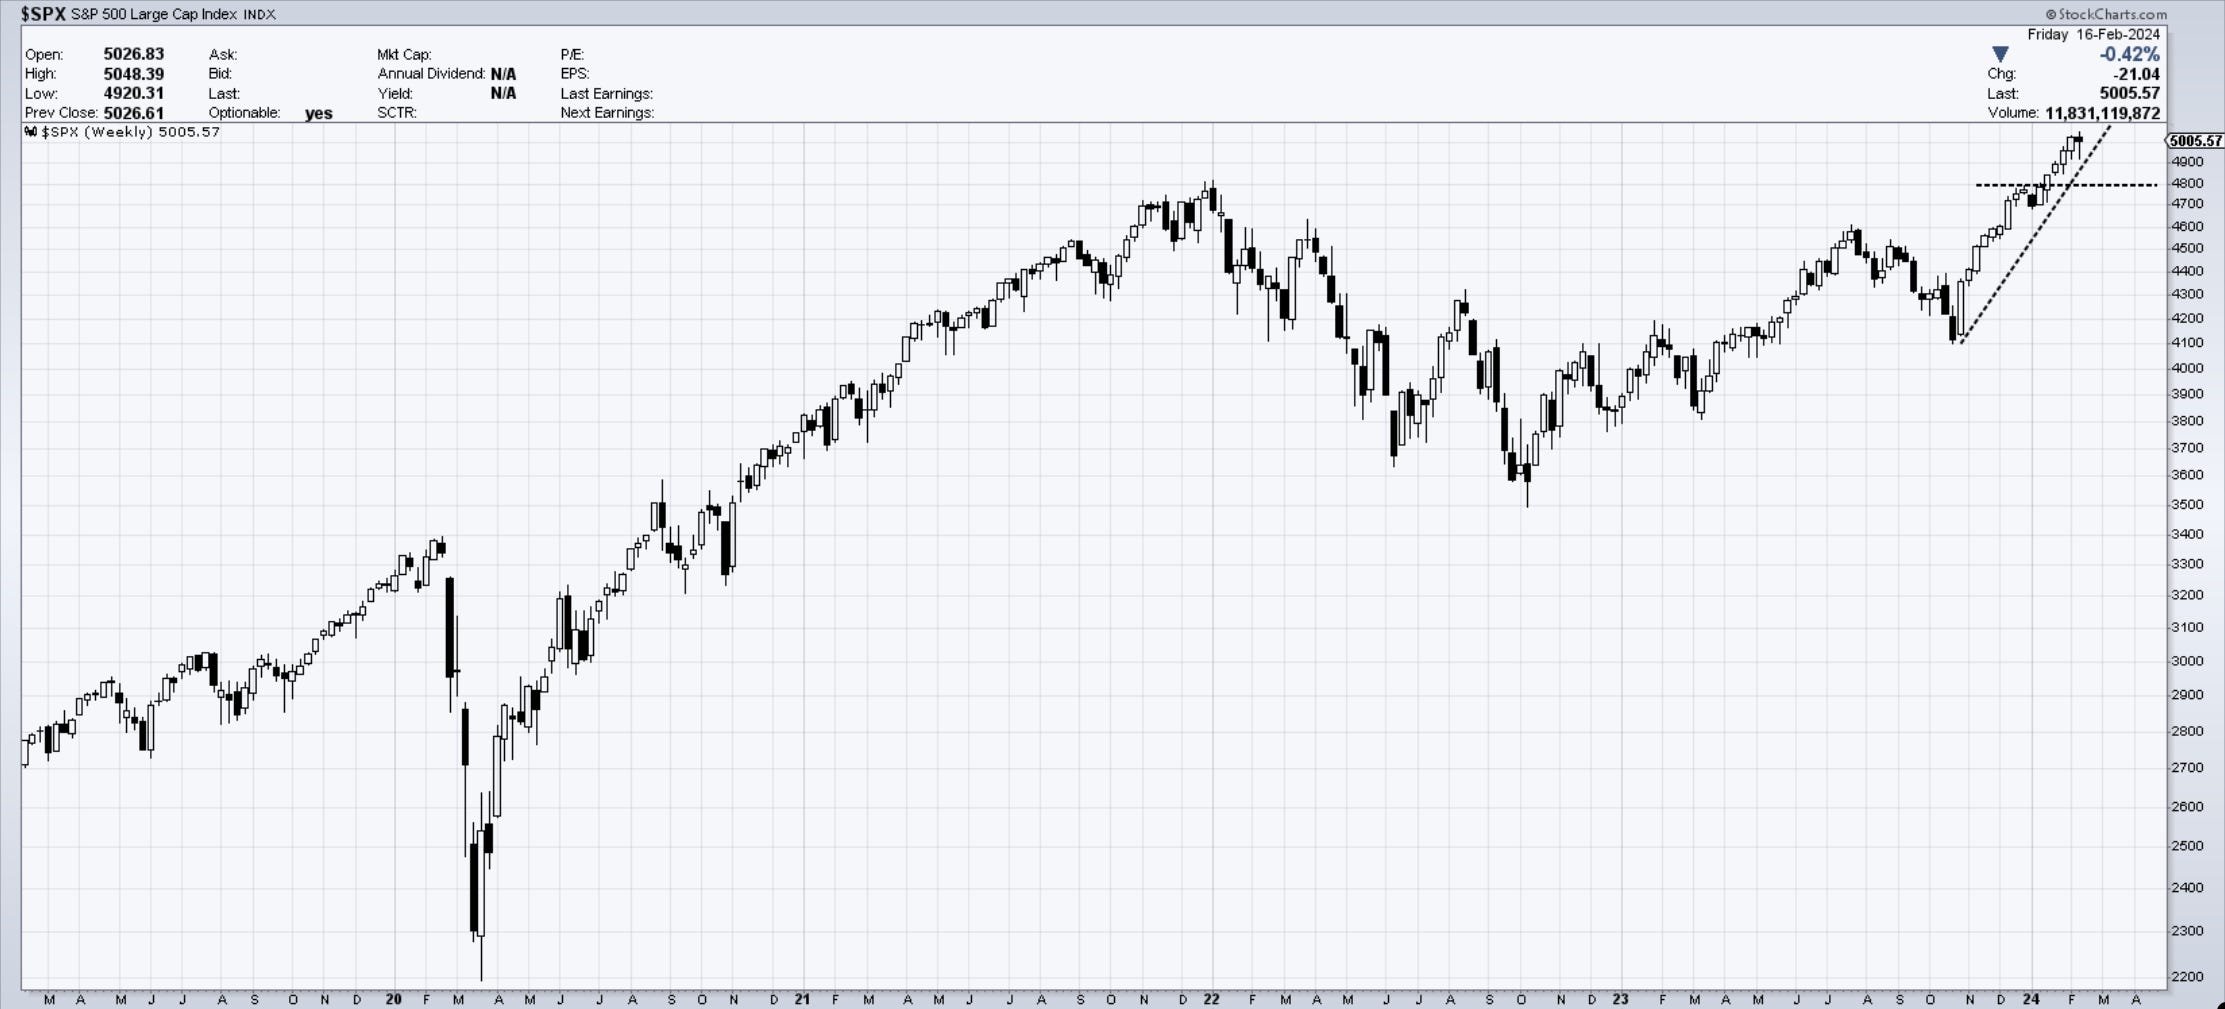
SP500 keeps the uptrend intact with no violation of the trendline or prior resistance zone. There were 5 weeks of higher consecutive closes; this week made a new high but not a new closing high. It is a flashing yellow sign but that’s all for right now.
Nasdaq100 was a bit weaker, with larger tech underperforming the overall market. No trendline breaks as of yet, but it’s worth noting that selling pressure has put a dent in the uptrend. 17k is the key level if there is further meltdown during upcoming weeks.

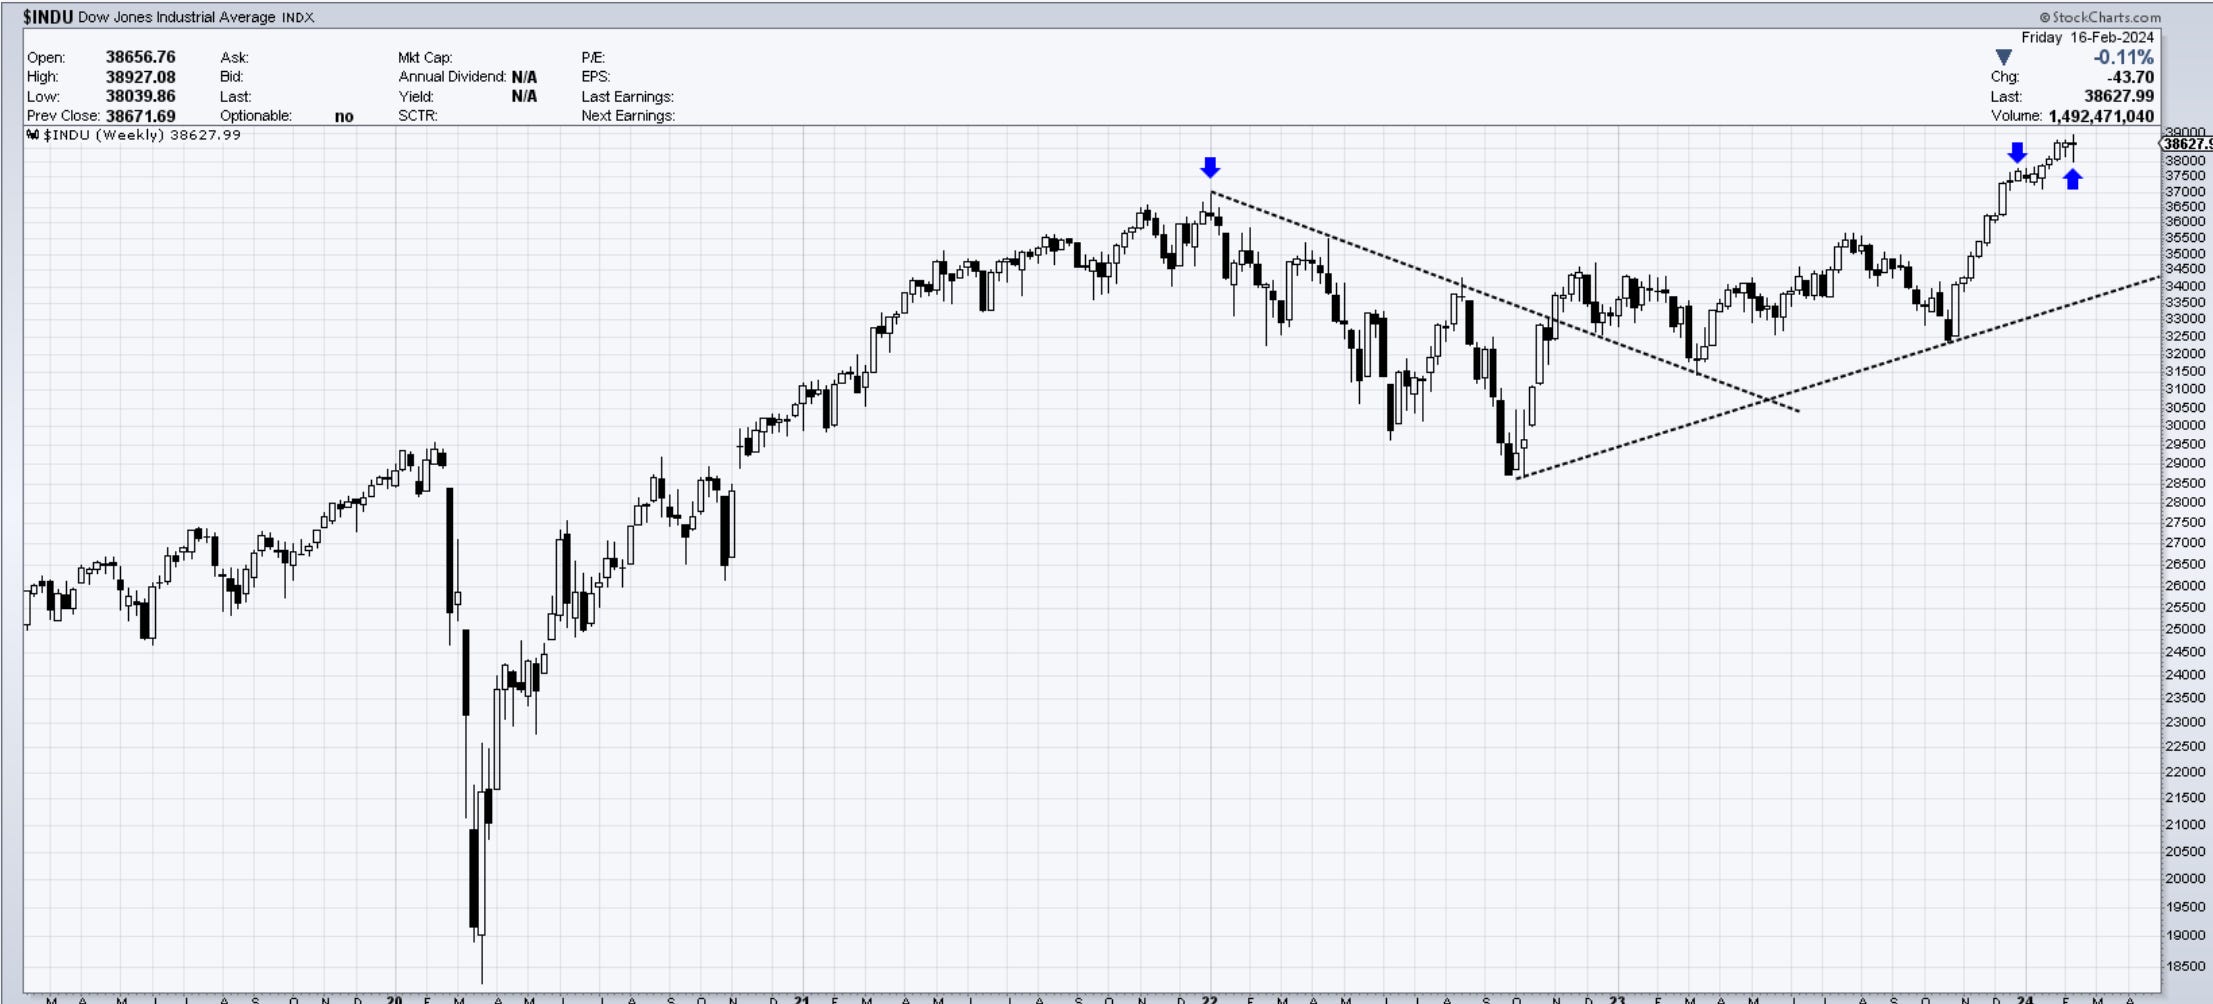
Dow Jones spent two weeks near the highs without follow thru, but has yet to break any meaningful levels lower. 38000 is key .
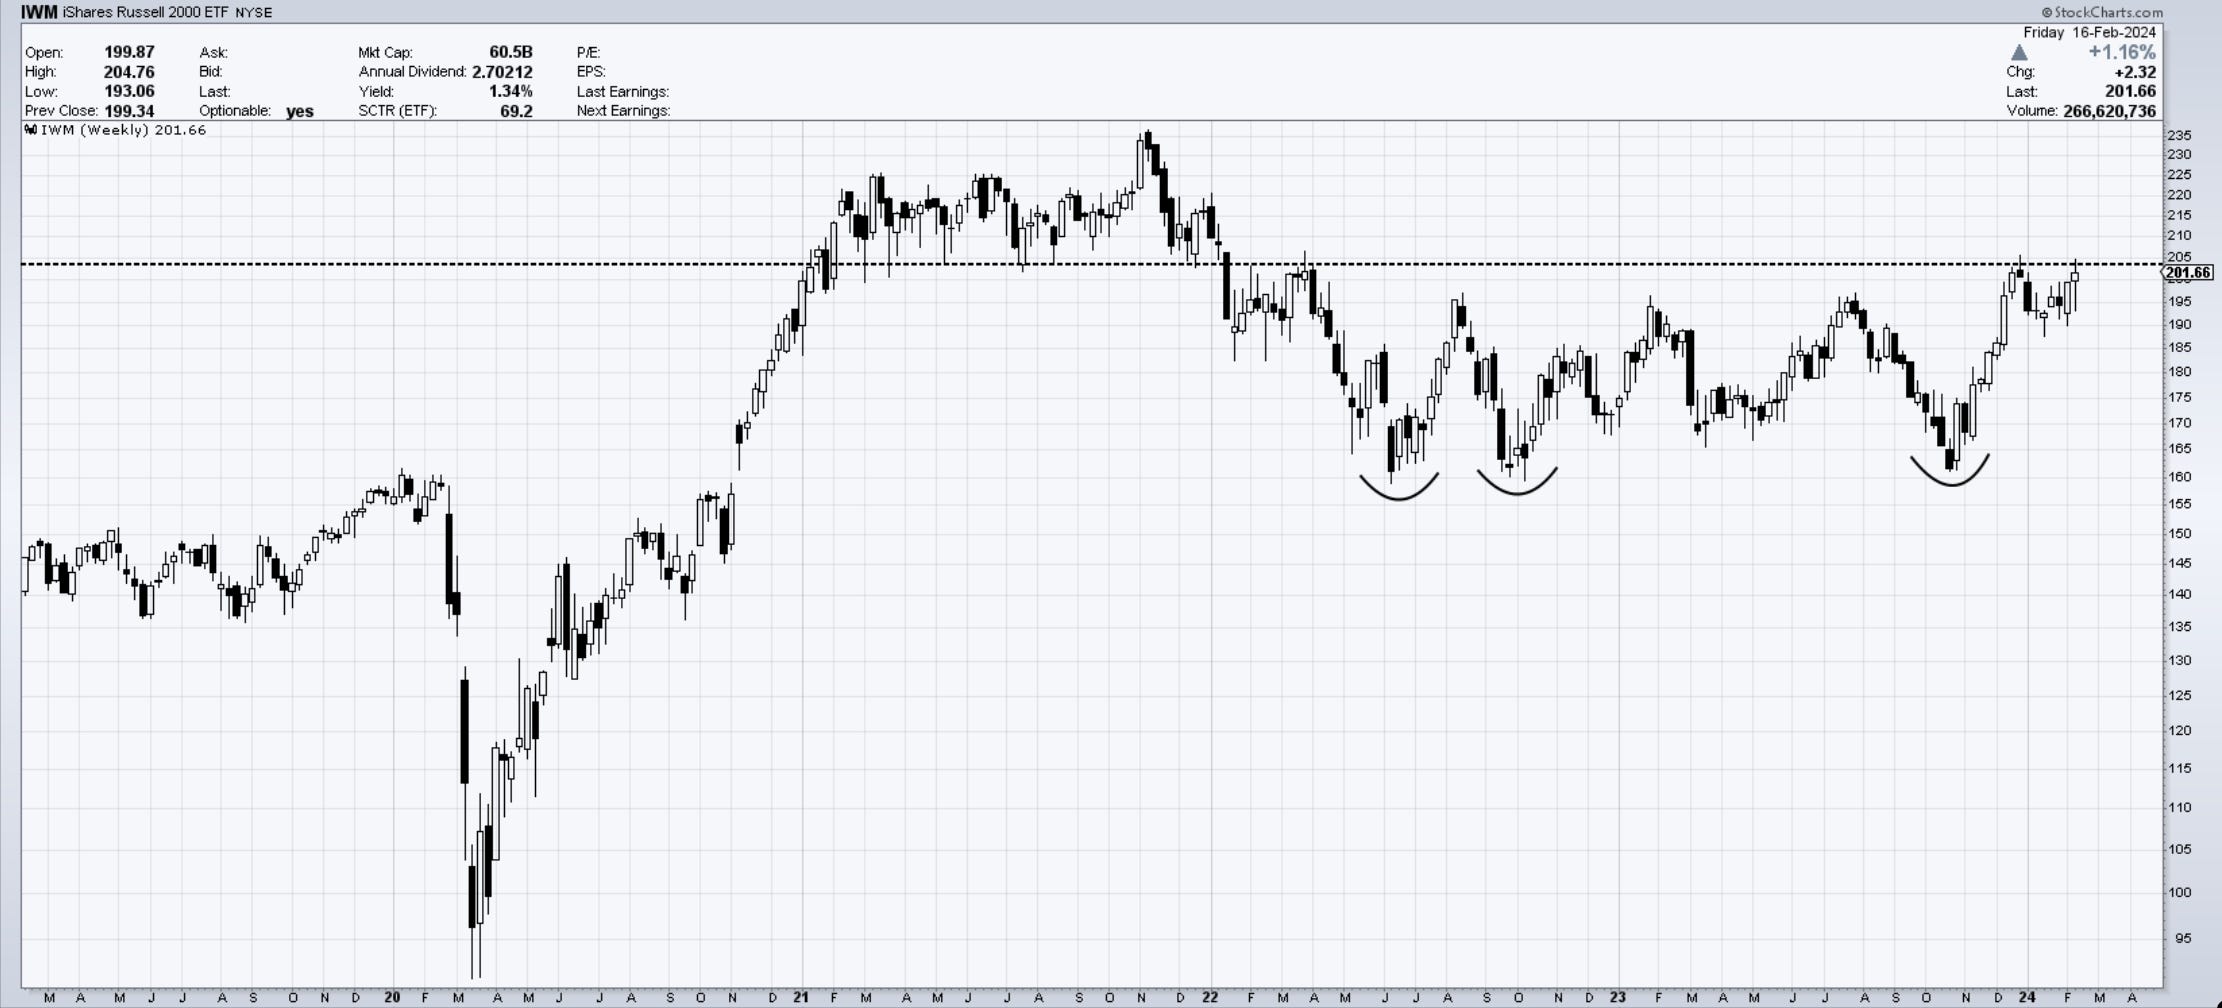
IWM - small caps fighting upside resistance zones for several weeks. Still a bit dangerous to make bullish assumptions under that line.
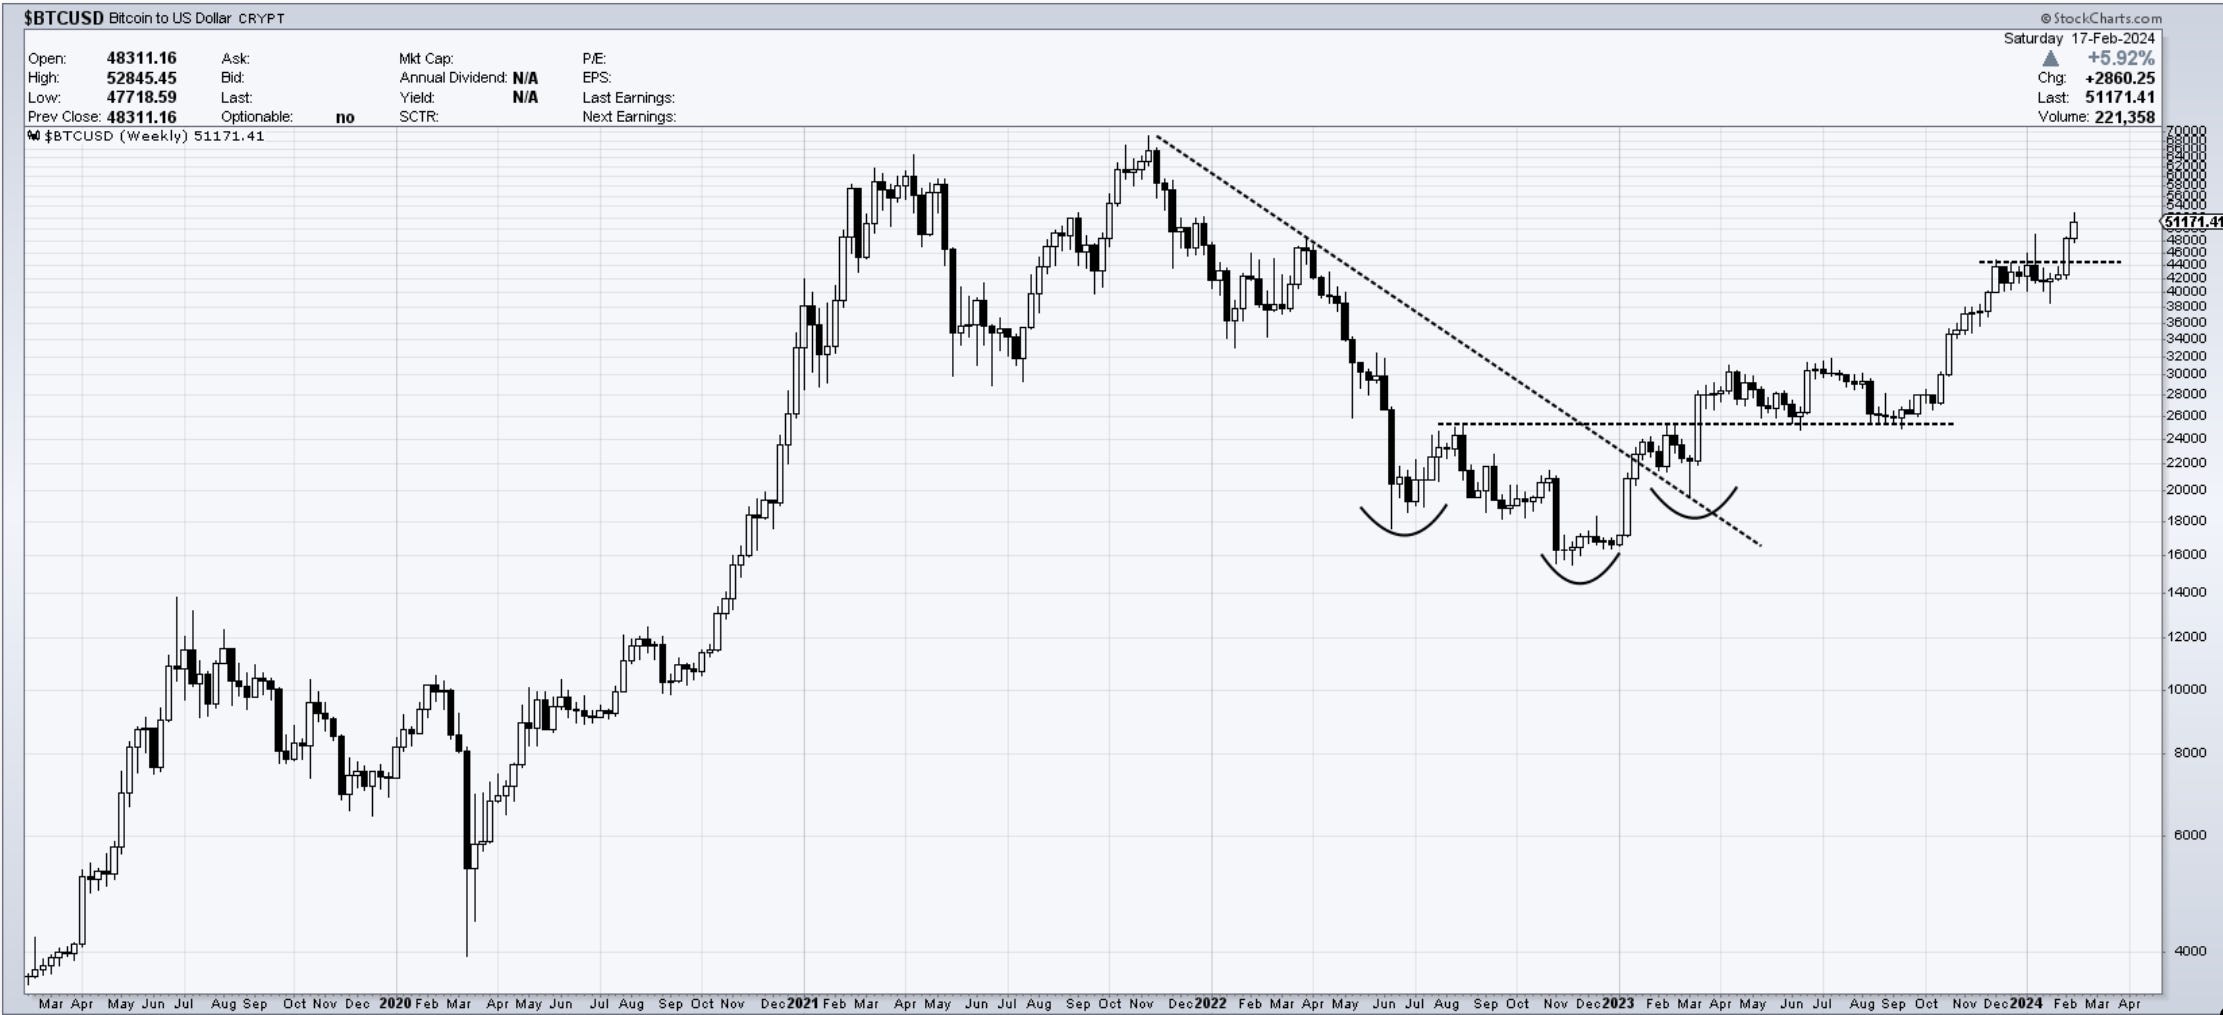
Bitcoin - broke 44k zone and accelerated higher. That level should be well supported on pullbacks. No reasons to be negative here on weekly, other then few possible hickups on daily charts from EW perspective ( see The Daily Drip updates). The chart development likely points to a test of the all time highs near 70k.
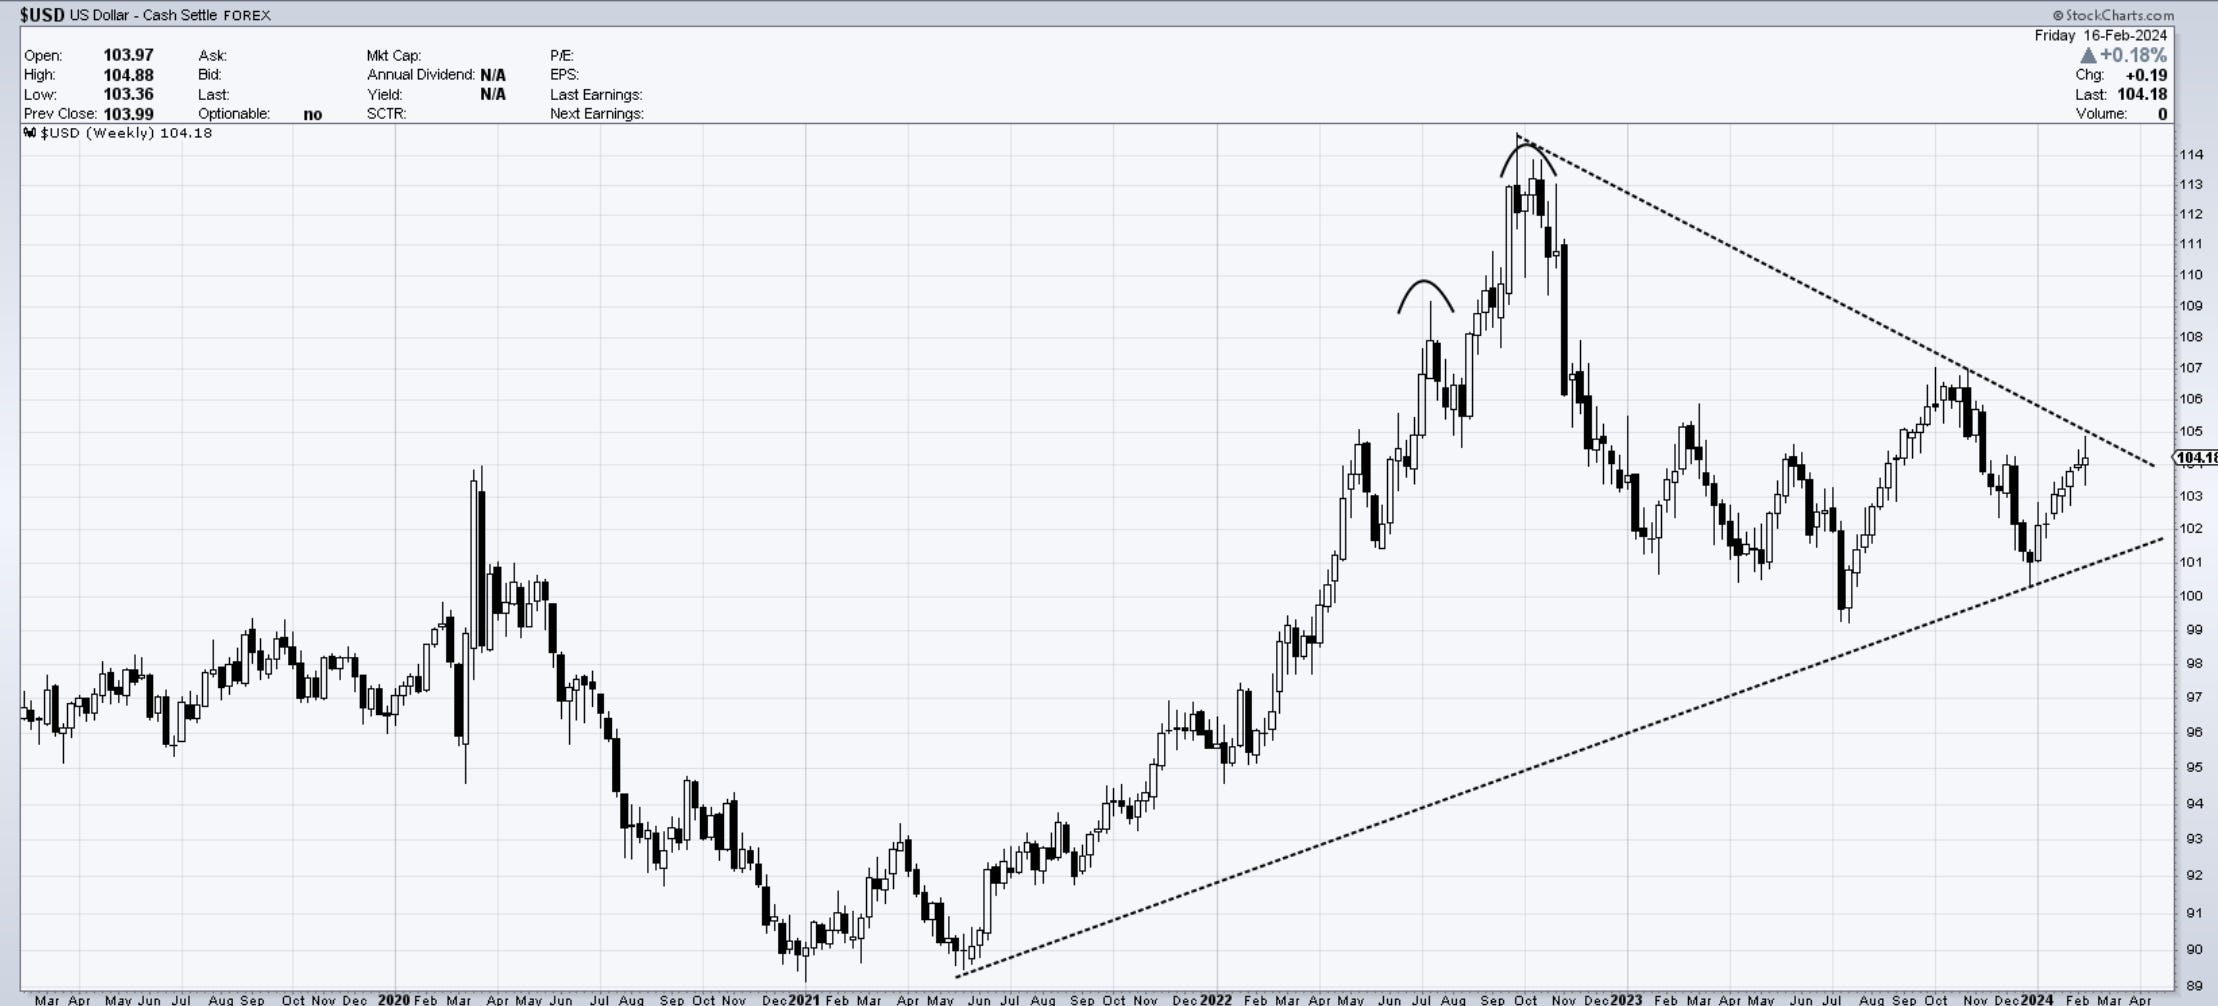
The US Dollar has found equilibrium around 103 , after a wild run in 2021, 2022. There has been strength over the past 8 weeks with no real signs of abating. Here on weekly charts is hard to pick a direction until we see key levels being challenged. I will be watching yields, fed rates and economic data to gauge this sentiment further. Sinc the year started, the dollar has not been confirming the “risk on” sentiment across markets.
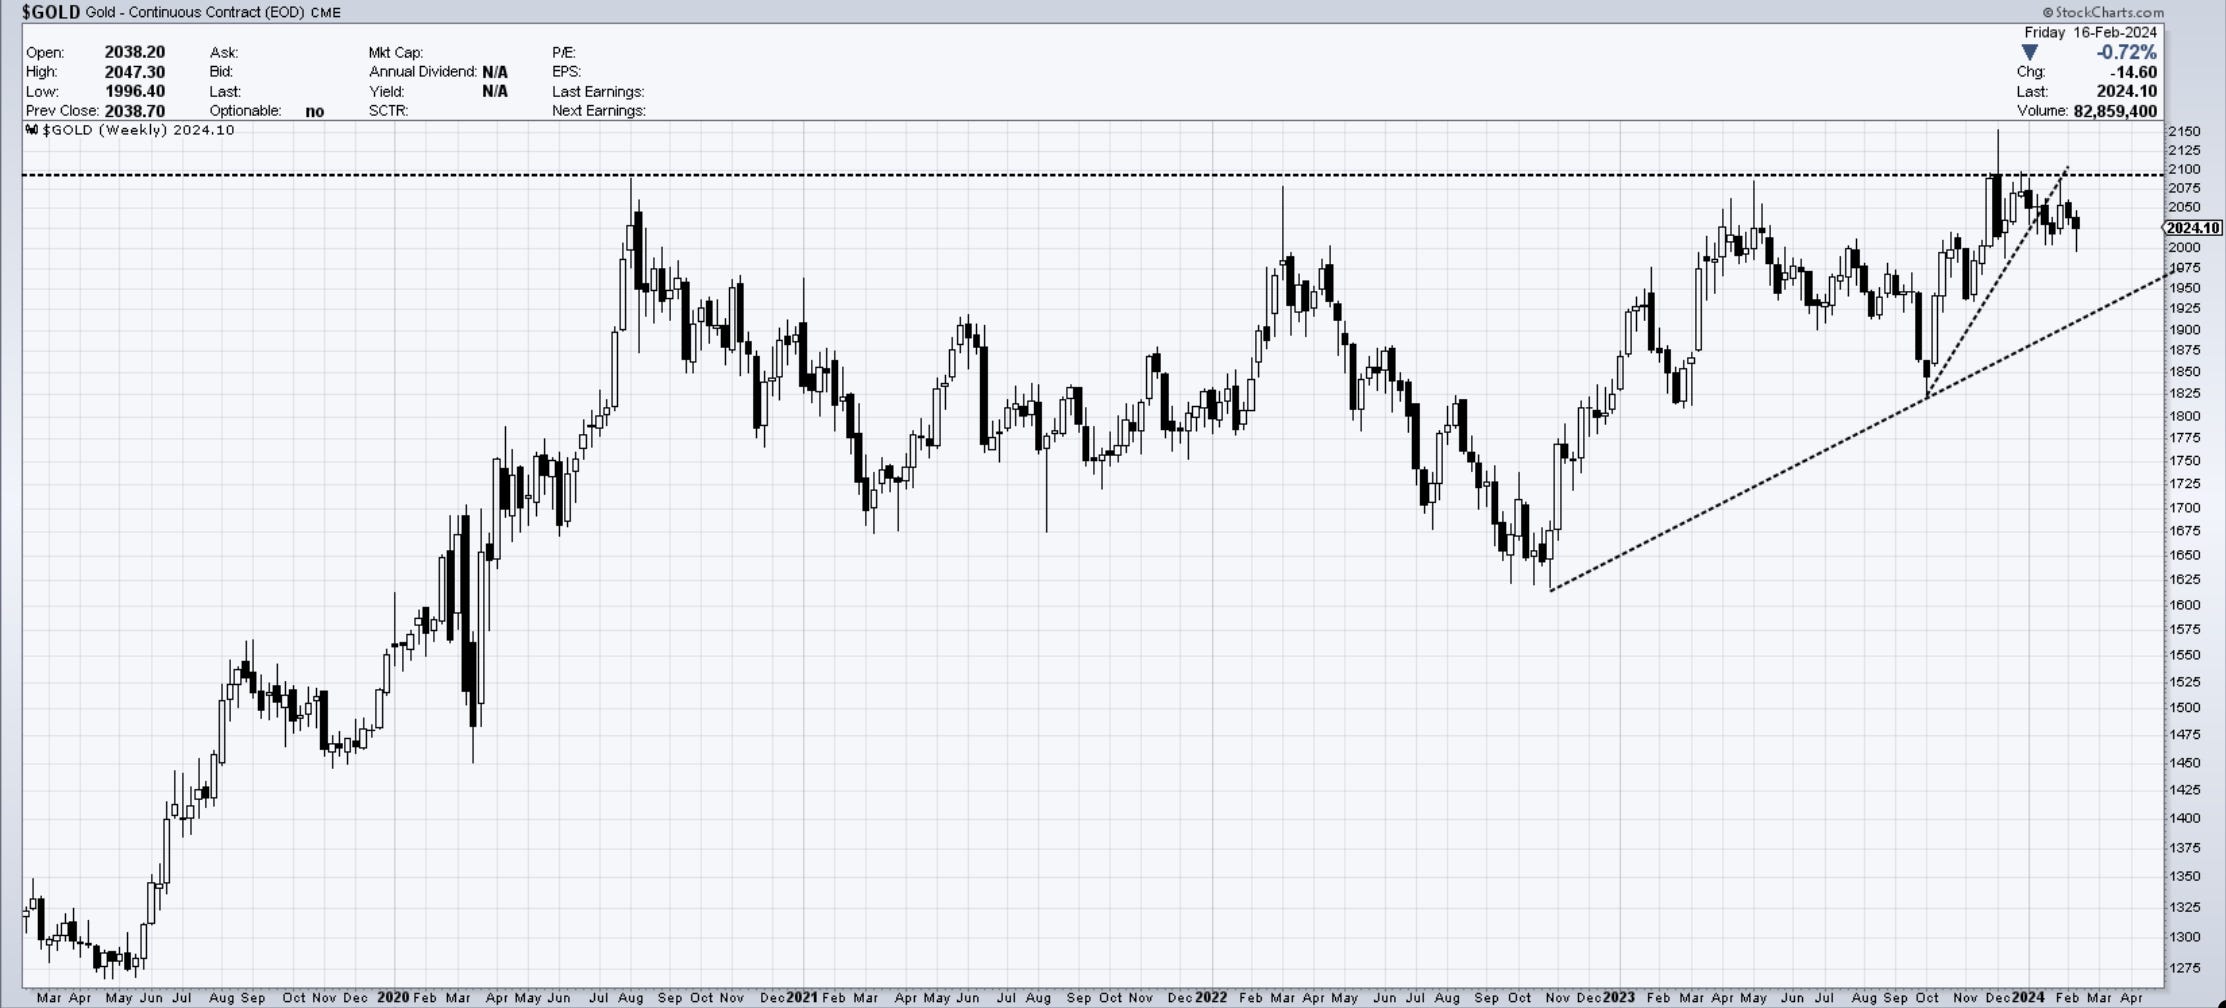
Gold has a massive resistance at 2100 that has now failed 4 time in major upswing. It has cracked the smaller upsloping trendline but has support at 2k. I don’t have great visibility here, so for me it is a “watch only” market. A break of 1950 over the next several weeks can unleash more dumping as the top failure will become even more important. On the other hand, a break of 2100 will require us to get long right away.
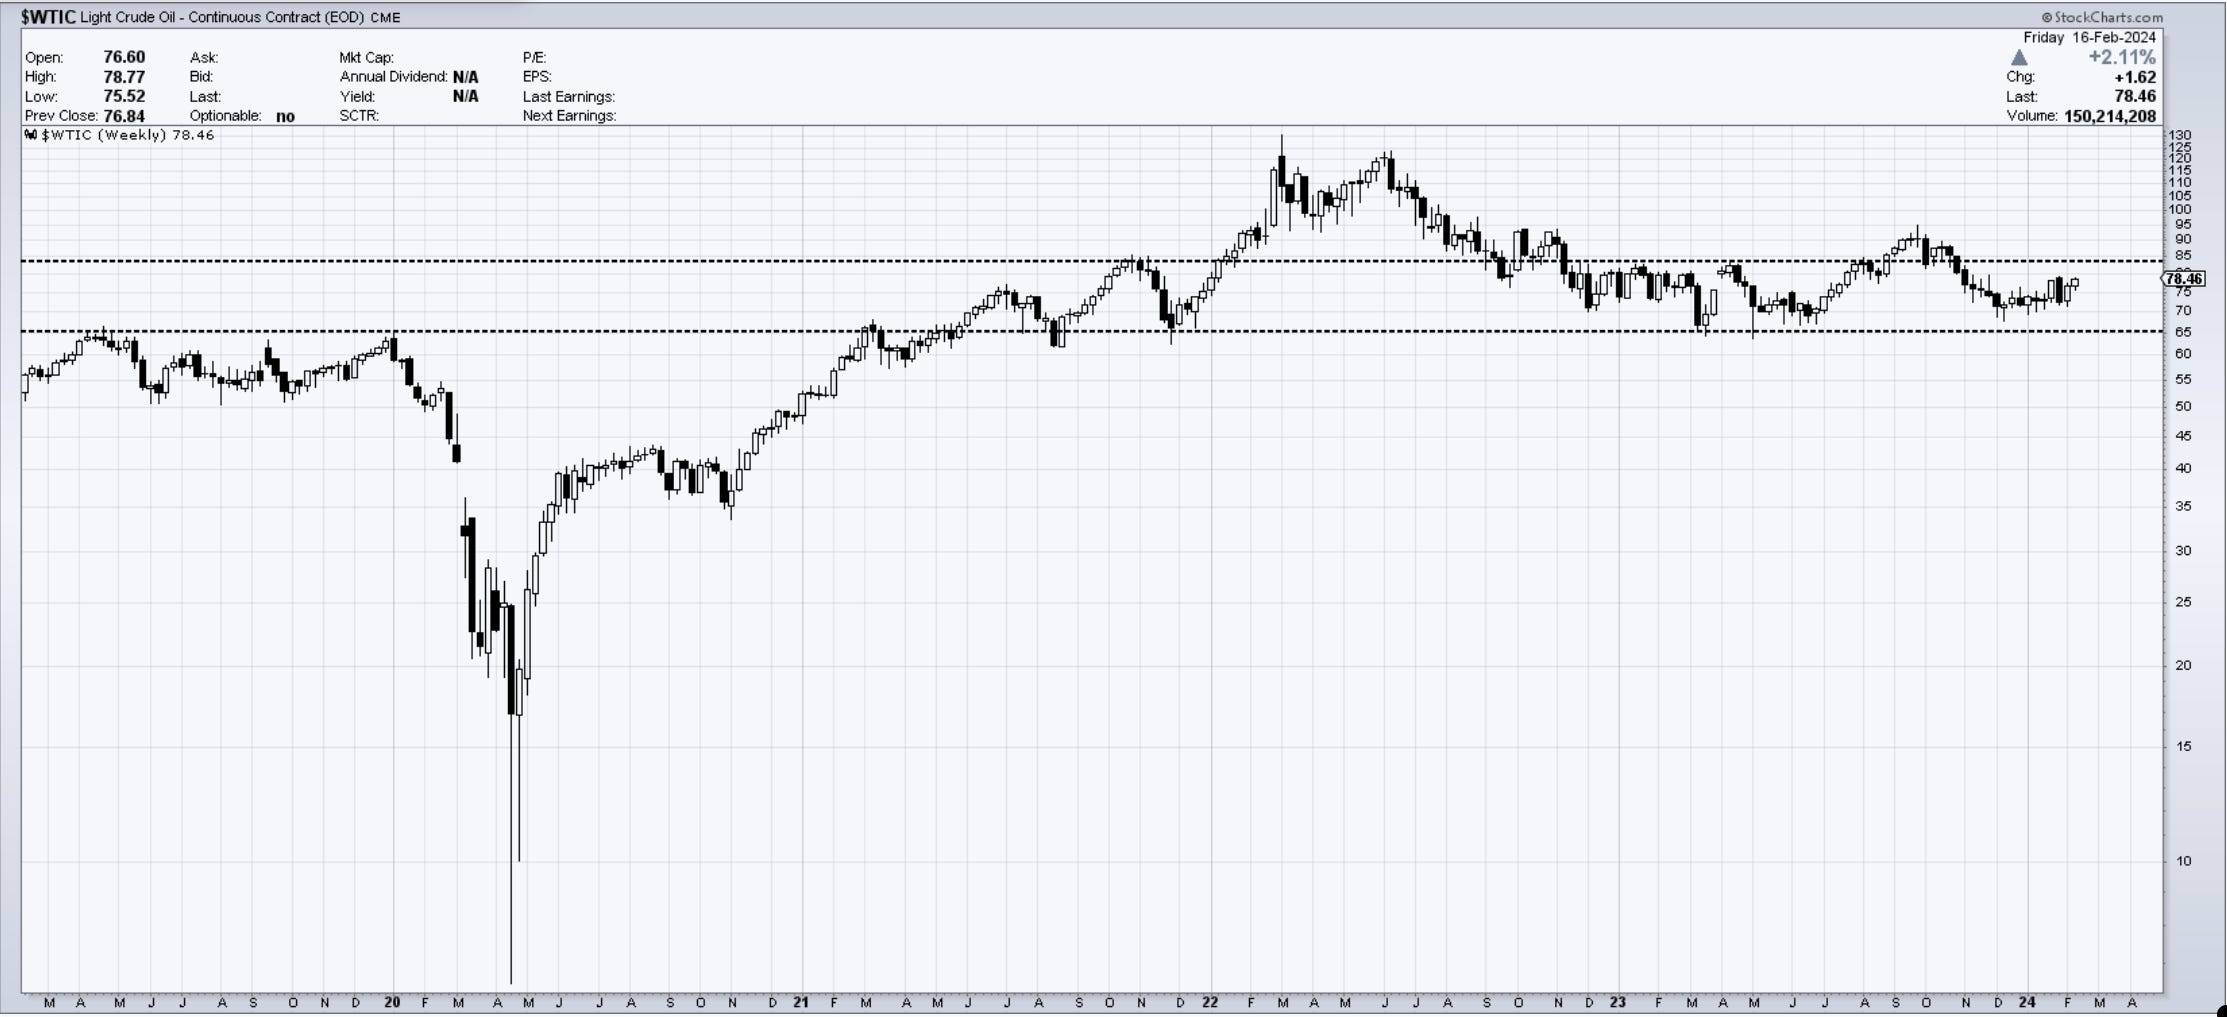
OIL market remains in a range with a failure so far of breaking 65-70. The upside test is 85 and if that goes, 95 is the next target. I am neutral here as well.
Thank you all for reading, I will see you next week. Leave a comment or suggestion below. Join our chat to discuss markets with fellow traders.
In the meantime please consider subscribing to EWCafe and read “The Daily Drip” where I provide daily market updates and commentary on core markets.
Cris,
EWCafe