
The Daily Drip - free edition
Markets review, strategy and analysis
Note: The EW counts on the right edge are real-time, and they are prone to adjustments as price action develops. Elliott Wave has a fluid approach, is evidence-based, and requires constant monitoring of certain thresholds.
In the counts below, this (( )) = circle on chart
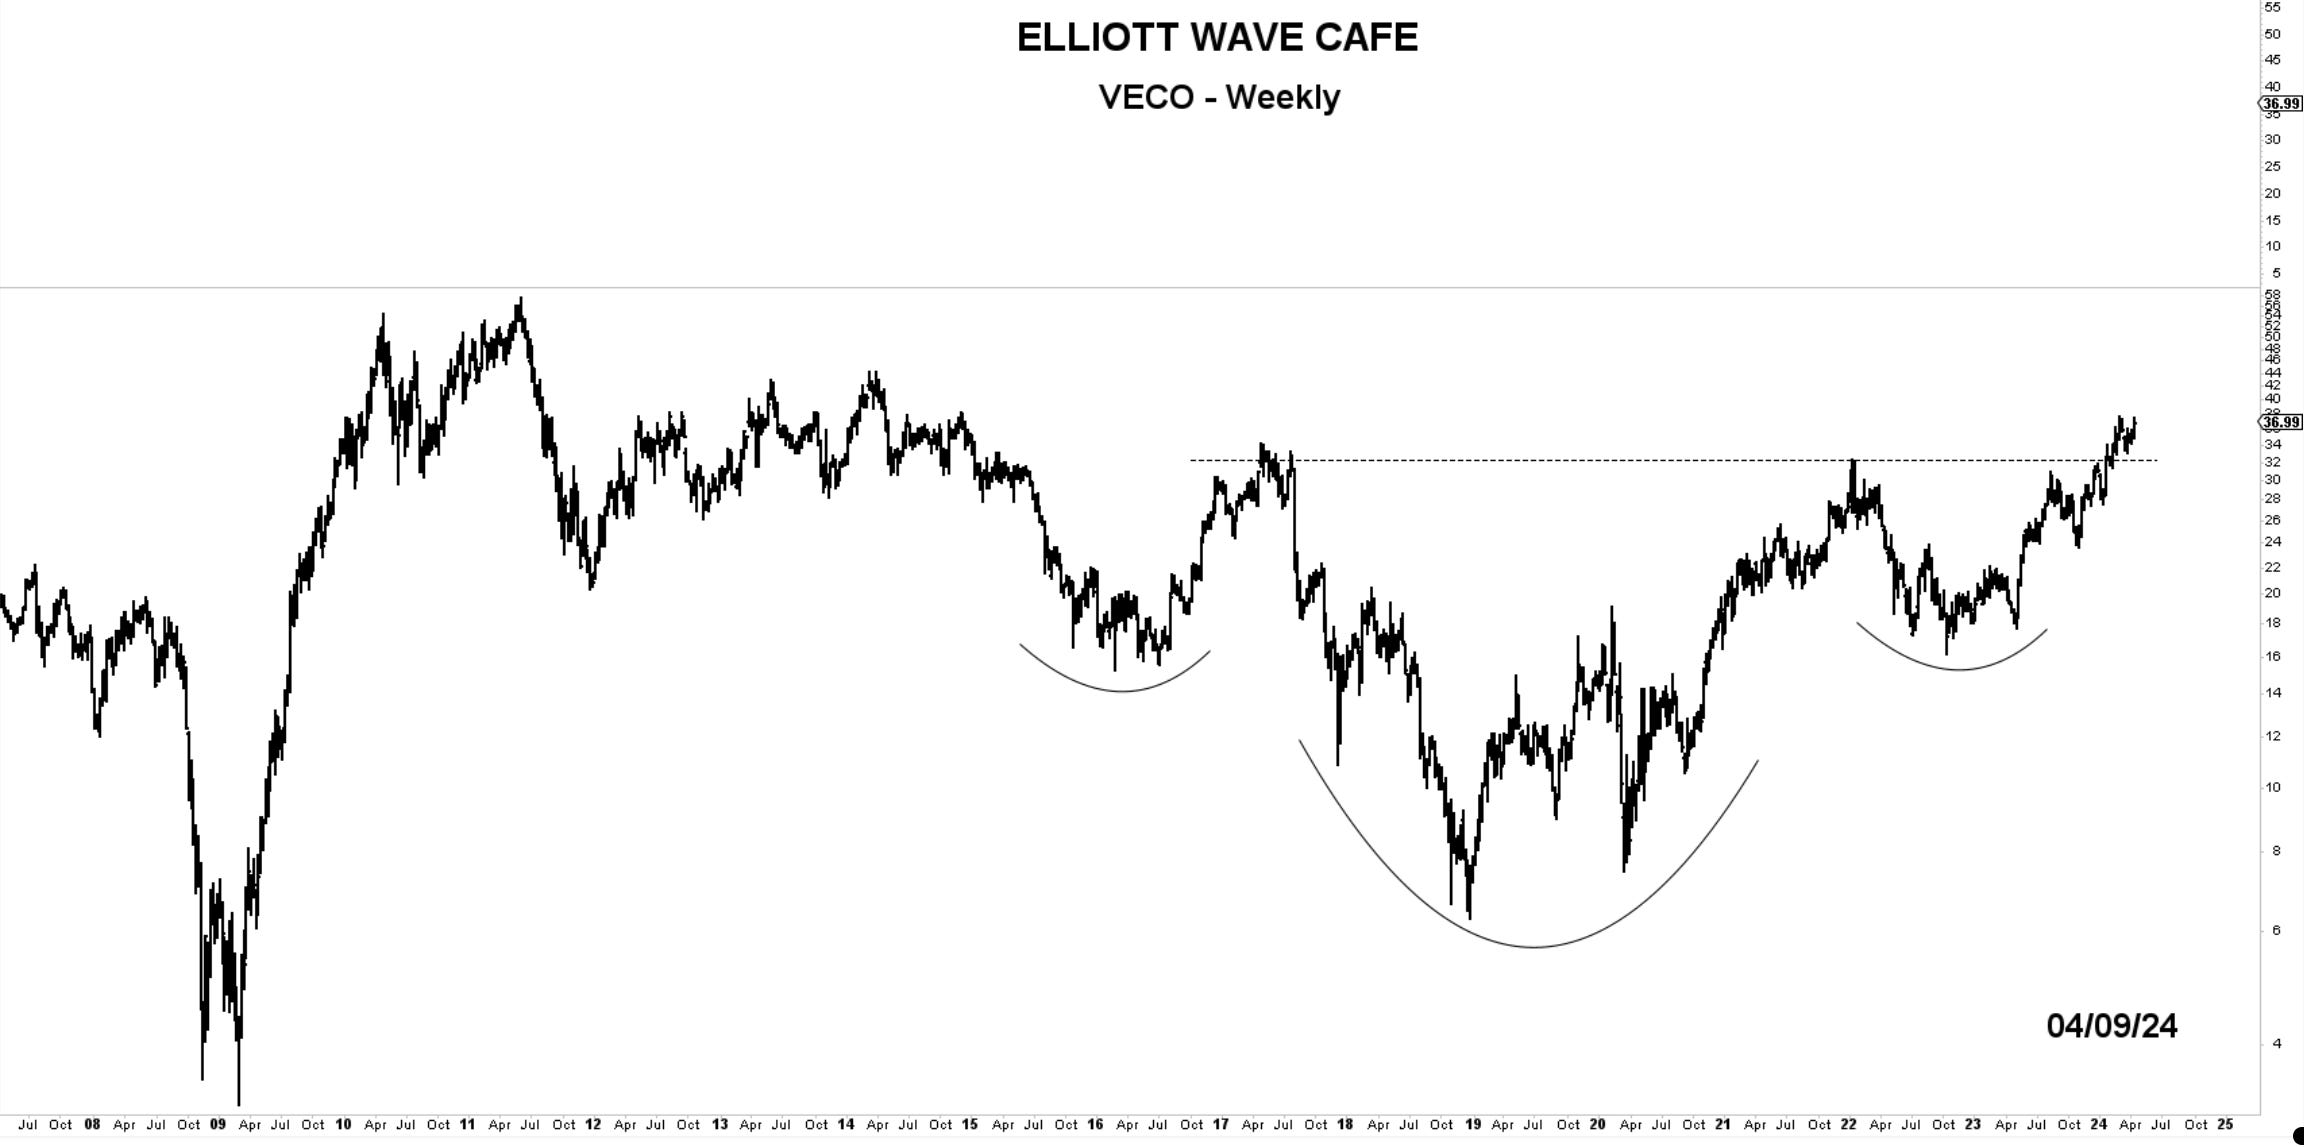
Chart of the Day—VECO— Breaking out from an 8-year base. Veeco Instruments, Inc. engages in the development, manufacture, sale, and support of semiconductor process equipment. Its technologies consist of metal-organic chemical vapor deposition, advanced packaging lithography, wet etch and clean, laser annealing, ion beam, molecular beam epitaxy, wafer inspection, and atomic layer deposition systems.
In yesterday’s note, I covered the weekly and daily Elliott Wave counts in the core markets we follow. In the daily video, I went over the counts and explained the current structure.
Bottom Line: The market remains in an uptrend and continues to warrant Long exposure. The corrective action takes place sideways, without apparent interruptions of the uptrend or large distributions.
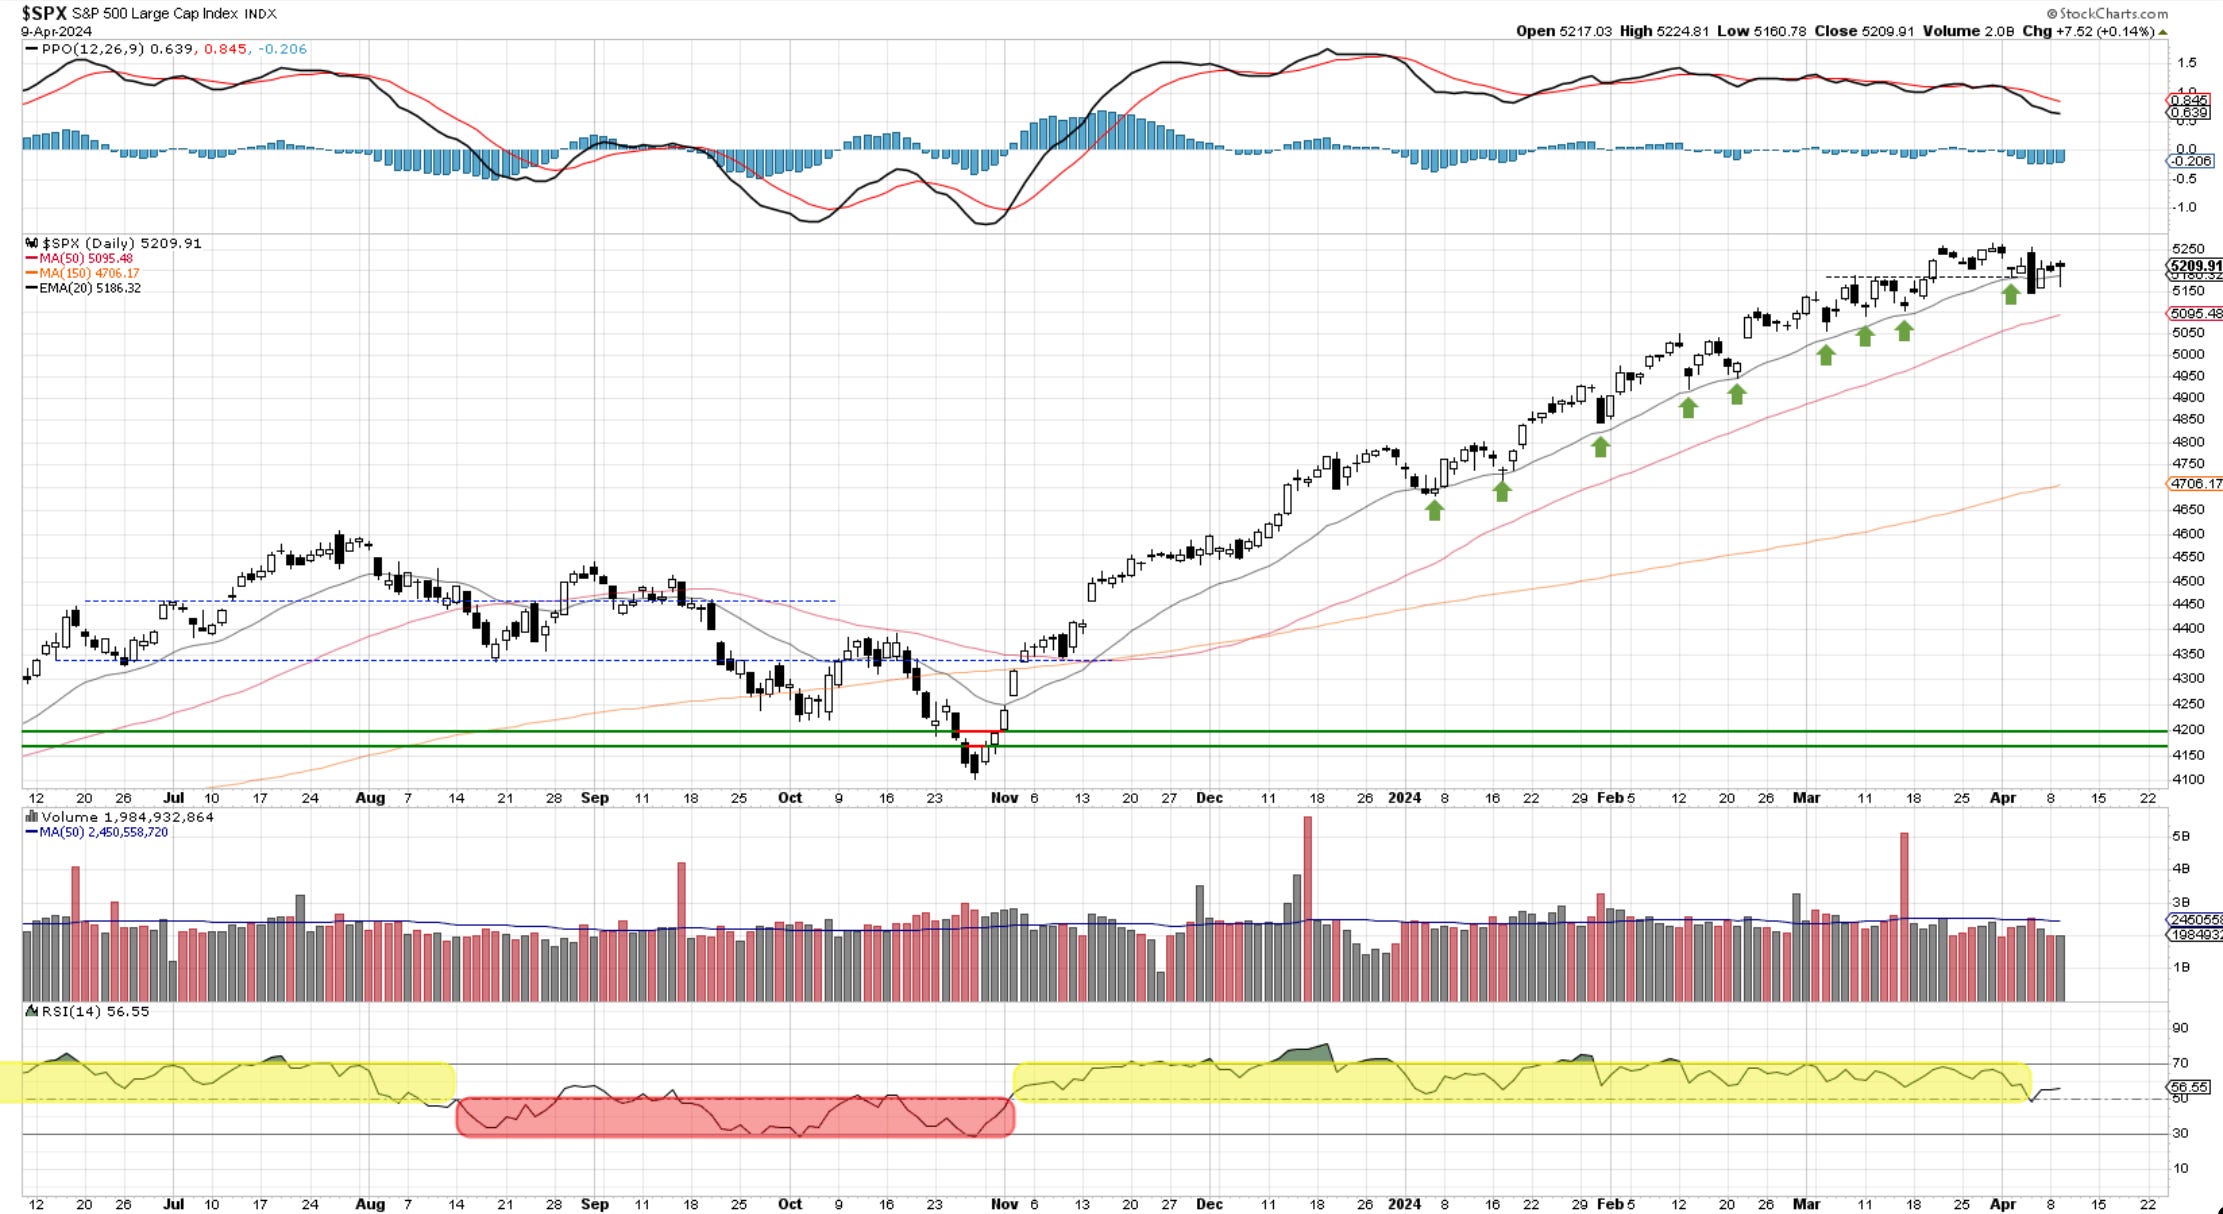
SP500
The market gapped higher to start, then flushed lower into the 11 a.m. hour, followed by buying for the rest of the day. 5150 seems to be the place where bids are being placed, supporting the market. We have now closed back above the 20-day MA, continuing to lack follow-through on last Thursday’s selloff. A climb above that candle’s high will negate it and open up the doors to further upside. 5400 would be the obvious targets. The RSI has pulled back from that 50 mark.
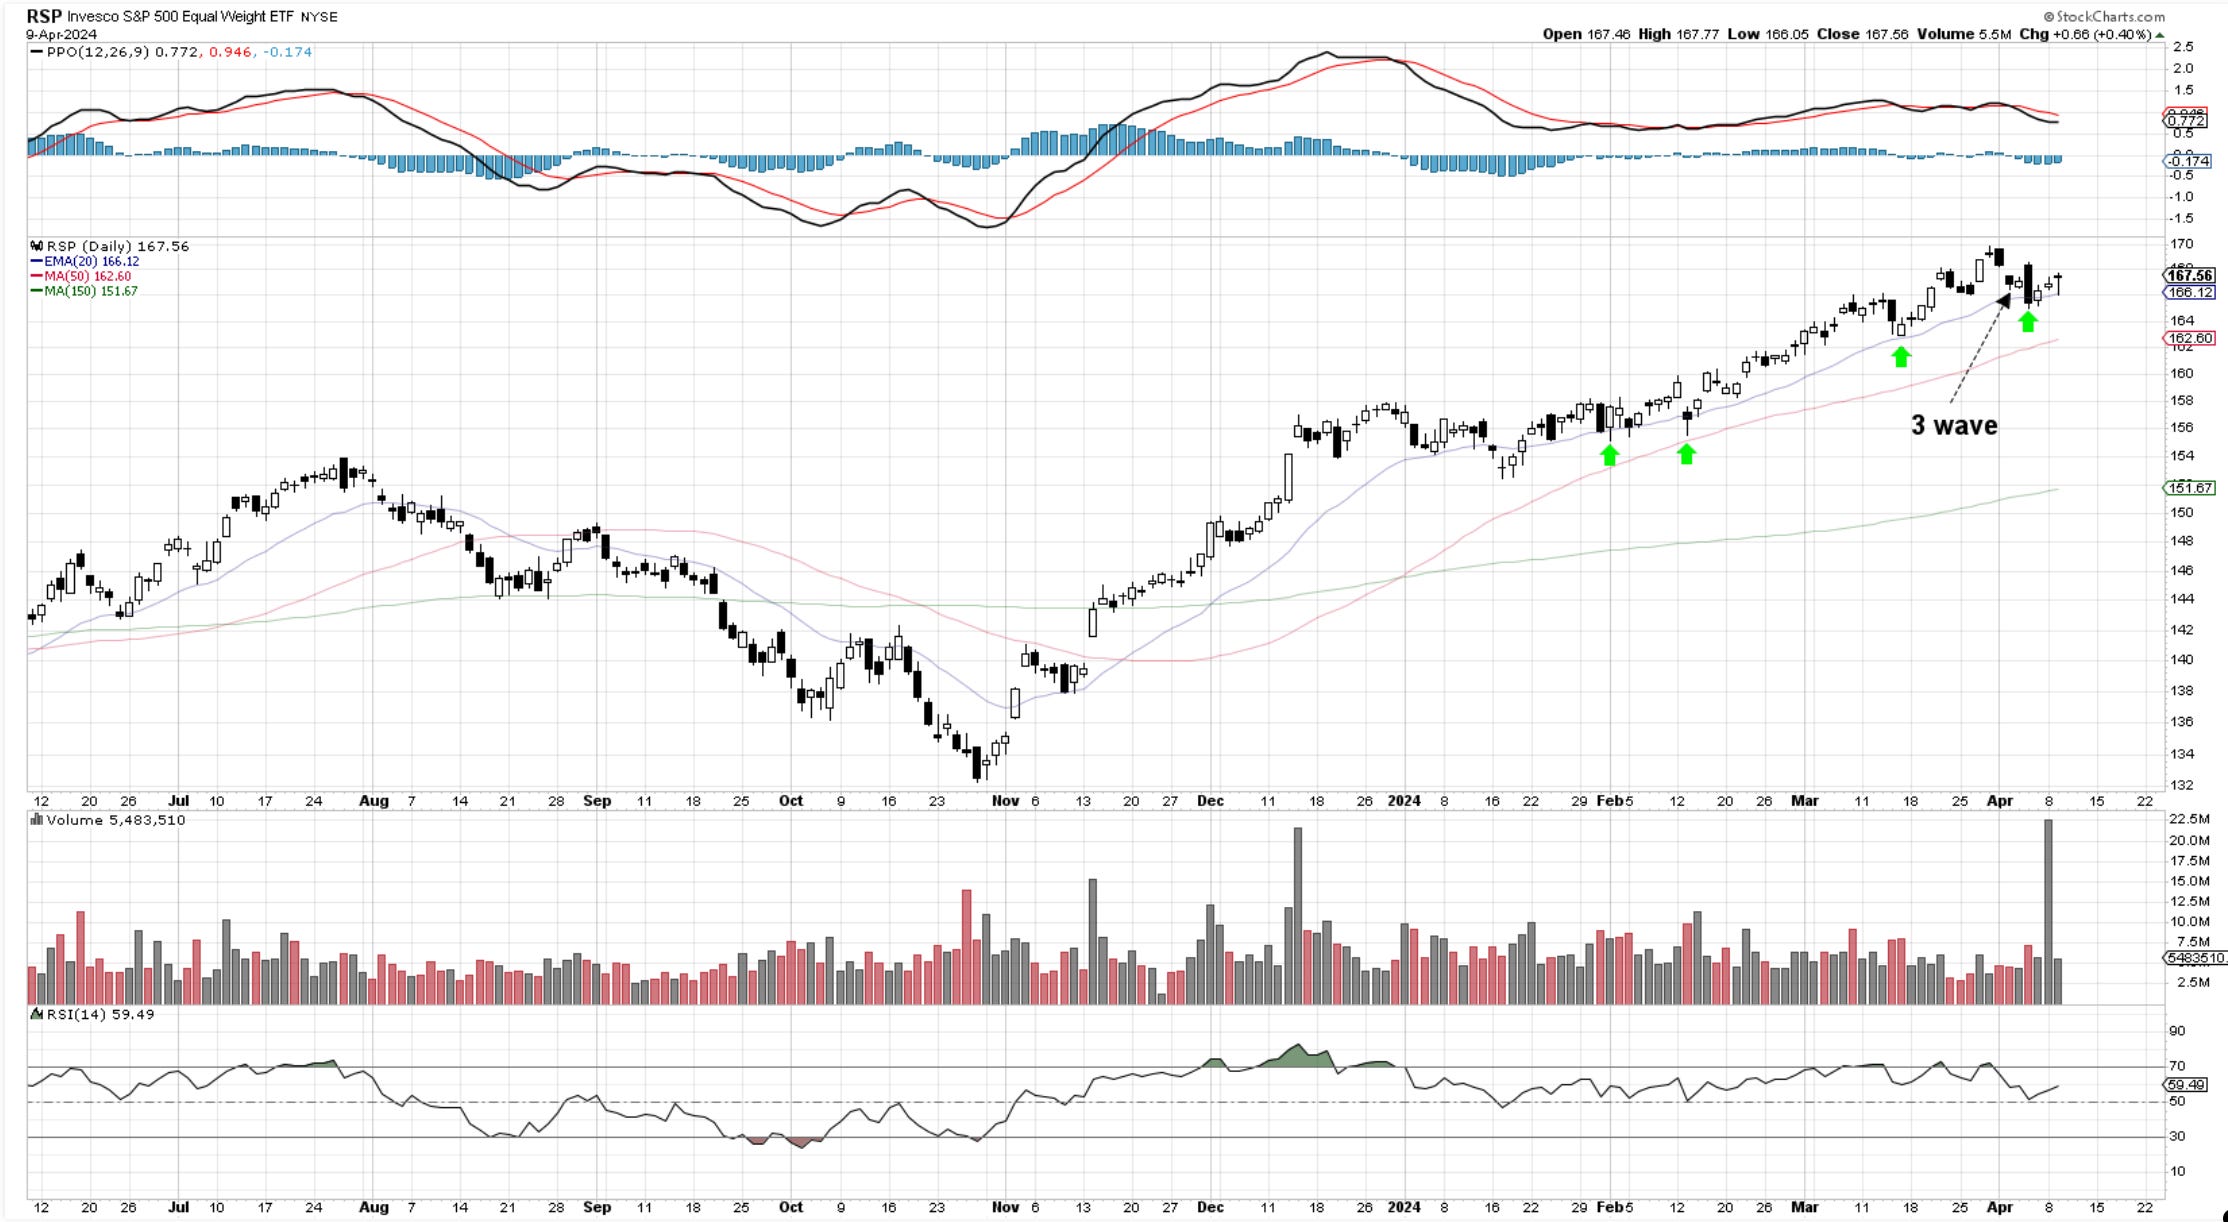
RSP - three wave pullback into the 20-day and now the third day of buying. Look like further upside is likely.
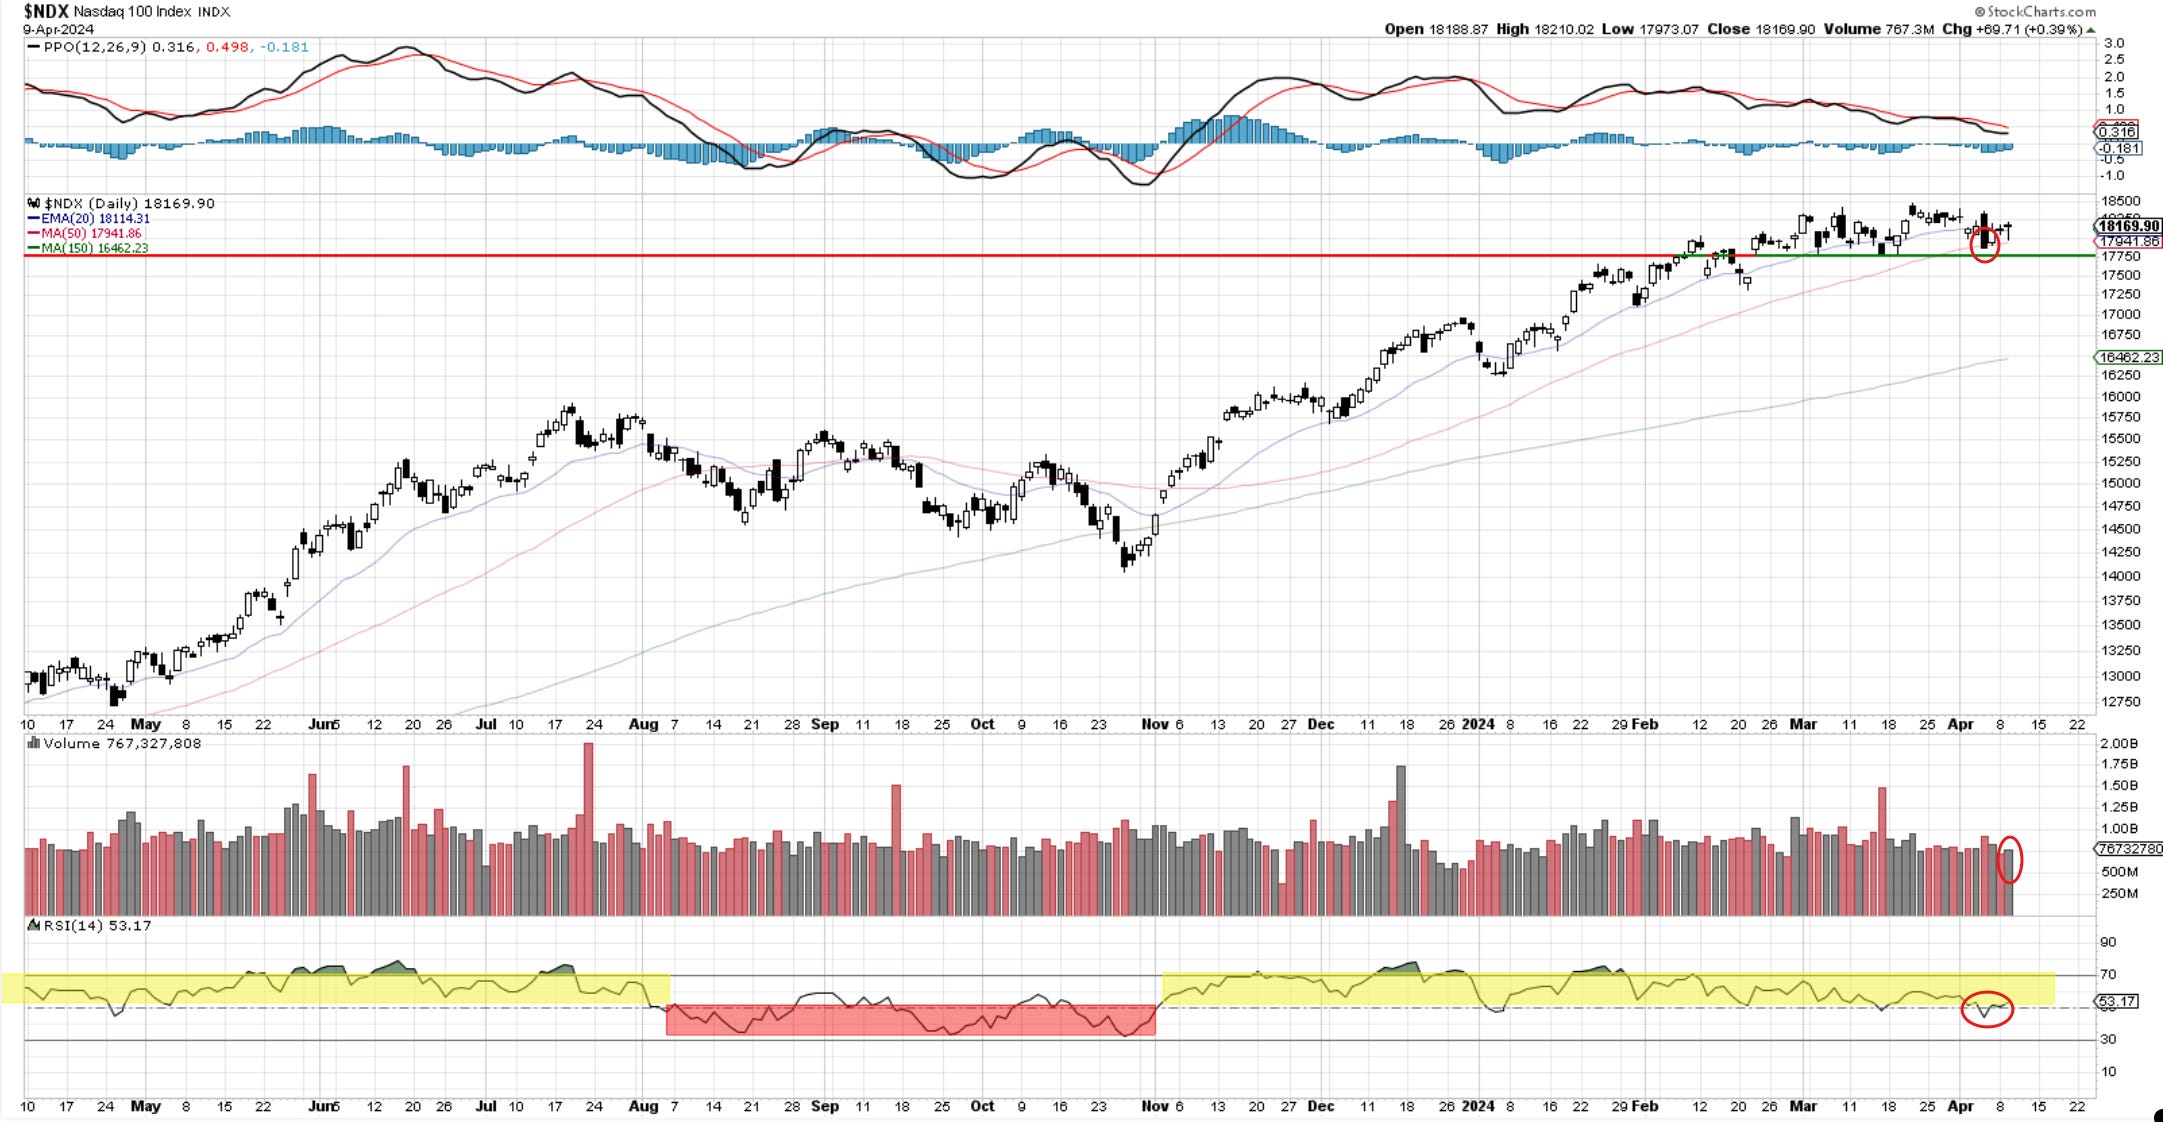
Nasdaq100
Nasdaq shows some buying strength on higher volume than yesterday. The RSI dipped quickly below 50 without follow-through. The sideways correction with an unbroken base at 17,750 suggests a move higher appears to be in the cards. A break of 18,350 would be the signal.
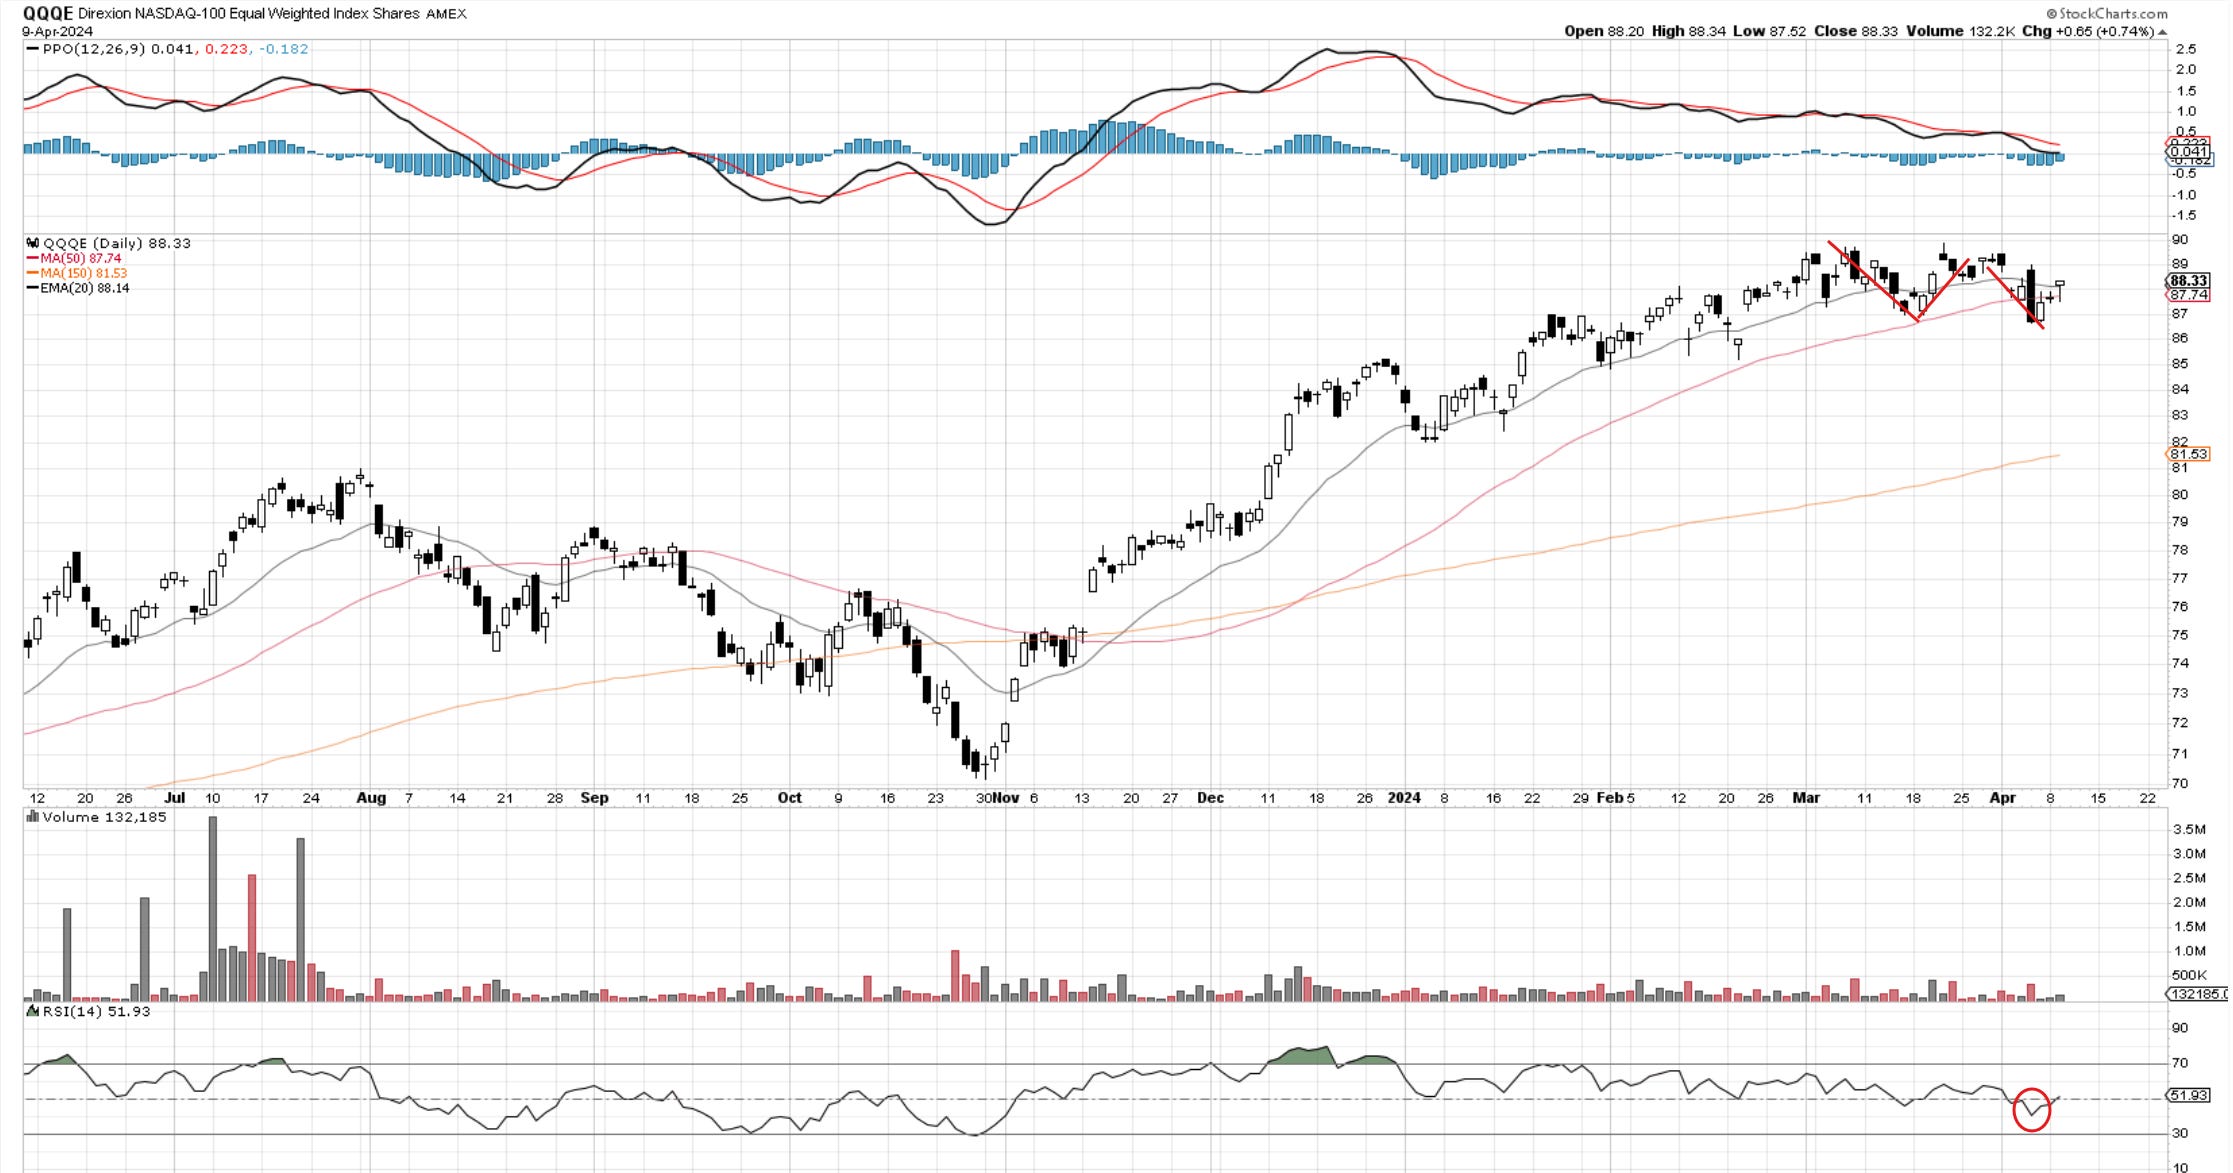
QQQE - a 3-wave move appears here as well in the equal-weighted ETF. These are corrections against an ongoing trend and suggest a continuation of the prior move.
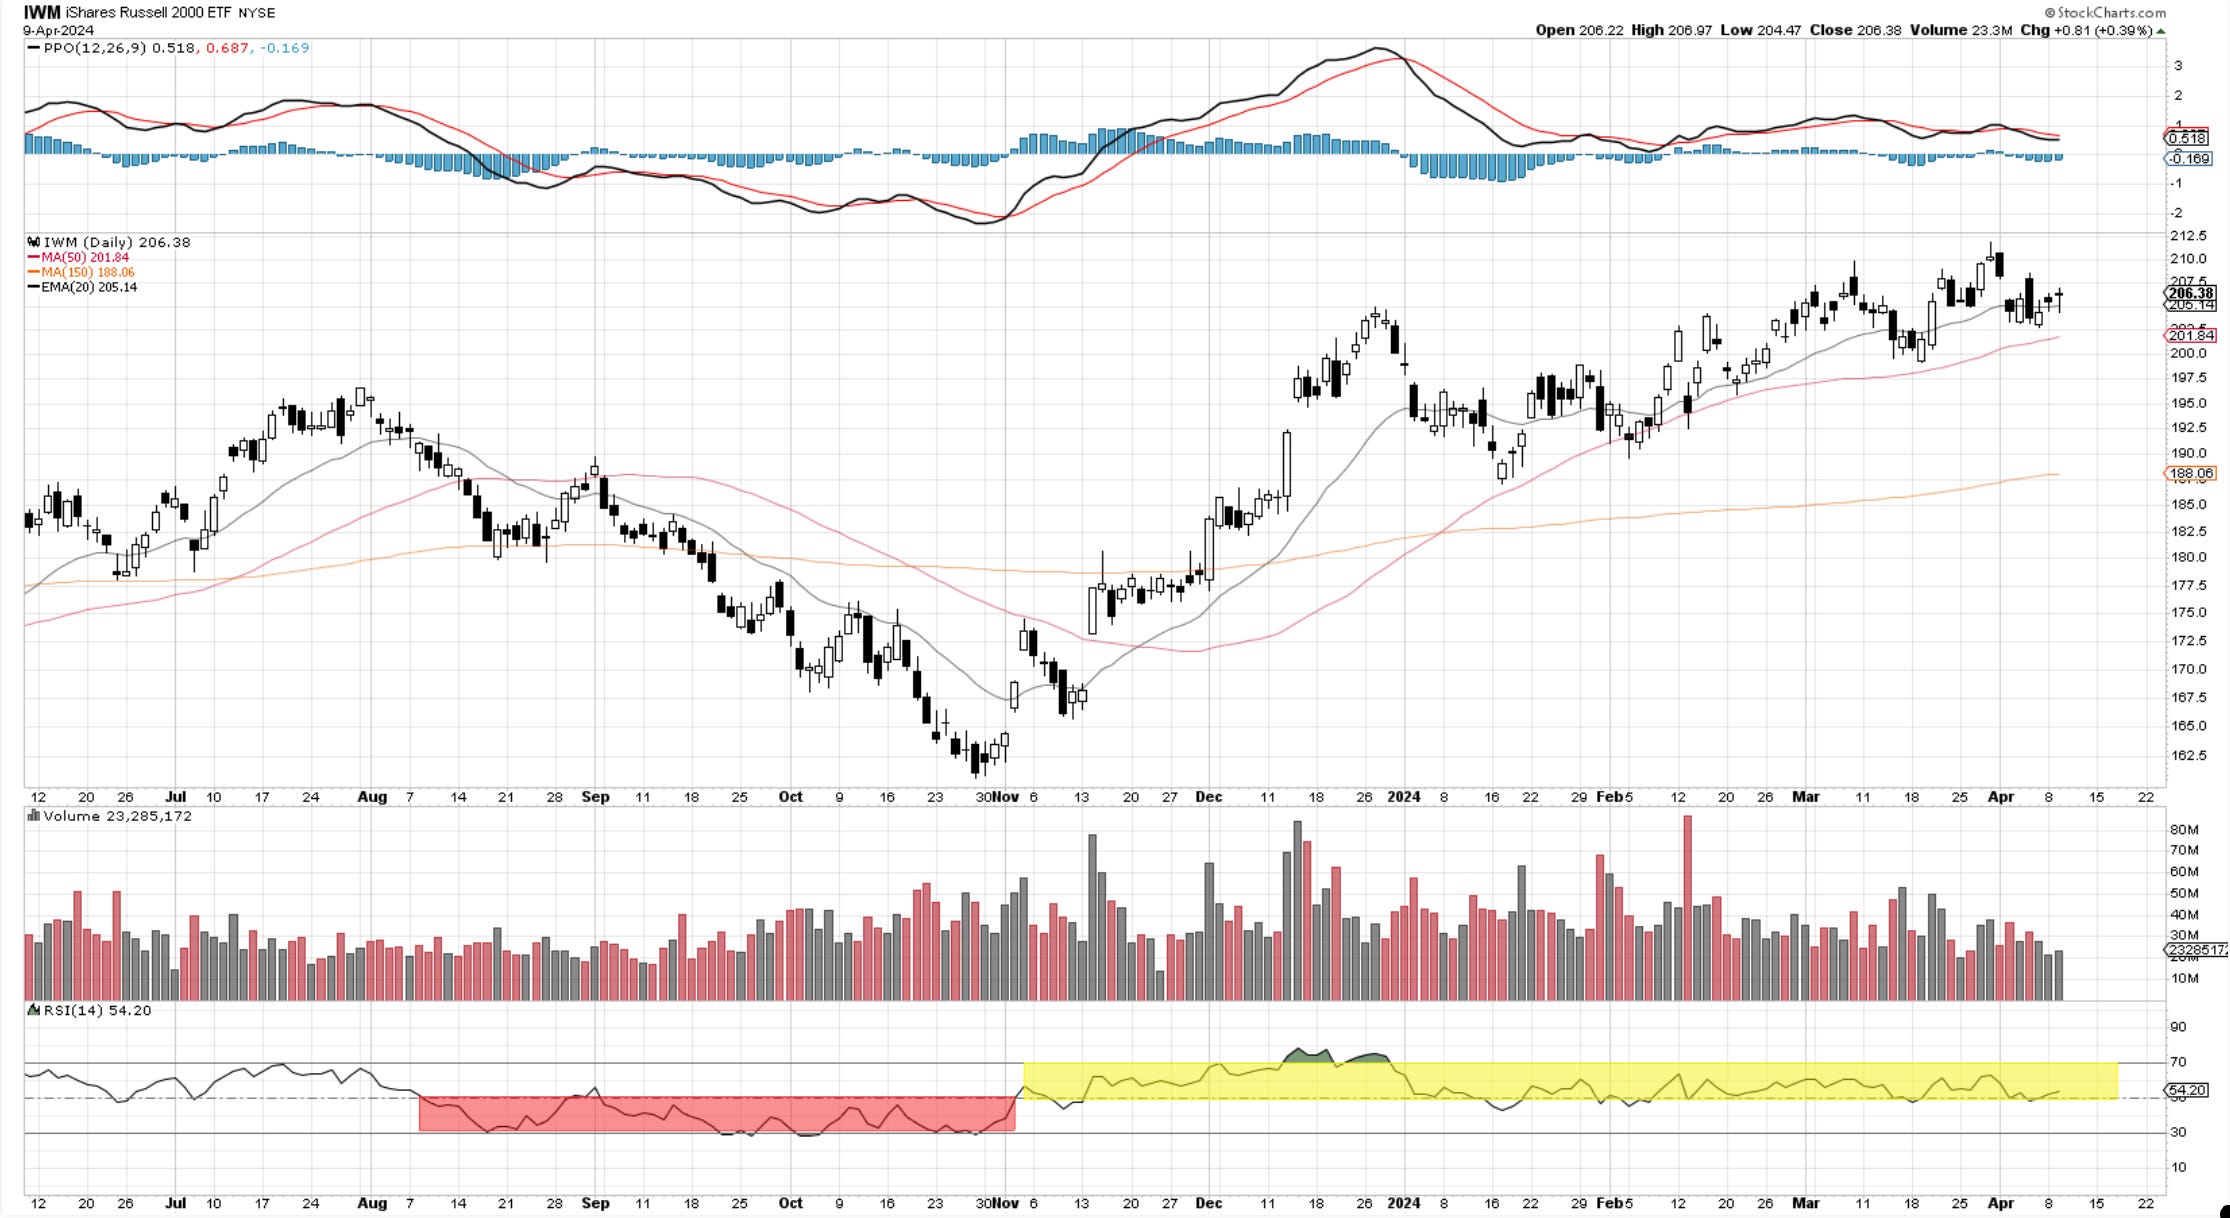
RUSSELL 2000 - IWM
The small caps remained choppy but did not break any significant lower levels. The series of HH and HL continues. The RSI held 50 while volume is picking up. A crack of 210 is bullish.
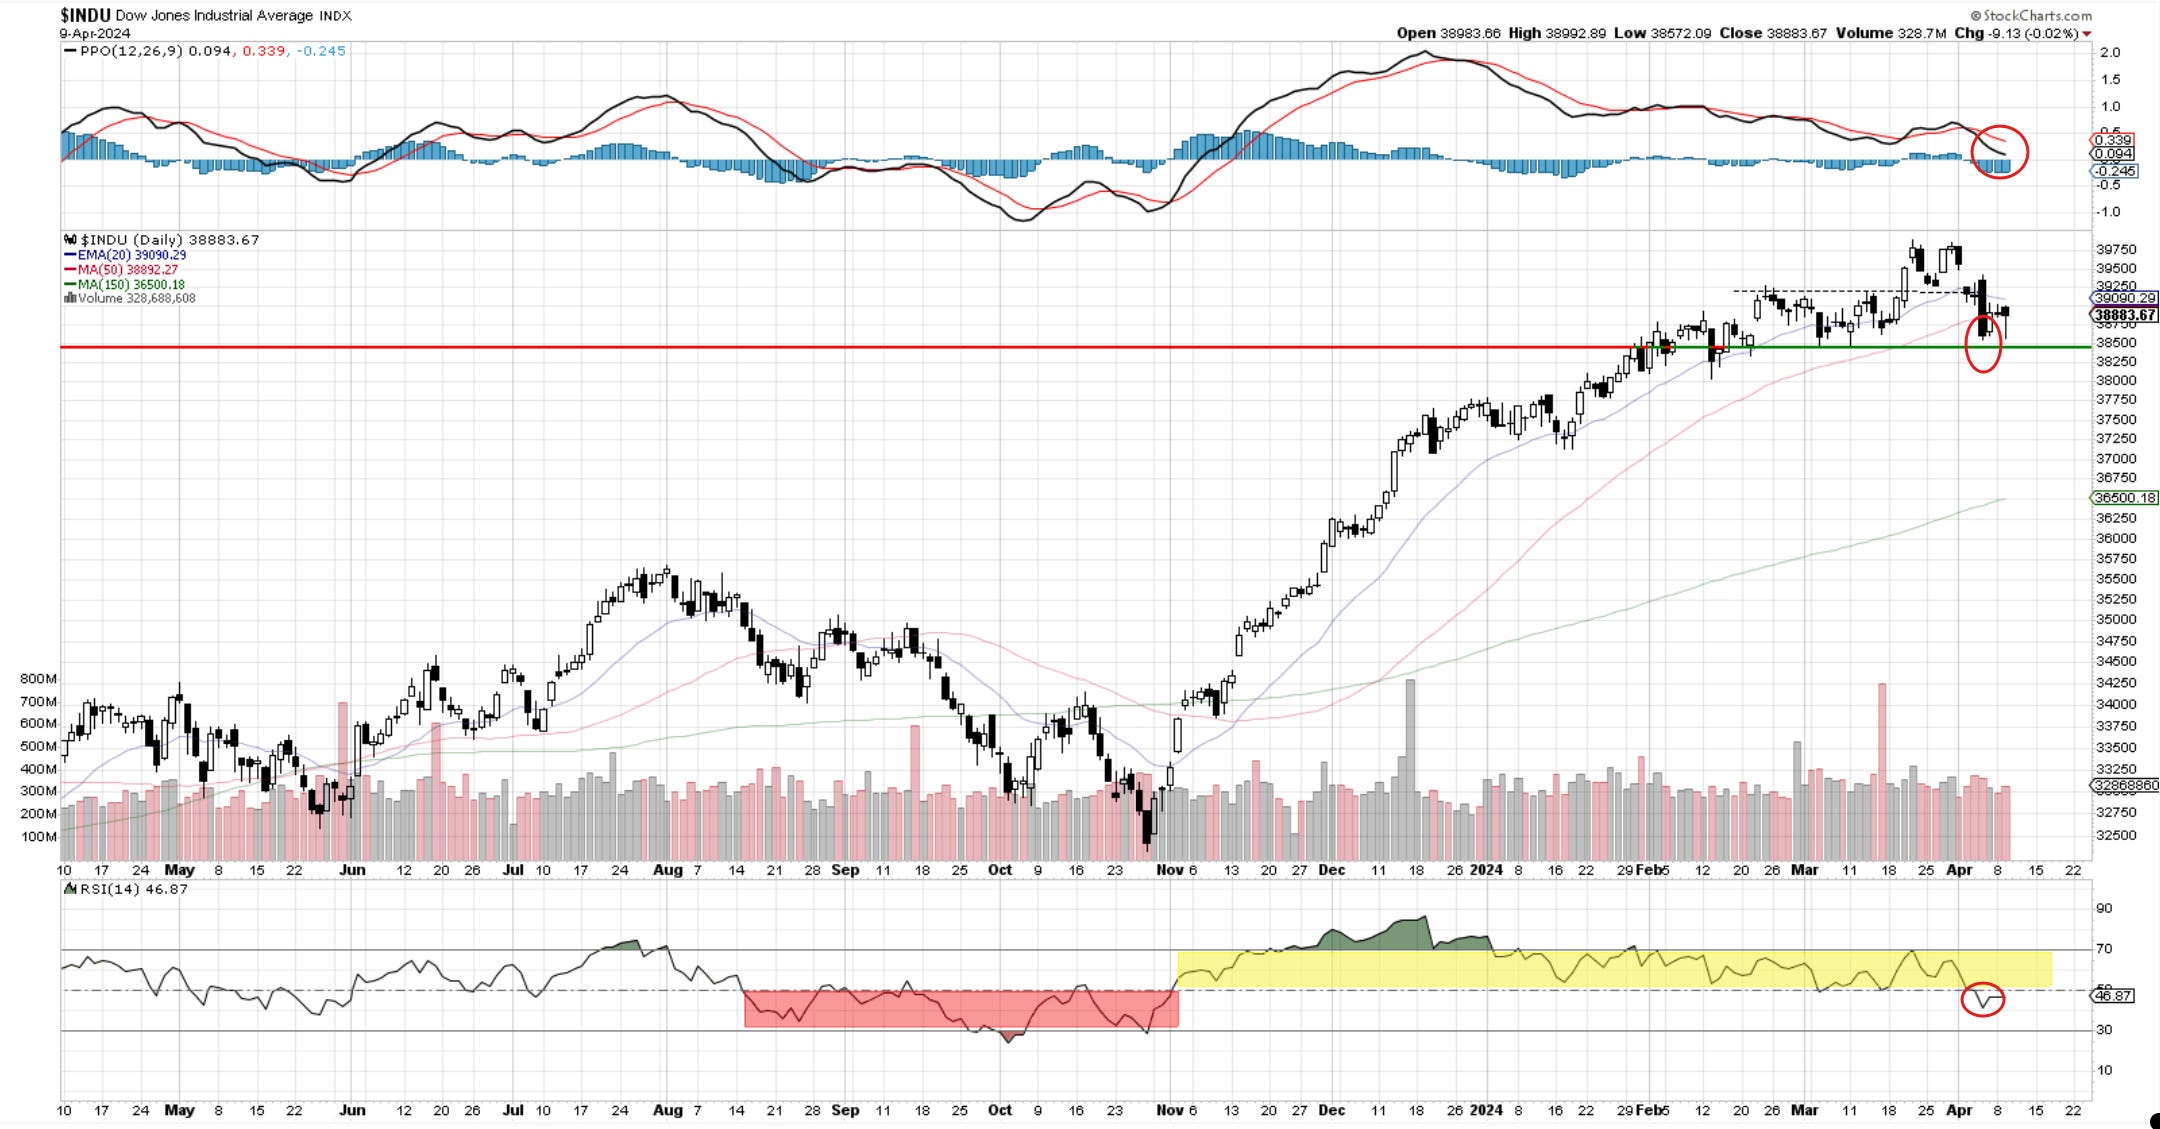
Dow30
The Dow attempted another 38,500, but the buying power was unleashed once again. The RSI remains below 50, bouncing from 40. This index continues to suggest caution until more buying appears. The PPO is approaching zero, and we will watch for a reset. Until 39,400 gets taken out, there is nothing to do here but wait.
For those wanting to chat with fellow traders, the link is below.

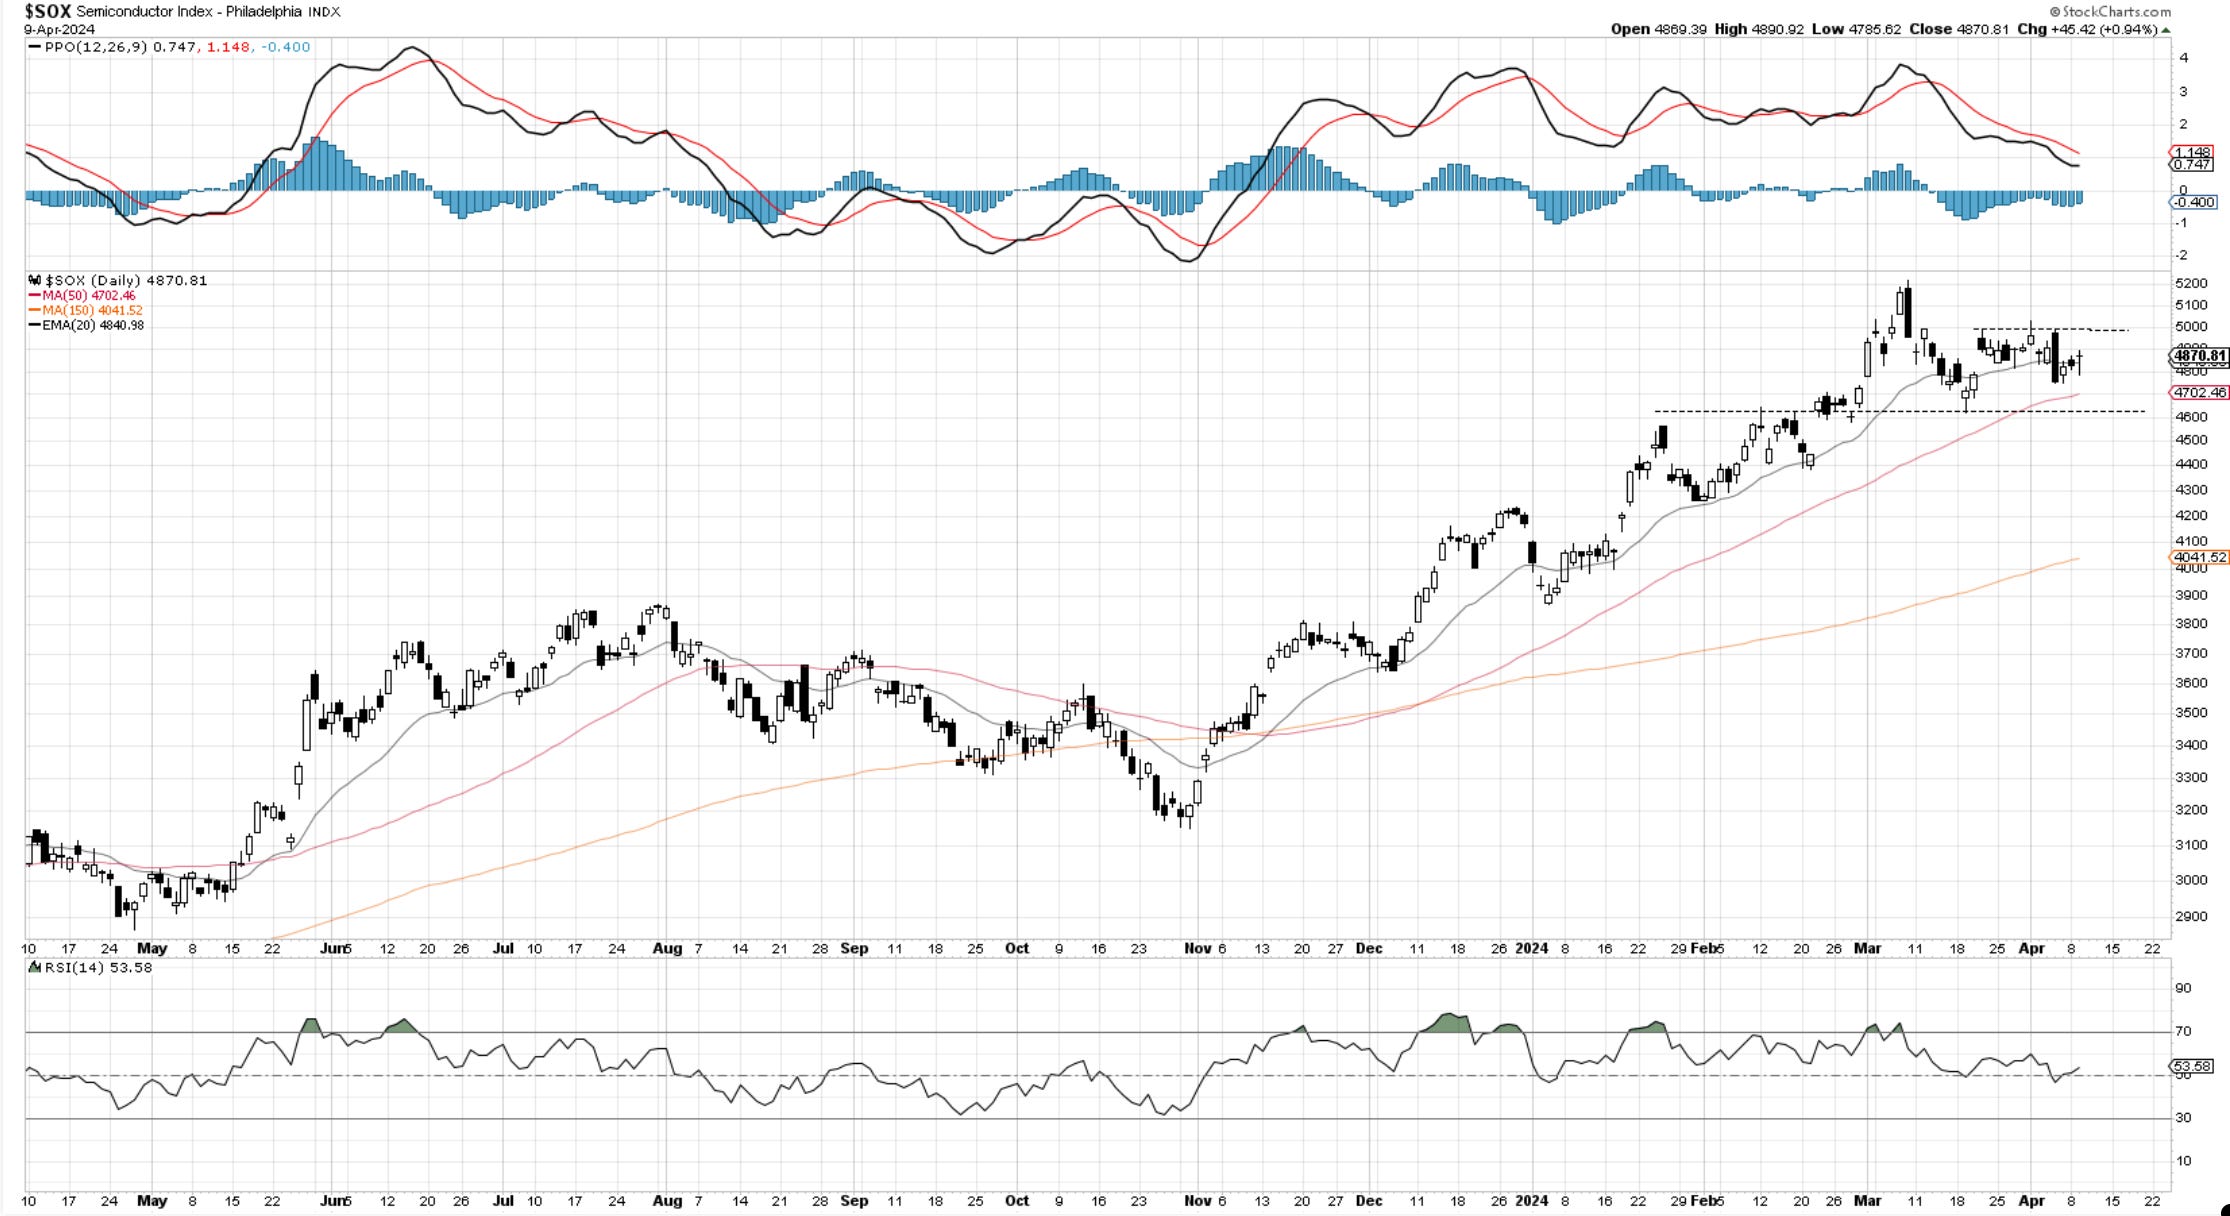
SOX
Semiconductors are holding above 4700, where the 50-day MA resides, and just below, we have the 4600 horizontal support. A break of 5000 should unleash additional buying.
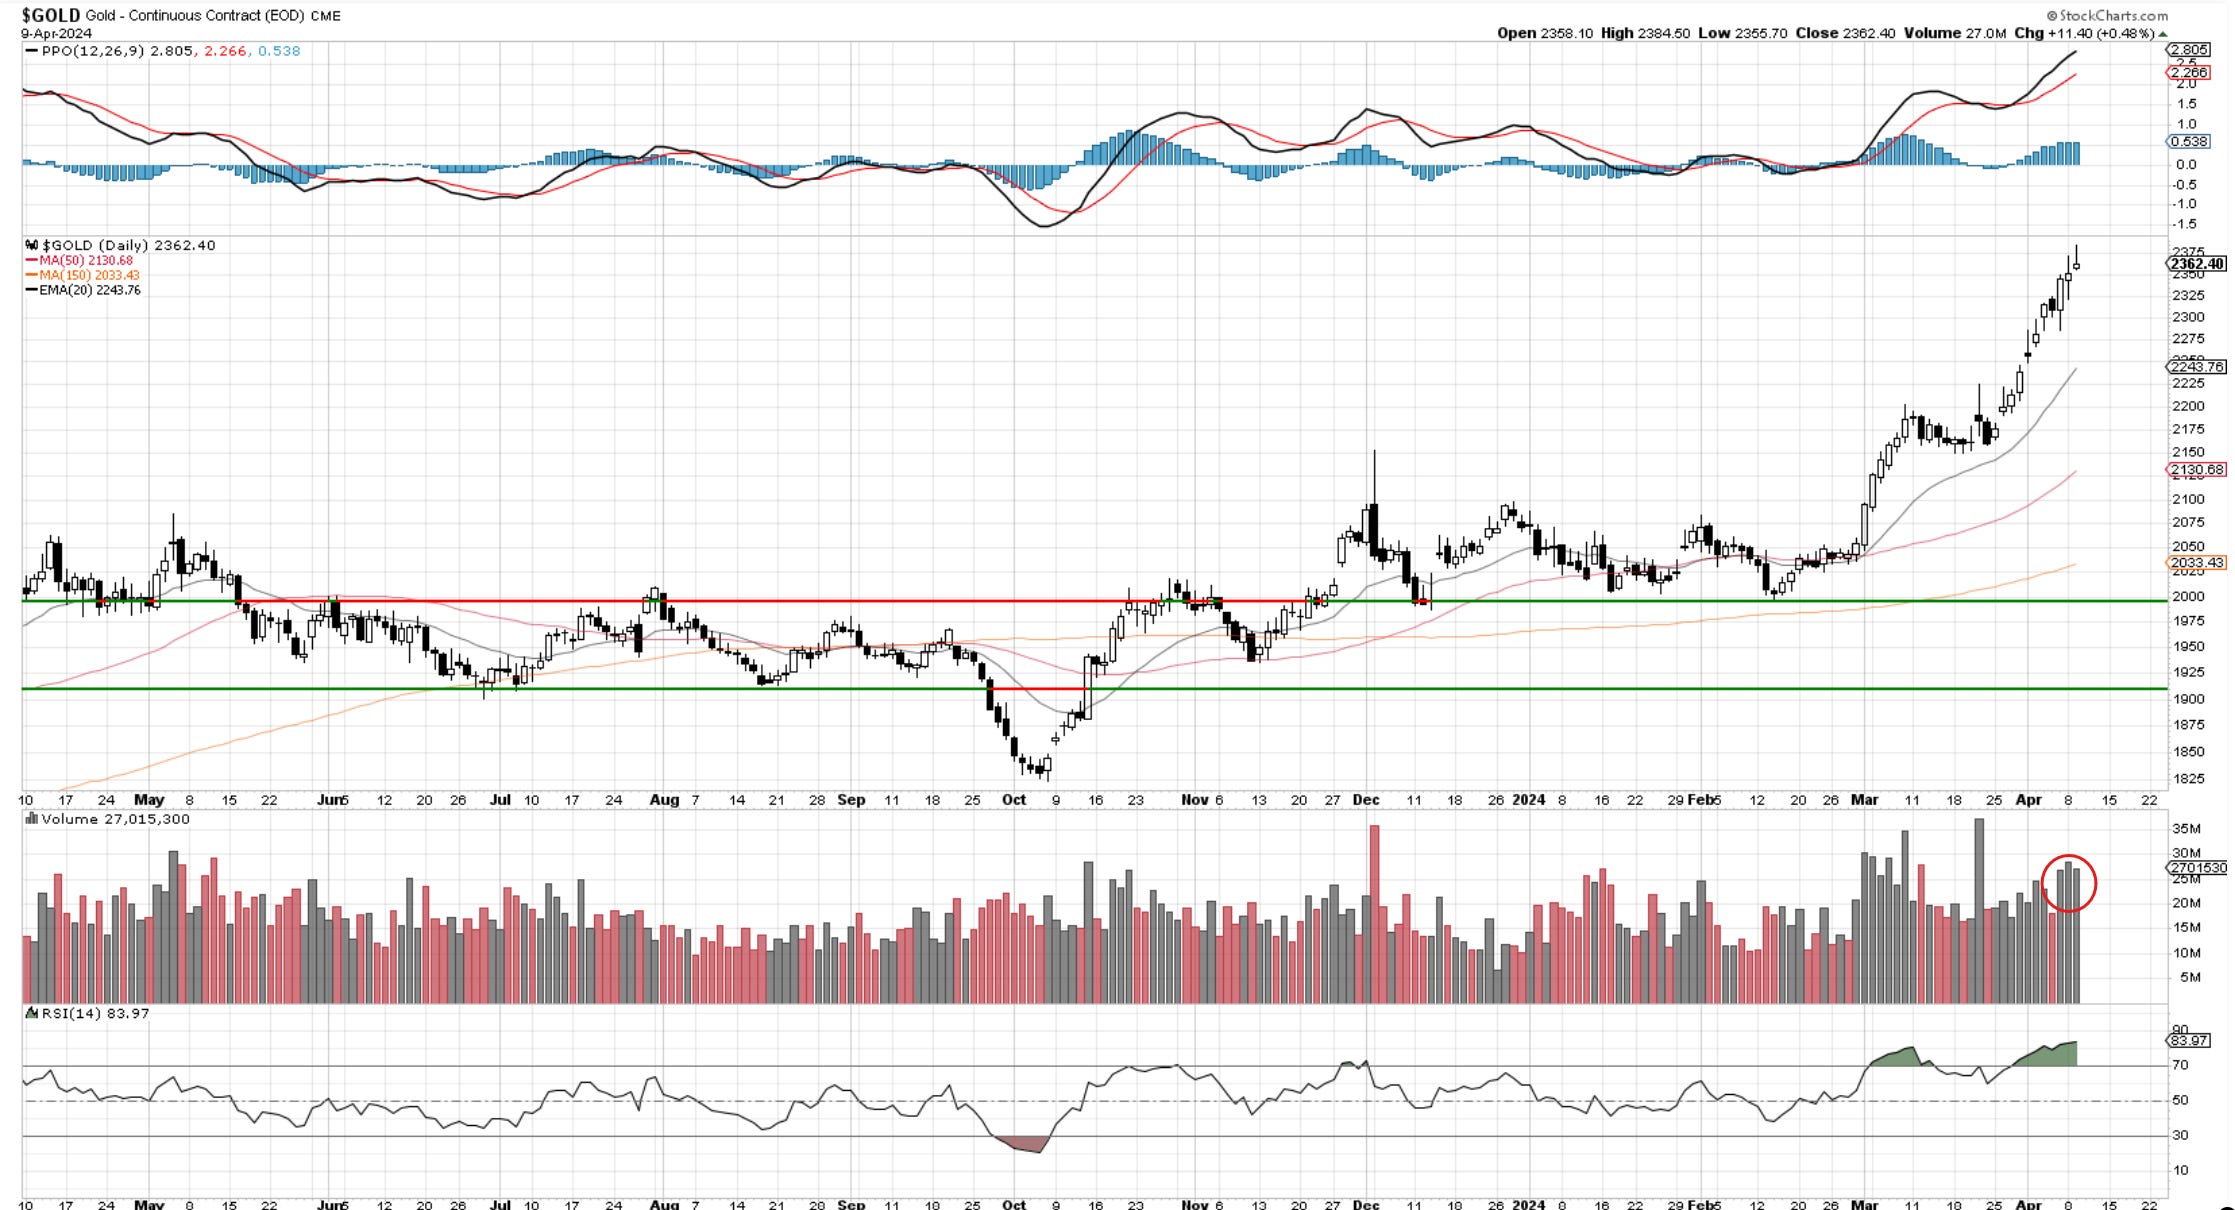
Gold
You could say Gold is a bit extended, and I would not blame you. If you bought the breakout from 2200, this is a place for taking partial profits or tightening stops. It gave us an 8% up move against a 2% stop. It is not a short, and the next consolidation would provide the next opportunity.
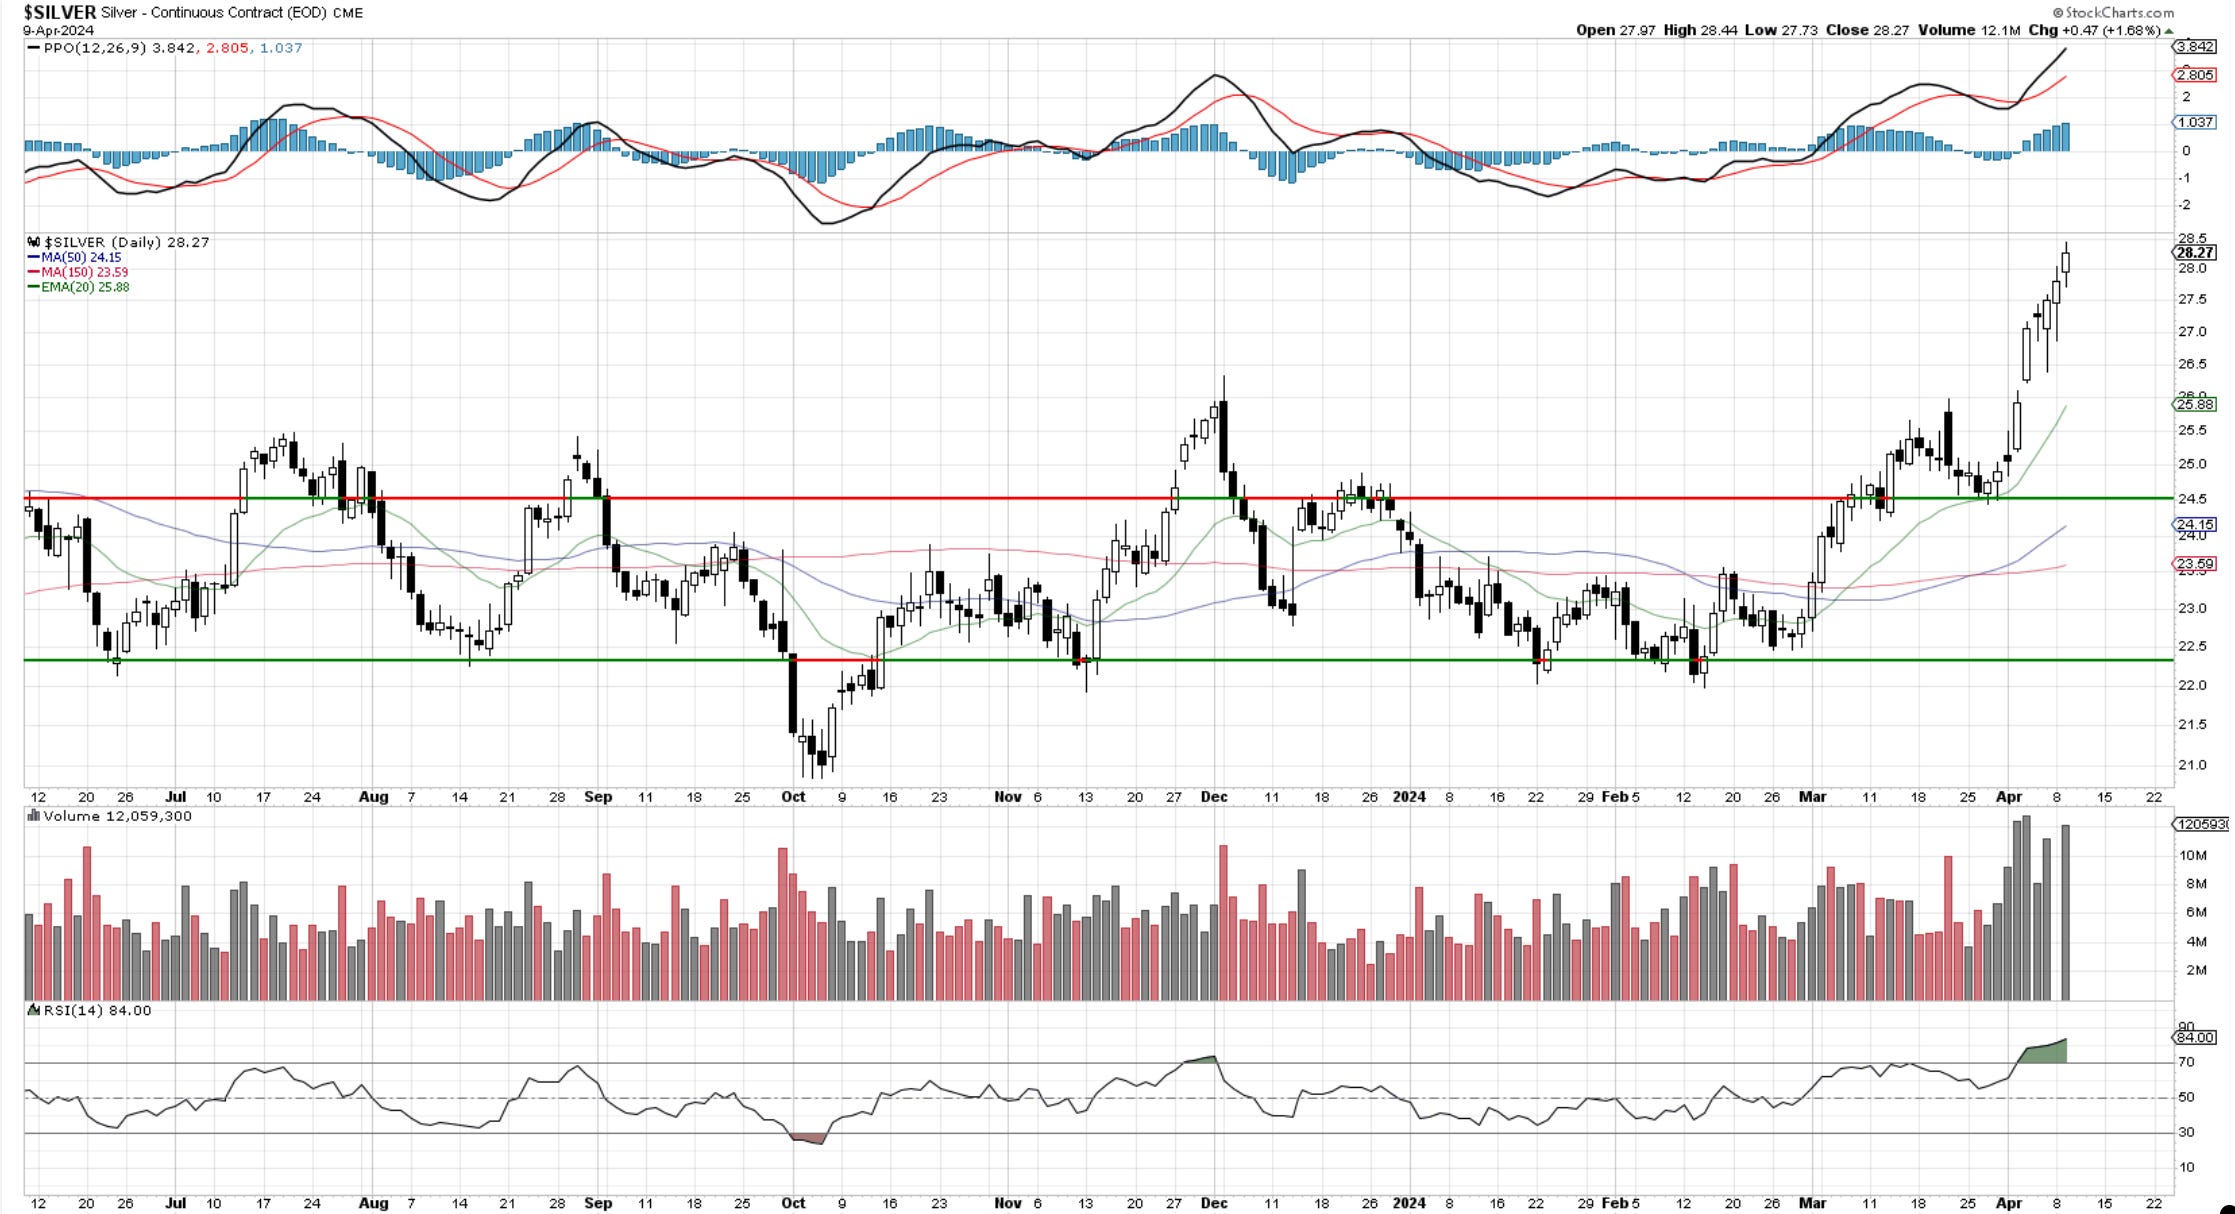
Silver
Ever since Silver broke 26, it has been a straight shot higher. The volume is way above average and consistent with a third-wave approach. The long exposure can continue as long as the trend displays strength, with profits taken along the way.
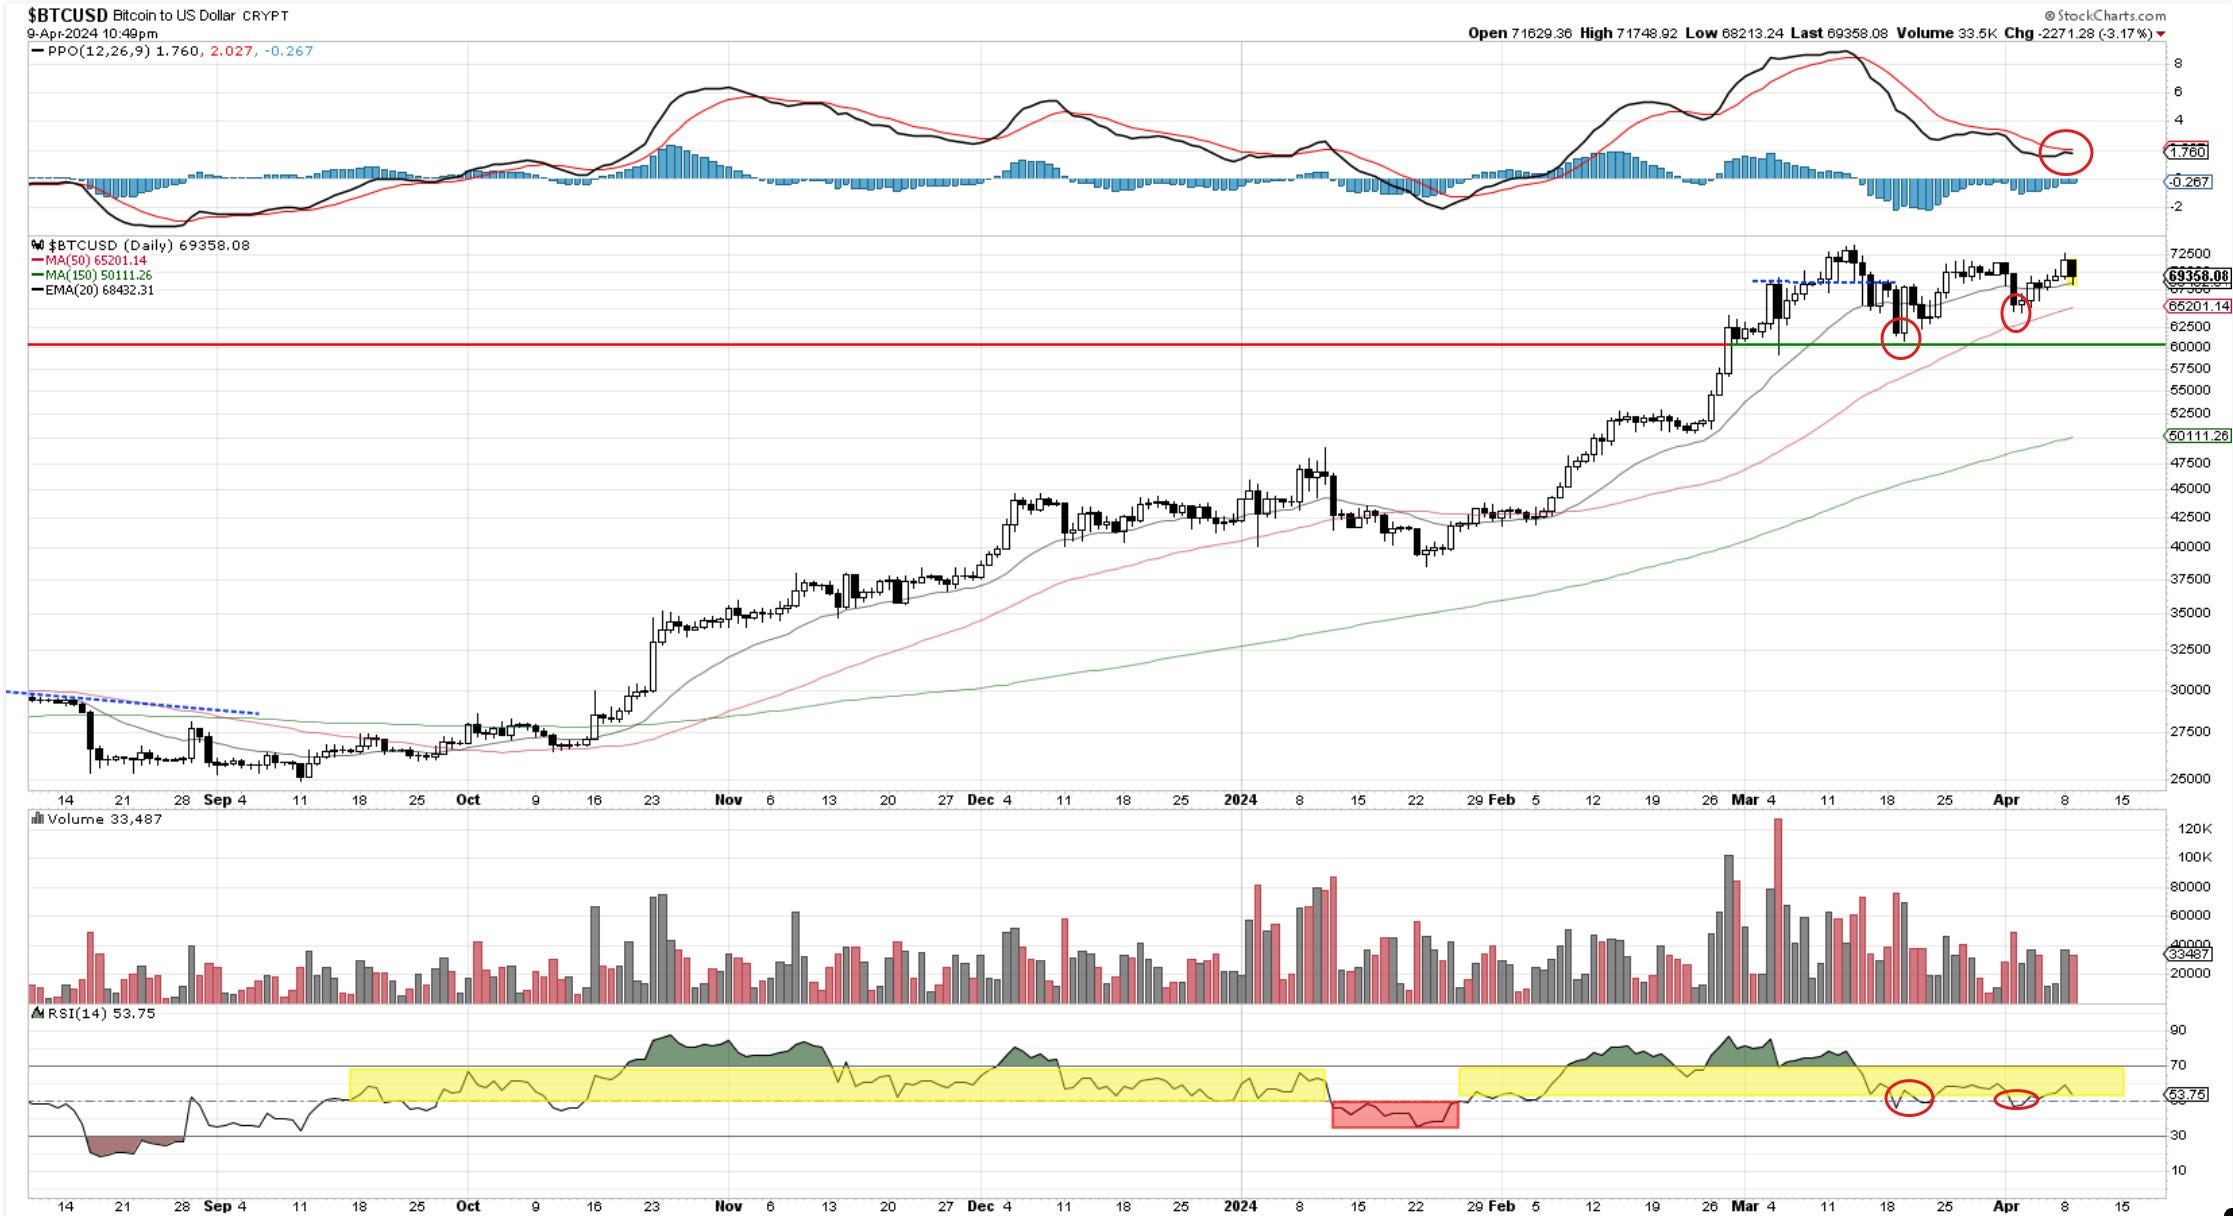
Bitcoin
Bitcoin has made a higher low at 65k after the initial March 19th drop to 60k. The RSI holds 50 on these short-lived selloffs. The break of 71,500 has not had any follow-through yet, but I am watching that for confirmation of further strength towards 90k.
If you’re new to Elliott Wave or need to refresh, there is a 7-hour video course with downloadable slides under The Coarse tab on the website. Requires a yearly “Founding Member subscription.” You can find it HERE.
Cris
email: ewcafe@pm.me