
The Daily Drip
Core markets charts updates and commentary
Note: The counts on the right edge are real-time, and they are prone to adjustments as price action develops. Elliott Wave has a fluid approach, is evidence-based, and requires constant monitoring of certain thresholds.
In the counts below, this (( )) = circle on chart
SP500
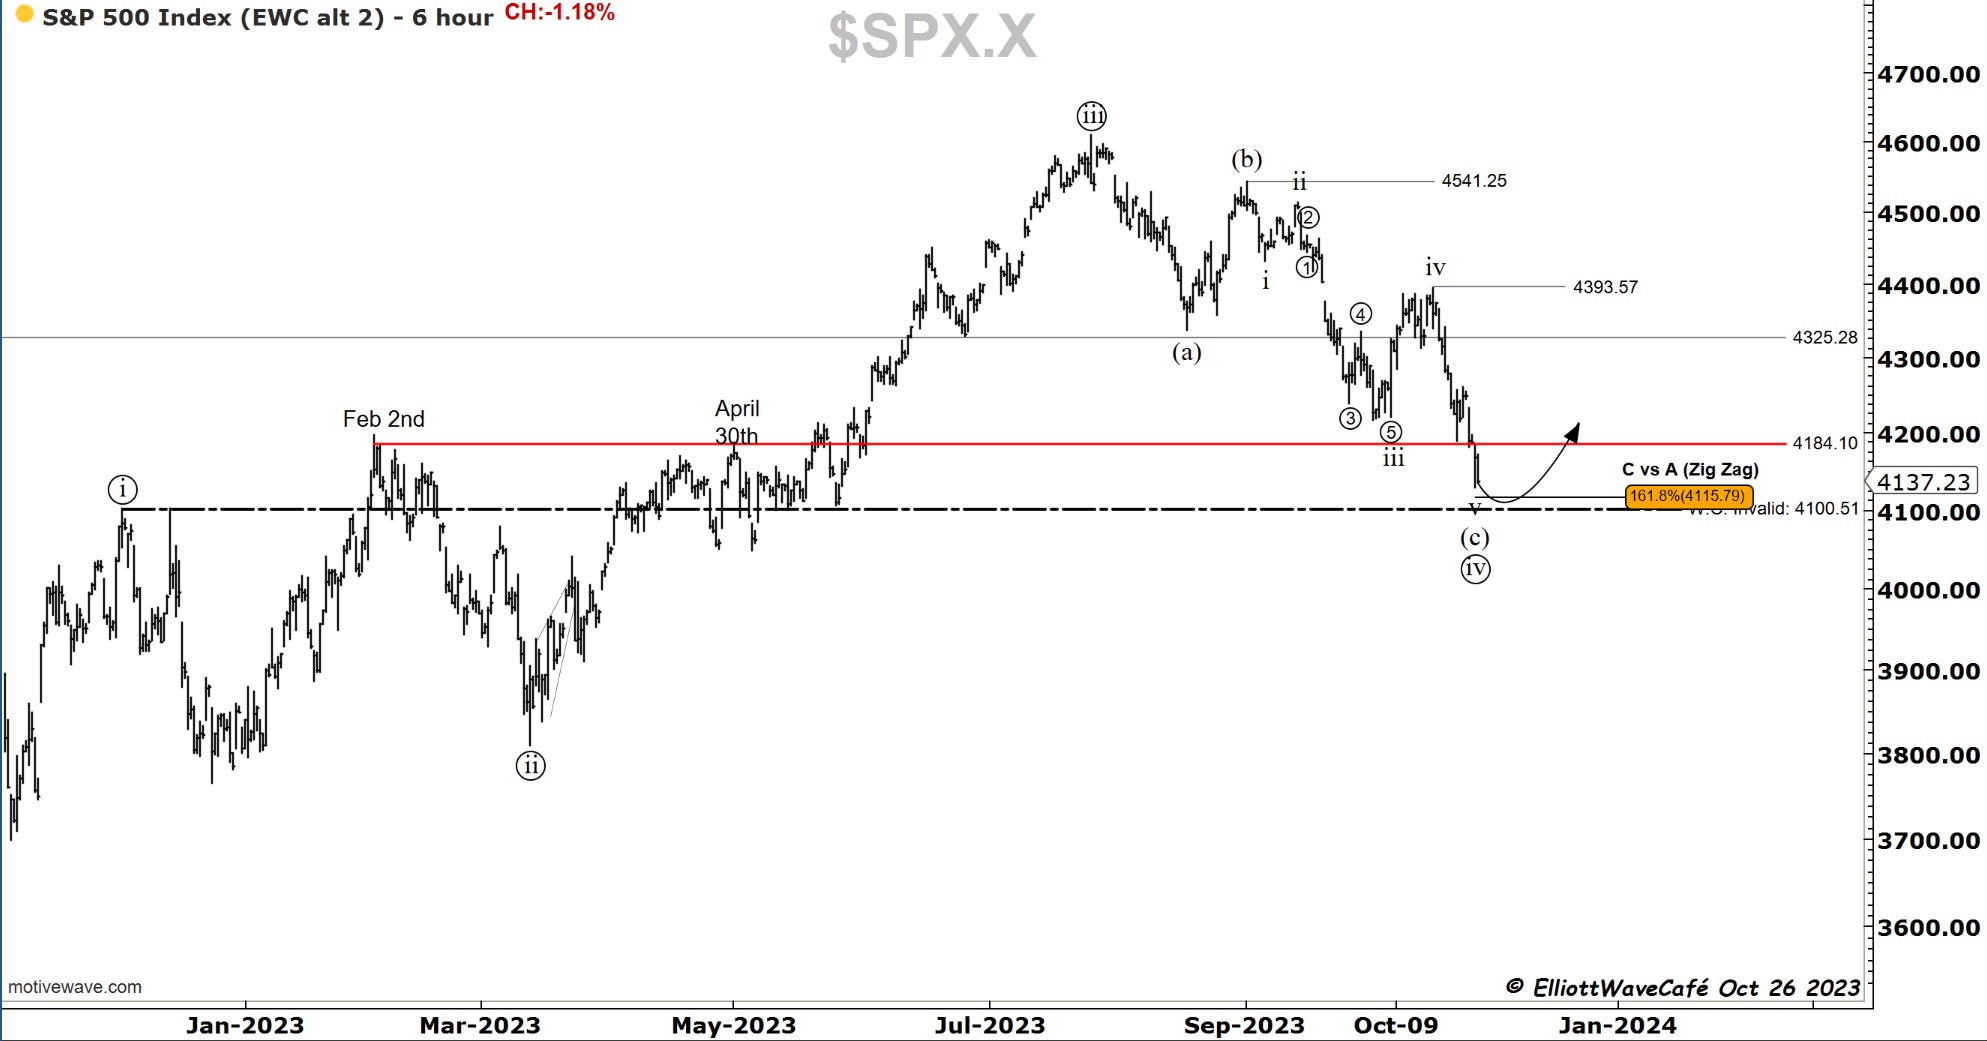
The decline today felt severe, especially with the overnight futures breaking down. There was a slight recovery intraday, but then the large caps got hit, and it created new lows in major indexes. We have lost the 4185 and closed at 4137.23. The prospects of the entire decline from July top becoming a 1,2 1,2 and actually being in a 3rd of a 3rd are understandable, but I want to caution against that view for the time being. There is underlying evidence of breadth divergence, seasonality, rates peaking, dollar stalling, and even appetite for crypto risk. While there is more price evidence needed to establish a better call for a stronger low, I think the bulk of the selling is in the final stages, and the window for price recovery is getting wider.
I have measured the drop in my wave (c ) vs (a), and we are now hitting 161.8% levels.
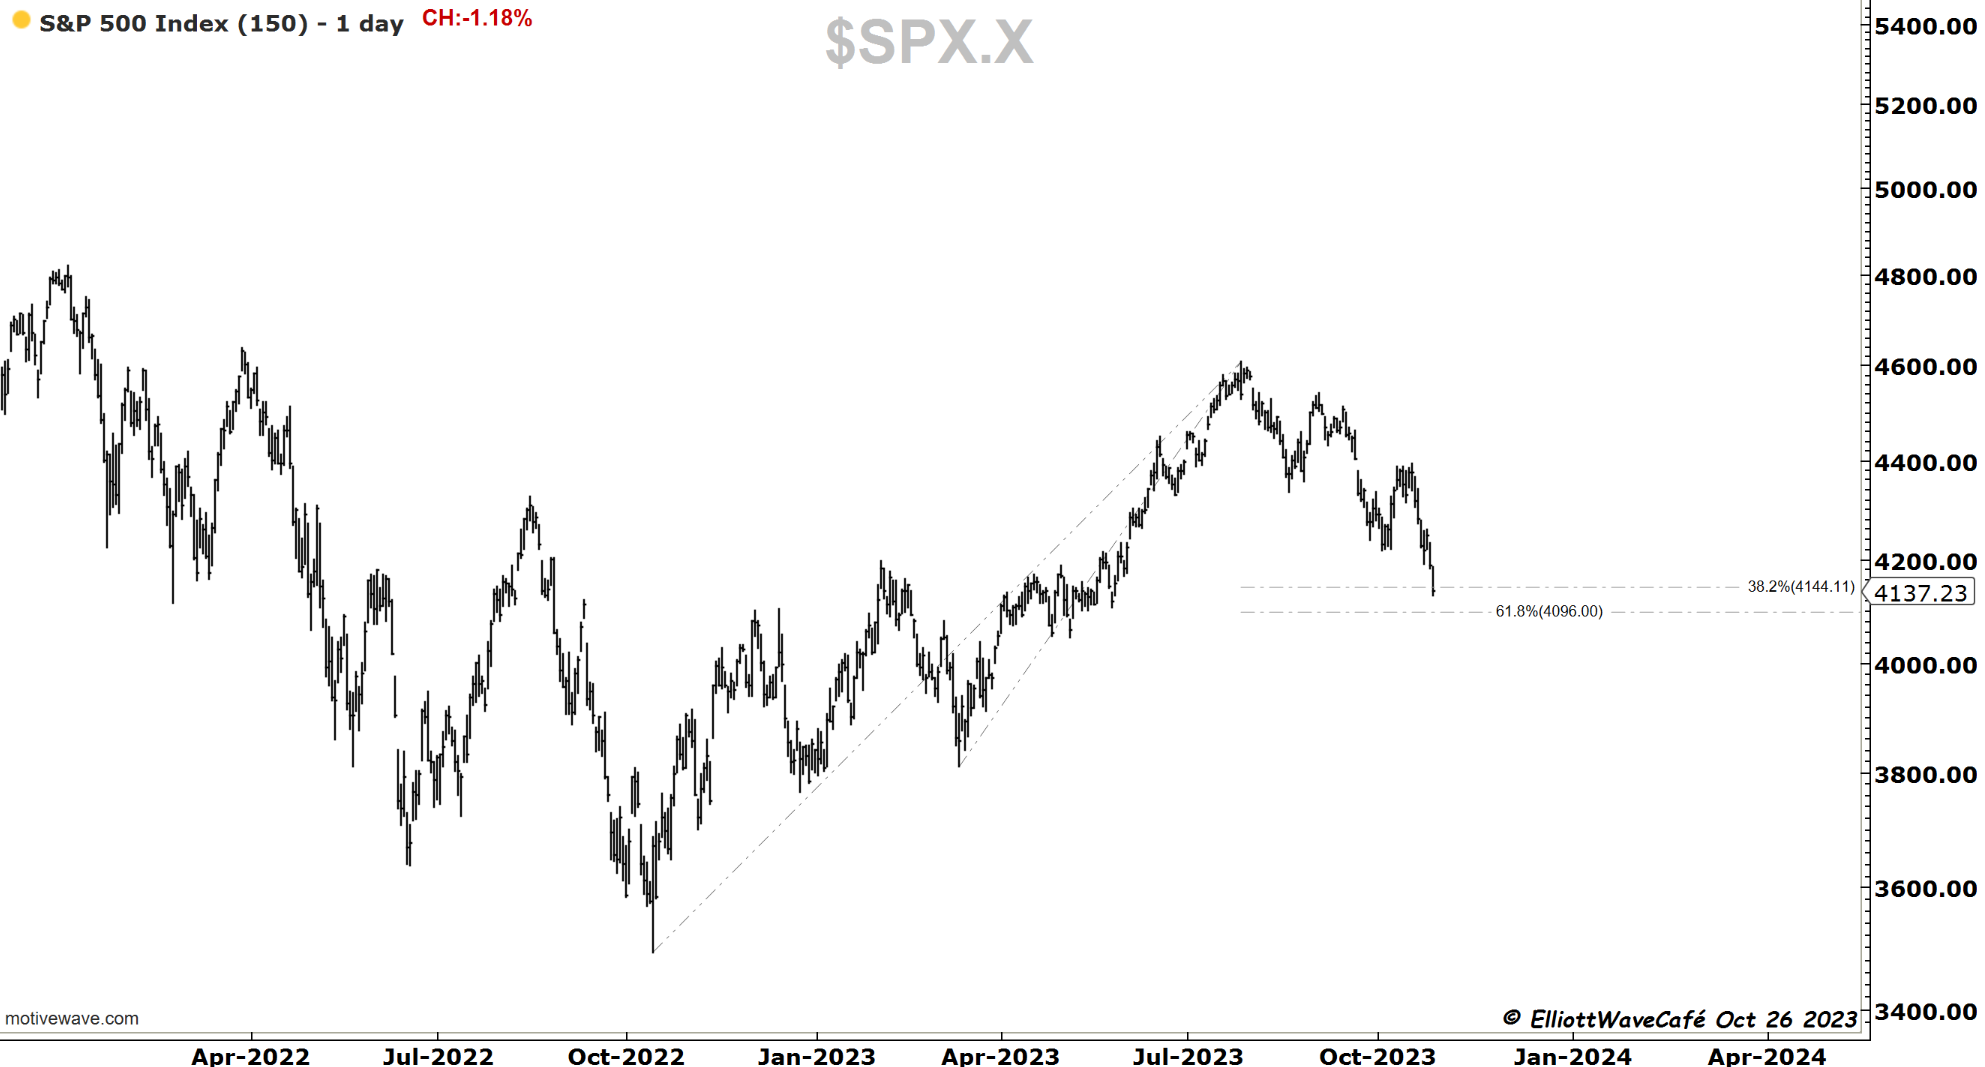
There is a 61.8% fib zone from March lows and a 38.2% fib from Oct ‘22 lows.
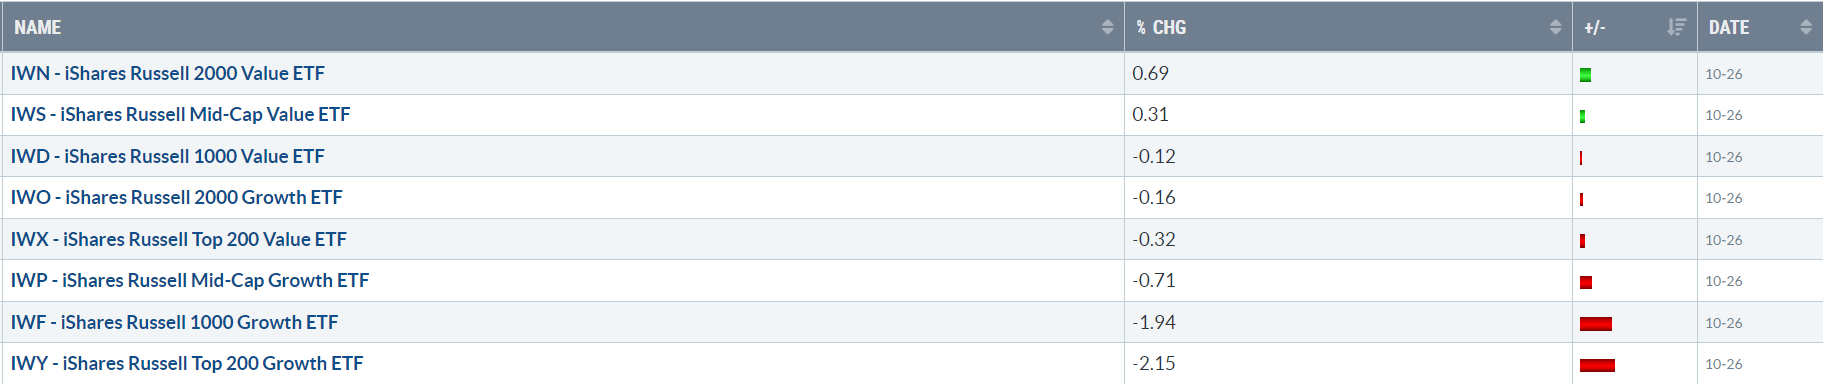
Here is the performance today, with the Top 200 growth names getting hit -2.15% while small caps and midcaps closed positive. These stocks have a much larger impact on the market behavior hence when they get hit we get heavier indices selloffs. Most of the other smaller stocks have been declining for a while and probably ran out of sellers at this juncture.
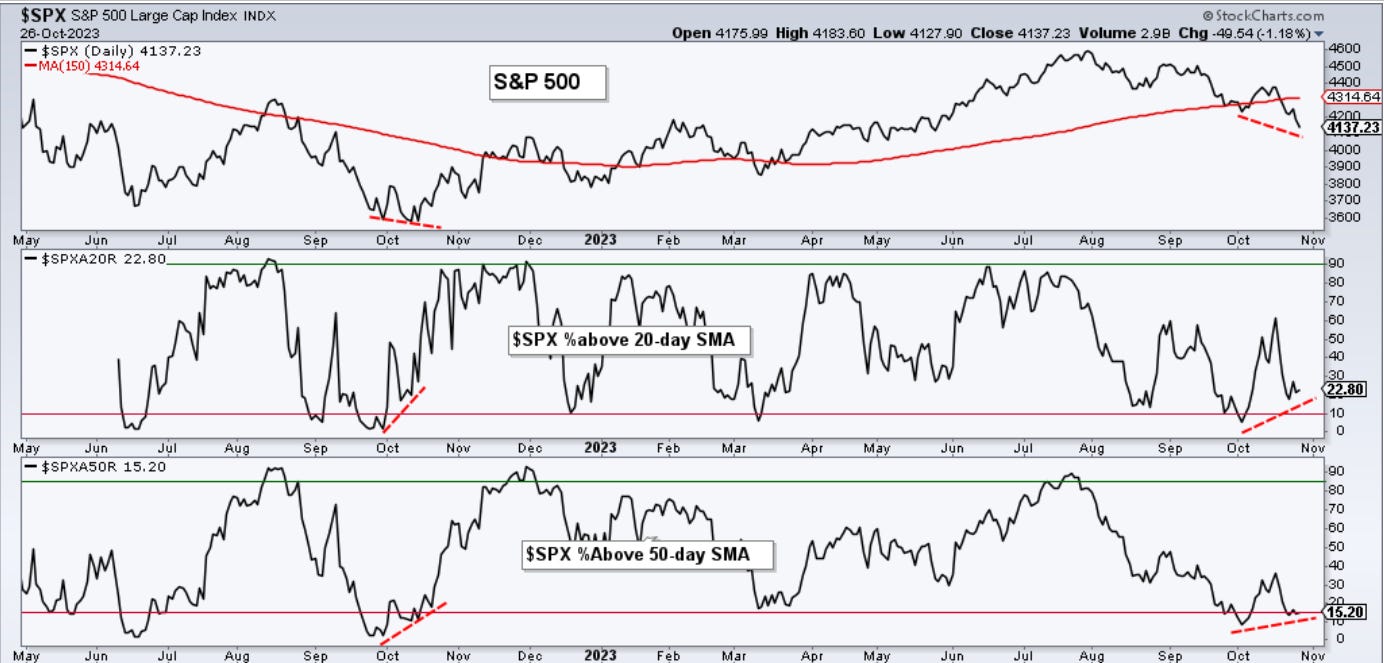
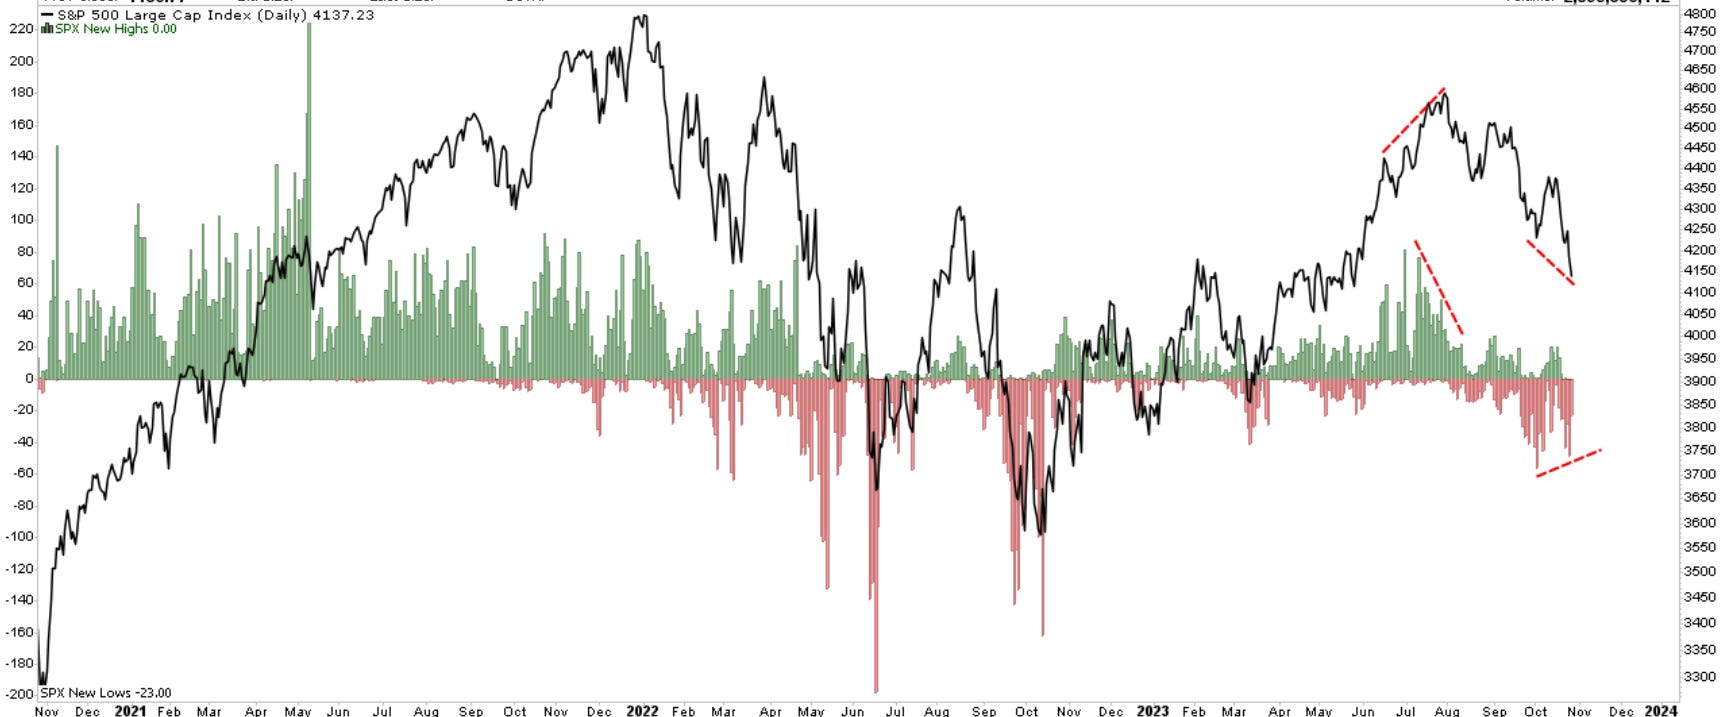
Here are stocks above 20 and 50day in the Sp500 holding strong on a tape that’s making new lows. The last time we had this type of development was a year ago before we started rallying and formed the low.
Here is the new highs vs new lows chart and it’s starting to show improvement on a declining tape.
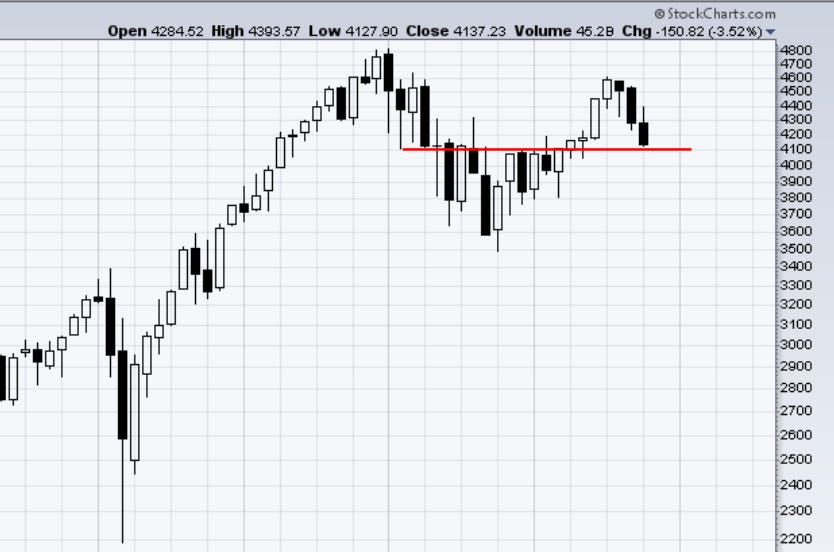
Here is the monthly chart of the Sp500 and the bulk of candles near the 4100 level. With 3 trading days left in this month, I would keep a close eye on this one. For those investing longer term, the risk-reward here seems quite appealing if this is just a re-test of the breakout zone from earlier this year.
Nasdaq100
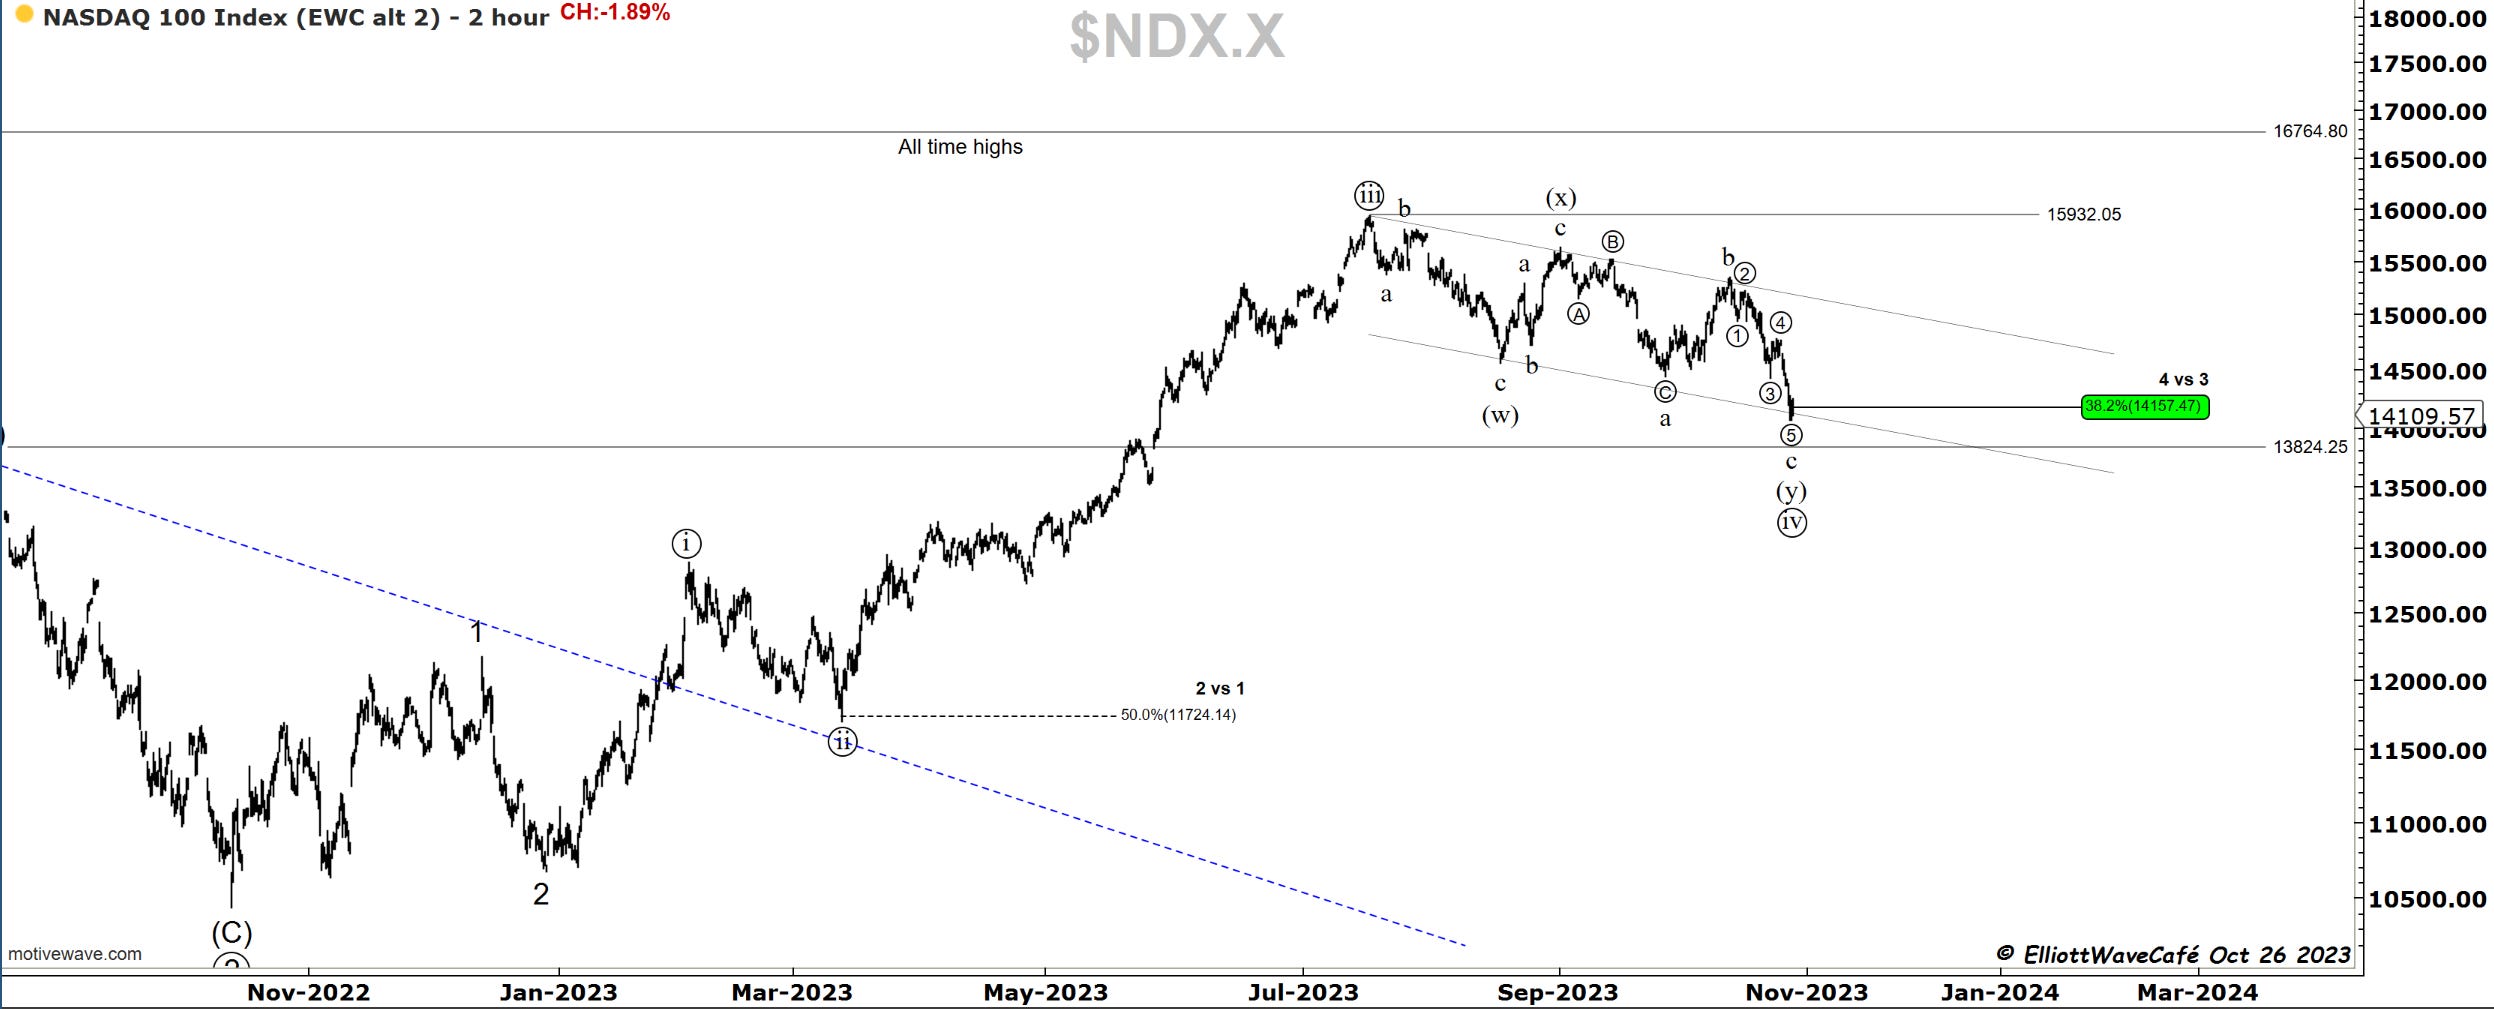
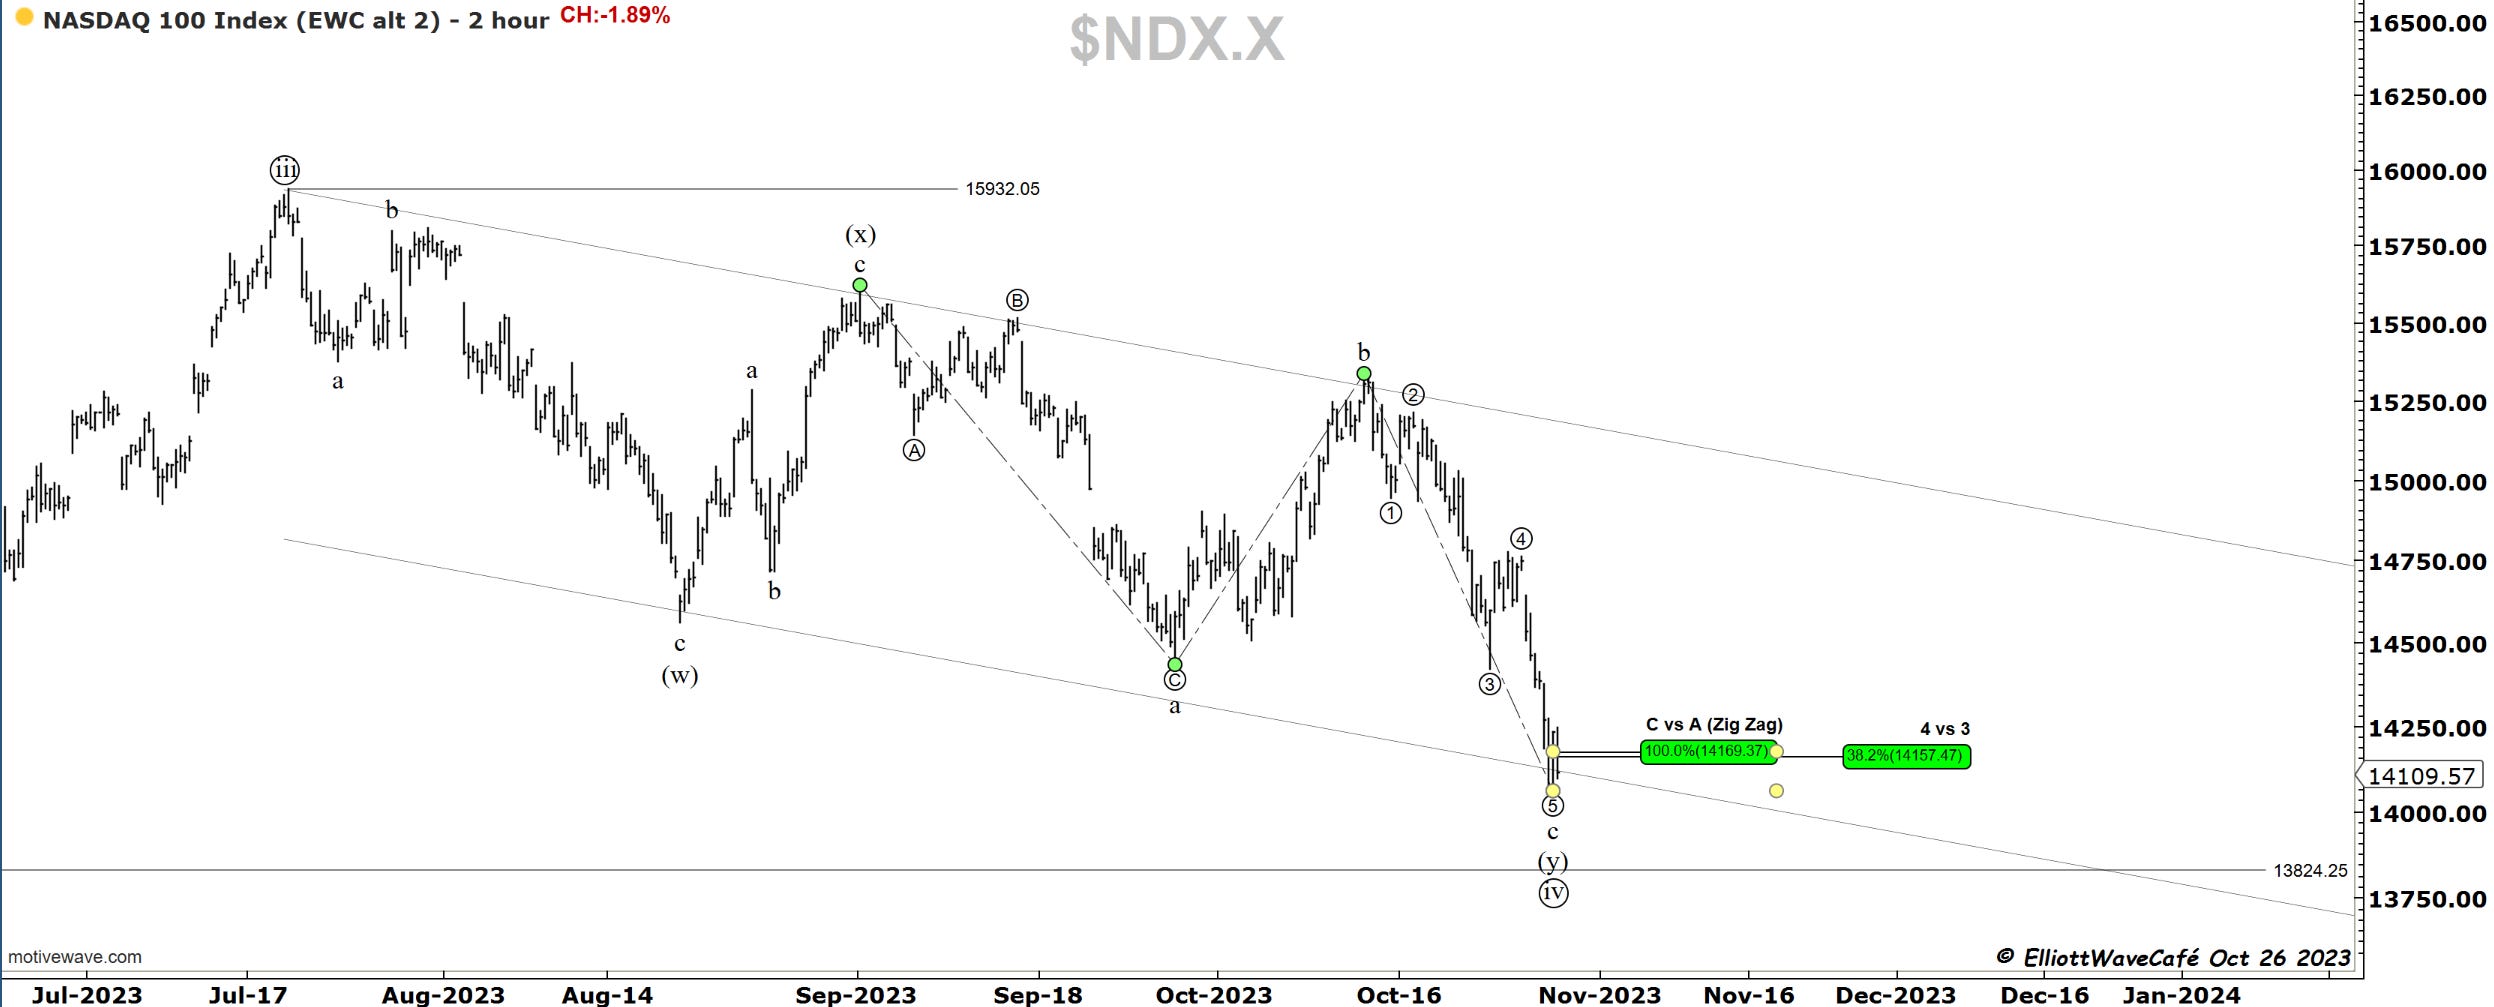
The Nasdaq correction is becoming clearer. We seem to be in double three formation, where the first (w) was a zigzag followed by a flat in wave (y). We have also hit the 38.2% for a standard wave ((iv)) throwback. The Aug ‘22 highs are also just slightly below. Notice on the second chart the 100% equality of c vs a .
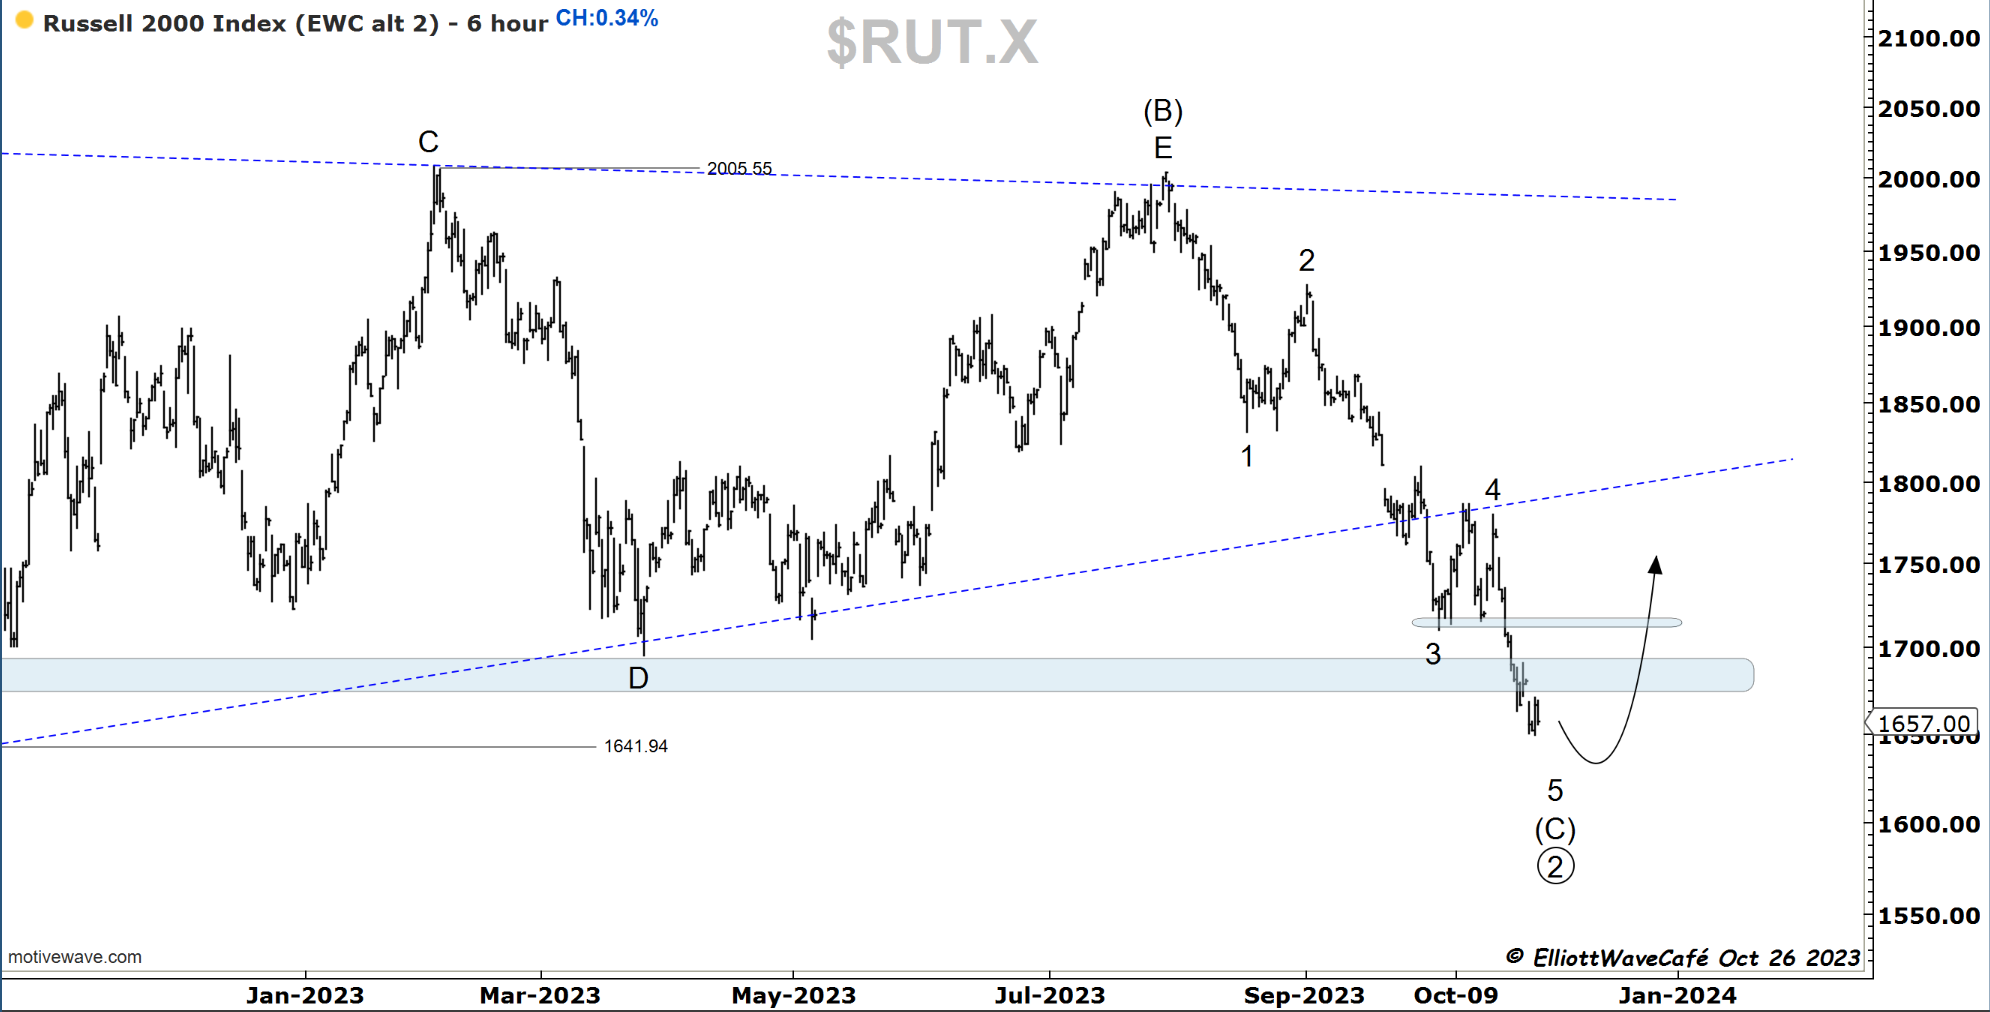
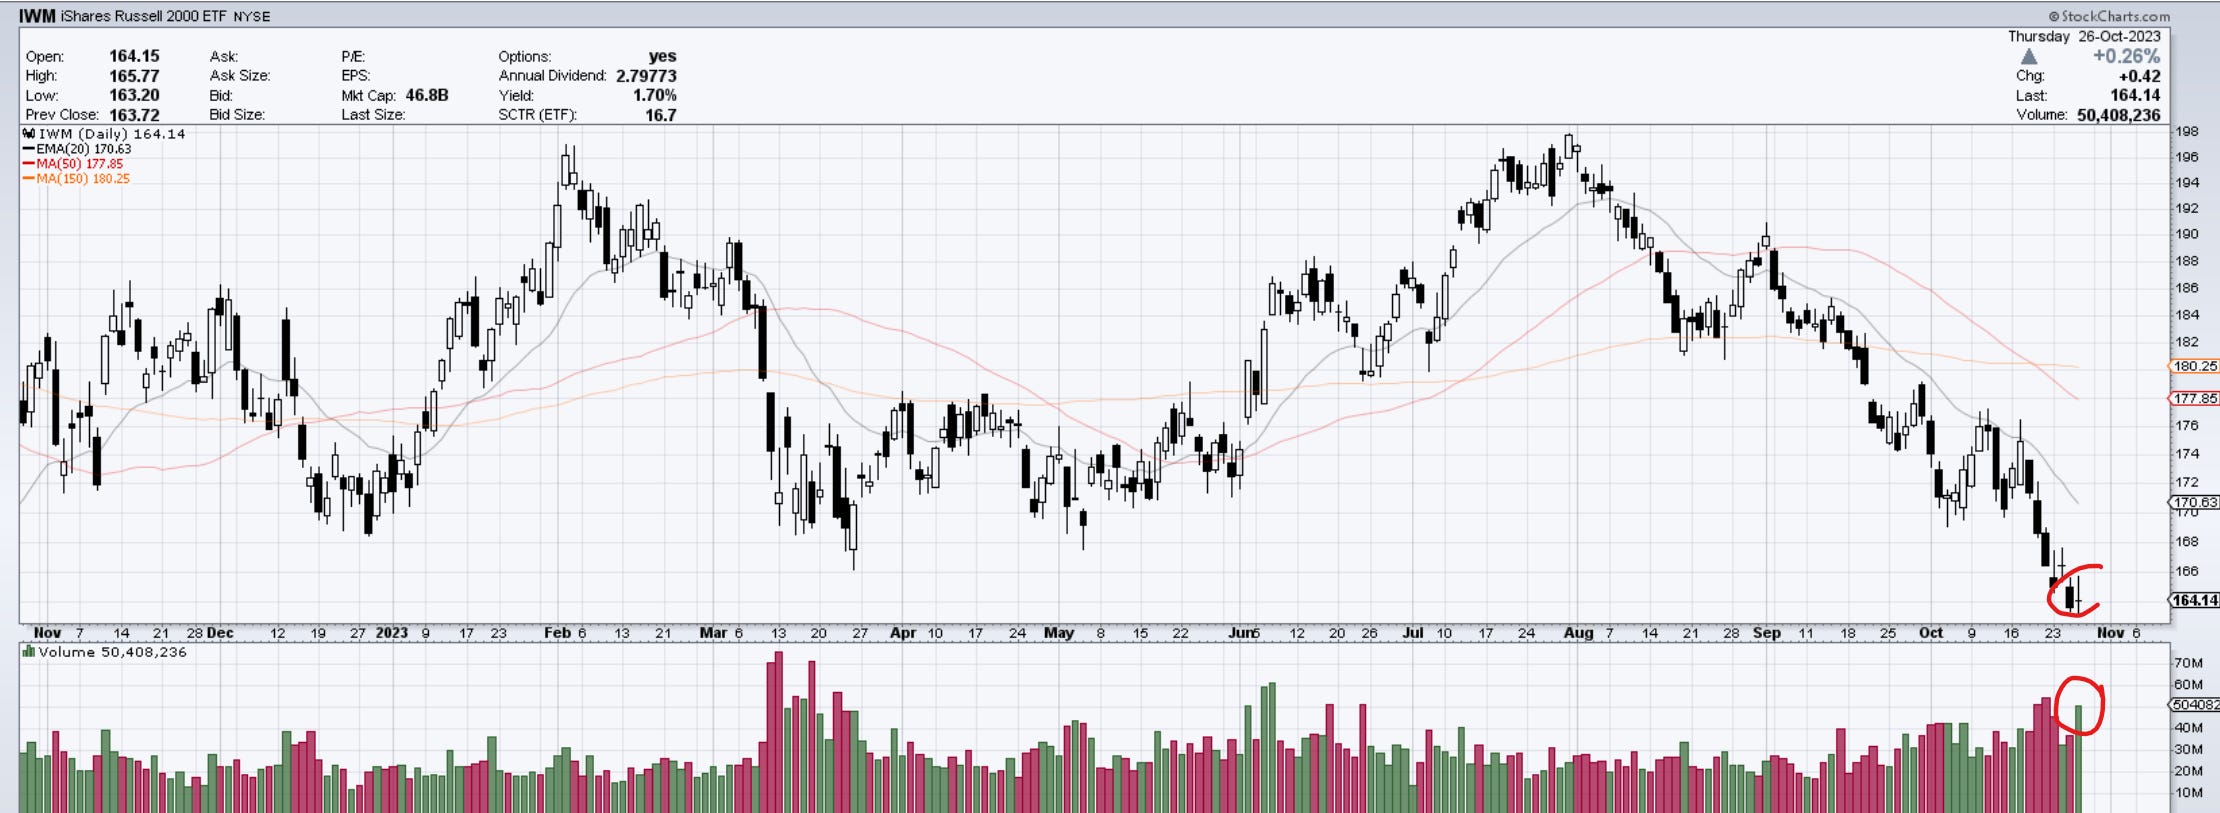
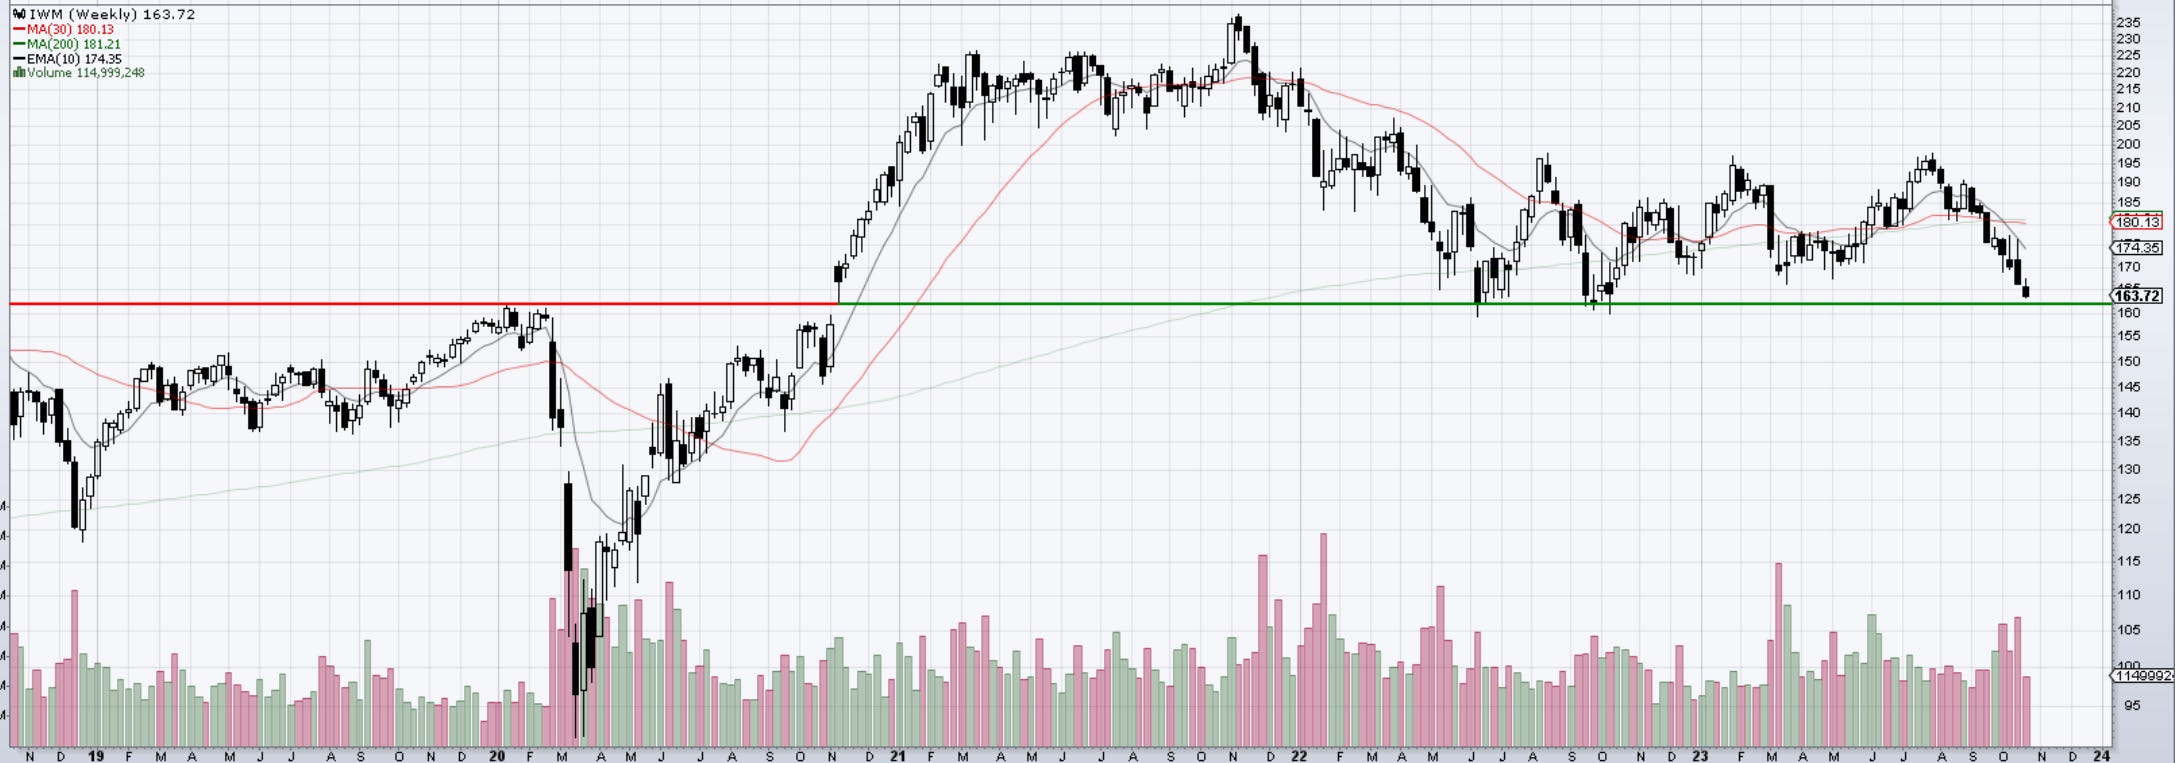
RUSSELL 2000
Russell closed positive today and the wave count suggests a move higher is nearby. The second chart shows today inside bar along with strong bullish volume on IWM. The third chart is the same longer-term demand zone.
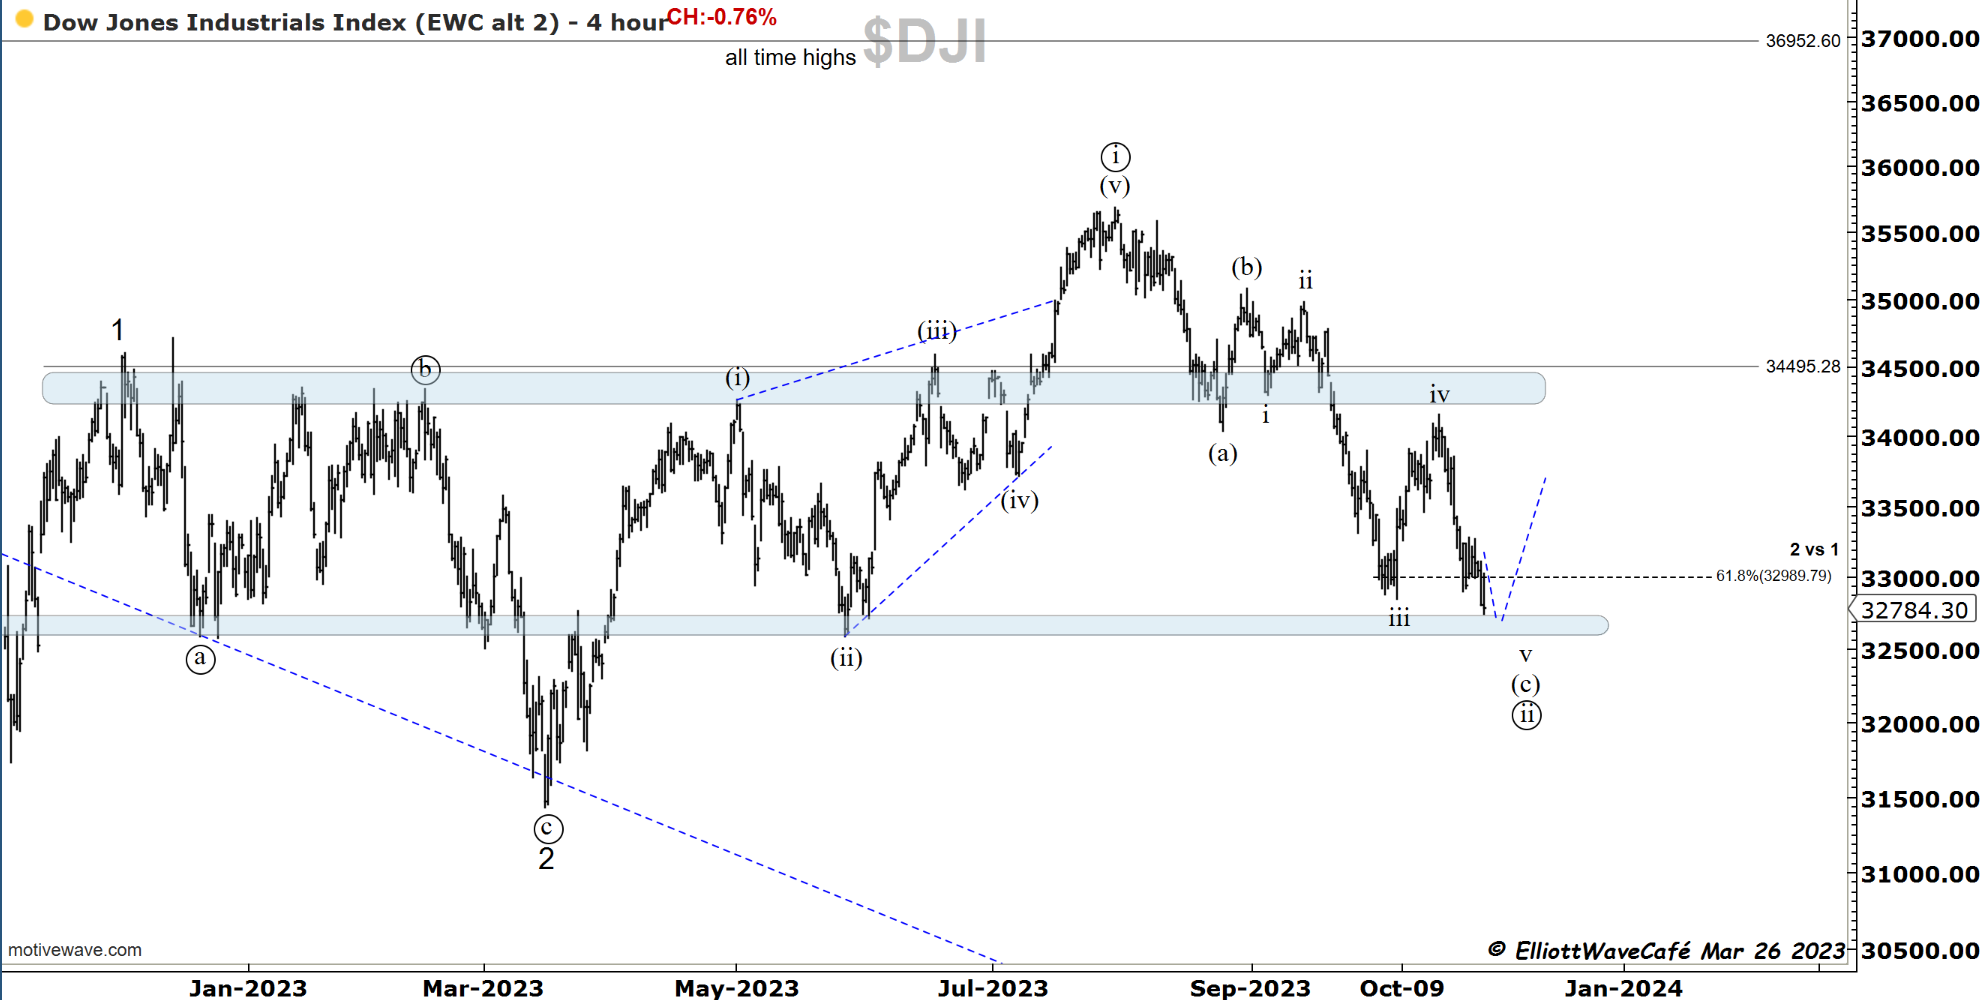
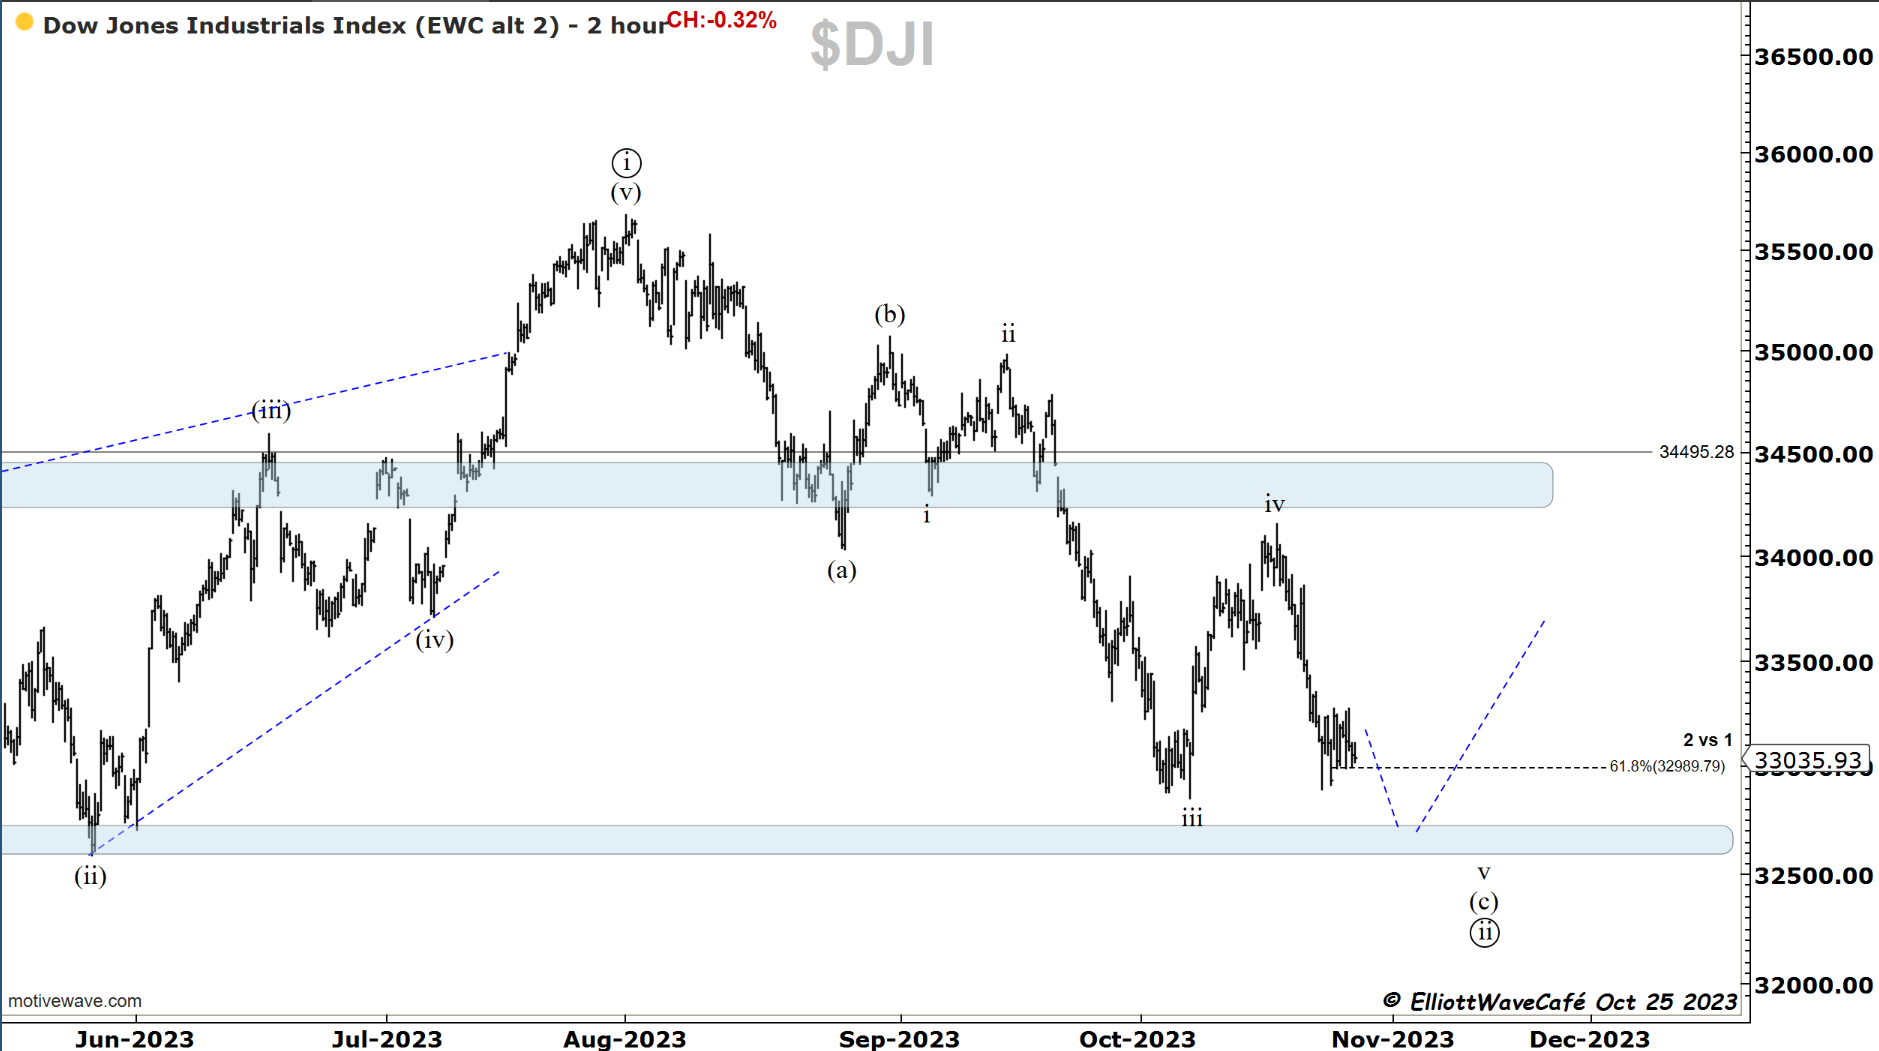
Dow30
Dow gave us the drop we were looking for to try to complete the declining sequence. Right into that band of support. Let’s see if the next step is higher, but I would want to see it above 33600 to secure the low.
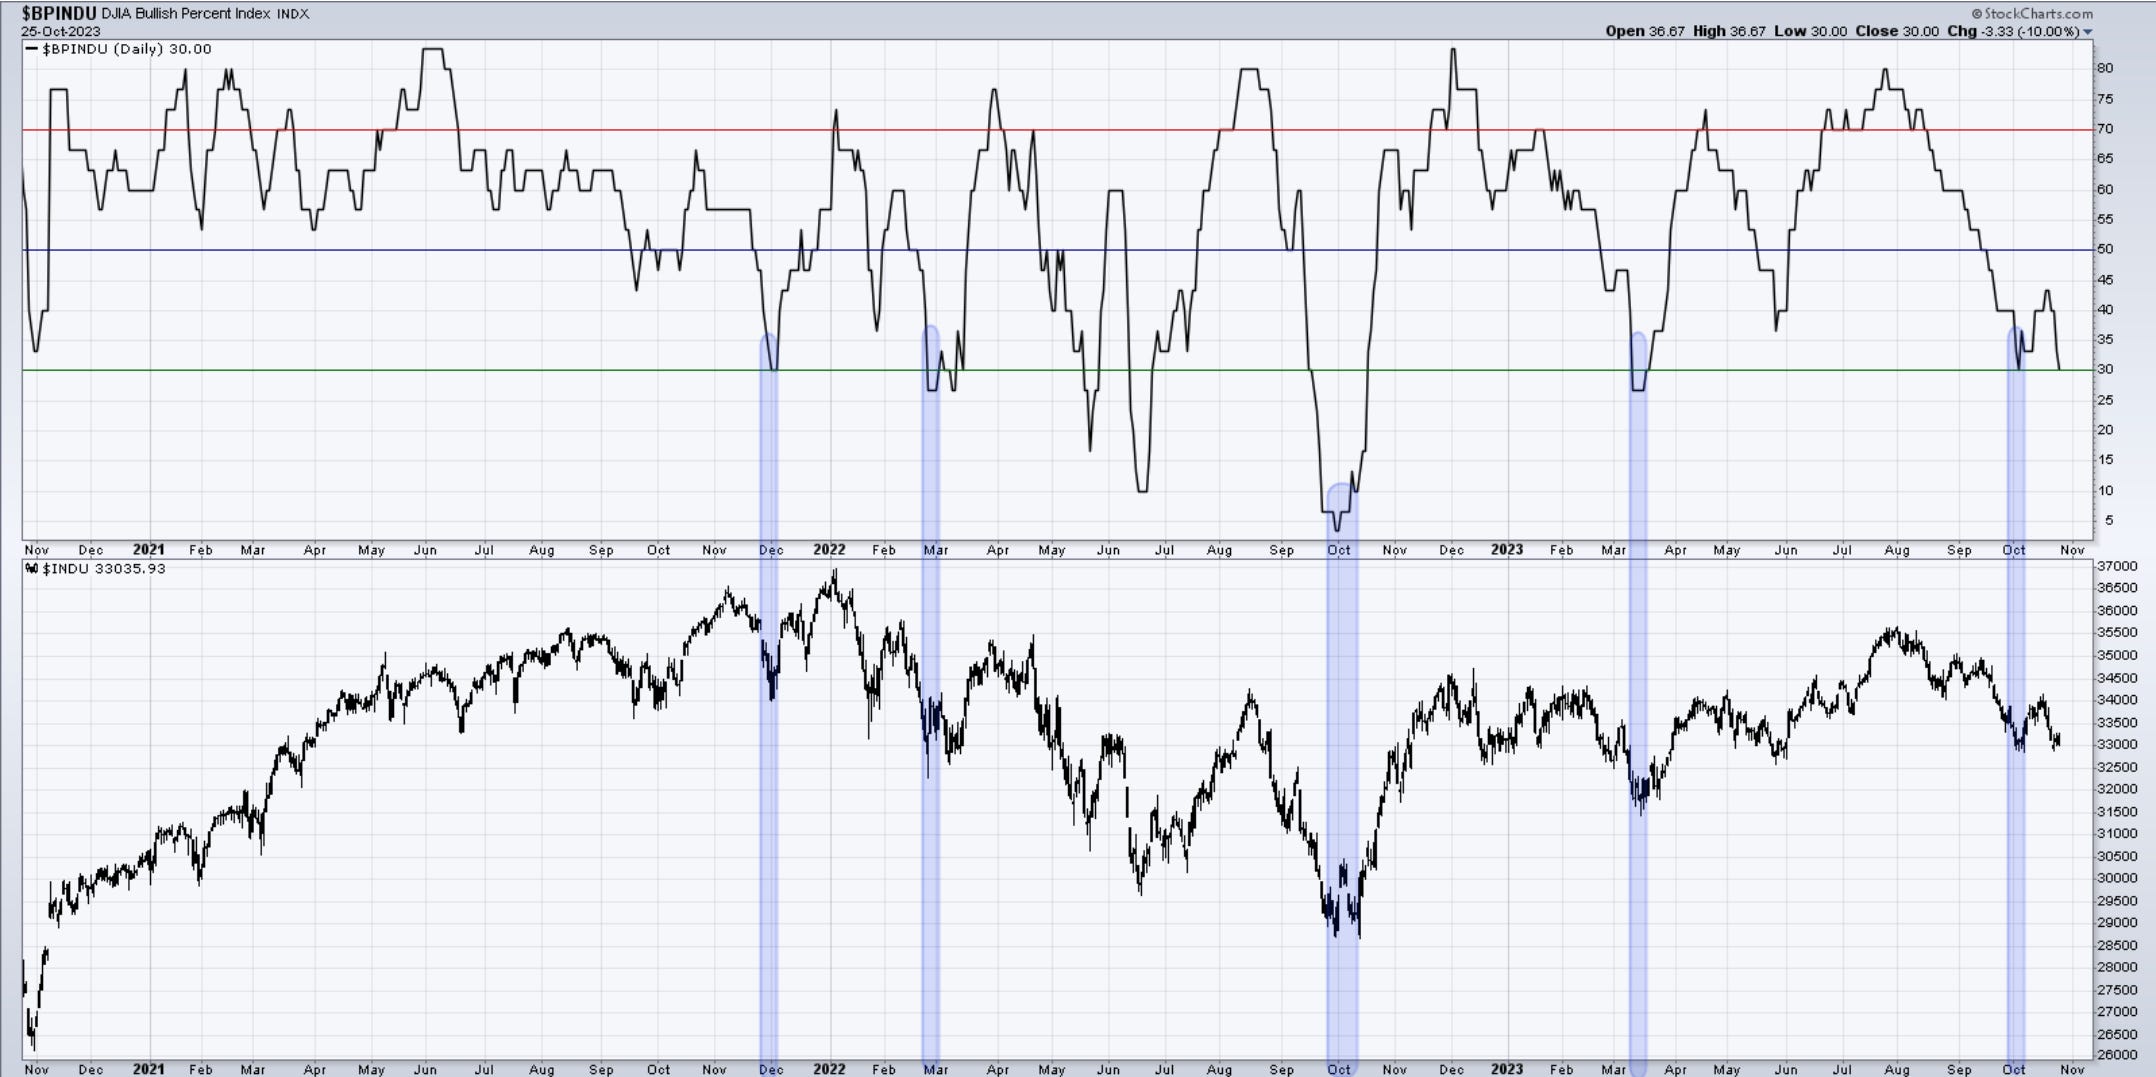
Here too the BPI is telling us to be careful on the short-side bets
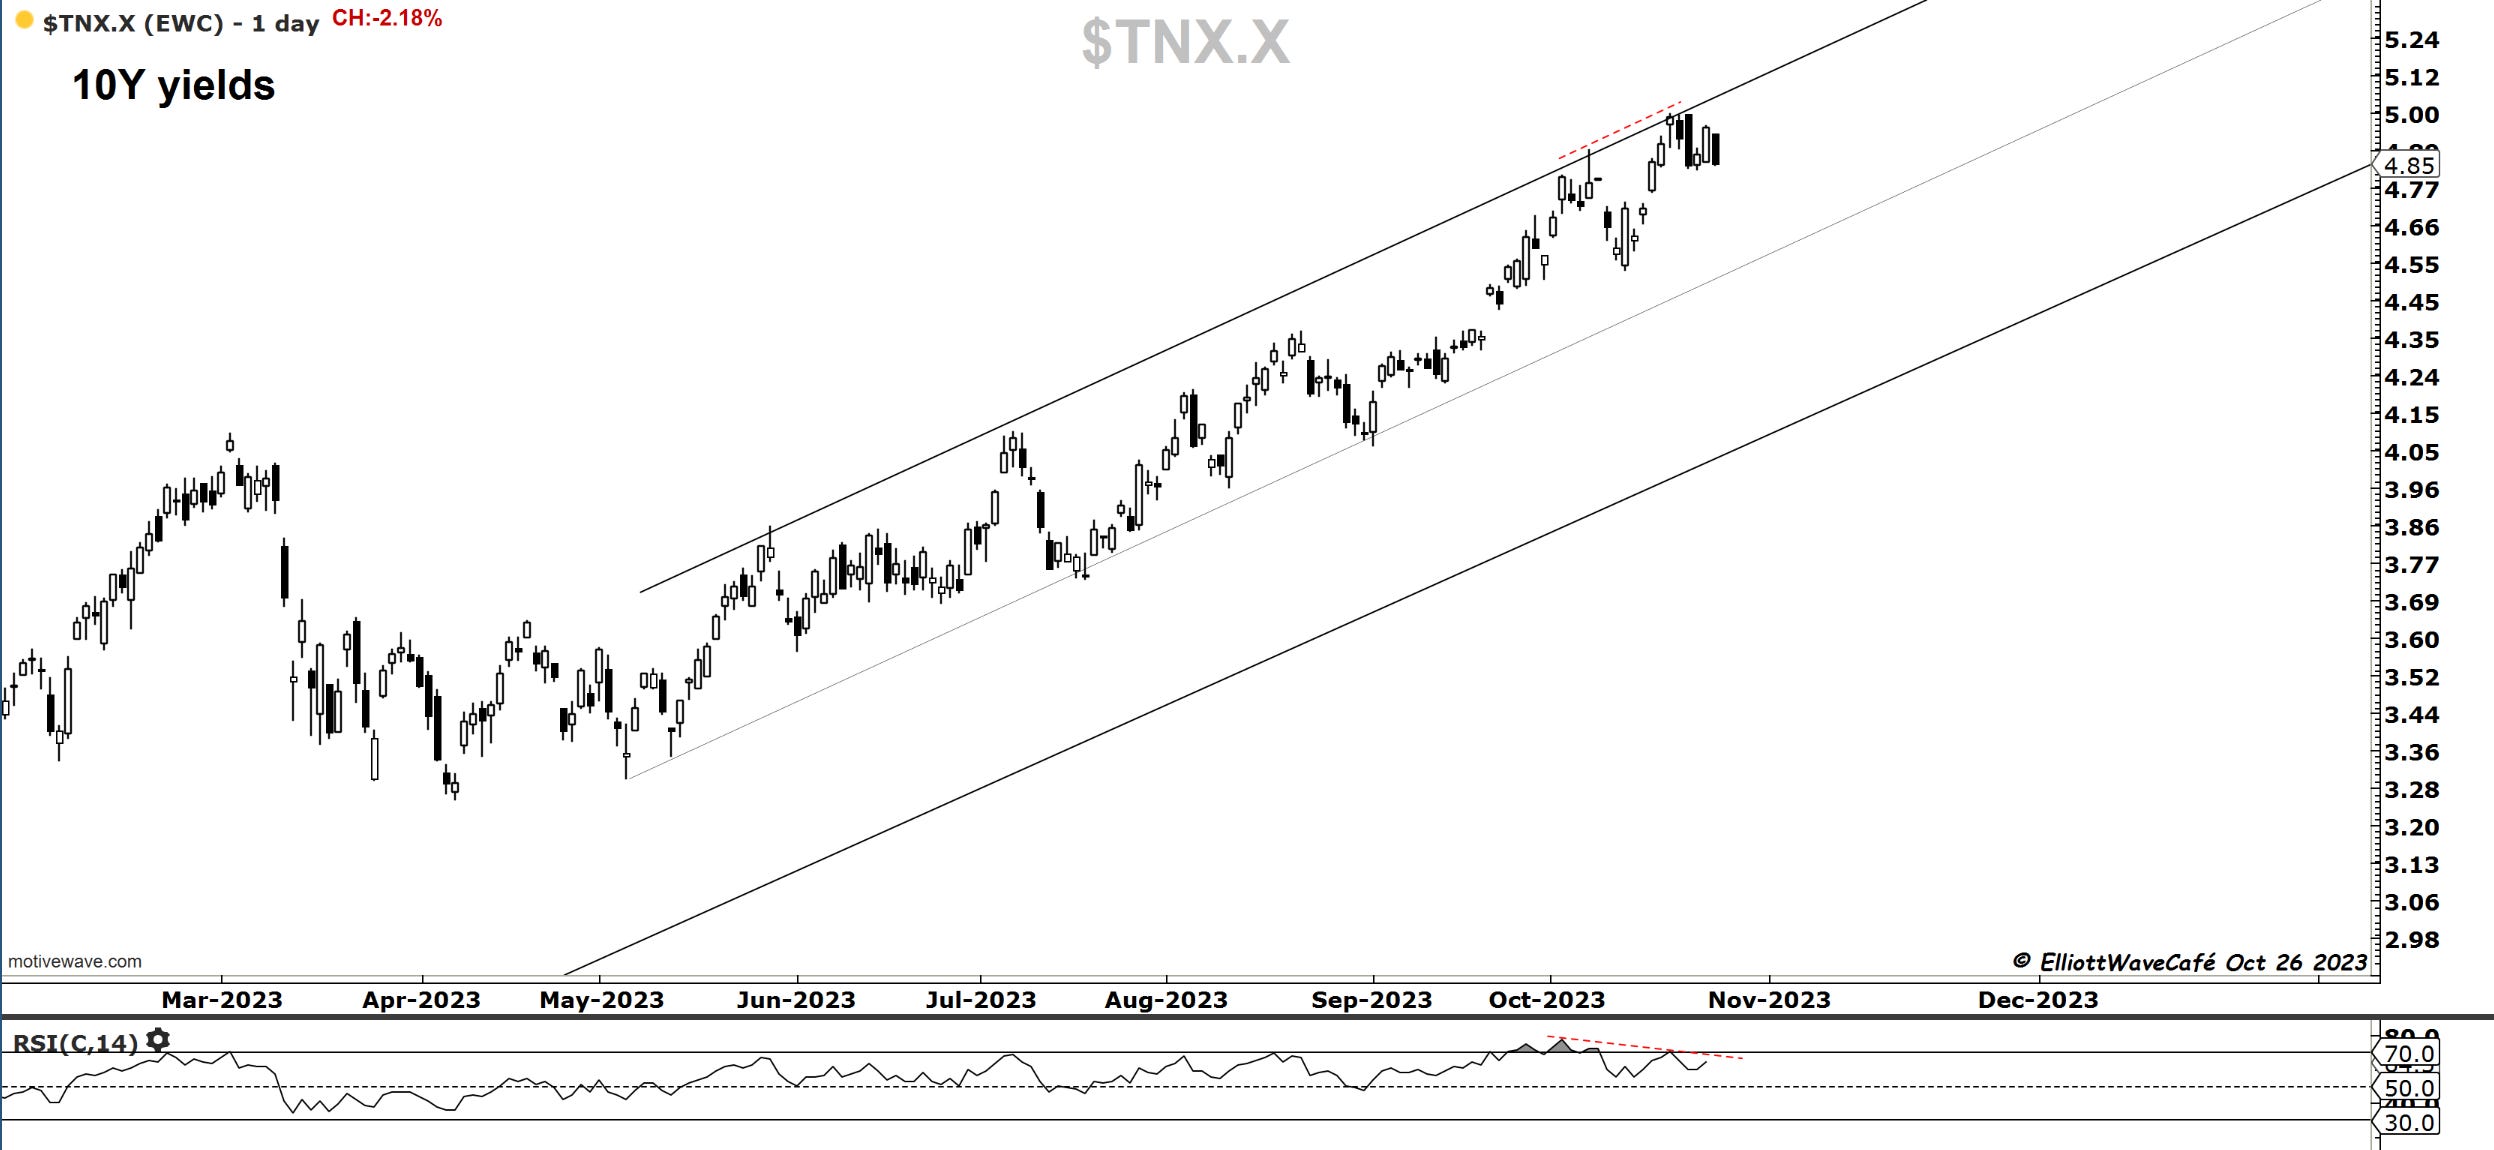
US Dollar and Yields
If it’s a flat in the dollar it should be like this. It has been selling off a bit but really it needs to break below 106 to get the flat odds higher.
Yields have been pulling in some more and that is helpful for risk assets. Price will probably target the lower channel boundaries. Momentum is on the decline.
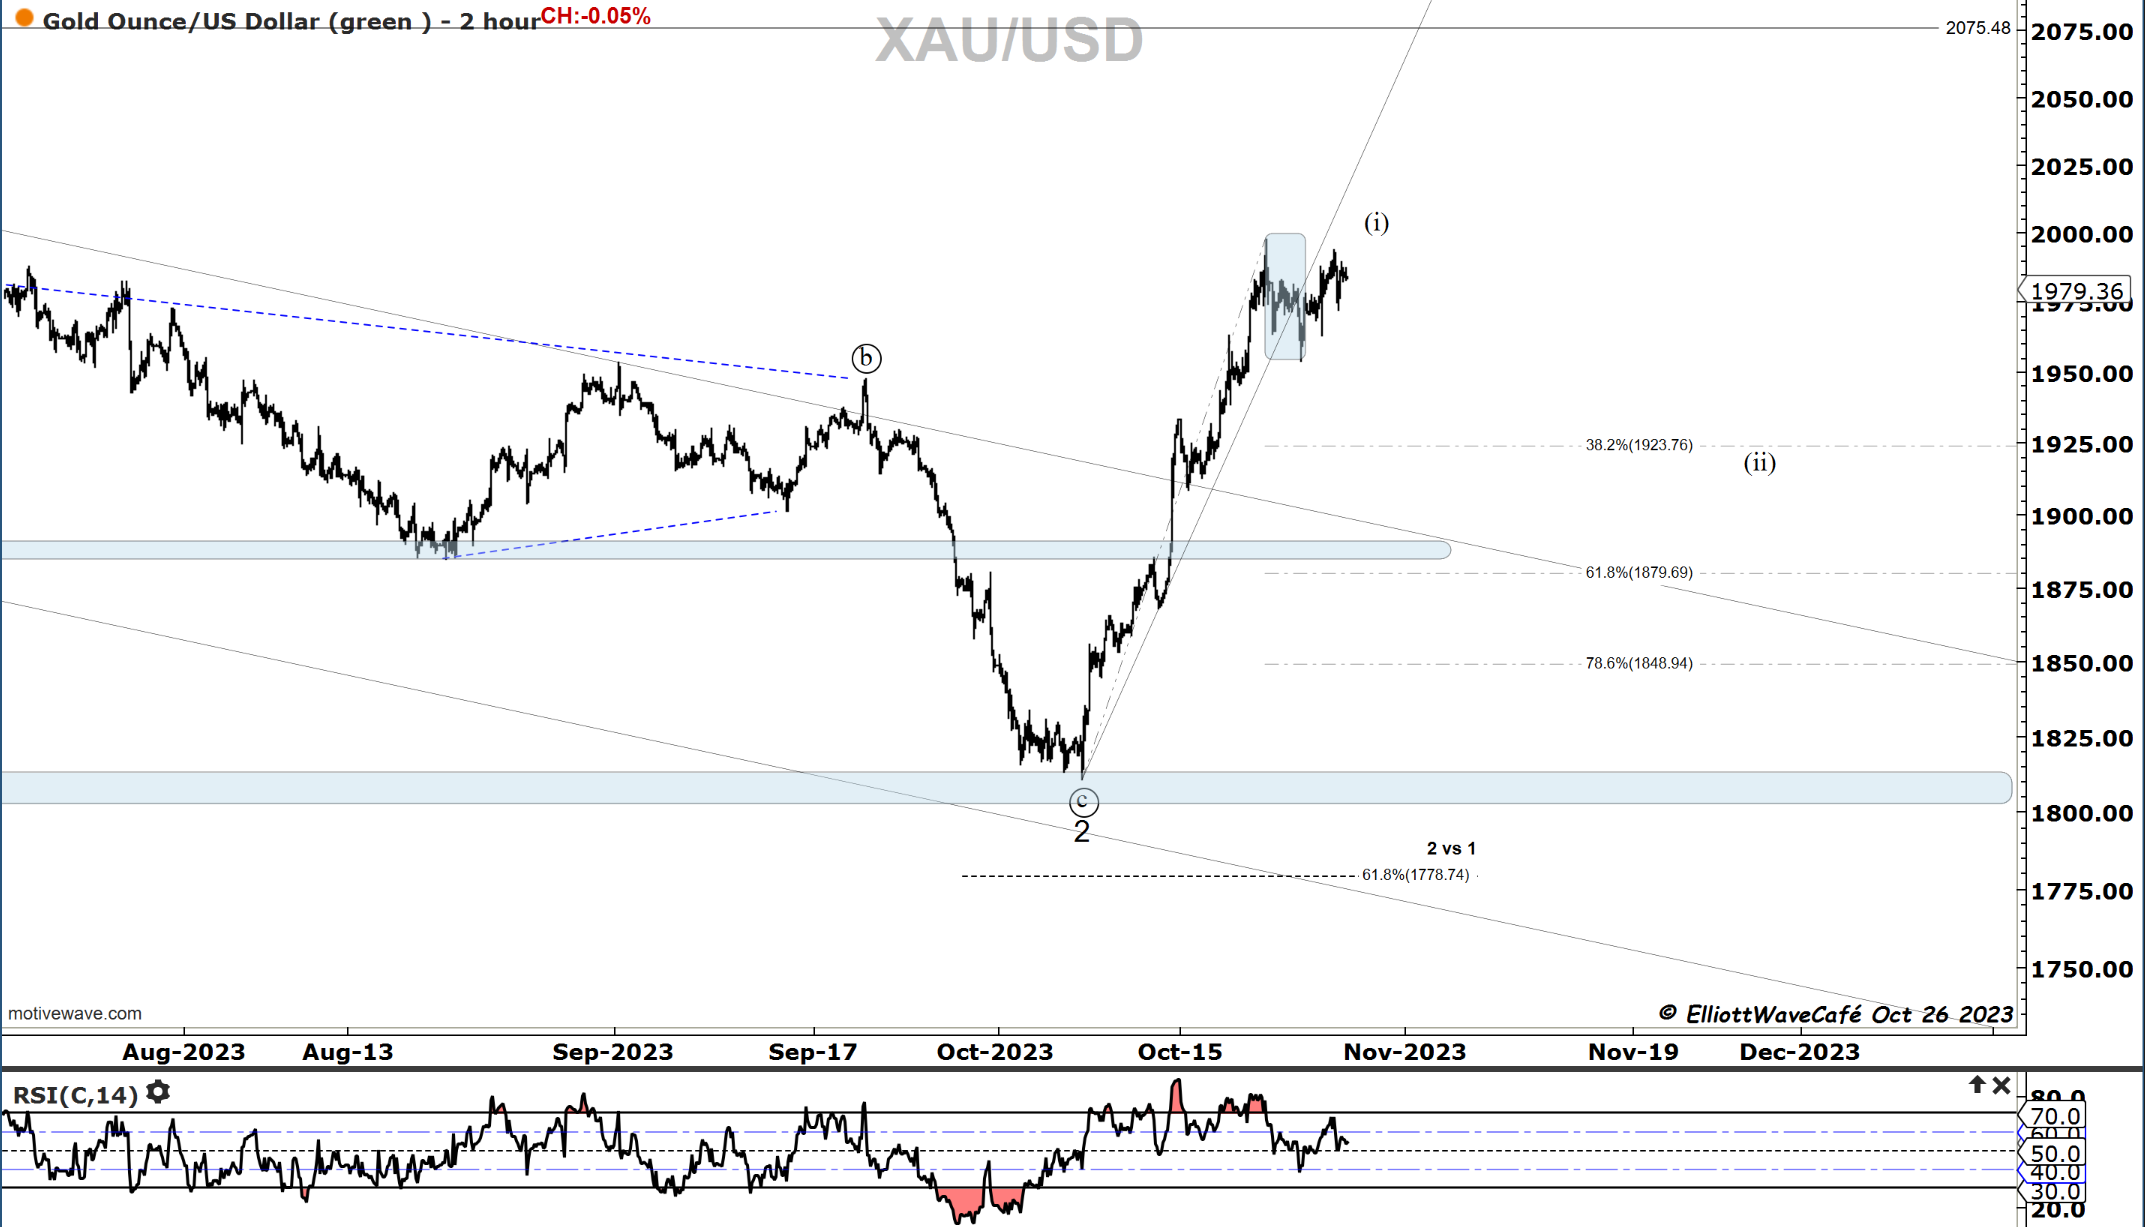
Gold
Gold sharp trendline is violated, momentum abating, I think the correction in Gold is underway and it will take a few weeks to unfold.
Bitcoin
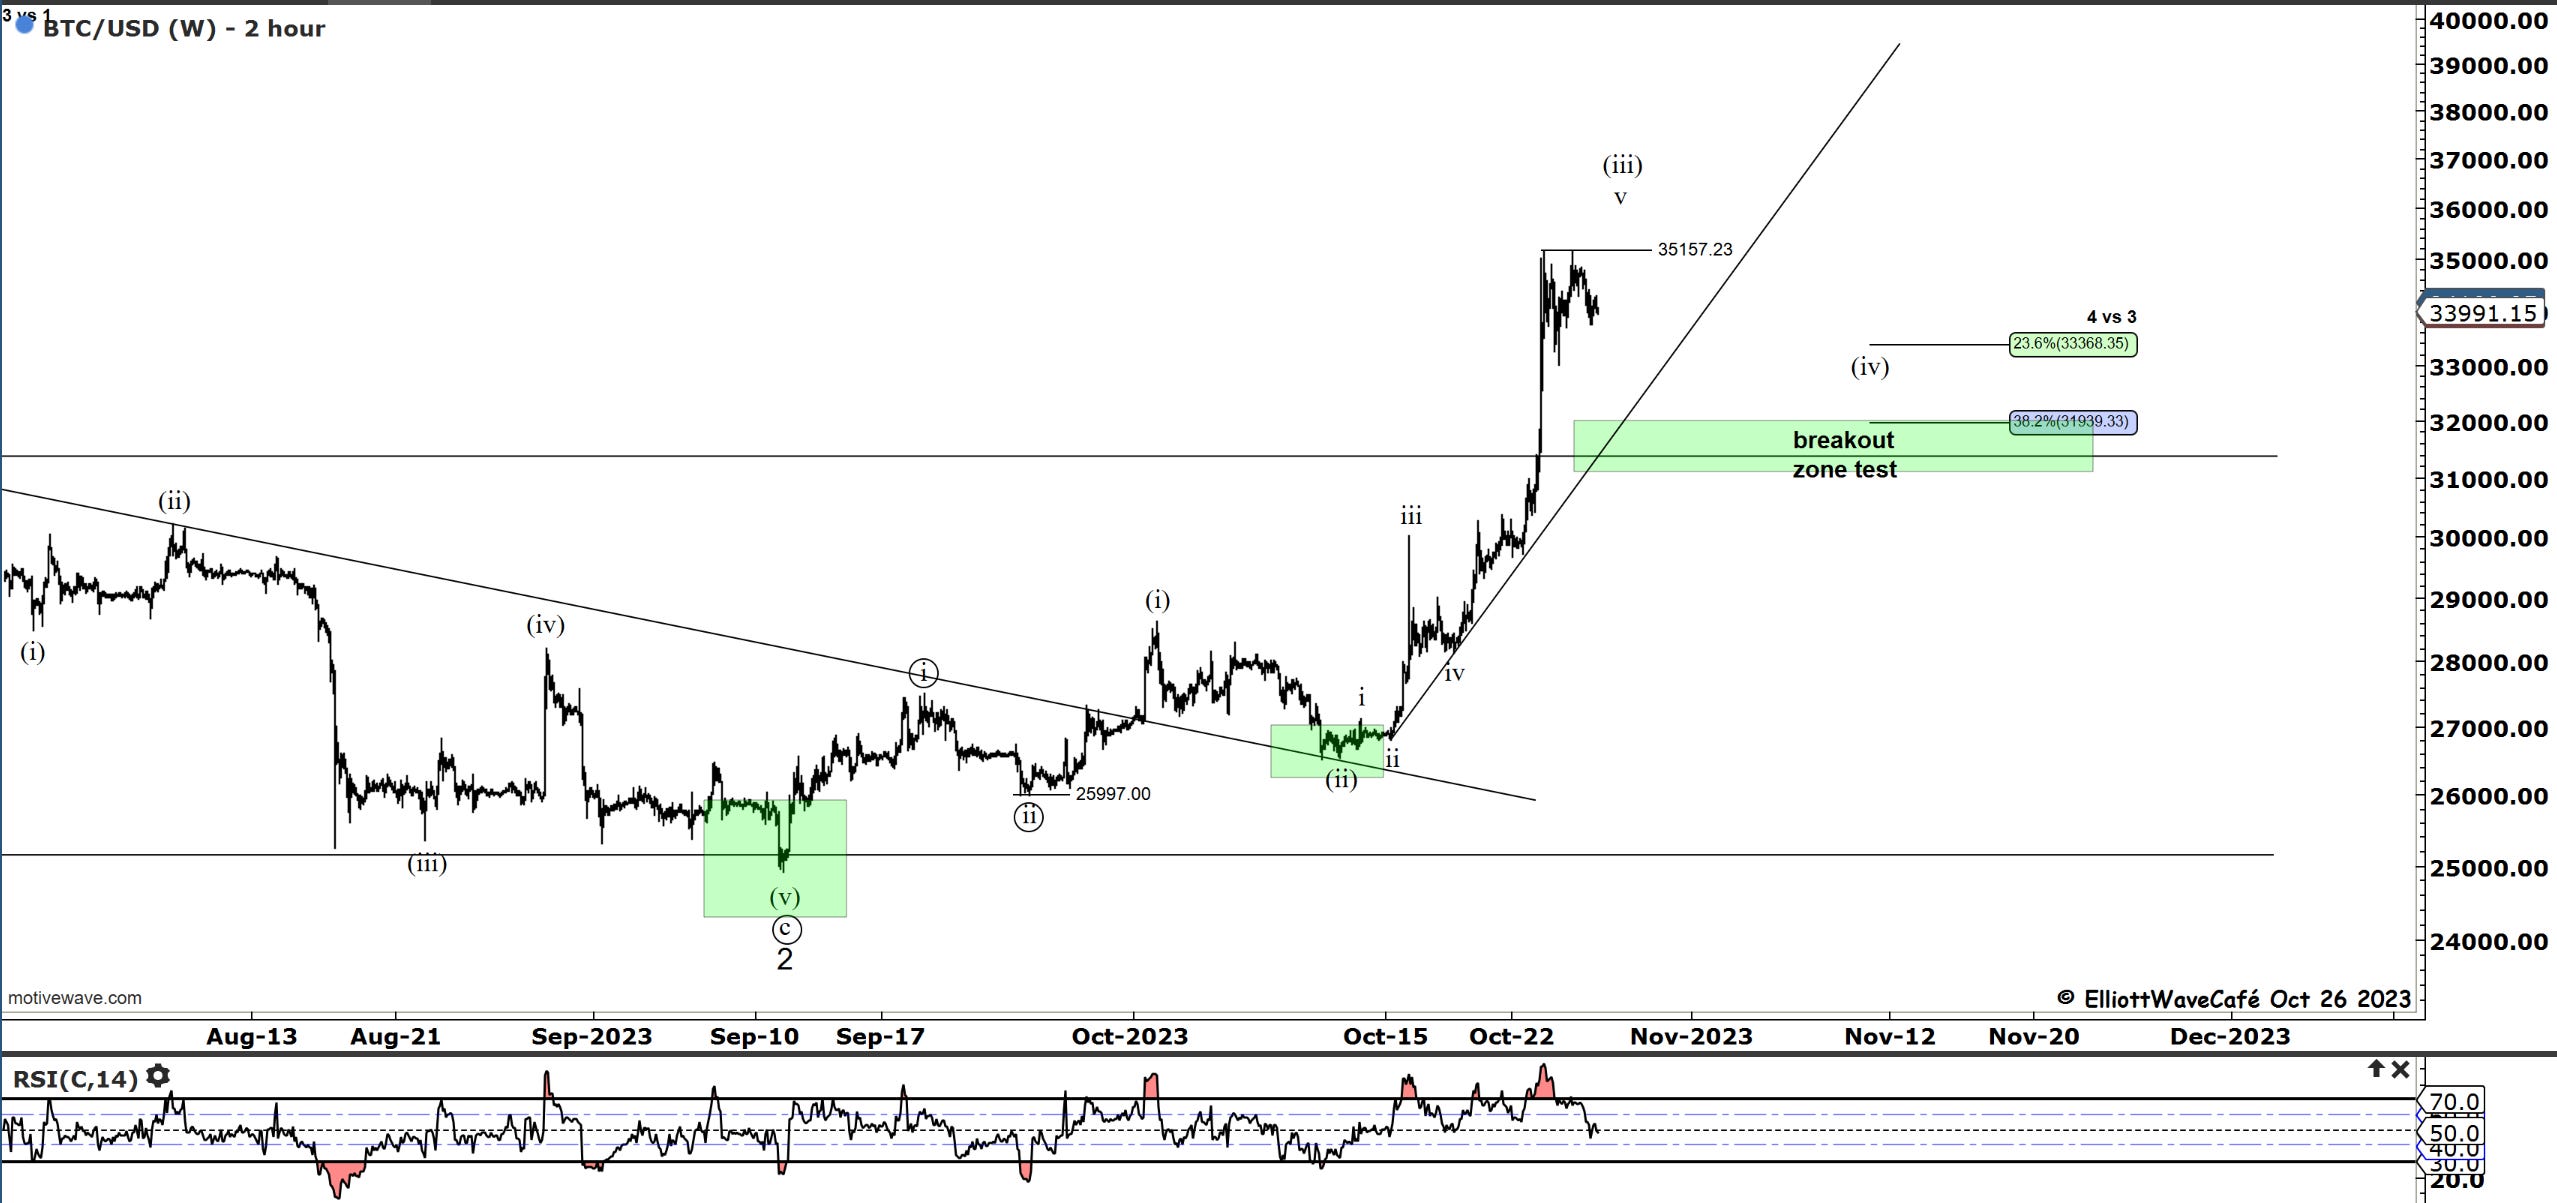
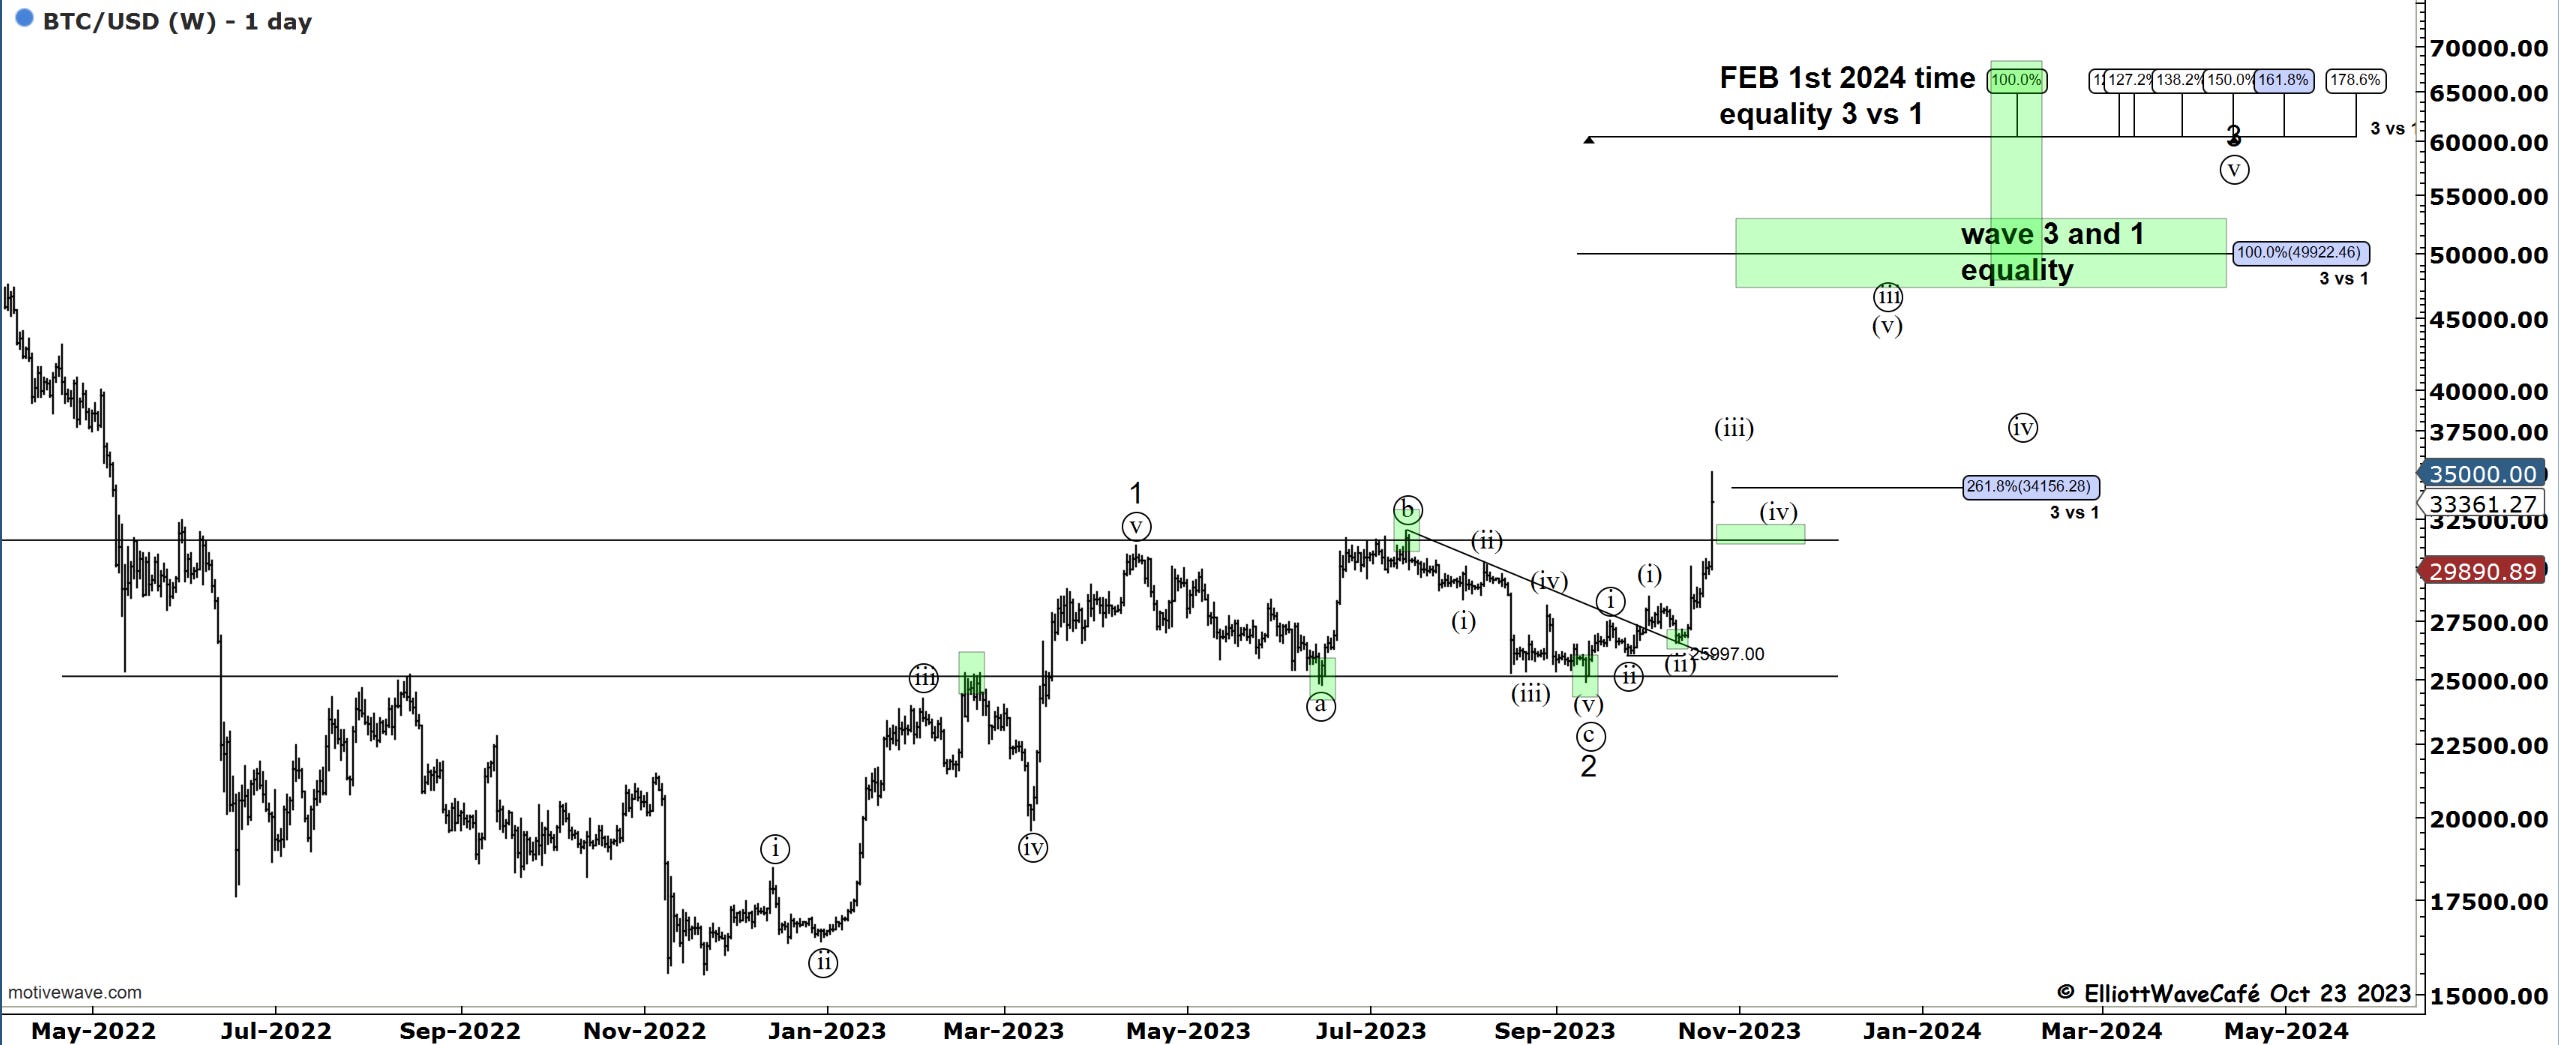
No changes in BTC outlook.. prior comments stand. I would keep an eye on that trendline for reactions there.
As expected BTC is trying to finish off a wave (iii) advance. It has tried once again to test 35,157. From here things might prove to be a bit more difficult and the momentum is expected to subside. It is not bearish in any way, but rather the anticipation of a wave (iv) correction is growing.
Depending on where wave (iii) actually terminates, we should have a 23 to 38.2% pullback. That puts us at the 32-33k zone initially. It should give way to the next opportunity for trading a wave (v) advance.
Daily video coming up next,
See you next week - trade well,
Cris
email: ewcafe@pm.me
Thanks Cris.
I’m curious of your thoughts on some of the capitulation on some of the big tech names. Are those the last to show weakness and capitulate further or if the market is looking to rebound will those big tech names just blip back higher? Great info here.