
The Daily Drip
Markets review, strategy and analysis
Note: The EW counts on the right edge are real-time, and they are prone to adjustments as price action develops. Elliott Wave has a fluid approach, is evidence-based, and requires constant monitoring of certain thresholds.
In the counts below, this (( )) = circle on chart
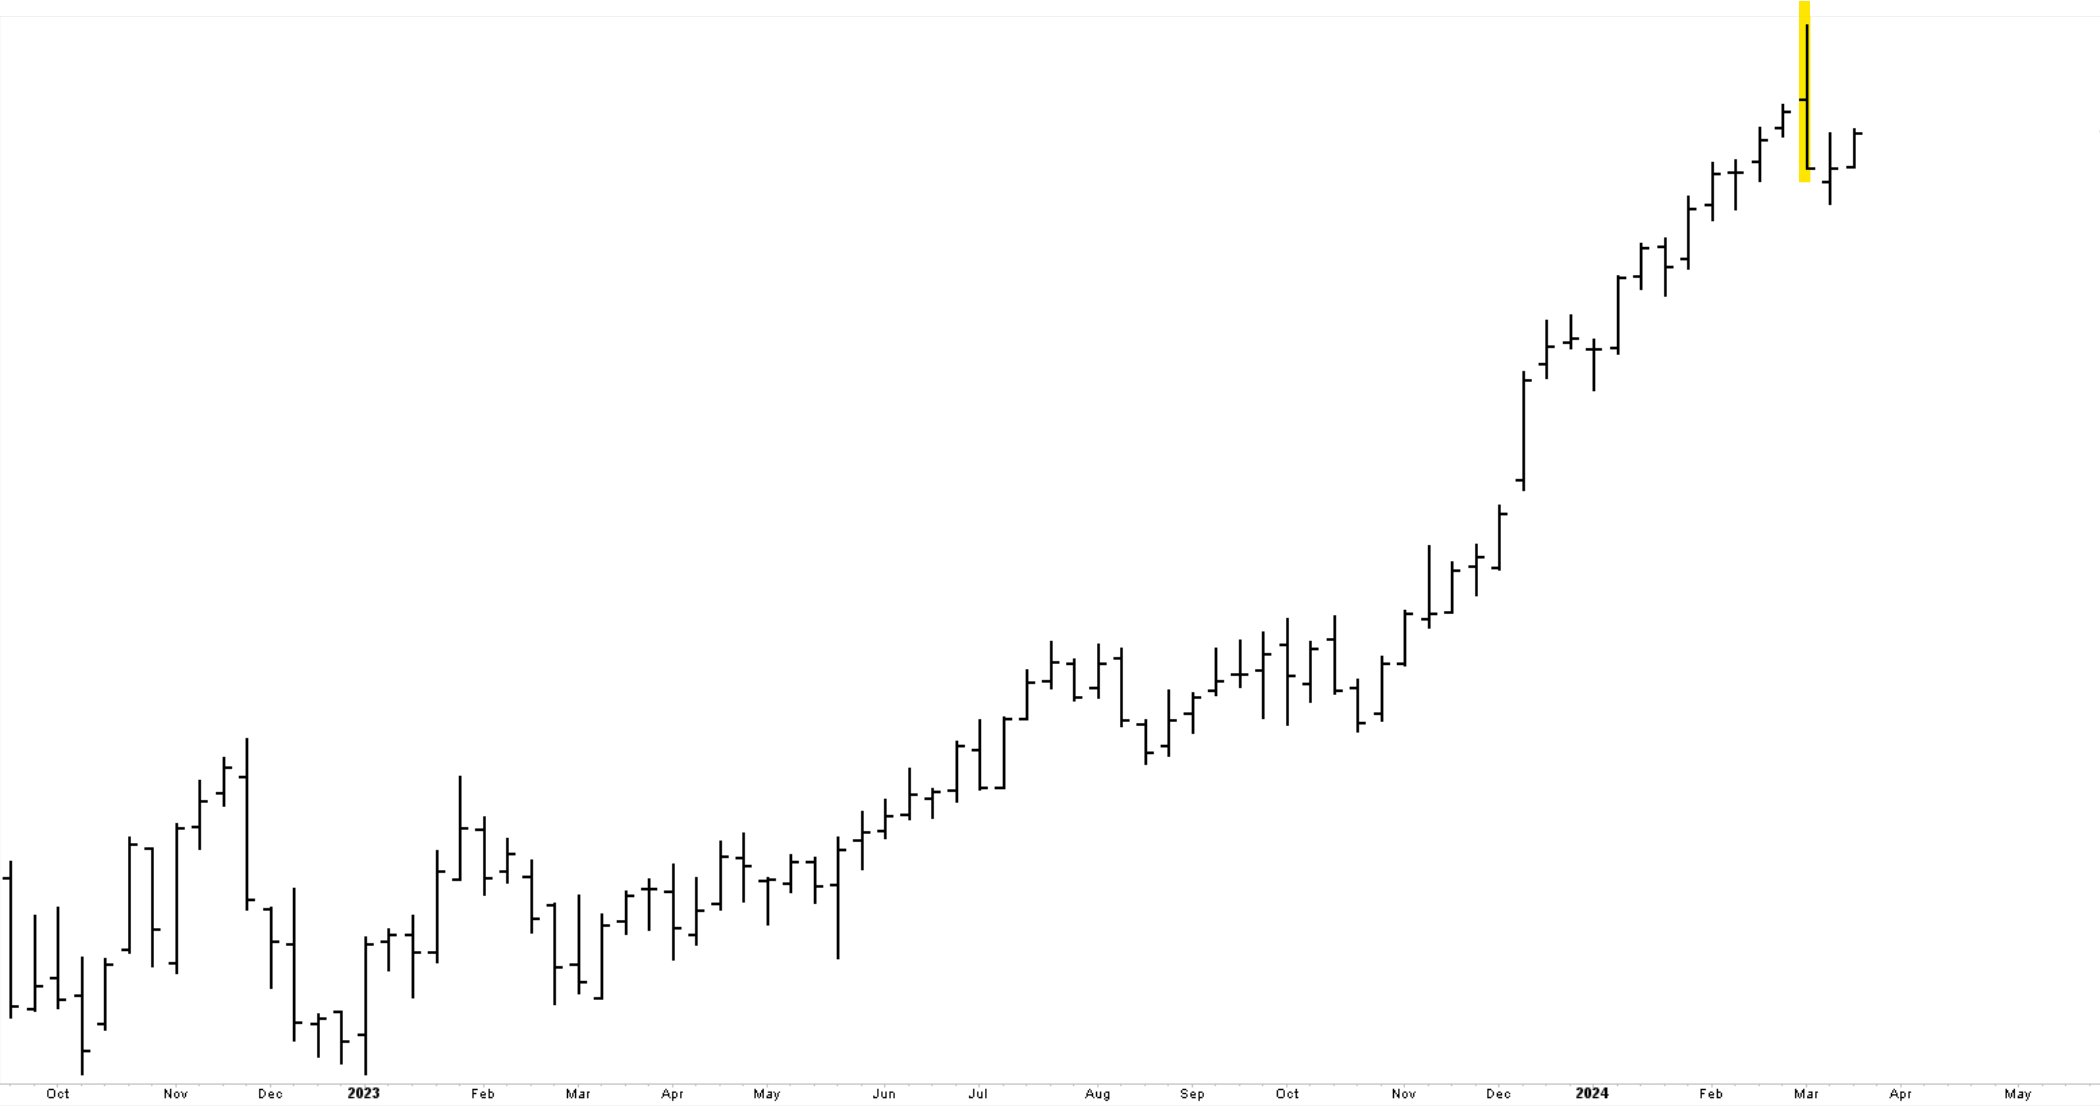
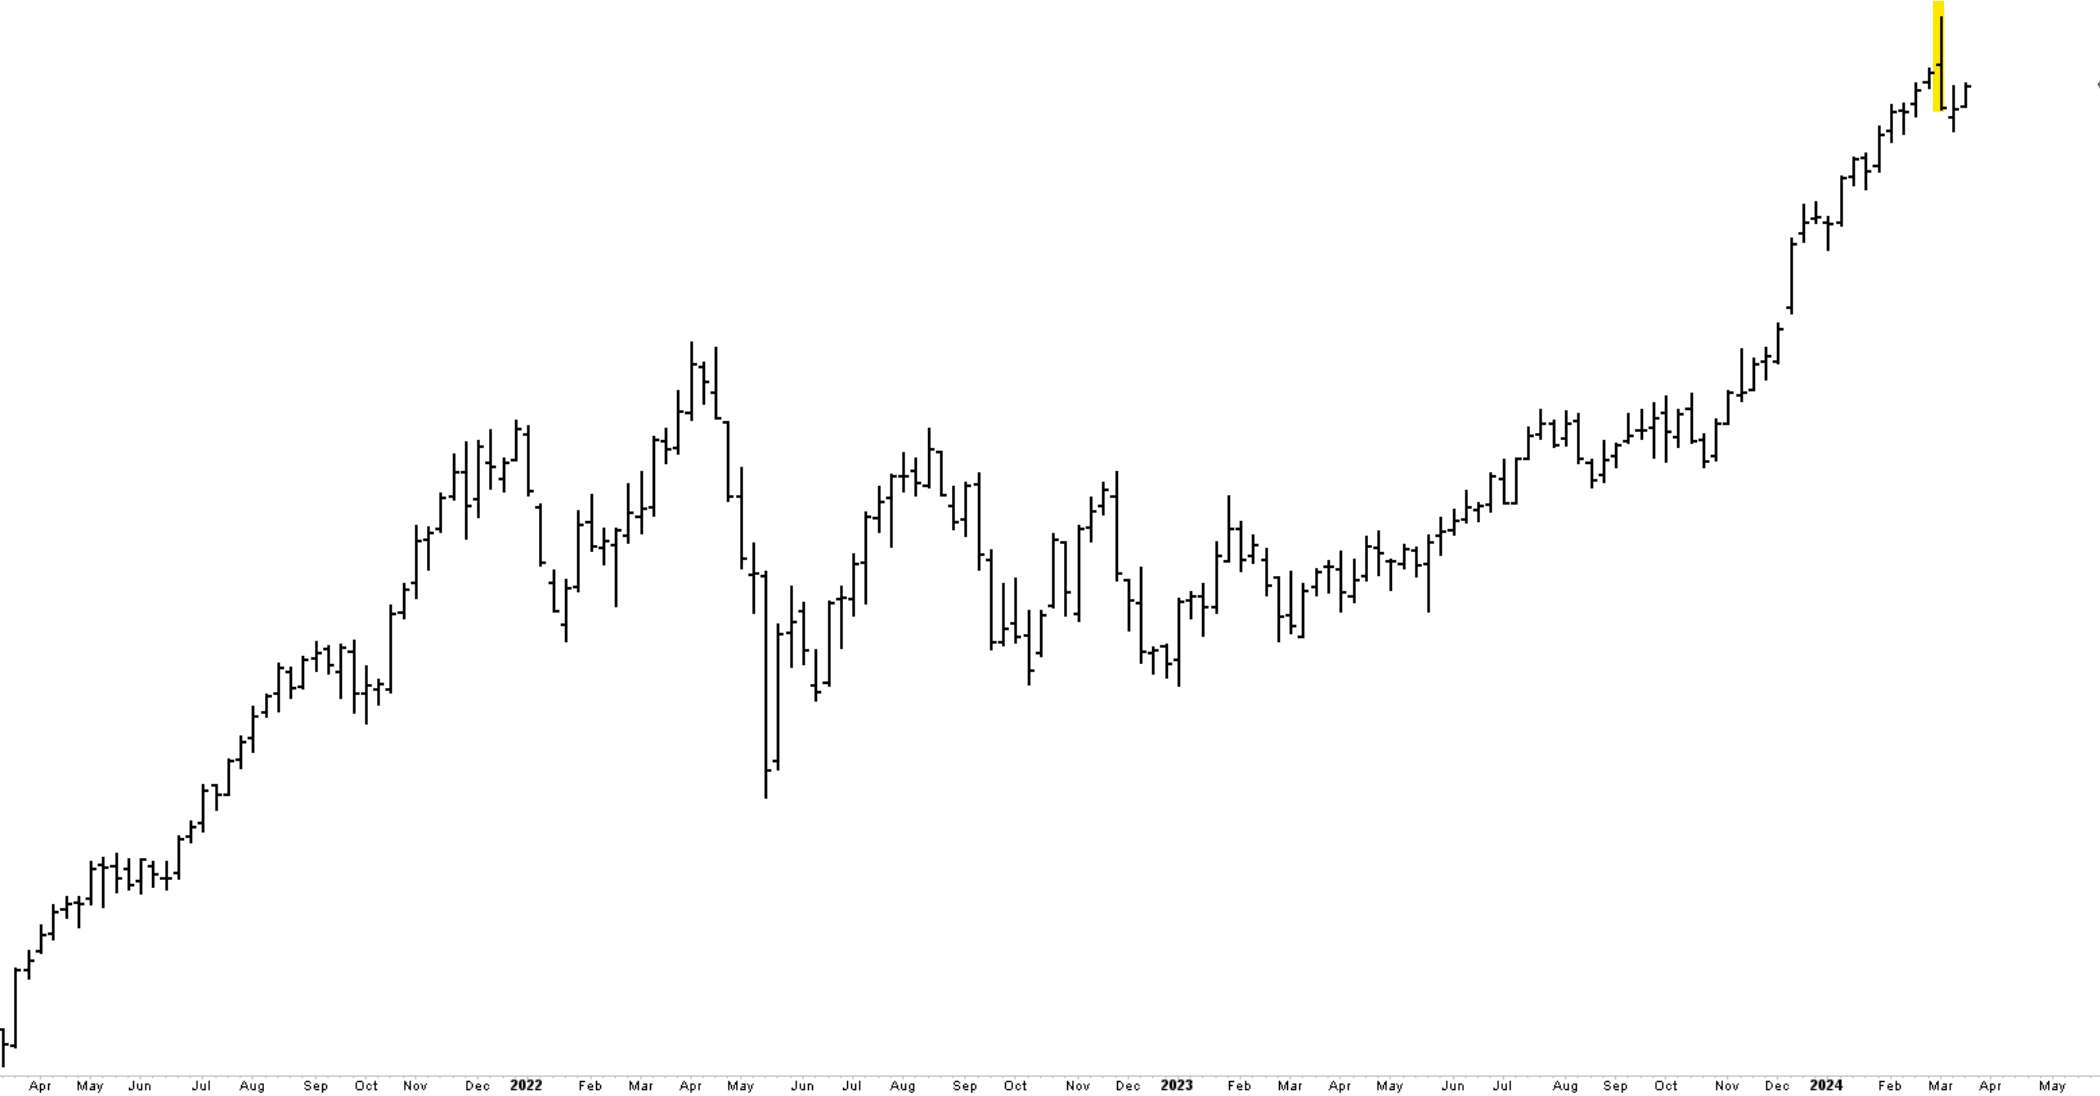
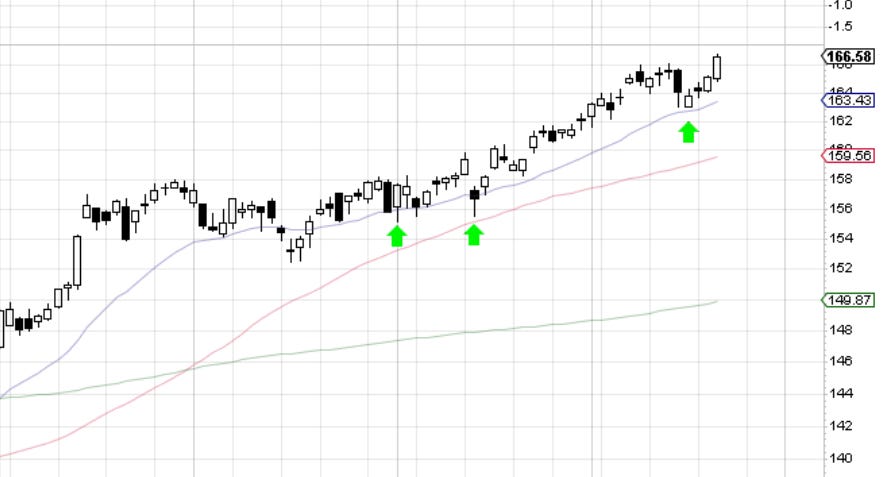
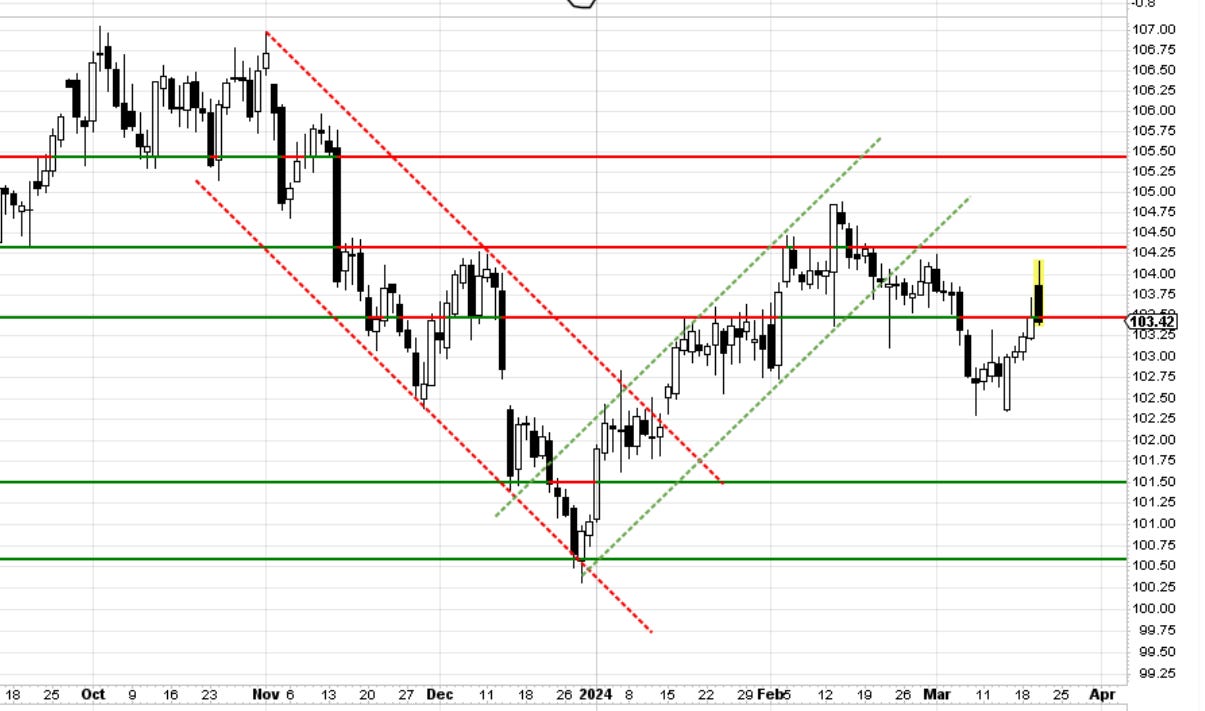
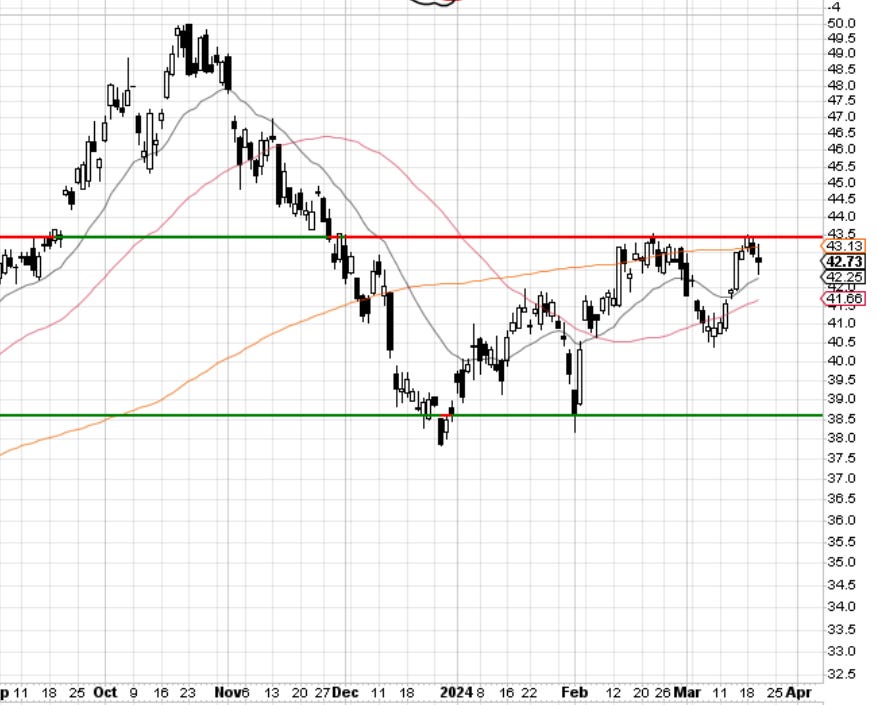
Chart of the Day—XXXX—If you know which symbol belongs to this chart, let me know in the comments. The second chart can help you identify it. This type of bar enables you to determine the presence of a nearby top. The fact that this latest trend comes after a triangle formation is another clue of something terminal cooking.
In yesterday’s note, I focused on the hints provided by the bullish daily closes and how the patterns suggest a very likely upside breakout. I said this: “With today’s positive close, I think we need to add another green arrow to the latest dip. If history is any guide, the failure to continue retreating, followed by a bullish move, suggests further continuation in the direction of the primary trend. Tomorrow’s Fed meeting will be the main event, and the pattern below looks ready for a breakout.”
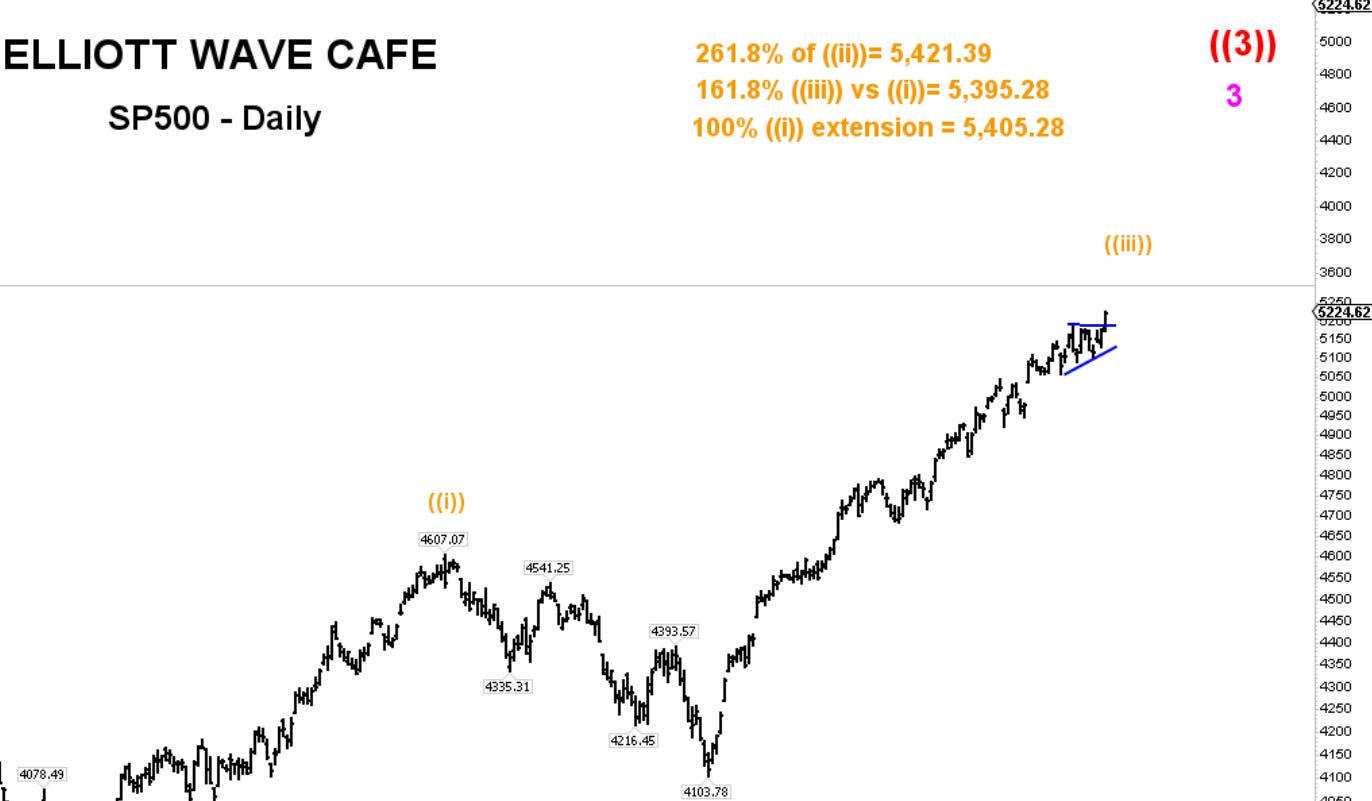
I talked and showed the ascending triangle: “Once again, the main daily count with wave ((iii)) is in progress and without any solid evidence of a wave ((iv)) buildup. The formation at the current top seems to be an ascending triangle.”
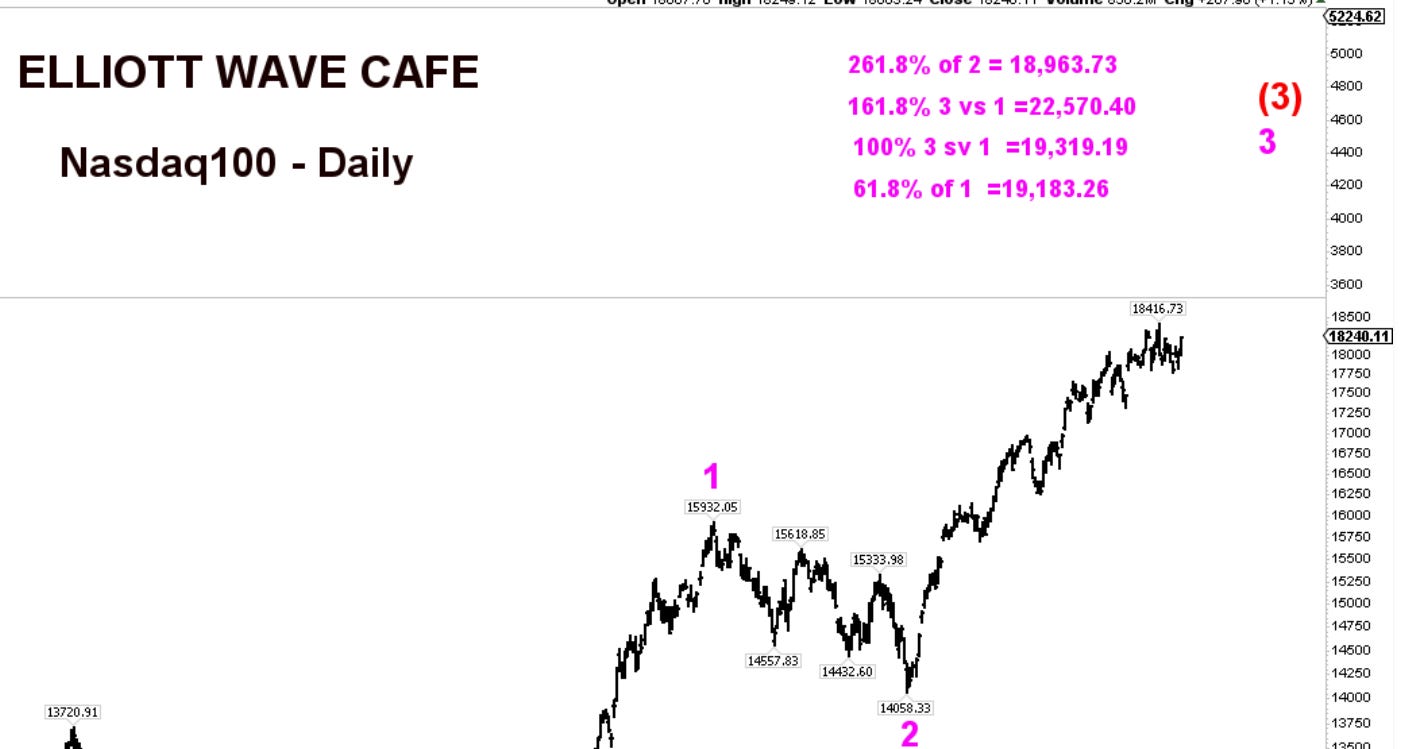
Regarding Nasdaq100, I talked about 18,200 unlocking upside potential. “This is probably as good as it gets at the moment for anyone who wants to join the uptrend, keeping 17,500 as a defensive line.”
On IWM - “If the Fed is serious about hinting at cuts tomorrow, expect a massive move upward in this index.”
In the Daily Video, we discussed BTC and ETH opportunities, especially in Ethereum, which provided a great level for entry and an upside trade of at least $300 dollars. I have also spent time analyzing the core markets and detailing the written notes.
Markets have pushed higher today and closed at new all-time highs with the help of Jay Powell…
Let's dive into the charts below …
SP500
Yes, the markets looked for a reason to move higher yet, and today’s presser was the catalyst. Price continues to be the best indicator there is bar none. The hints were present, the trend is from lower left to upper right and everything else is conversation. Yes, we could always fail and reverse tomorrow, but until that happens, we need to respect the market’s direction.
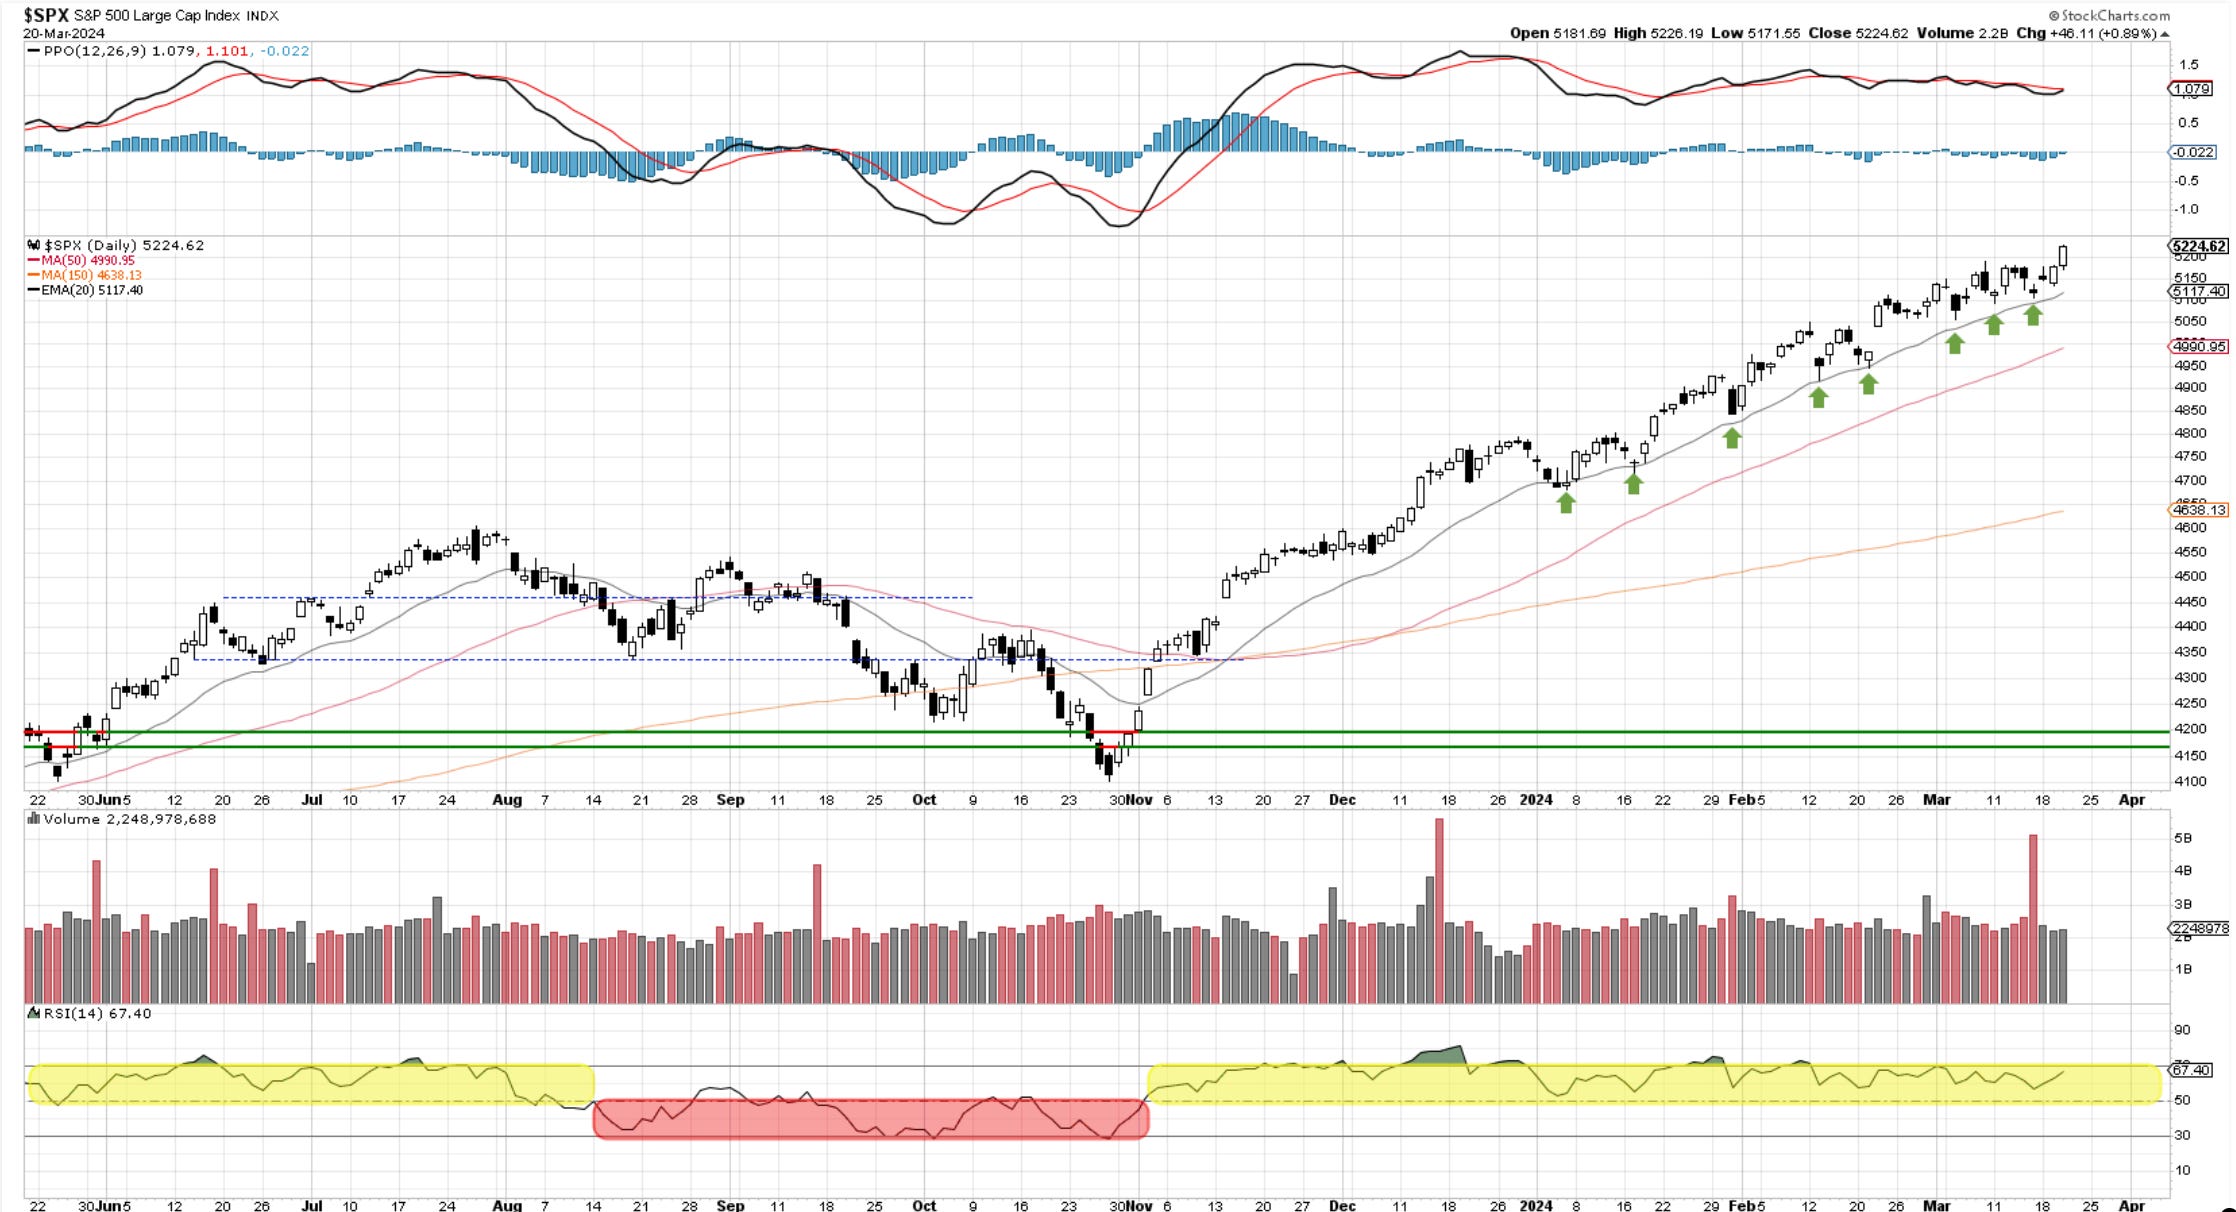
In the weekly report, I showed this chart below and discussed how two weeks in a row of higher rejections and market indecision could be seen as a negative and a caution sign. Well, this week (which is not over yet), we overcame the previous two and moved higher. It is what we call a failed setup. Markets that fail to confirm what seems to be a bearish formation, usually move quite strongly in the opposite direction. Eyes on Friday’s close.
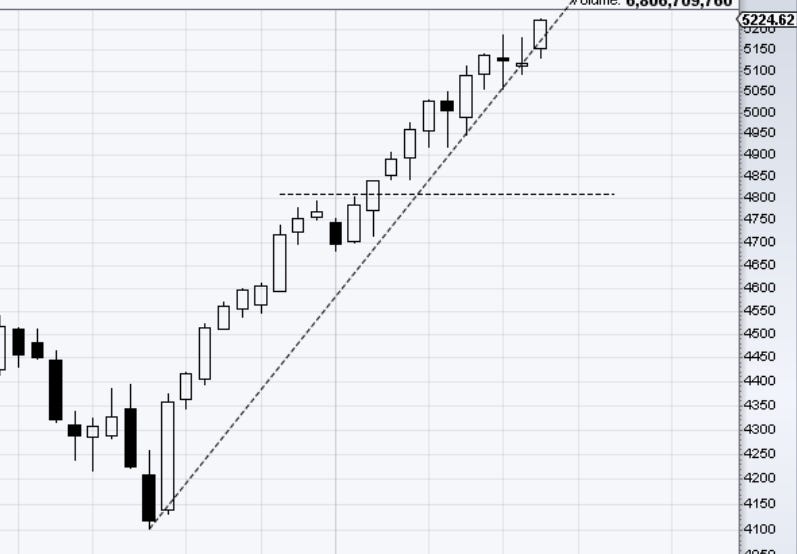
The upside break from the ascending triangle is visible as we’re moving closer and closer to the fib targets near 5,400. 5050 remains the key zone that, if broken on any reversal, would suggest the current up leg is likely over and a correction is starting.
RSP has moved to a new ATH, confirming larger participation.
Nasdaq100
Look at that support at 17,750. Tested on 6 occasions, held, and the market said, “The path lower is harder than the path higher”.
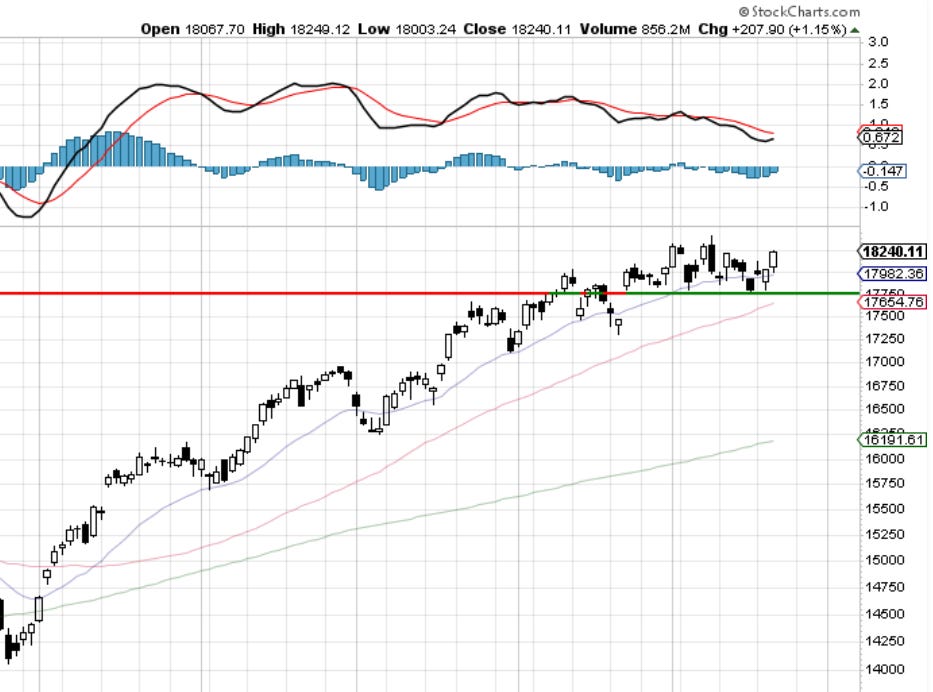
Yesterday’s note - The hourly formation is “meh” and with no clear break of support. Above 18,200 is game on for longs once again.
update - We’re trading above 18,200. A failed head and shoulder is usually quite bullish.
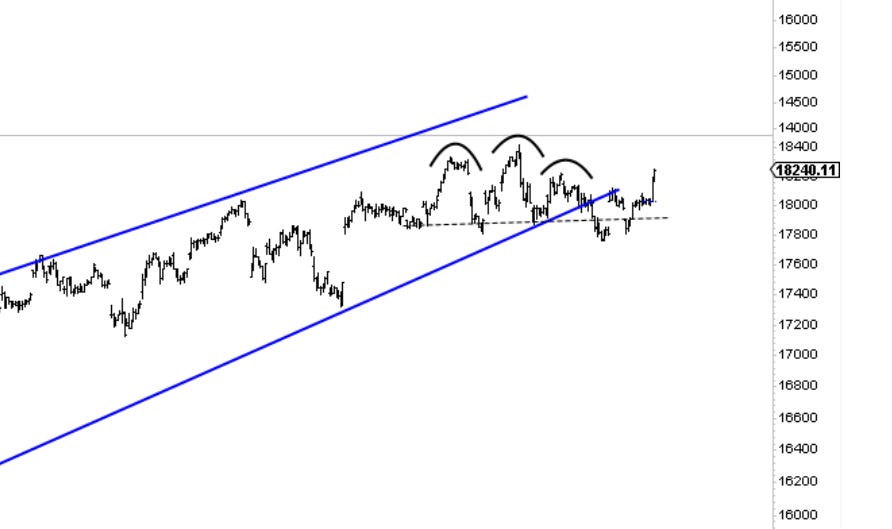
Based on these fib levels and the failure to sell lower, we can now expect another 1000 points higher towards wave 3 of (3).
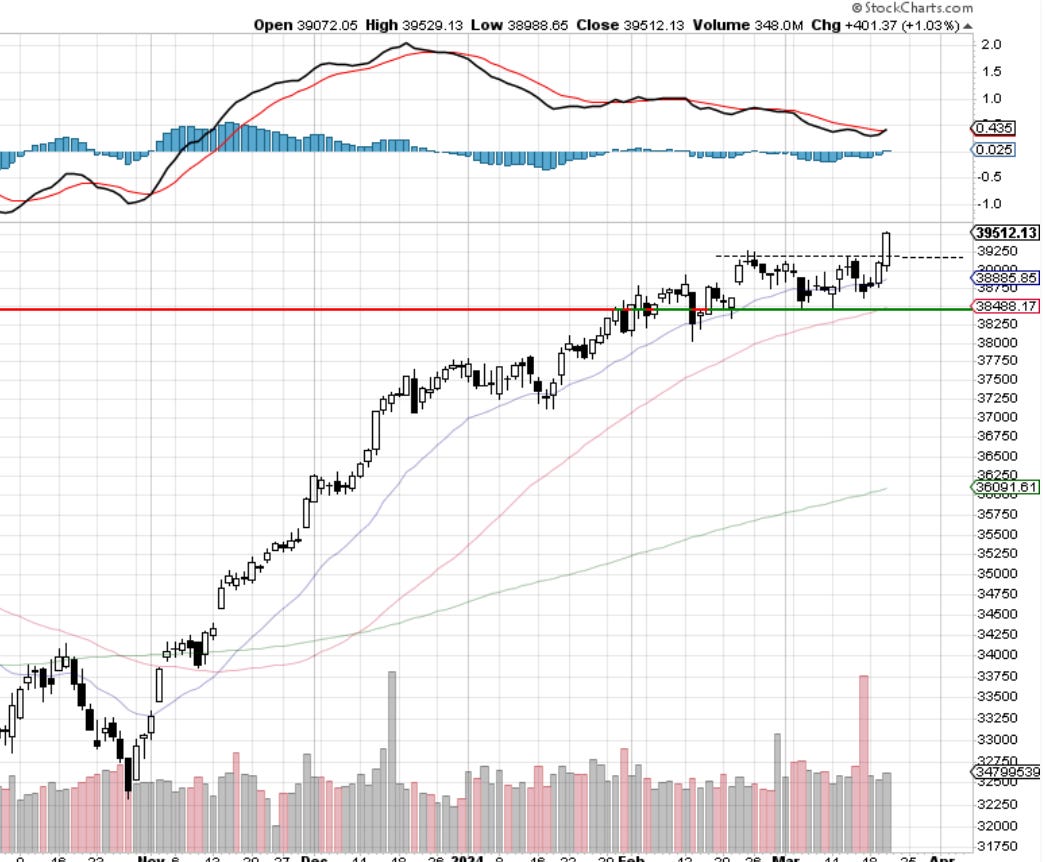
Dow30
38,500 was the line in the sand for Papa Dow. With the break higher, we now have old resistance turning into support at 39,250. Notice momentum indicator Macd curling up once again after spending a couple of weeks catching its breath.
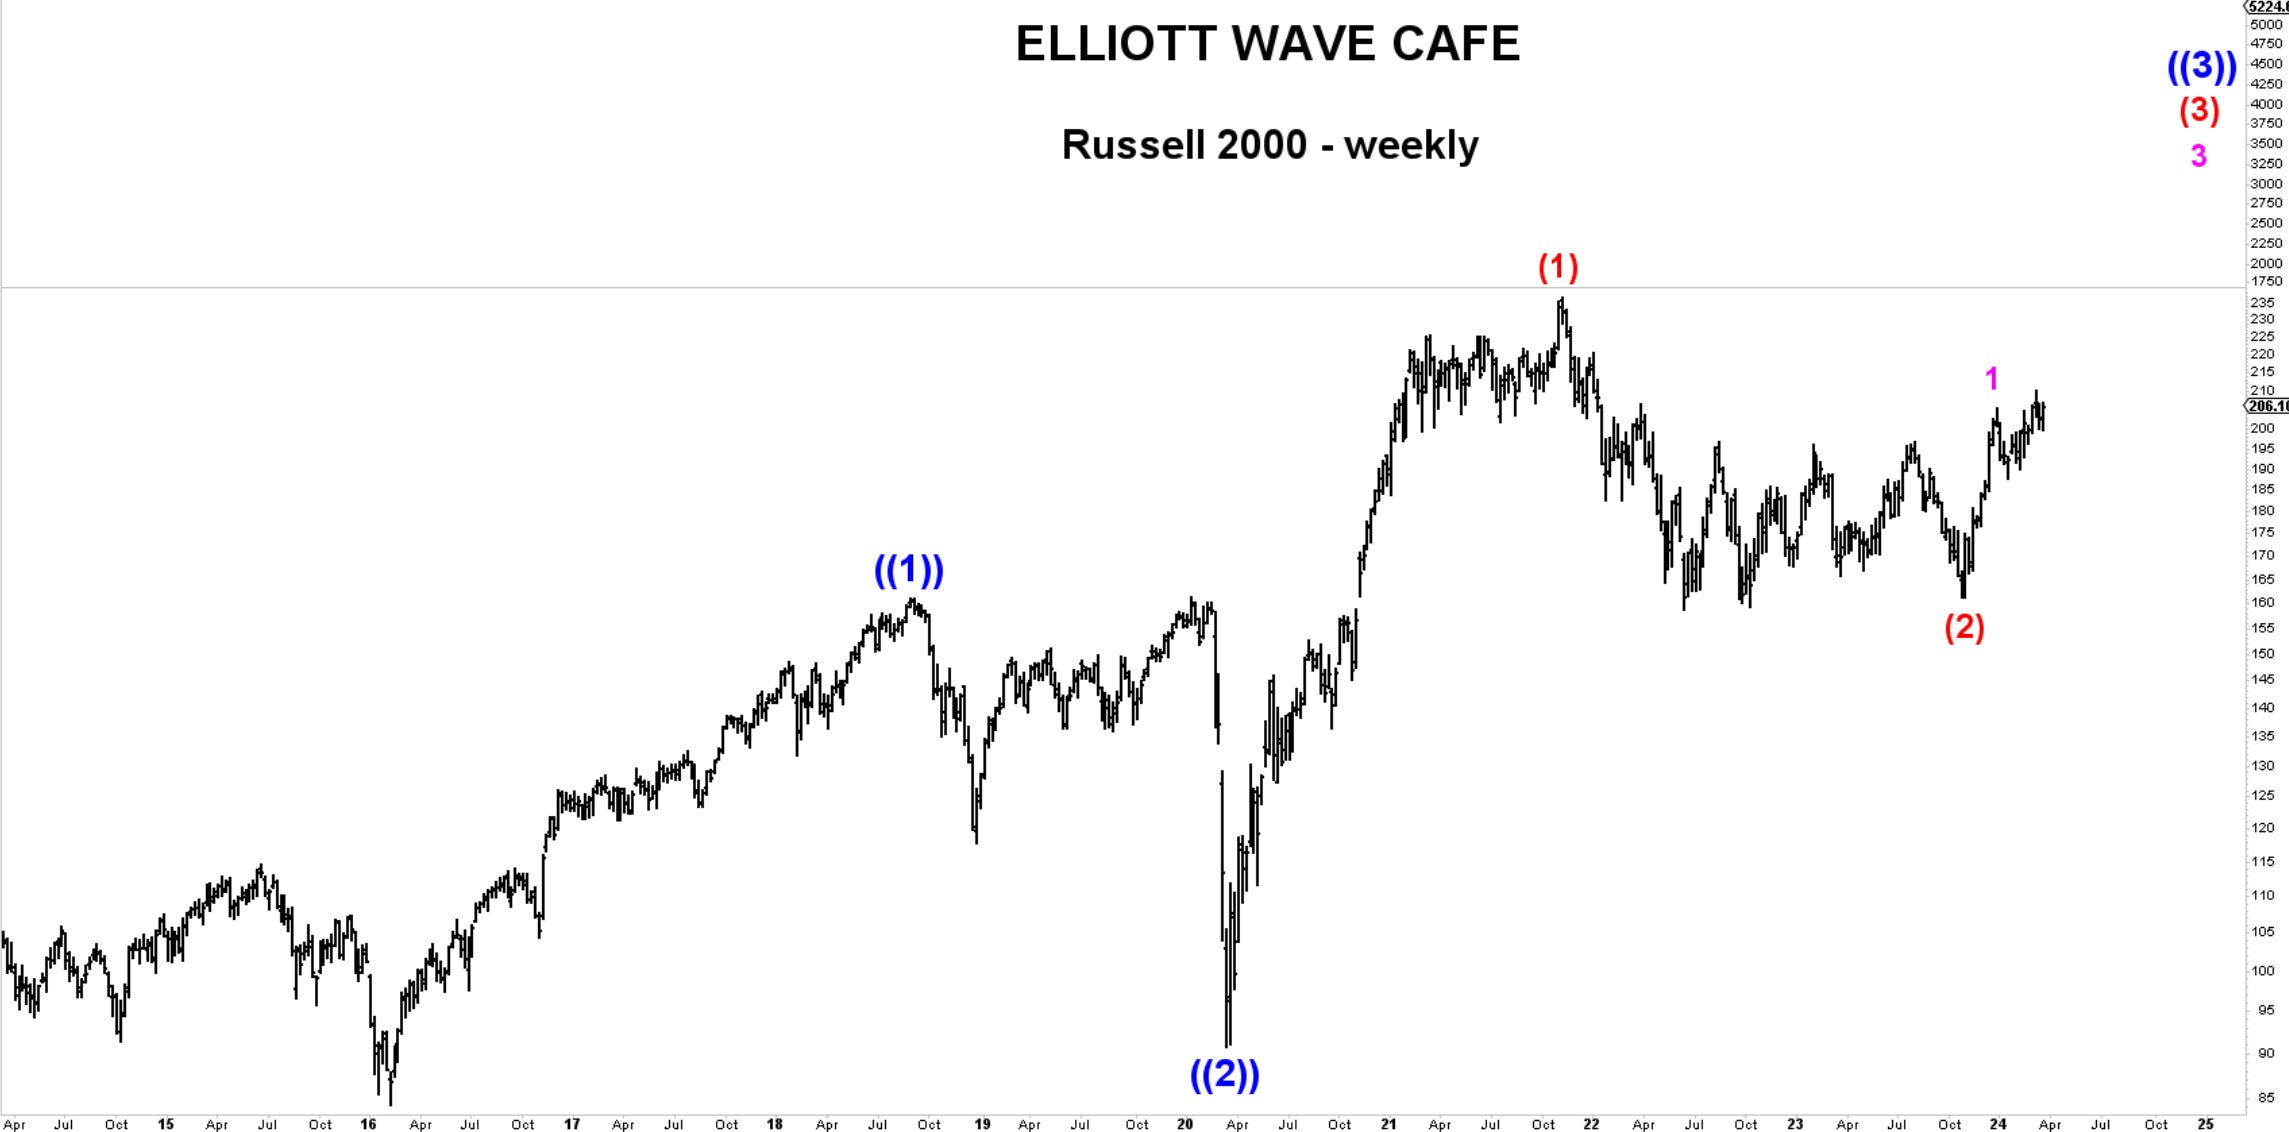
RUSSELL 2000 - IWM
This index gained +2% today after holding the 50-day MA and 200 support. Trading above 206 is now seen as a positive sign, and we should look for a continuation higher using 200 as a defense. If the market is serious about starting to trend, we should not turn back below that level.
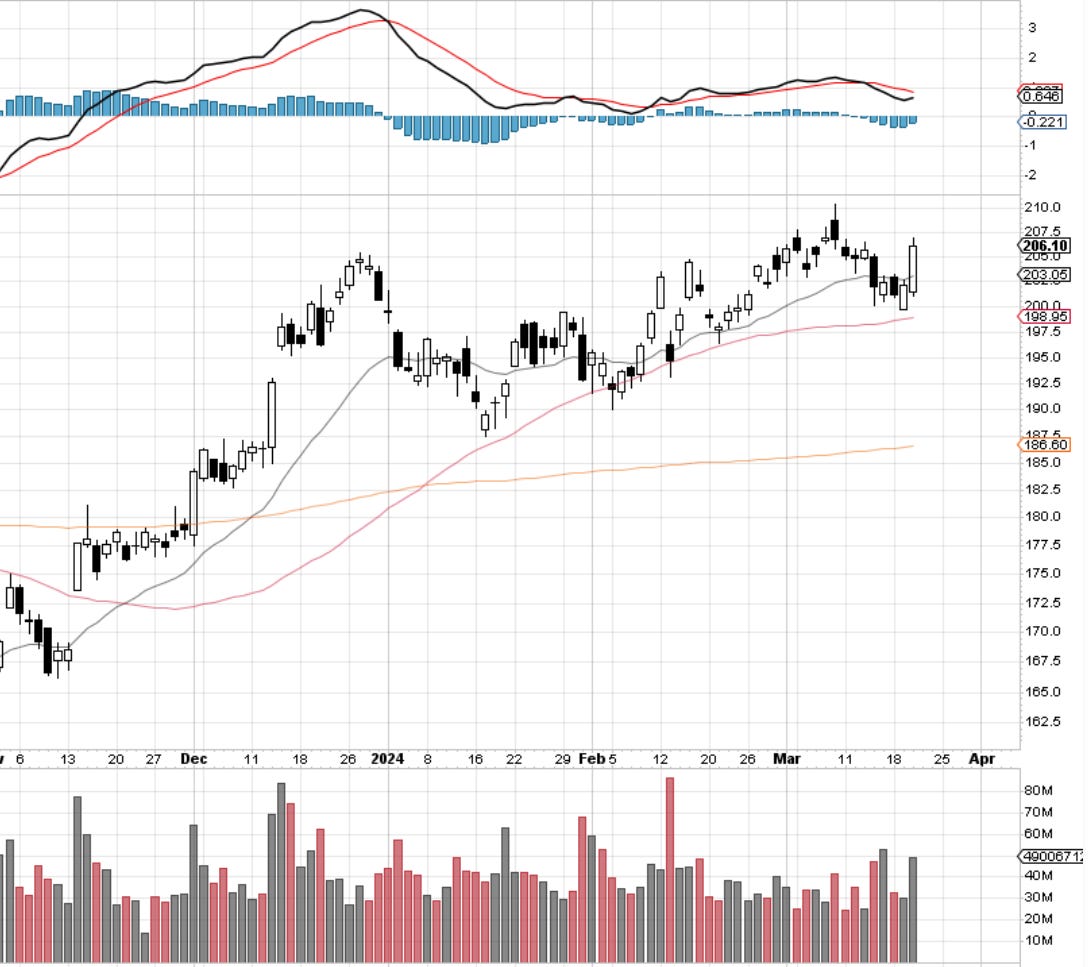
Yesterday - We need to regain the lost line before one can get more positive on this index.
Update: This has been regained today and we’re trading above 206.
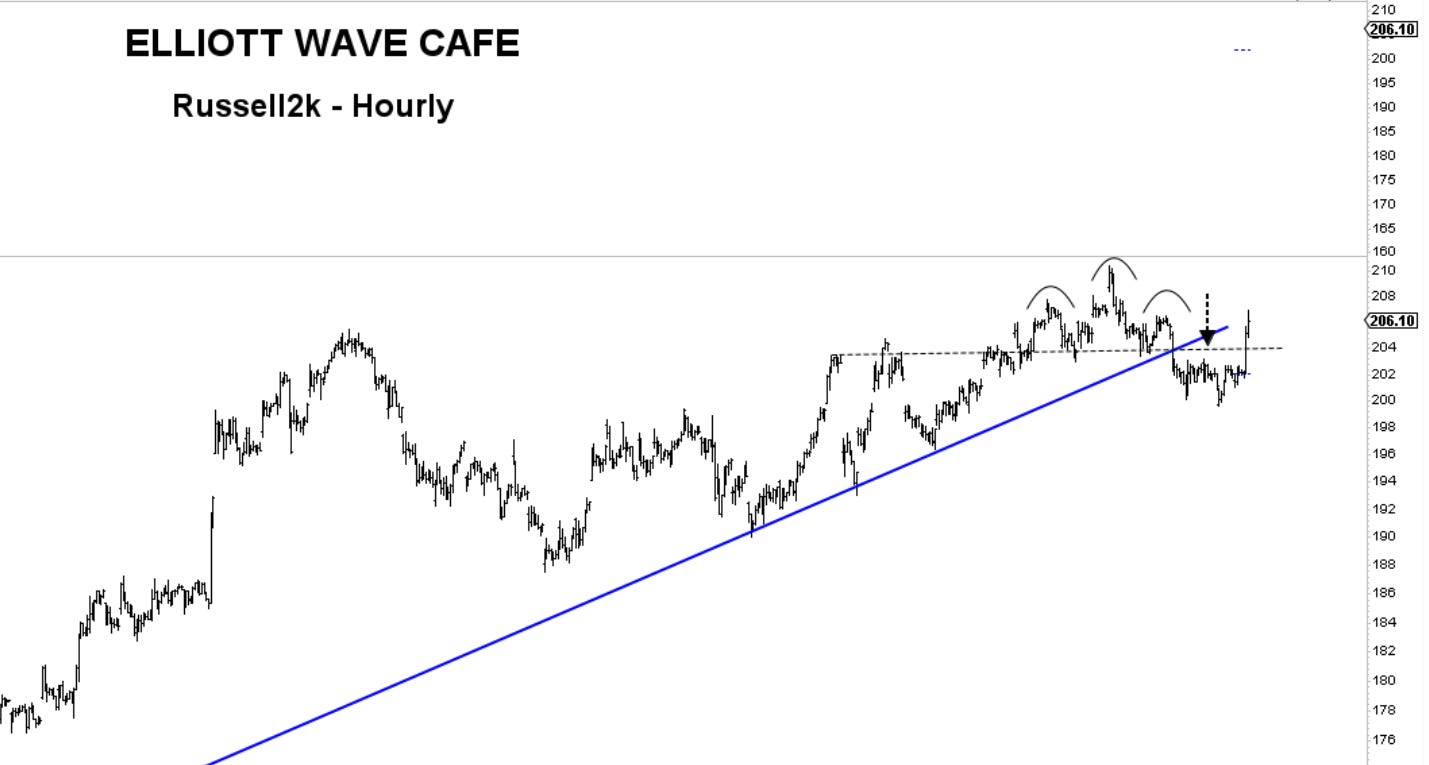
As a reminder, small caps have been serious underperformers, and large third waves are waiting in the shadows. I would not be shy about owning them above 200.
For those wanting to chat with fellow traders, the link is below.

US Dollar and Yields
Dollar playing its favorite game of bouncing like a beach ball. Nothing major to see here yet, but clearly, a weaker USD seems to be favorable for risk. Plenty of support levels below, so we're not really expecting easy rides.
Yields have turned back lower from 4.35. If the complex WXY correction is over, we should continue falling. Only if we lose 4% can we talk about deeper acceleration. For now, we have a range of 4.35 - 4.25.
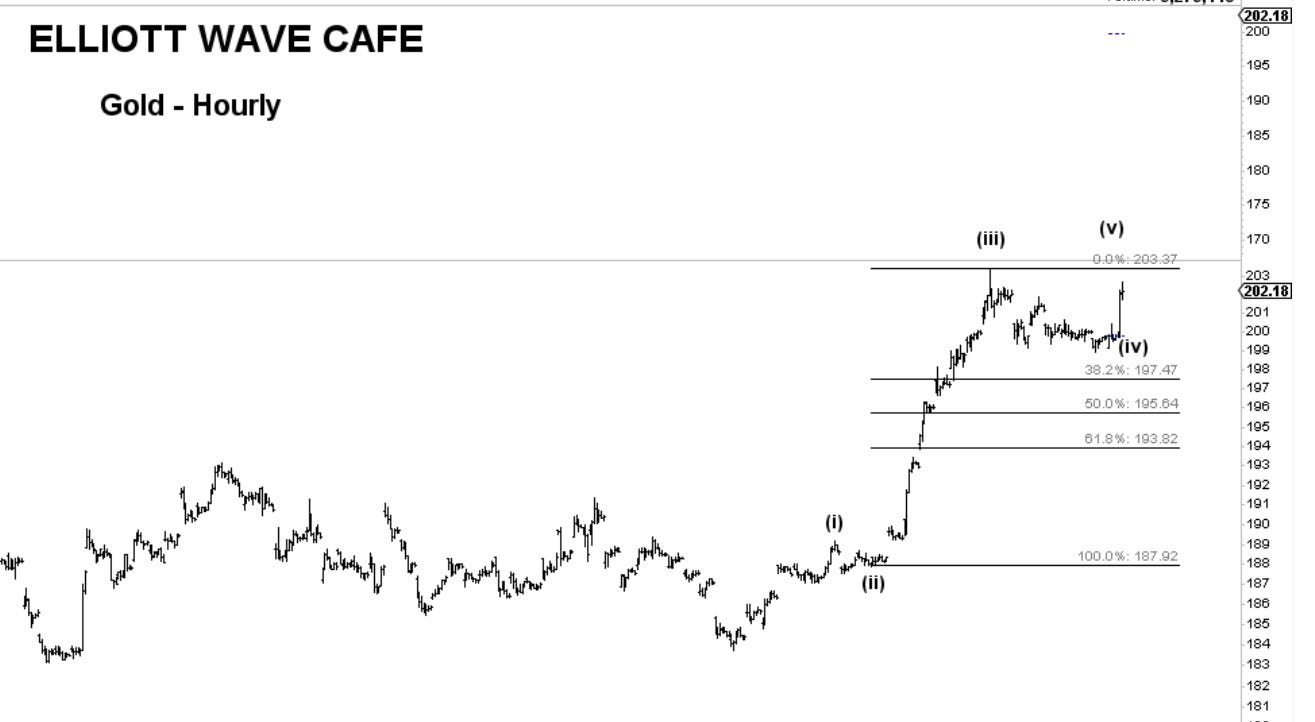
Gold
As expected per the road map provided, we now have a wave (v) underway in Gold.
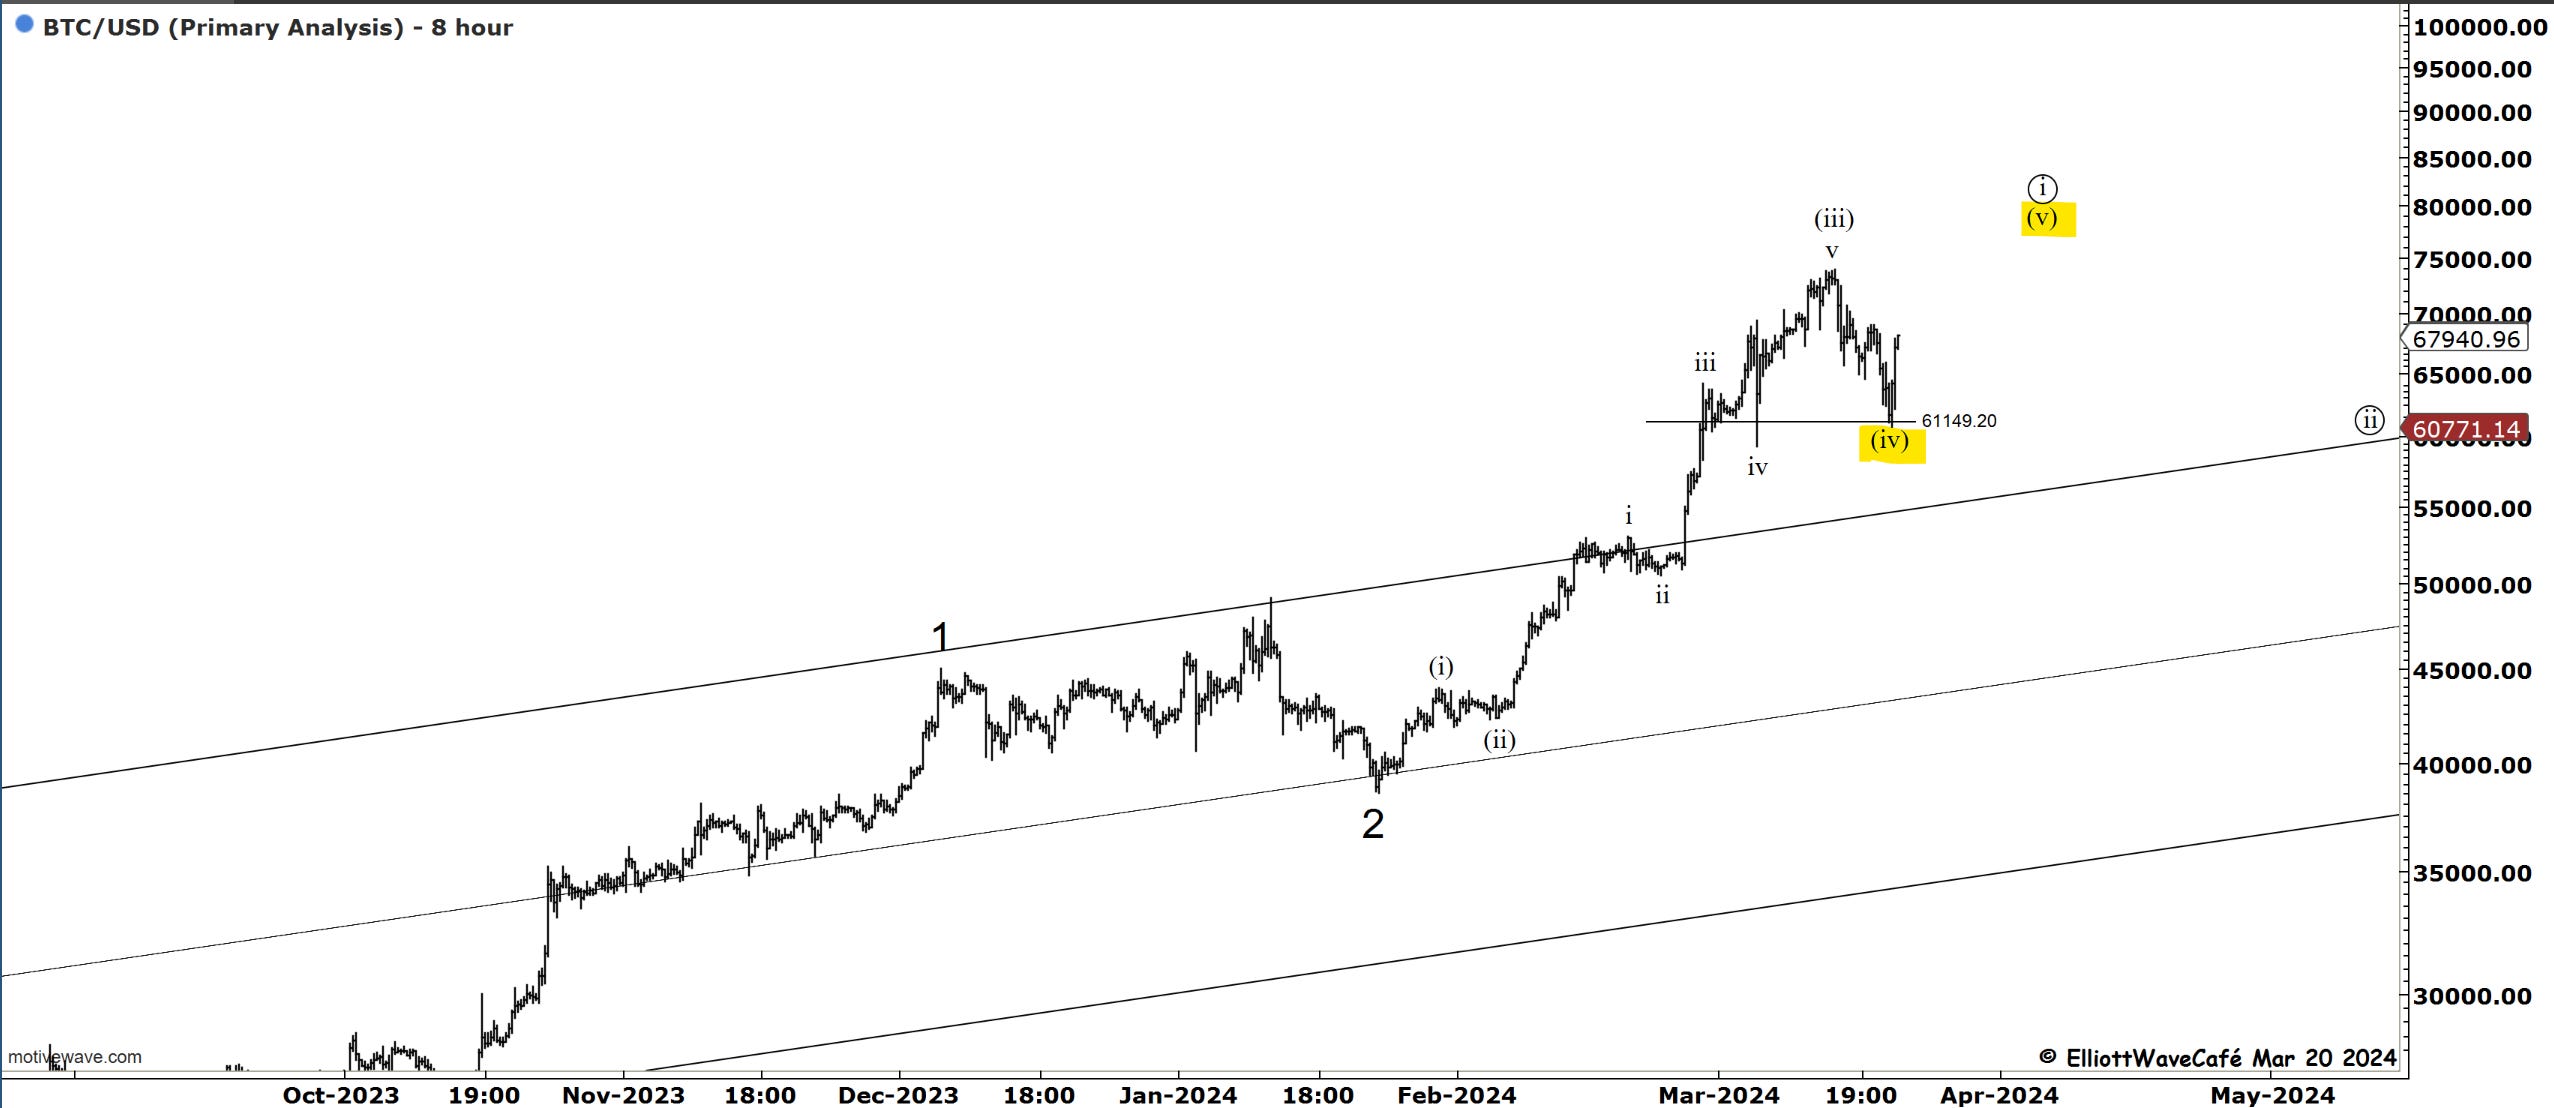
Bitcoin
Appealing it was at 60k. Although it did not feel that way at the time, following the process in a cold-blooded manner matters to successful trading. We are now staging a bullish engulfing structure of support with very bullish implications. The RSI at 50 helped and now bouncing. Expecting 74k highs to be taken out.
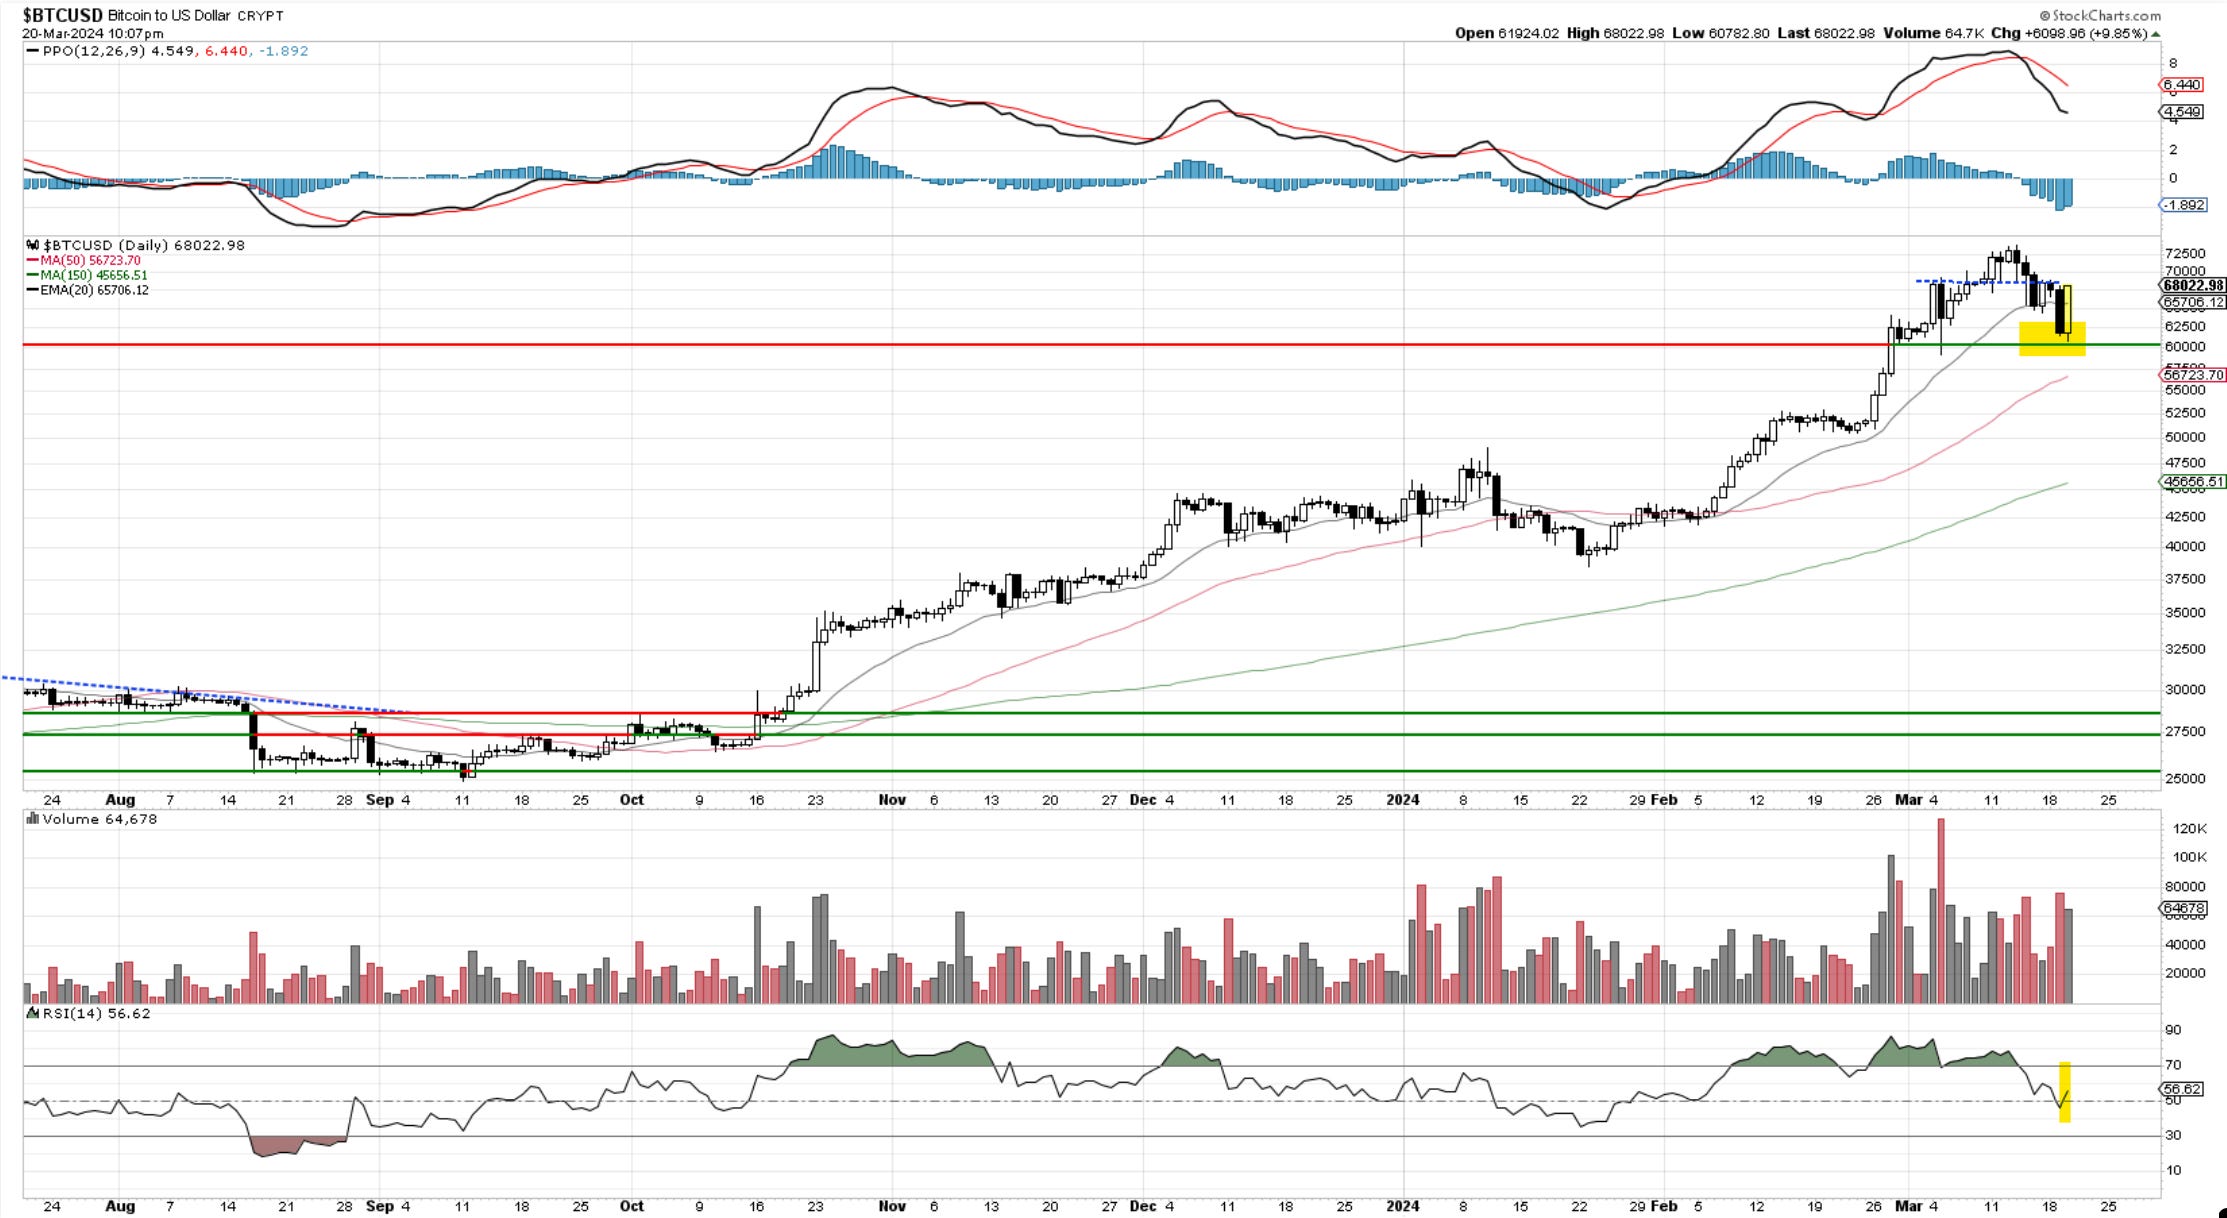
We know we have a fourth wave in progress if it finds support at the previous wave 4 of one lesser degree. I think this is what happened here. So far so good. Now we need to see this continue and not get back below that support. If we break that again, it’s a clear hint we’re in a different wave count.
If you’re new to Elliott Wave or need to refresh, there is a 7-hour video course with downloadable slides under The Coarse tab on the website. Requires a yearly “Founding Member subscription”.
Cris
email: ewcafe@pm.me
it's Costco. strong stock overall, let's see how that resolves
most close the SPDR Healthcare Sector looks like, but no chance to guess that easter egg.