
The Daily Drip
Elliott Wave and technical market updates on SPX,NDX,DOW,IWM,DXY,BITCOIN
Note: The counts on the right edge are real-time, and they are prone to adjustments as price action develops. Elliott Wave has a fluid approach, is evidence-based, and requires constant monitoring of certain thresholds.
In the counts below, this (( )) = circle on chart
SP500
With the markets already skating on thin ice, it did not take much for the economic data ( CPI) to create a selloff across all markets. The signs that a tape like today wasn’t far away were abundant over the past few days. Of course, if it’s an isolated event with VIX spiking to 18 in a trending market, then buyers should show up and take this to new highs once again. However, the burden of proof is on the bulls at the moment, with a cracking trendline, upcoming negative seasonality, cycle headwinds, rising rates, rising dollar, breadth issues, and Elliott wave terminal counts.
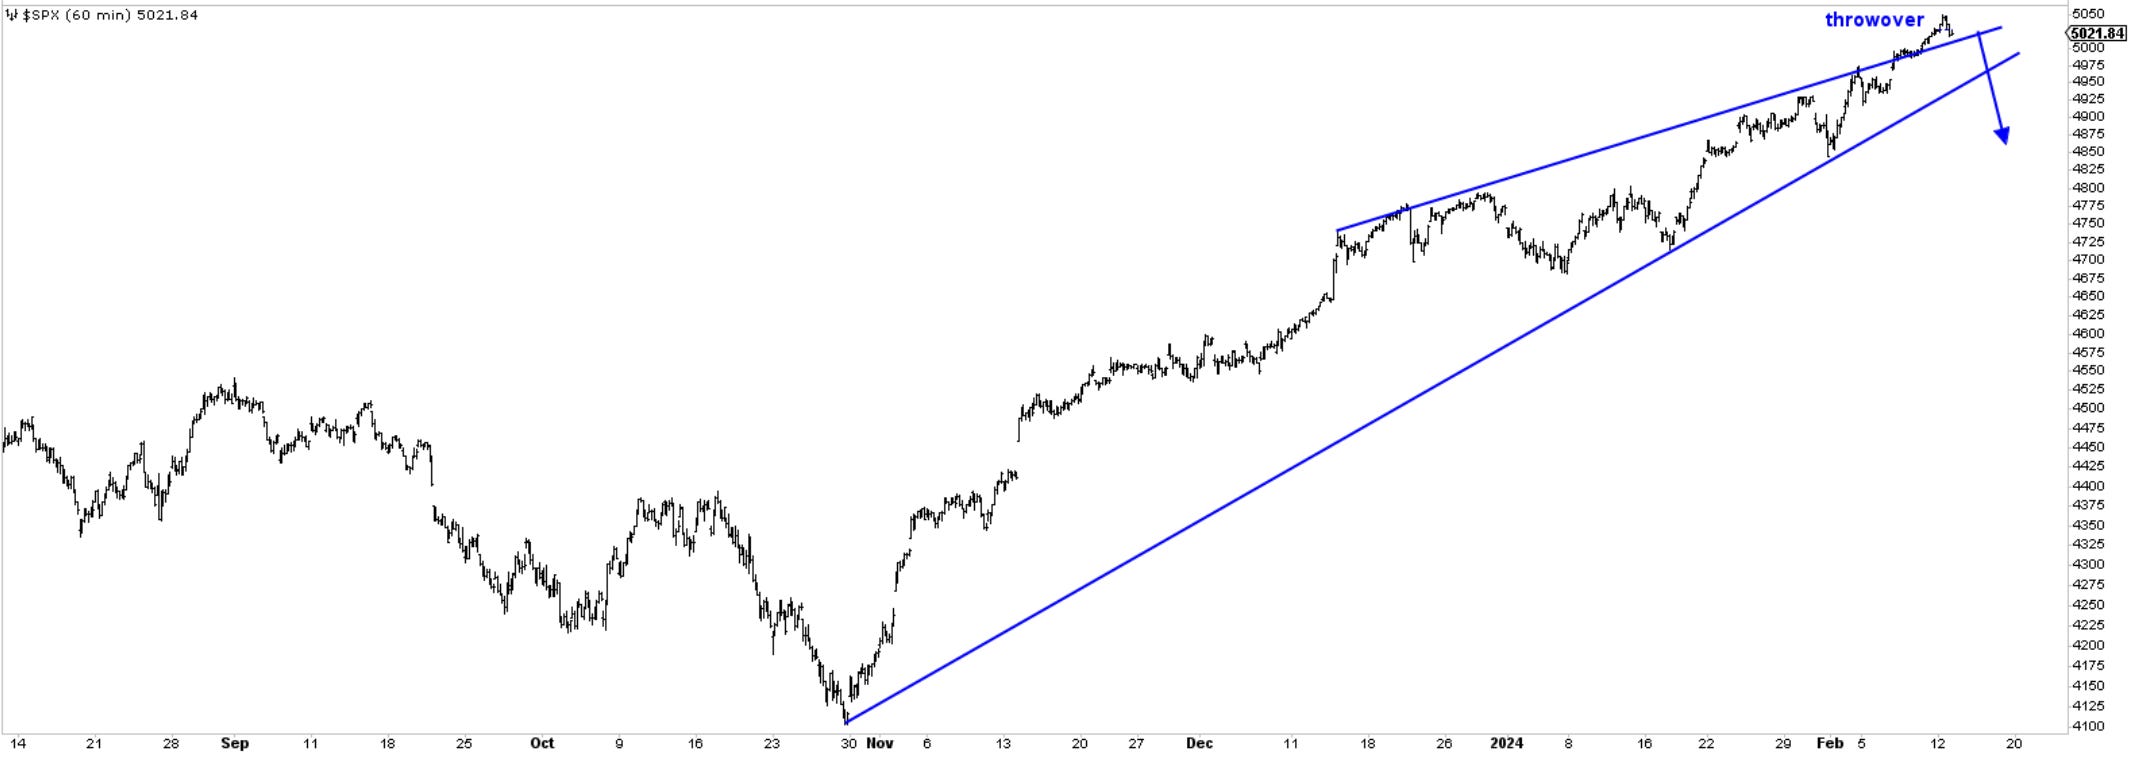
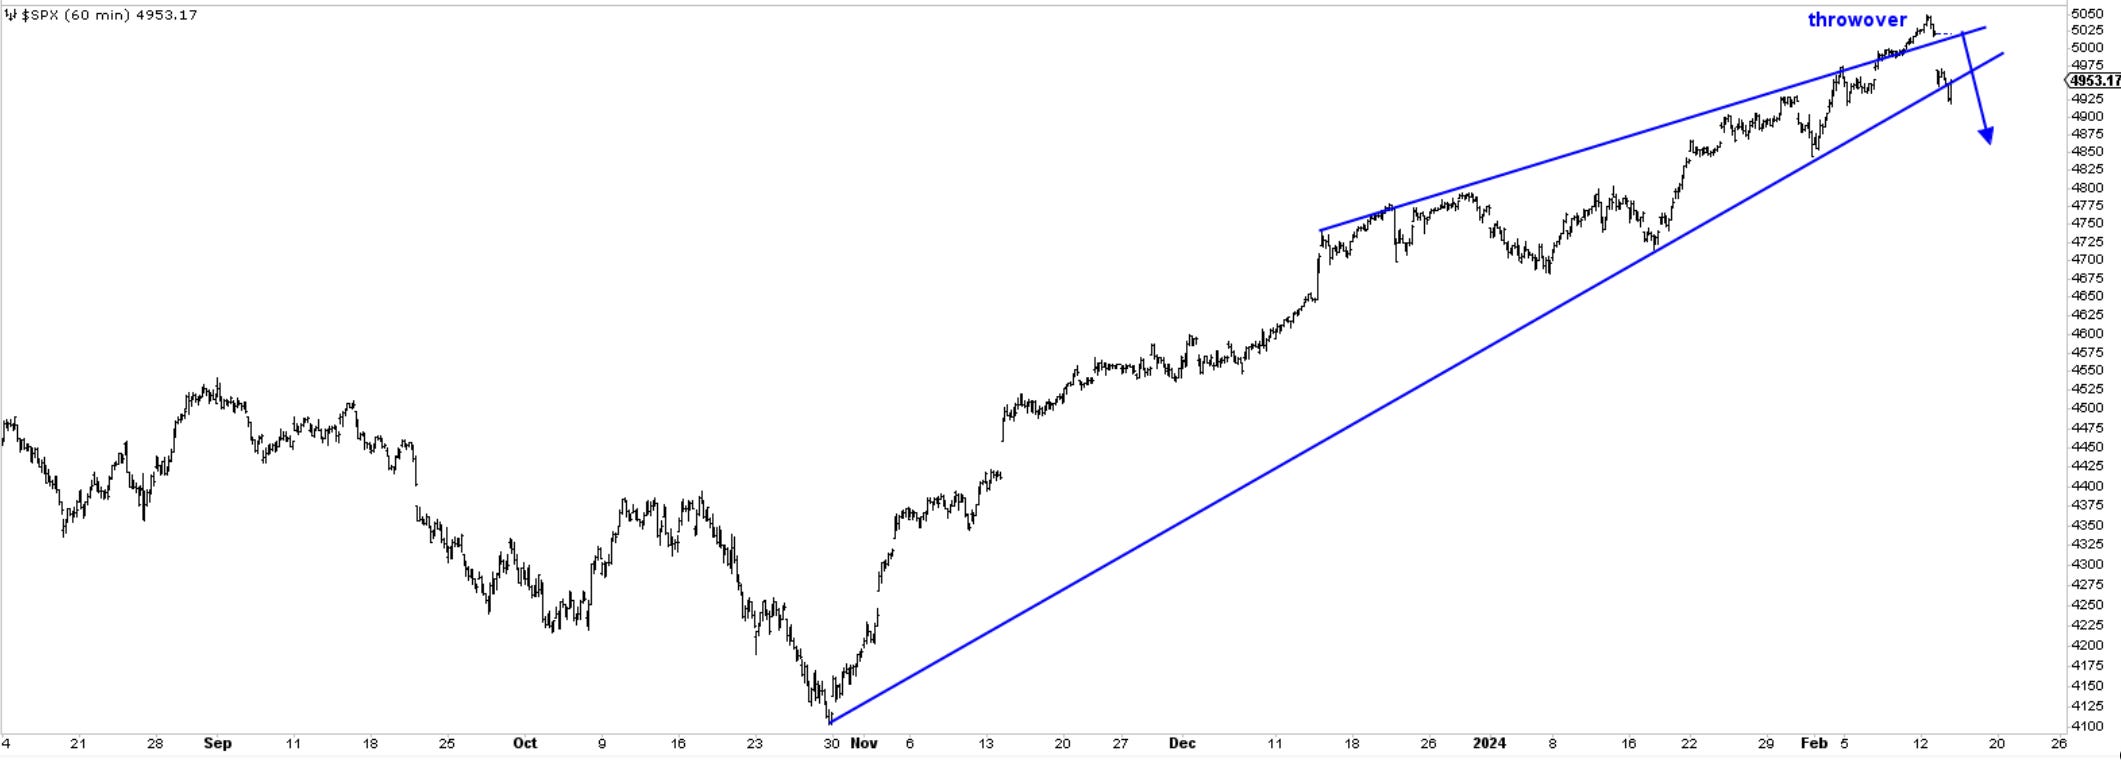
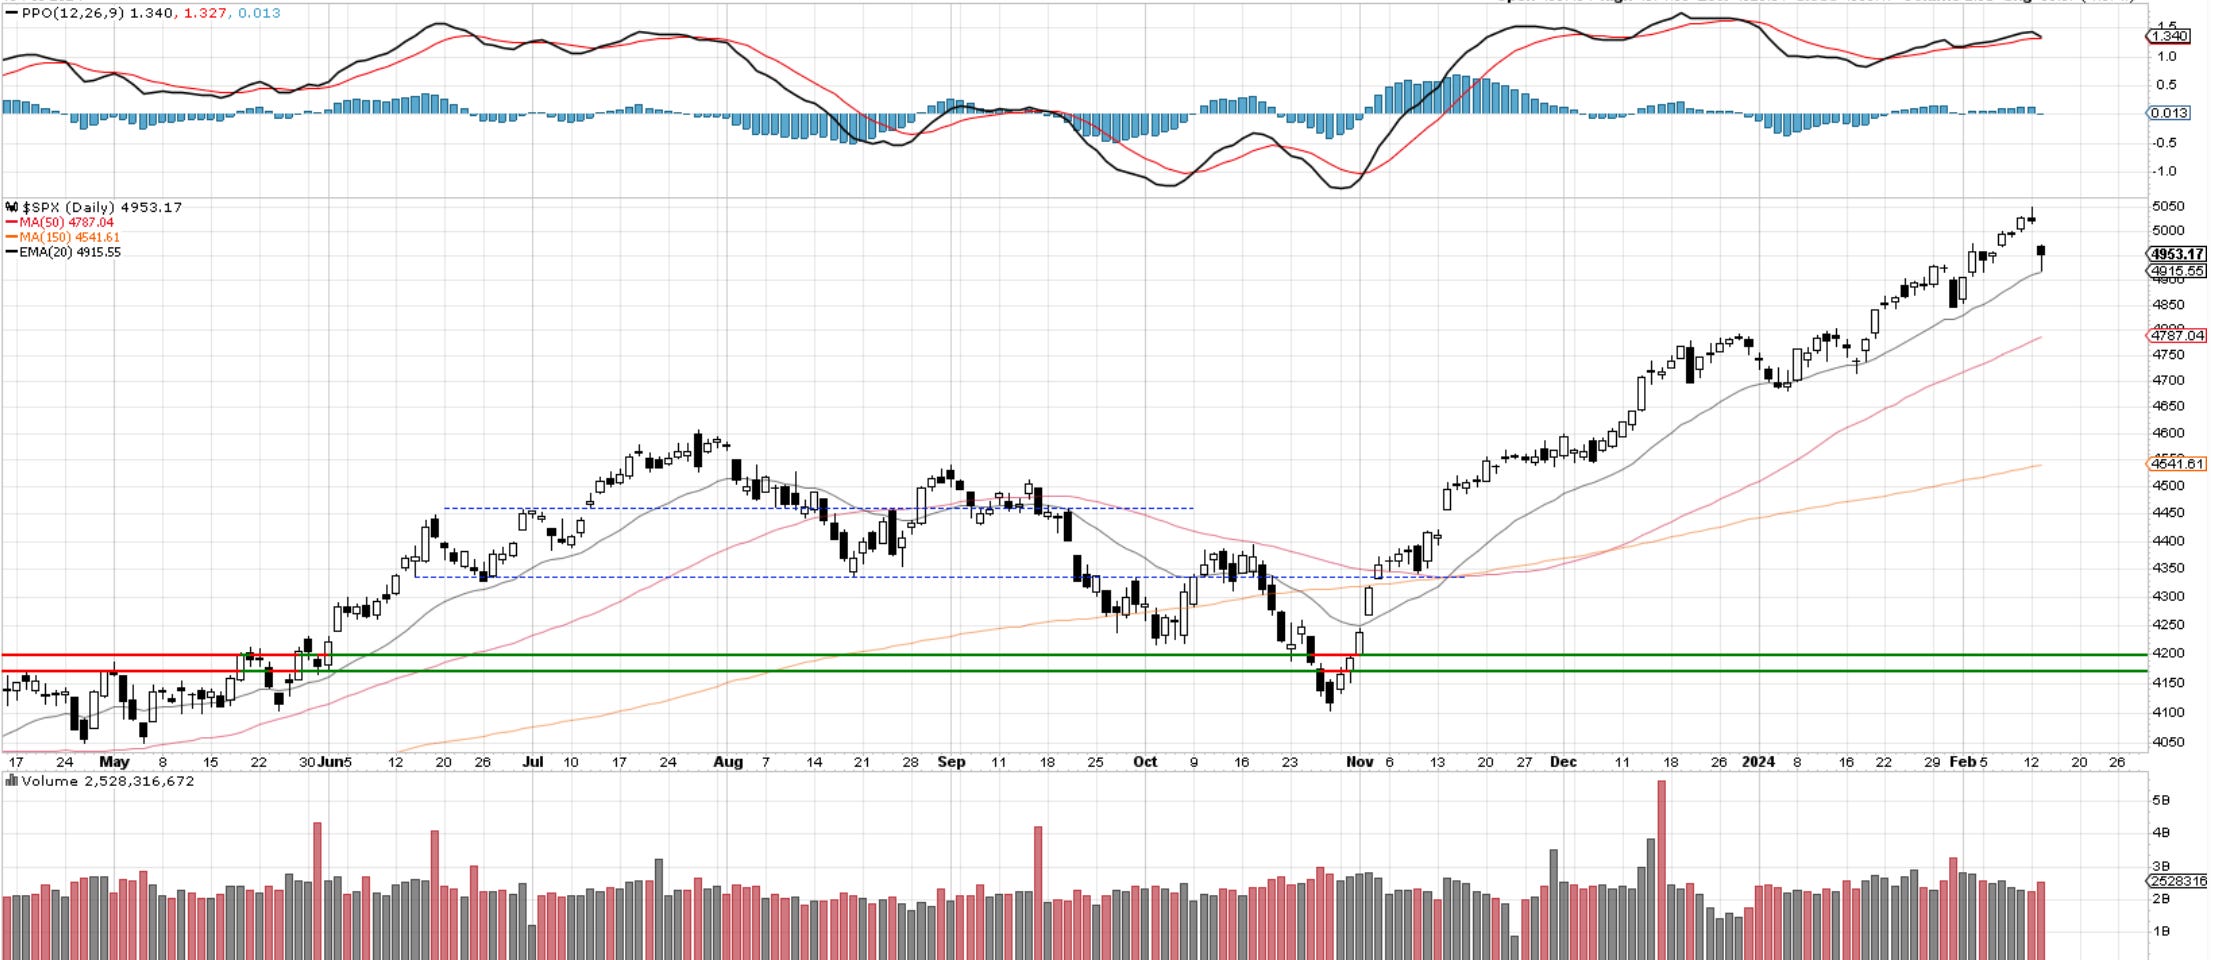
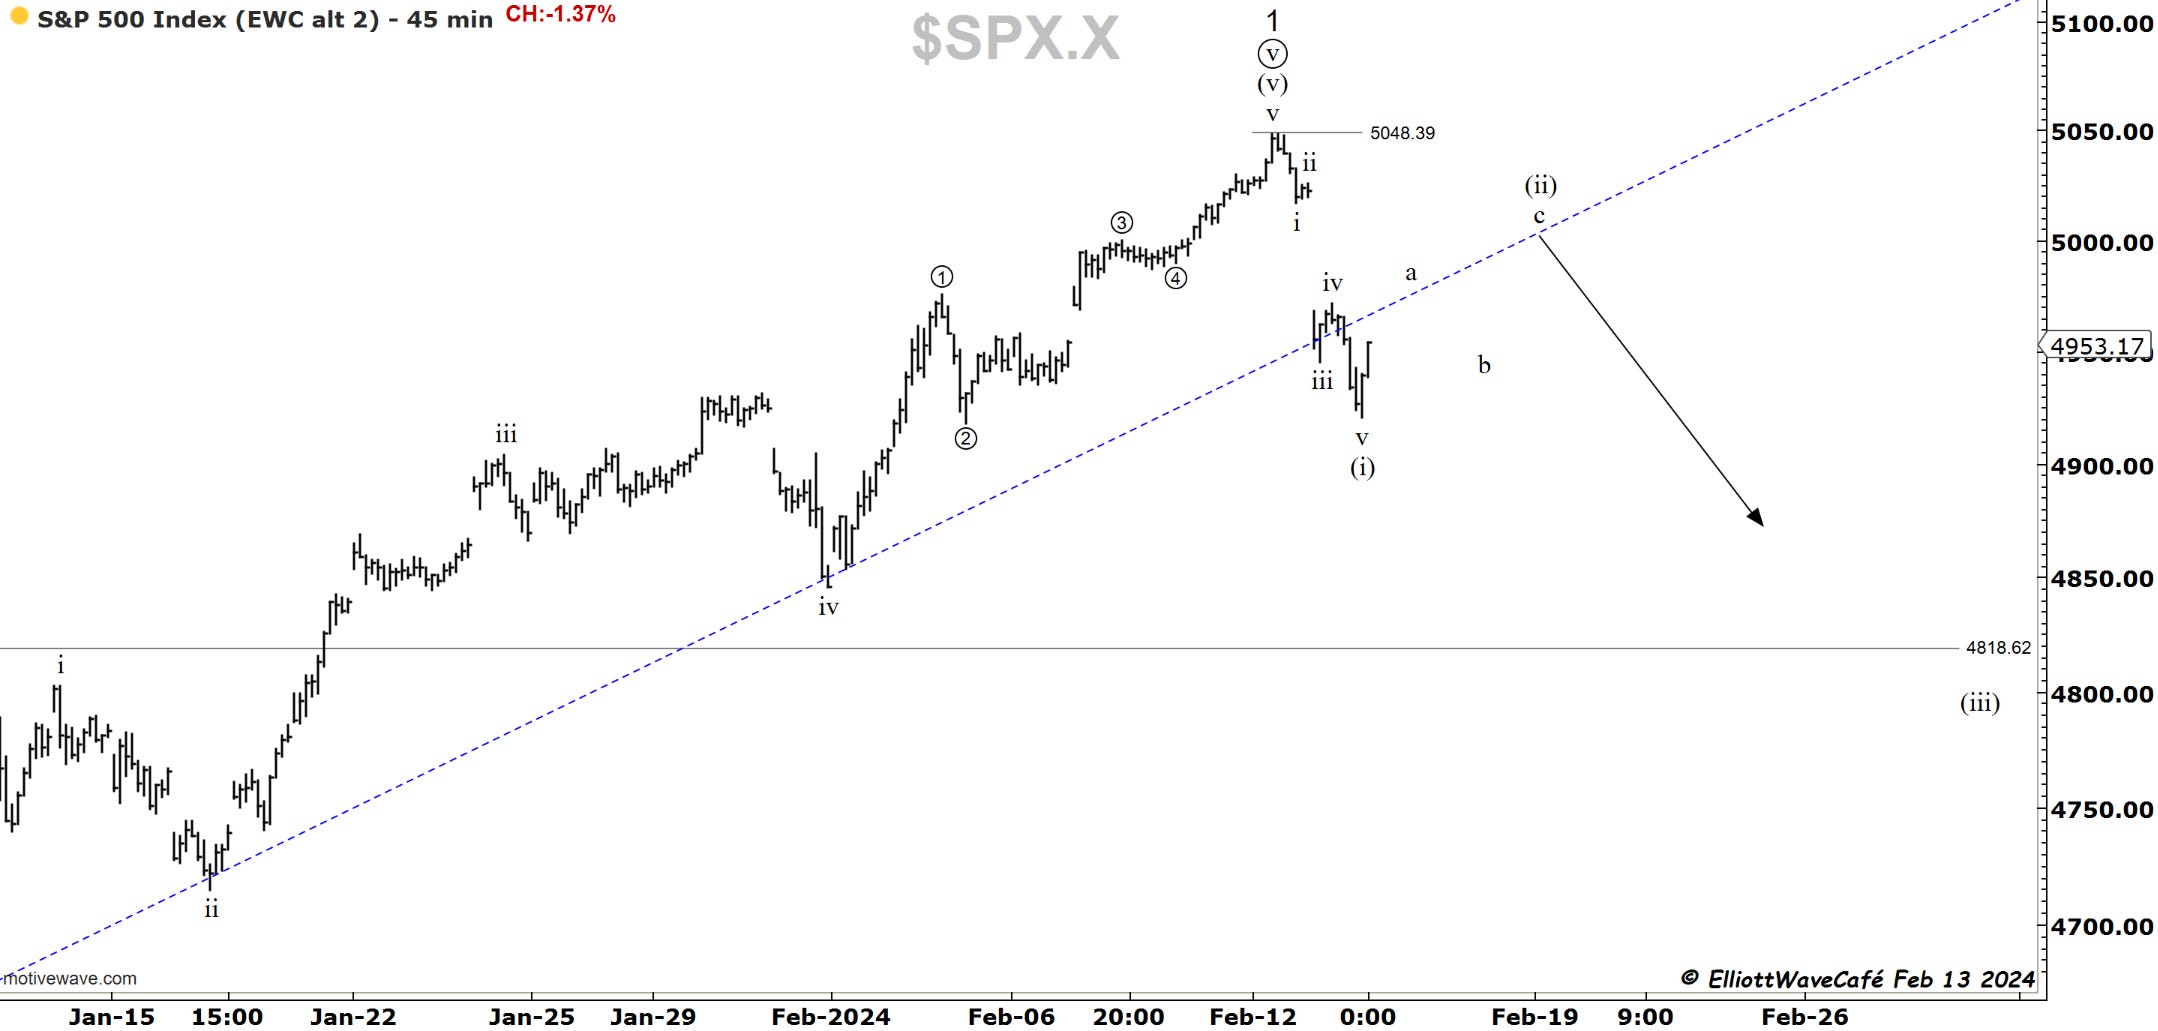
A large lower gap formed today with prices hitting the ascending trendline and the 20-day MA. We bounced off it into the close, and if previous history is any guide, there will be some fighting to get the market to close below it. We are looking for a wave ((a)) decline to confirm the start of a larger corrective pattern. As mentioned in previous issues, we should be traveling below 4818 and even as low as 4600 by the time we can think about a return to highs once again. The MACD is curling over copying the price action from Jan 31st.
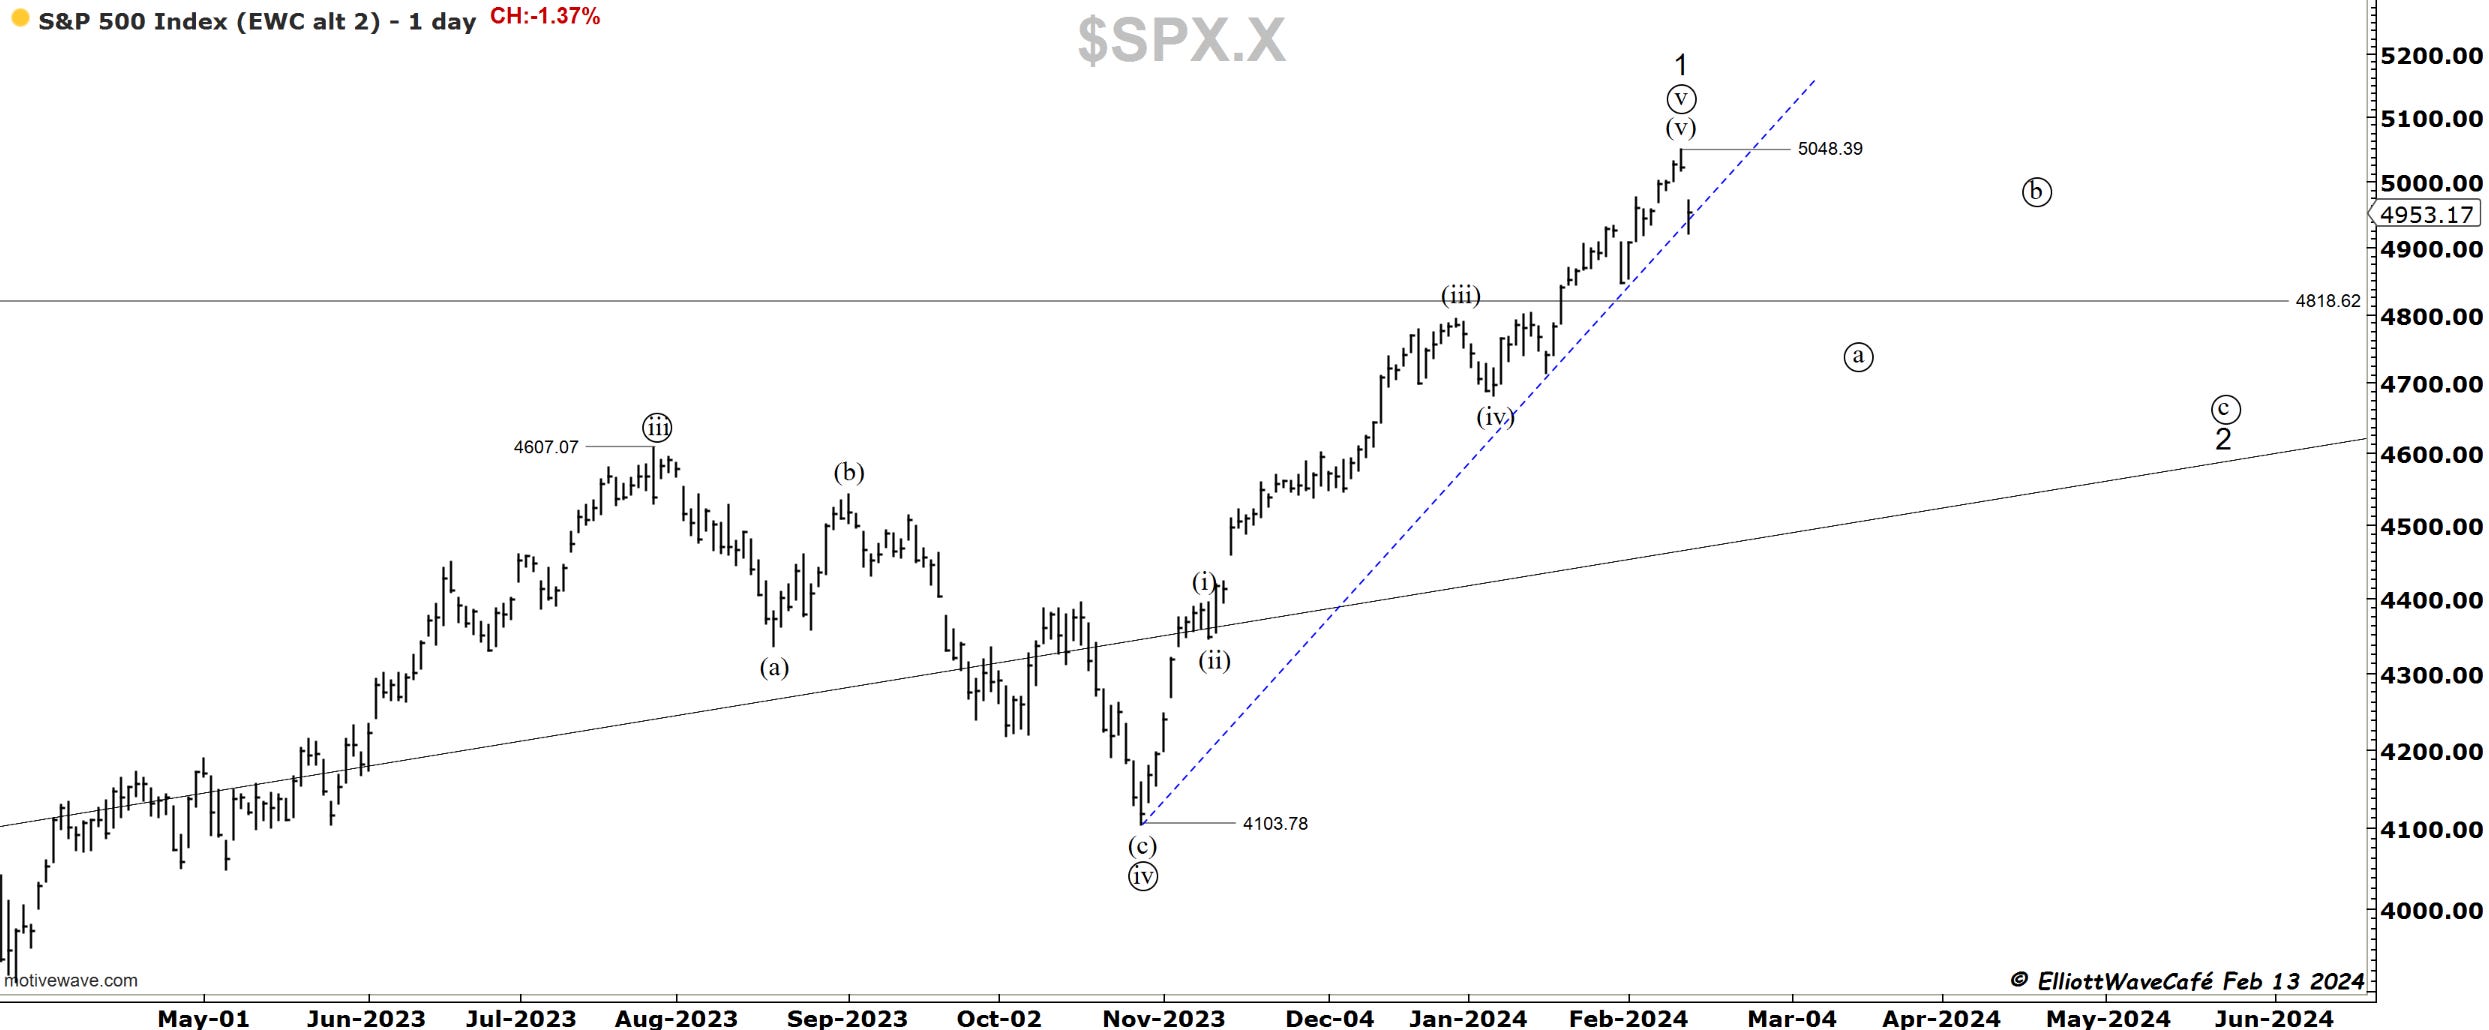
Bottom line, if a correction has started, today should only be one day in many more to come. The weekly close will be important.
Here is the 45 min charts
More in tonight’s video.
Now let’s discuss NDX, DIA, IWM, DXY, Yields, and BTC.
You can support my work in writing this newsletter with a small monthly subscription; see the new pricing offerings below.
