
The Daily Drip
Core markets charts updates and commentary
Note: The counts on the right edge are real-time, and they are prone to adjustments as price action develops. Elliott Wave has a fluid approach, is evidence-based, and requires constant monitoring of certain thresholds.
In the counts below, this (( )) = circle on chart
This is the last report of the week. Have a great weekend; I will be back Monday after closing.
SP500
The CPI came in a touch hotter than expected. We had an initial selloff, a quick rally, followed by weakness of about -0.70%, and then a recovery to almost flat. In a nutshell, there is not much in terms of price levels that was changed. The marginal new high that was made led to a count adjustment where wave (iv) was placed at January lows and a wave (v) working to be completed. My expected direction has not changed if anything I am becoming more convinced of an upcoming deeper selloff. The few charts below will show how the market is deteriorating and is not able to sustain current gains even being so close to all-time highs.
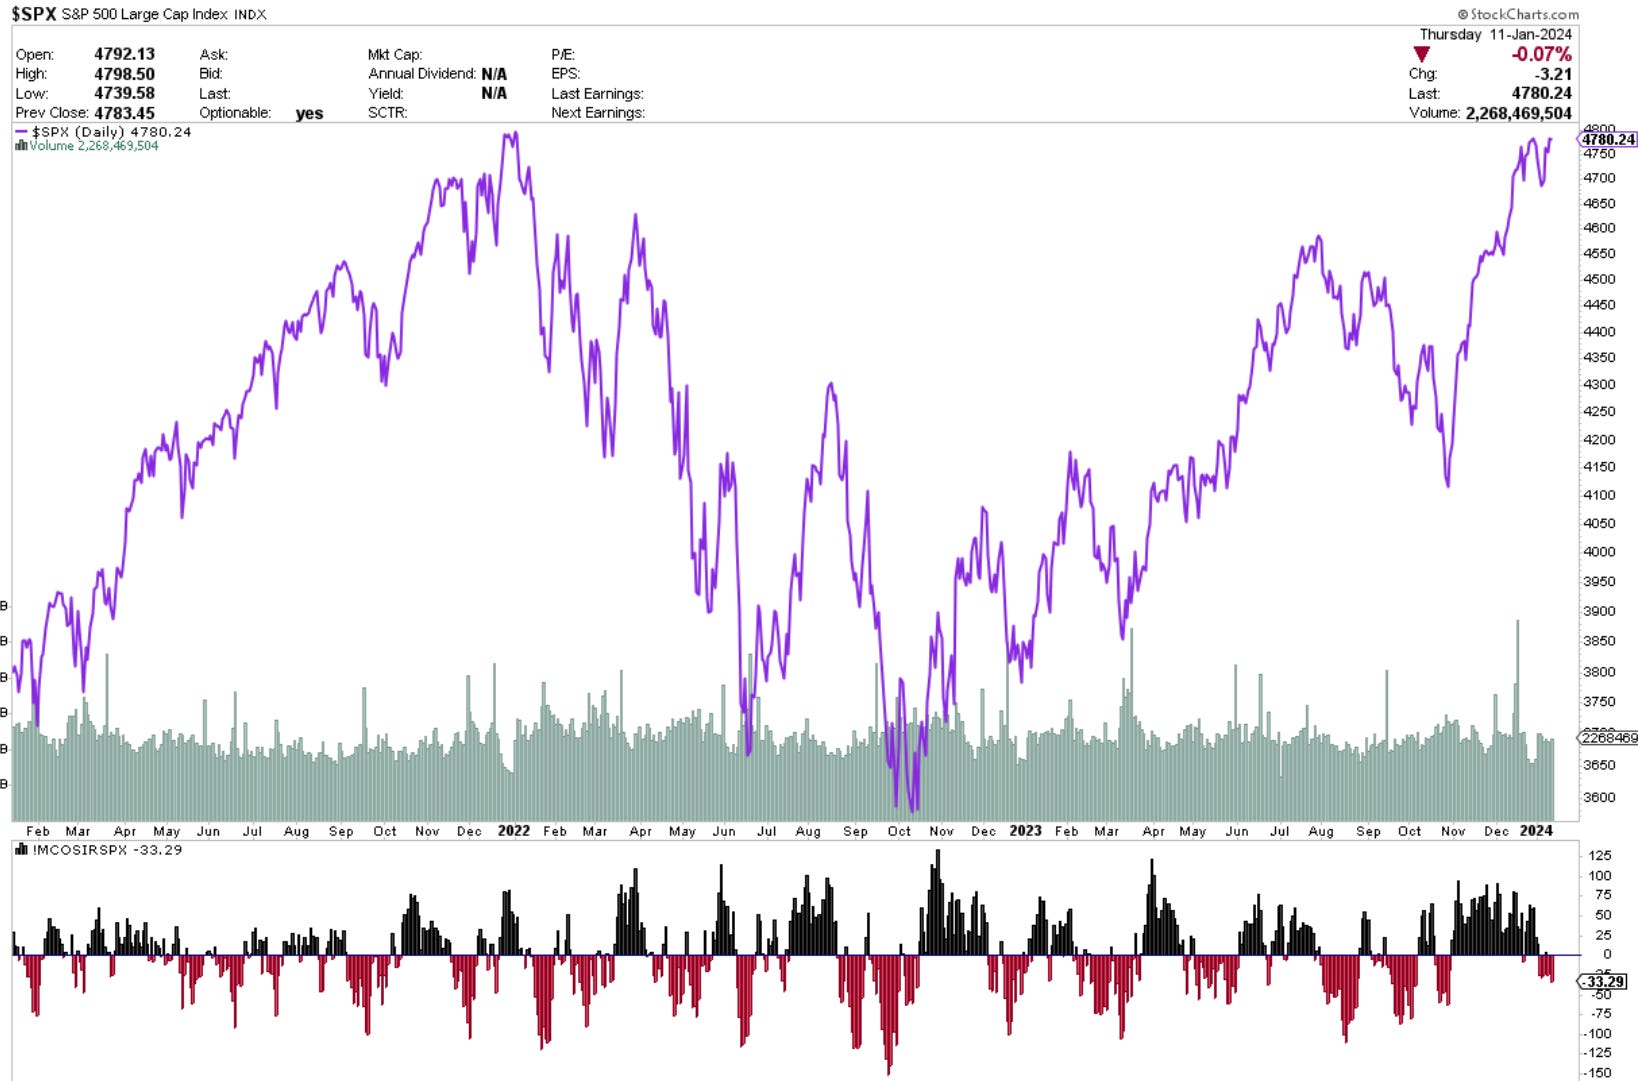
This is the McClellan Oscillator. You can see how negative we are with prices trying to make new highs. The declining issues are dropping much faster than the advancing are rising.
(Developed by Sherman and Marian McClellan, the McClellan Oscillator is a breadth indicator derived from Net Advances, which is the number of advancing issues less the number of declining issues. Subtracting the 39-day exponential moving average of Net Advances from the 19-day exponential moving average of Net Advances forms the oscillator.) You can see how negative we are with prices trying to make new highs.
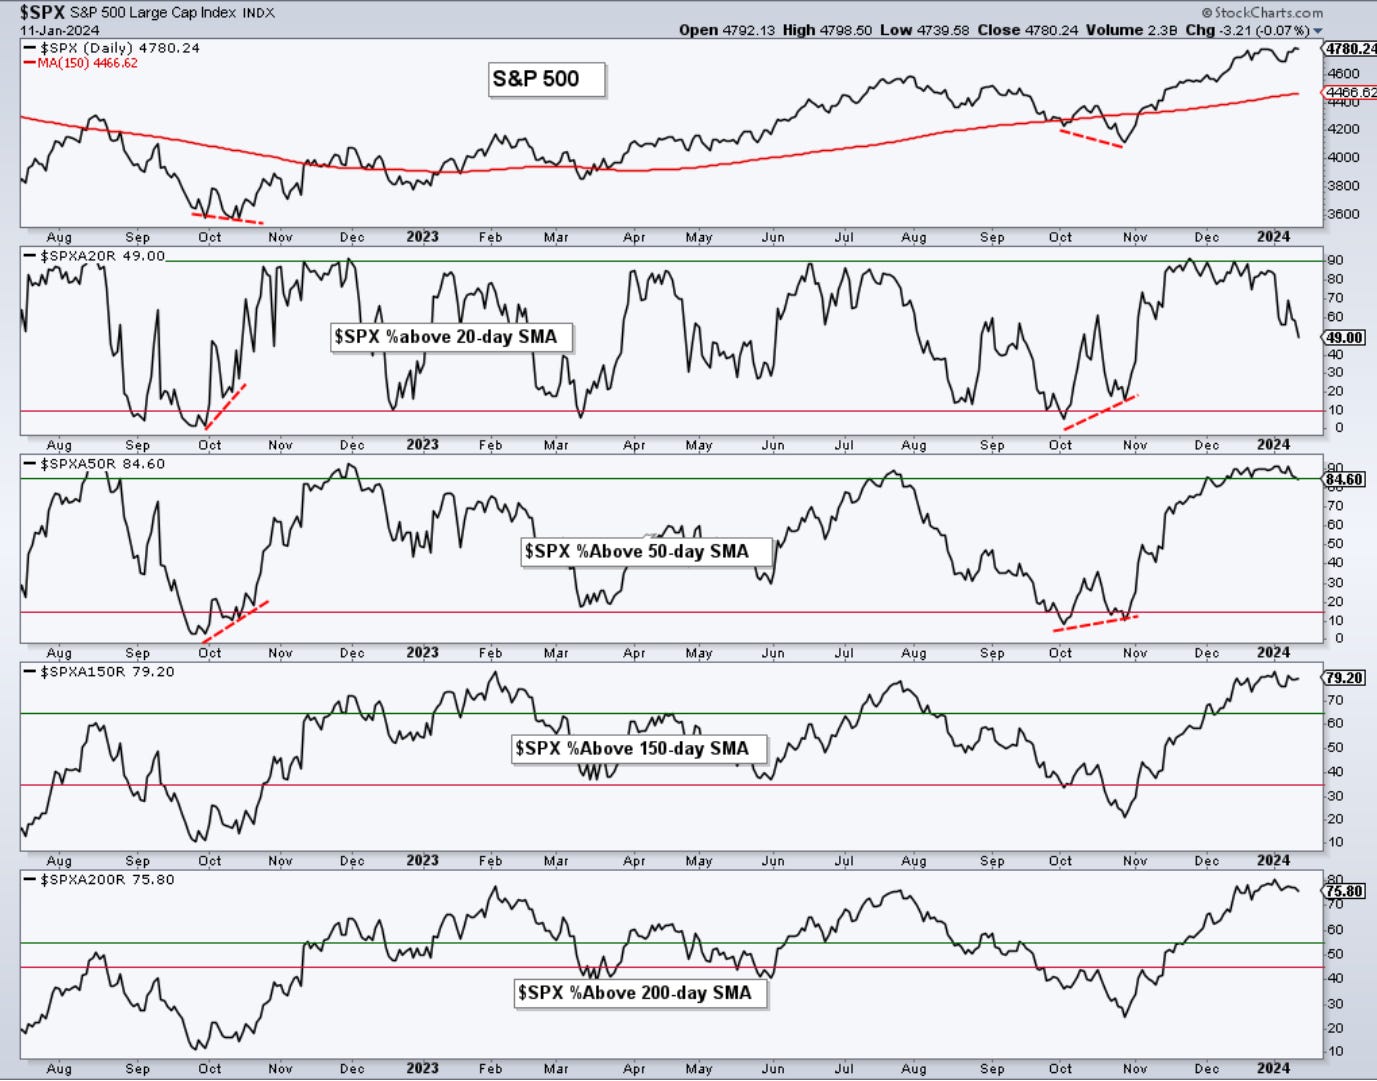
This is a basic breadth based on prices above different moving averages. While the longer-term ones seem to be still intact, notice how the 50-day is starting to tilt lower, while the 20-day has been declining for a while. About 50% of stocks in the SP500 are now below their 20-day MA.
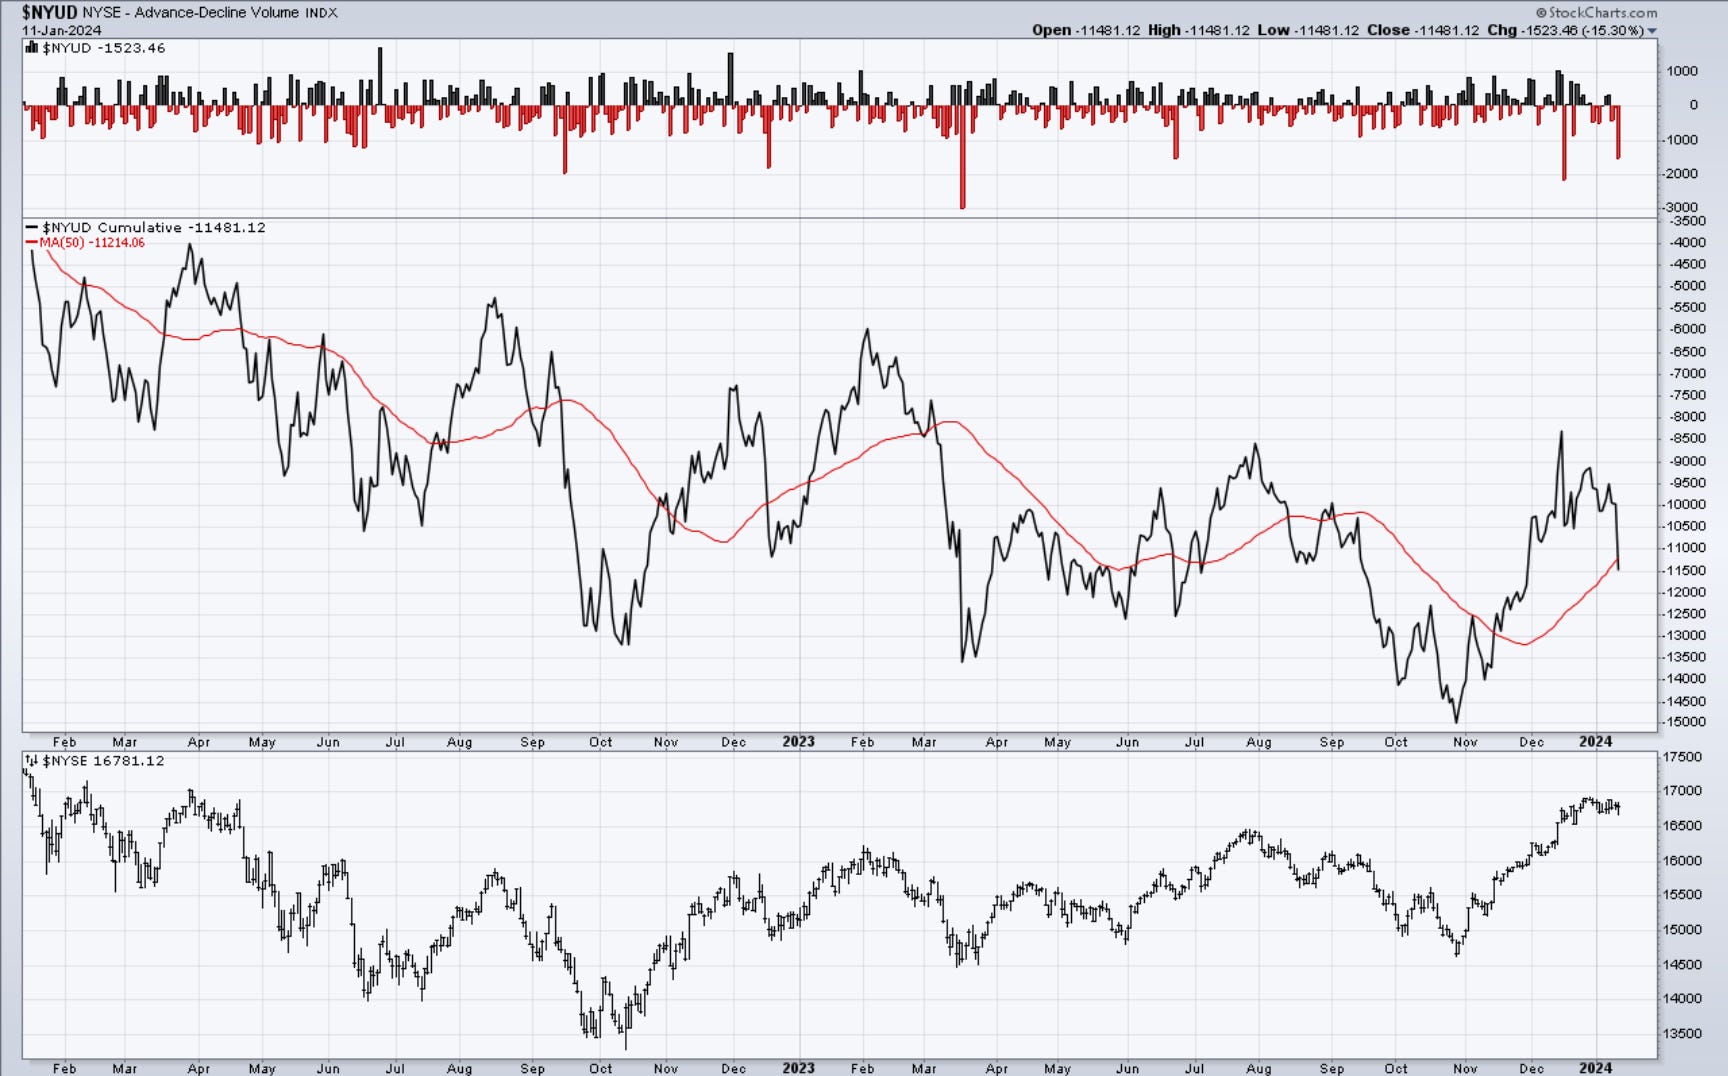
We’re looking below at the NYSE and the volume of declines vs the advances. The upper panel shows the daily swings, while the main chart shows the cumulative volume. Dropping sharply with almost no upside volume existing.
Nothing is a 100% sure thing in the markets. But we look underneath the price and see how it behaves, especially when the price is acting funny. There are multiple ways to gauge the health of a trend, and the indicators above are just a few of them. They are telling me to be on guard.
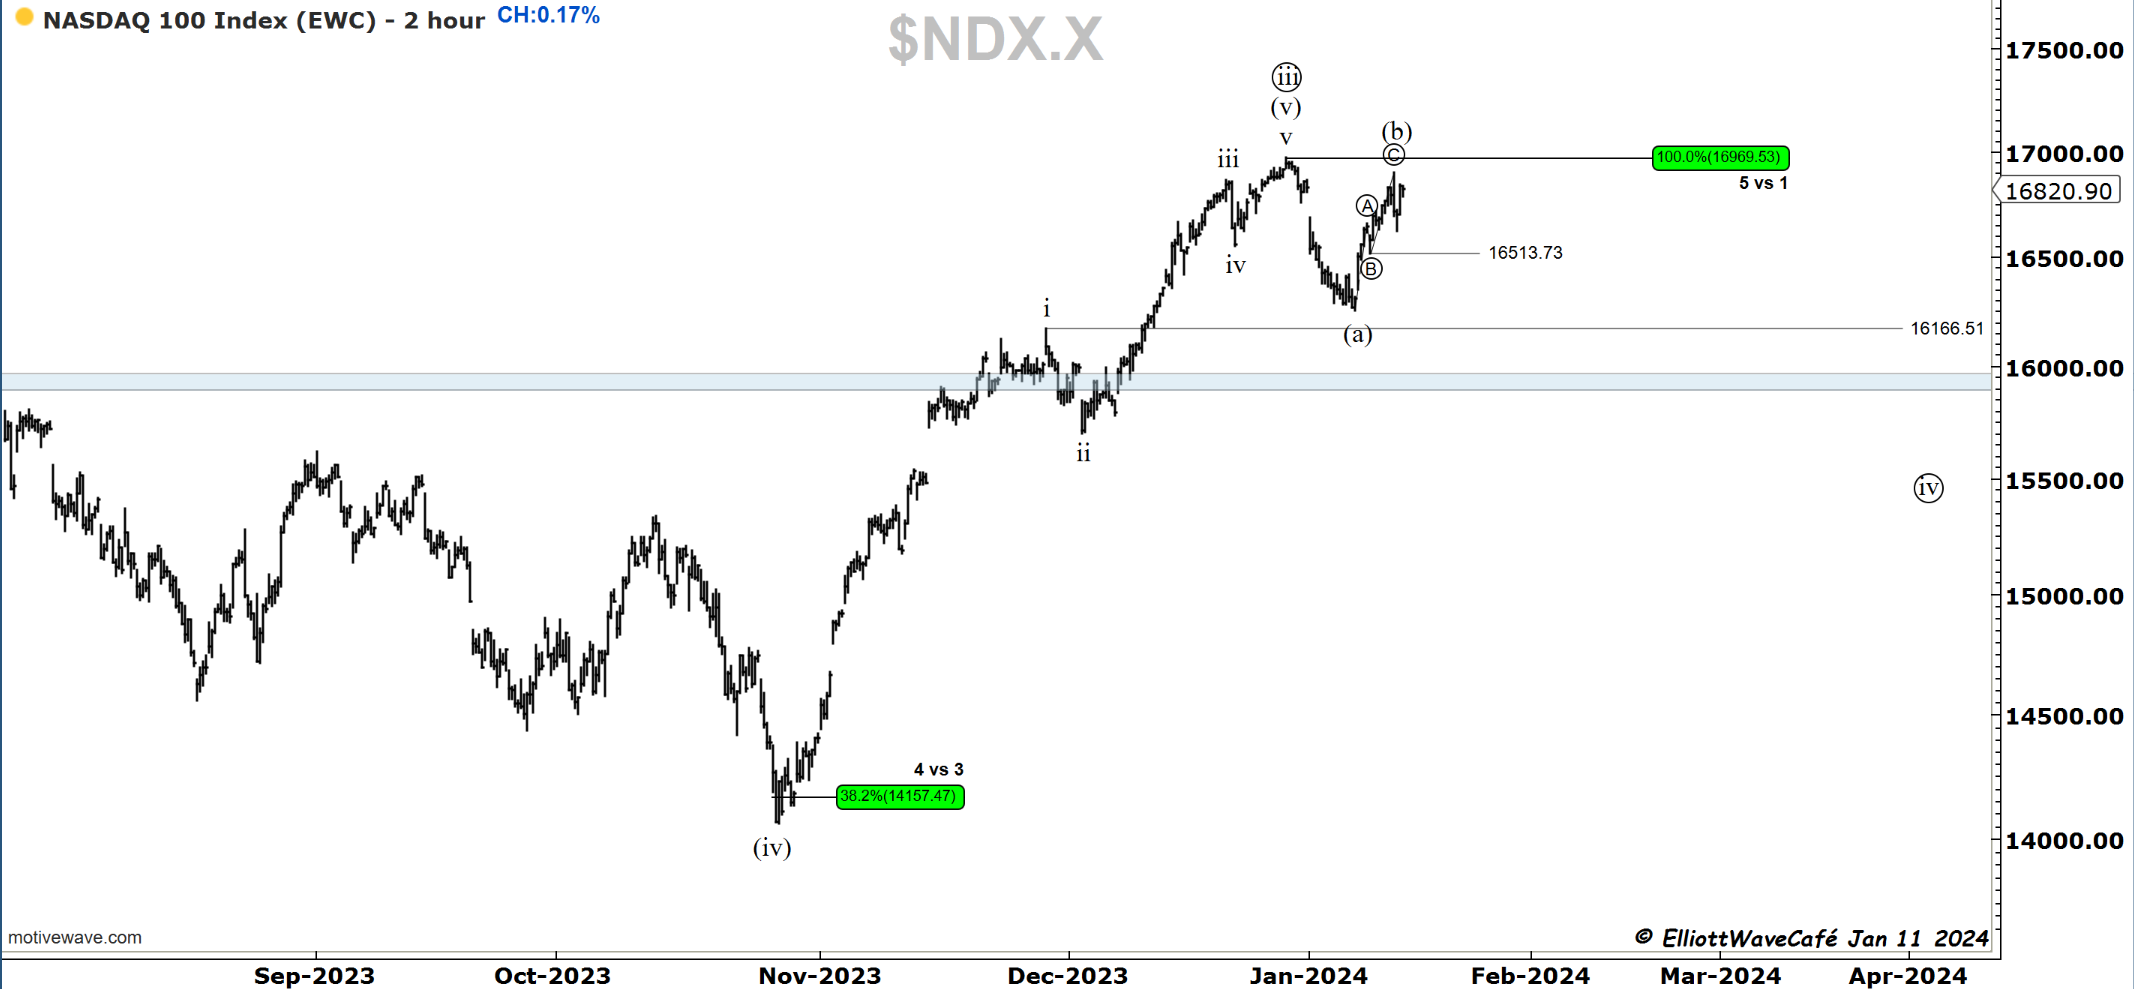
Nasdaq100
Nasdaq squeezed by a positive close. We did not make a fresh high here, so we will keep the (b) wave as it is for now. There is severe breadth deterioration in the Nasdaq composite as well.
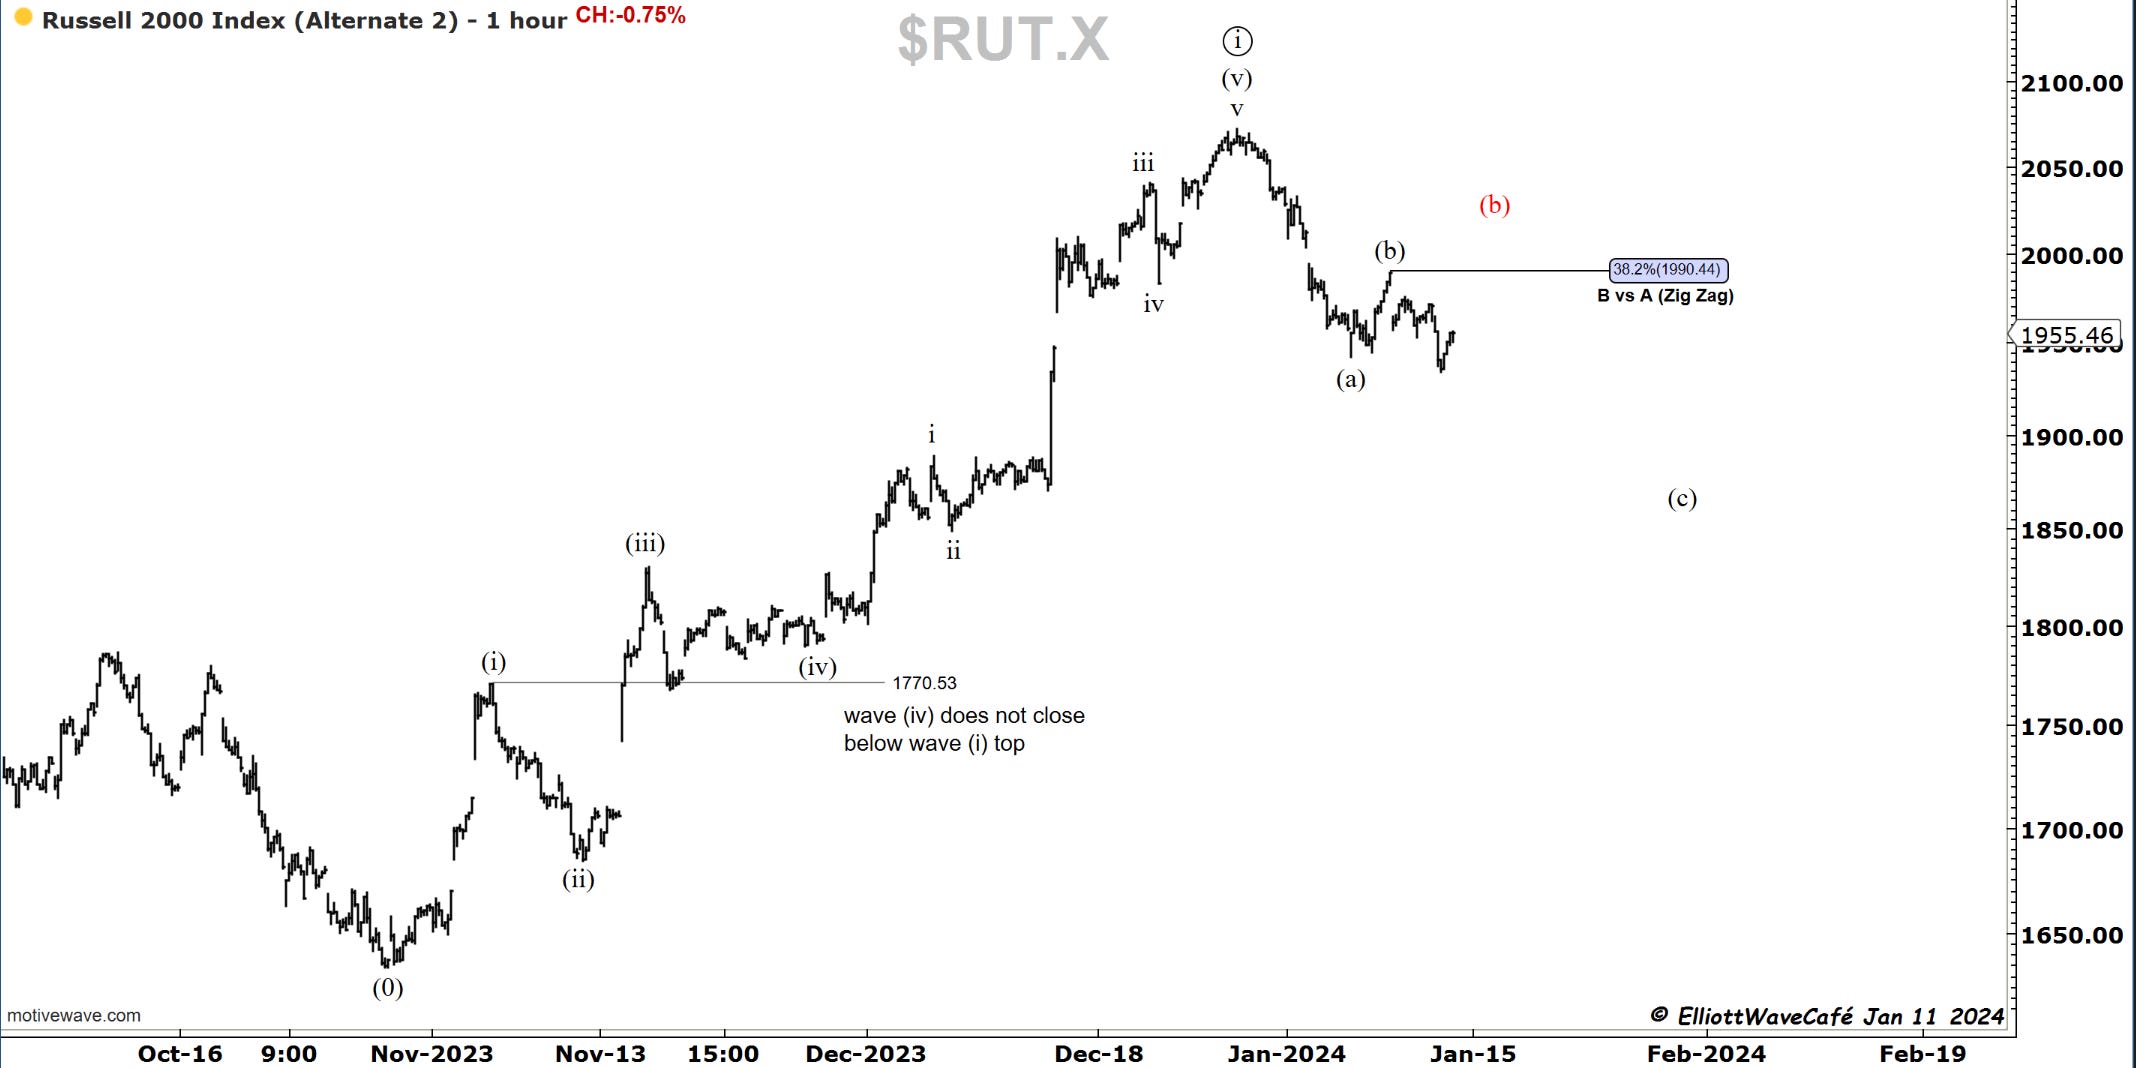
RUSSELL 2000
The three-wave rally in the Russell led to a new low. Small caps were very weak today. The decline is not fully impulsive, so if correct, there should be more to go until some level of proportion is reached between waves. If it manages to stage a rally, it will be in wave c of a flat in (b).

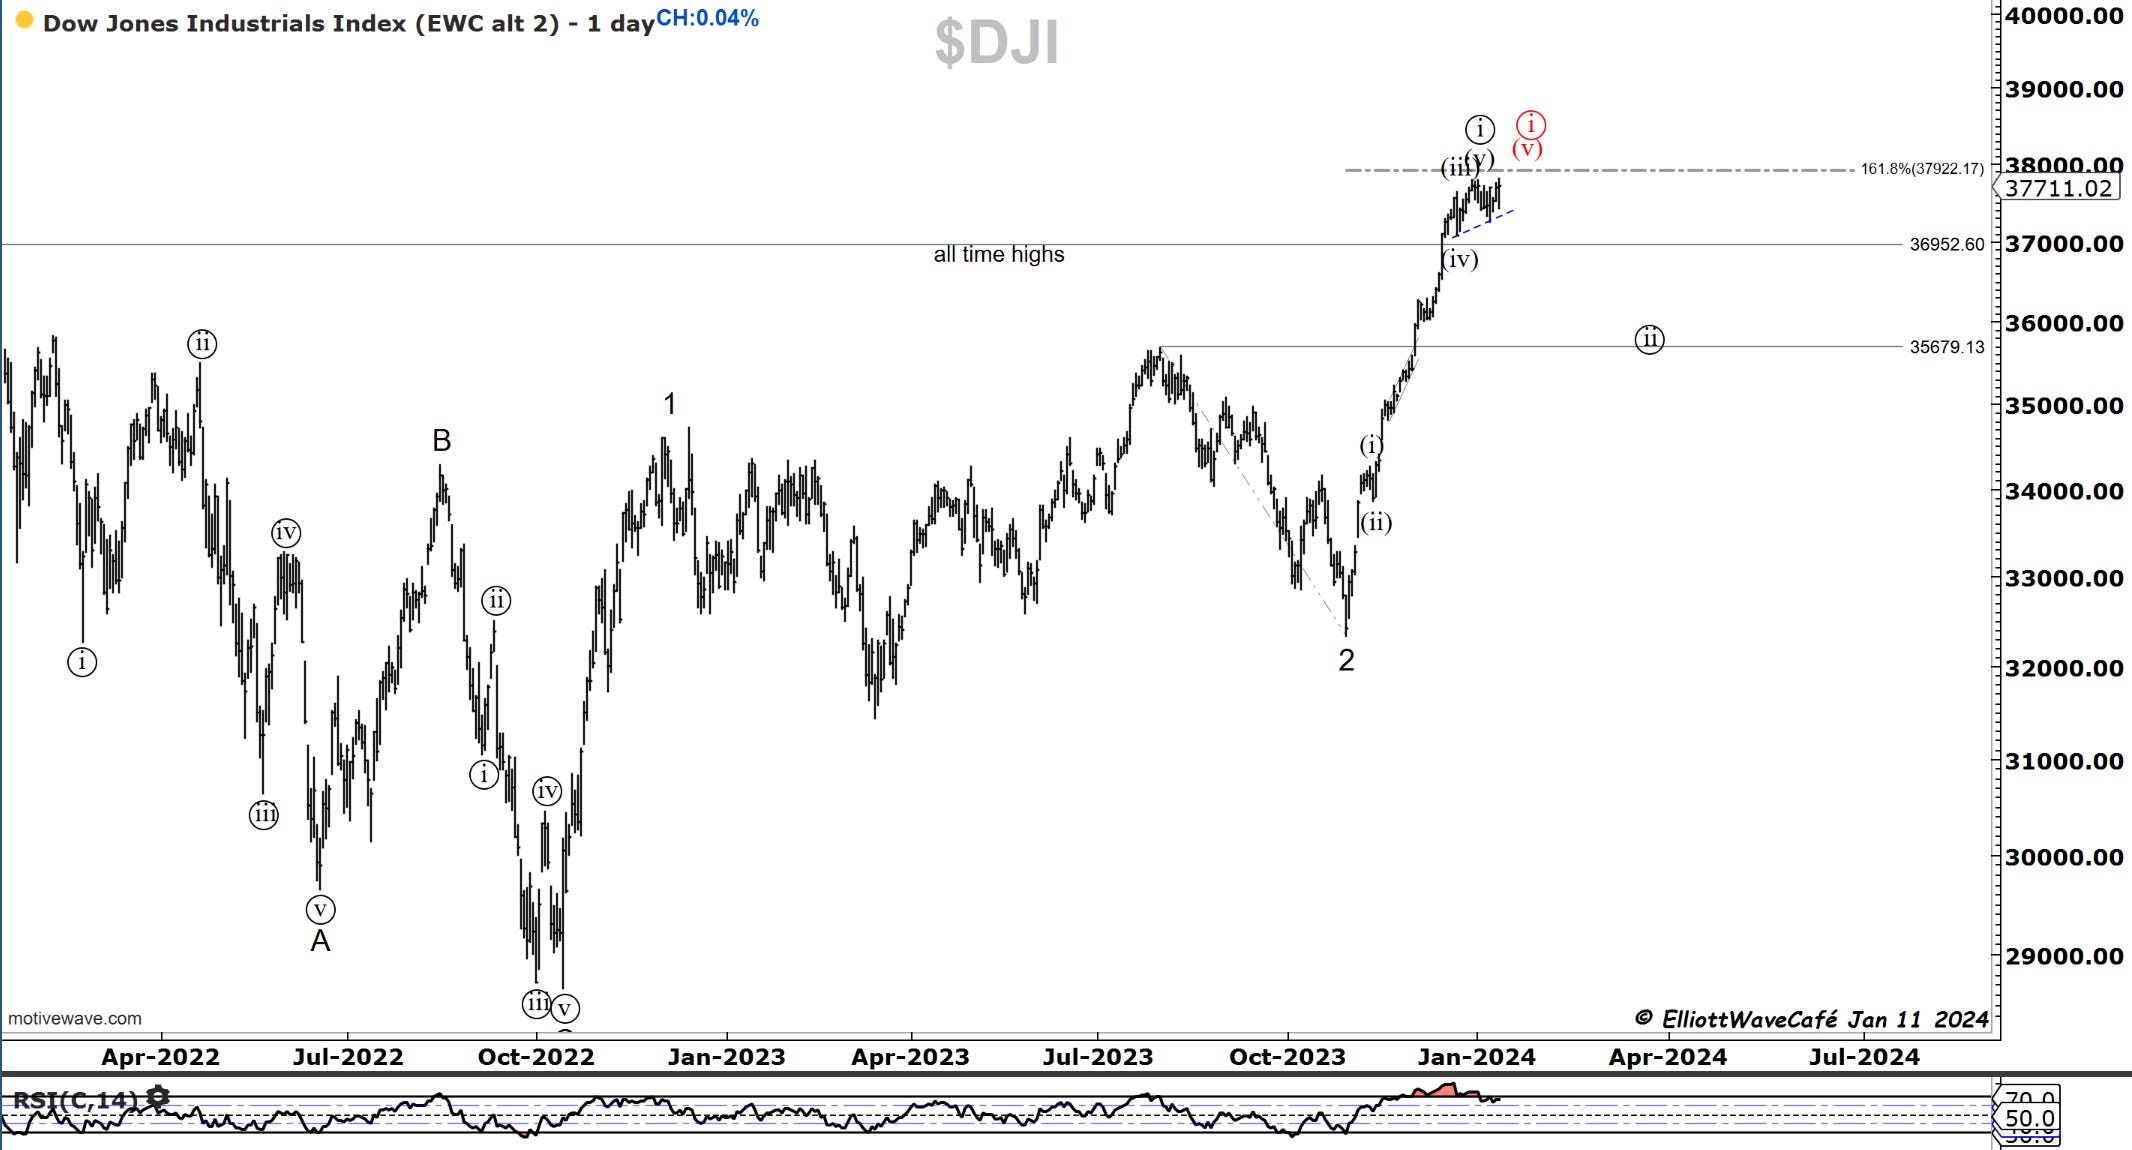
Dow30
prior comments in Dow remain. Targeting 37k, then 36k towards February/March.
Today’s higher swing did not make a new high, but it has muddied the initial proposed declining structure. I don’t see us exploding higher from here, however. Any marginal new high should be met with selling and increased odds of corrective action. I have my finger on the trigger to take advantage of trading the upcoming decline.
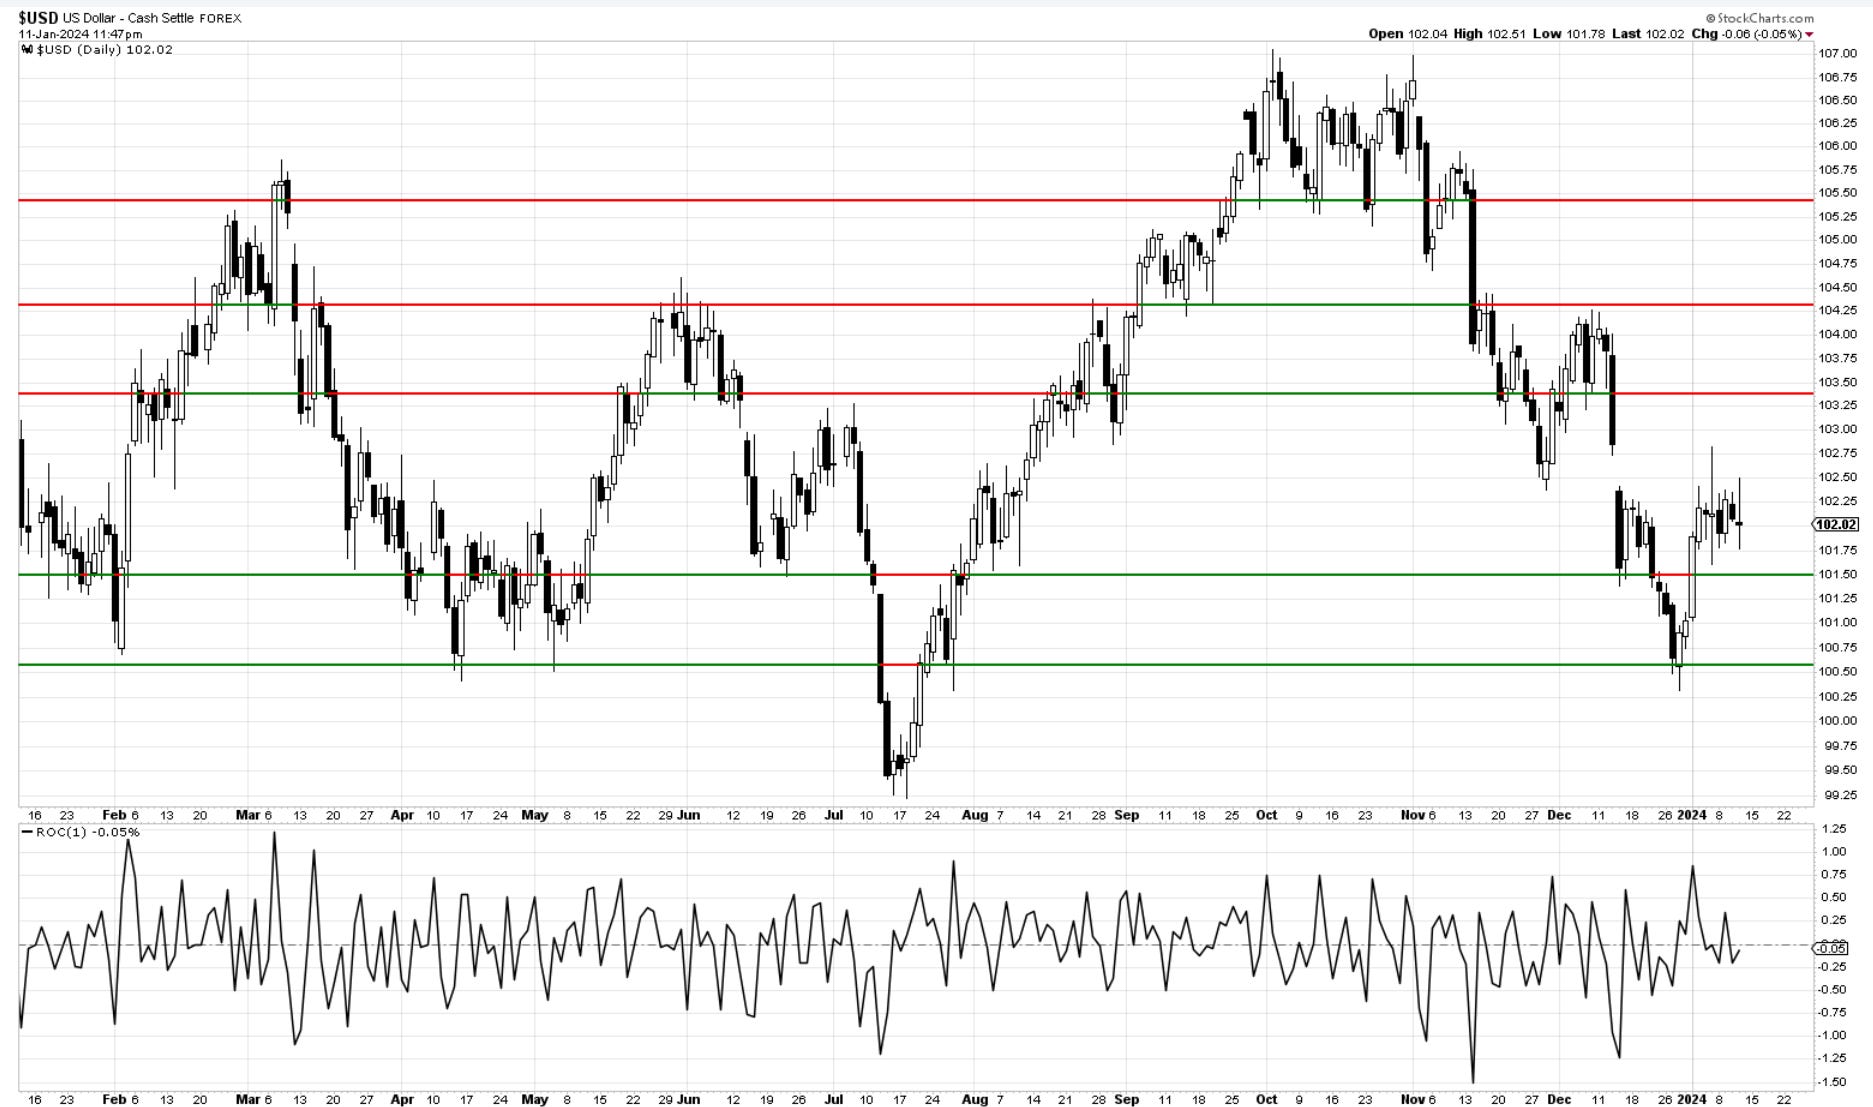
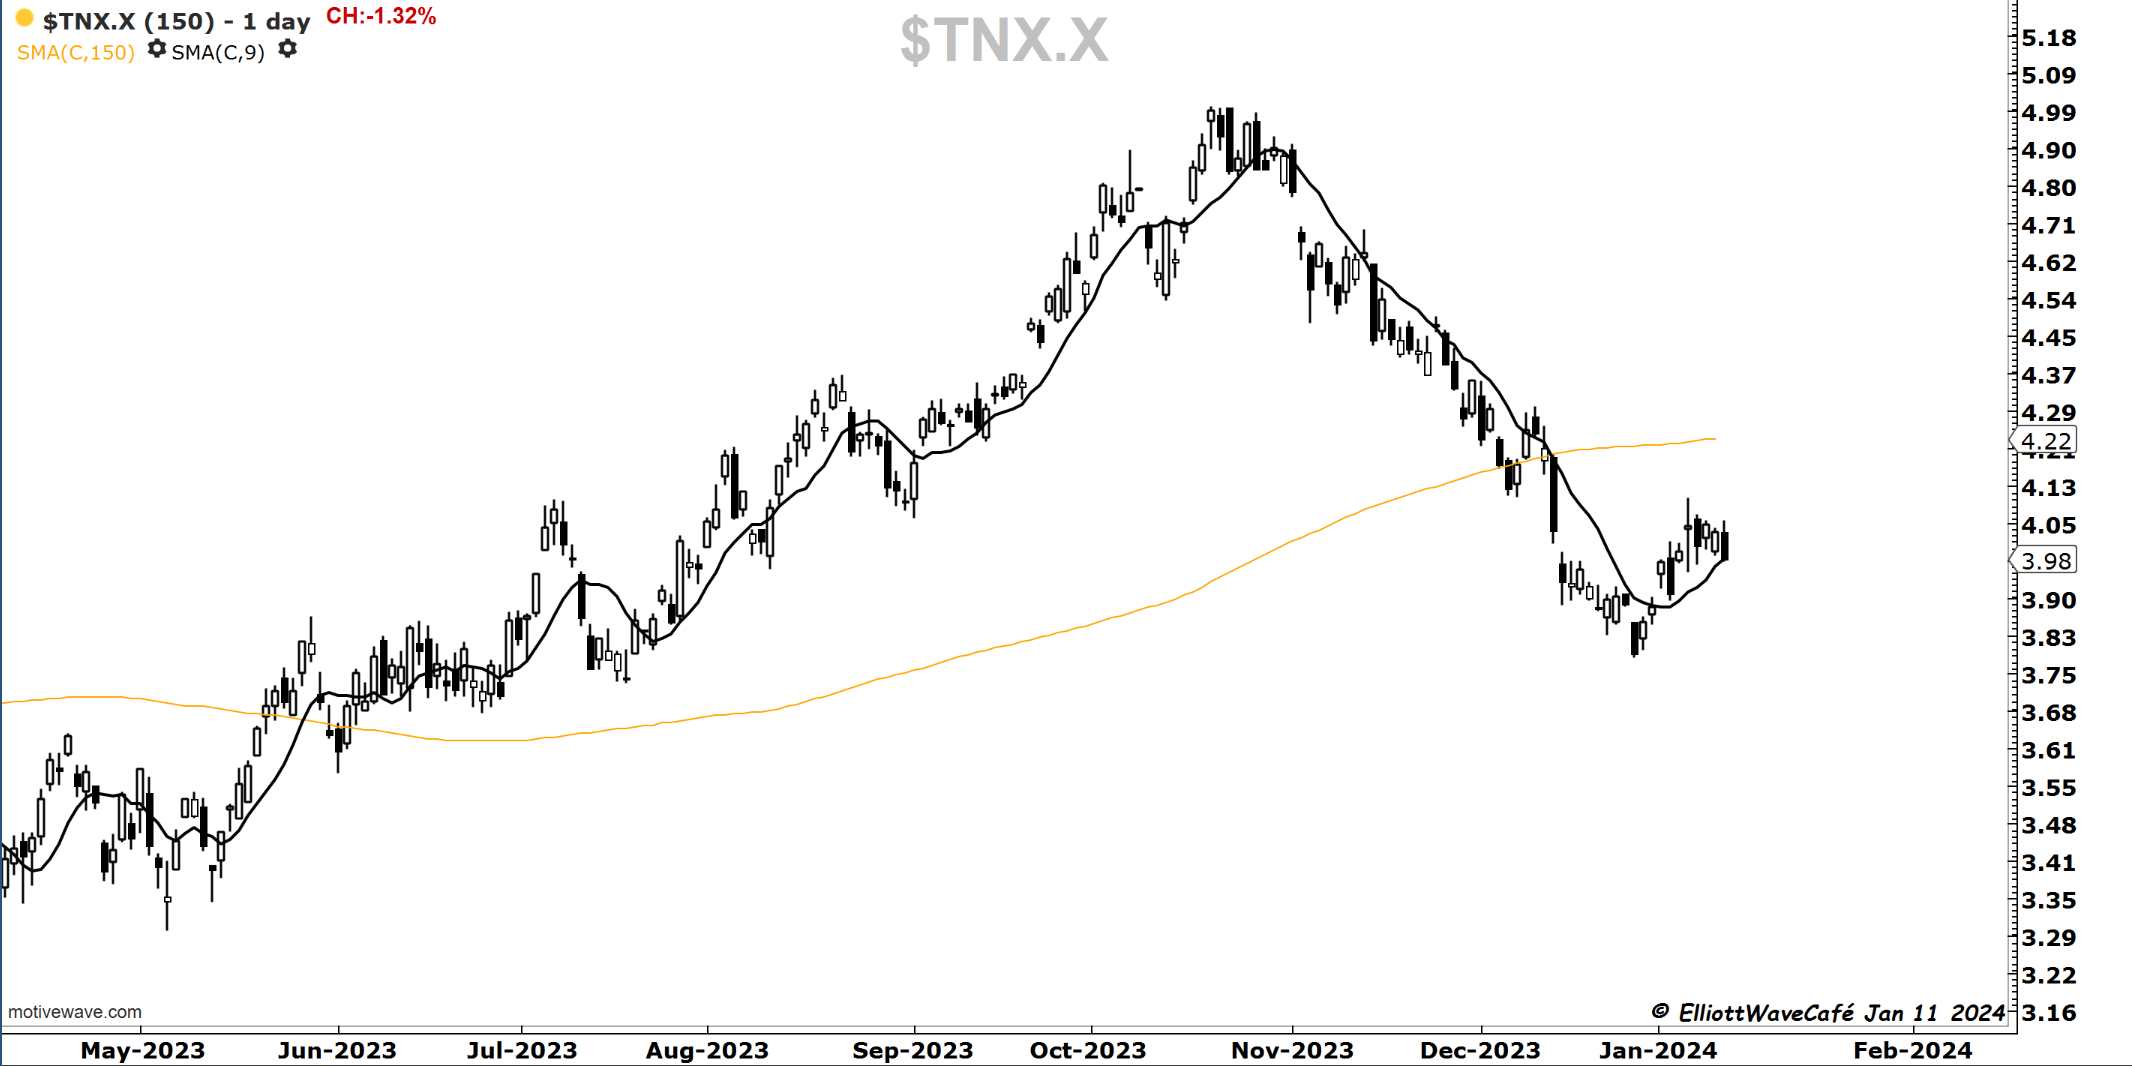
US Dollar and Yields
Both dollar and yields rallied quickly in the CPI news but then fell back into their ranges. The gains were not sustained. Nothing has changed the larger picture, however. The dollar has found a low at the end of December, and it is now on an upswing. We discussed cycles in prior issues.
Gold
Price action in Gold is so muted. I need to refer to the weekly time frame to regain perspective. There's nothing to do but watch for now. Below 1960, bearish, above 2100 bullish.
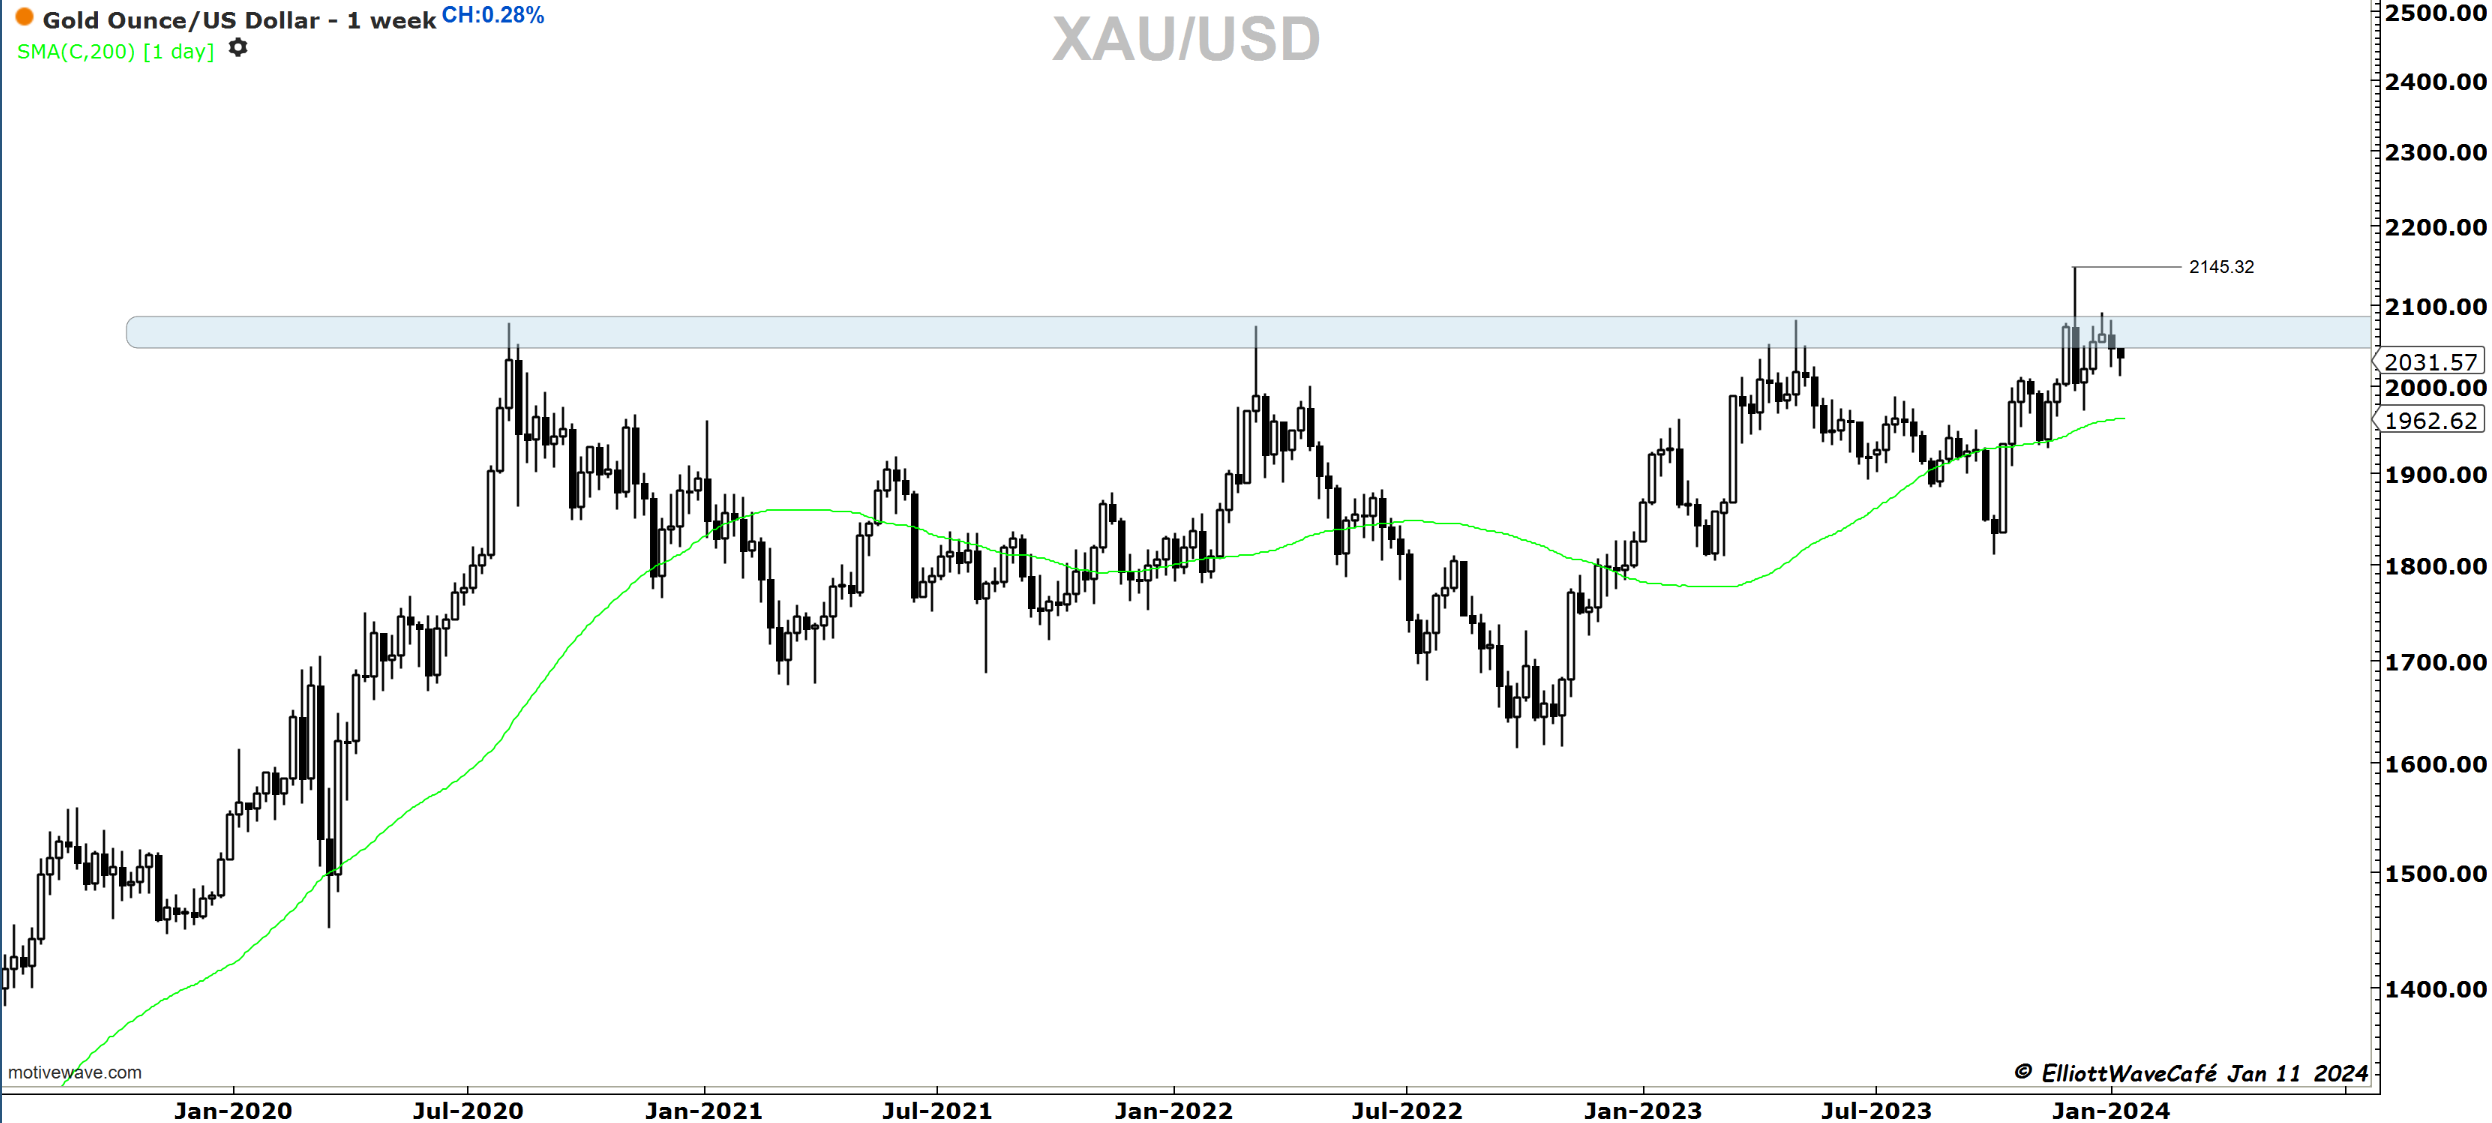
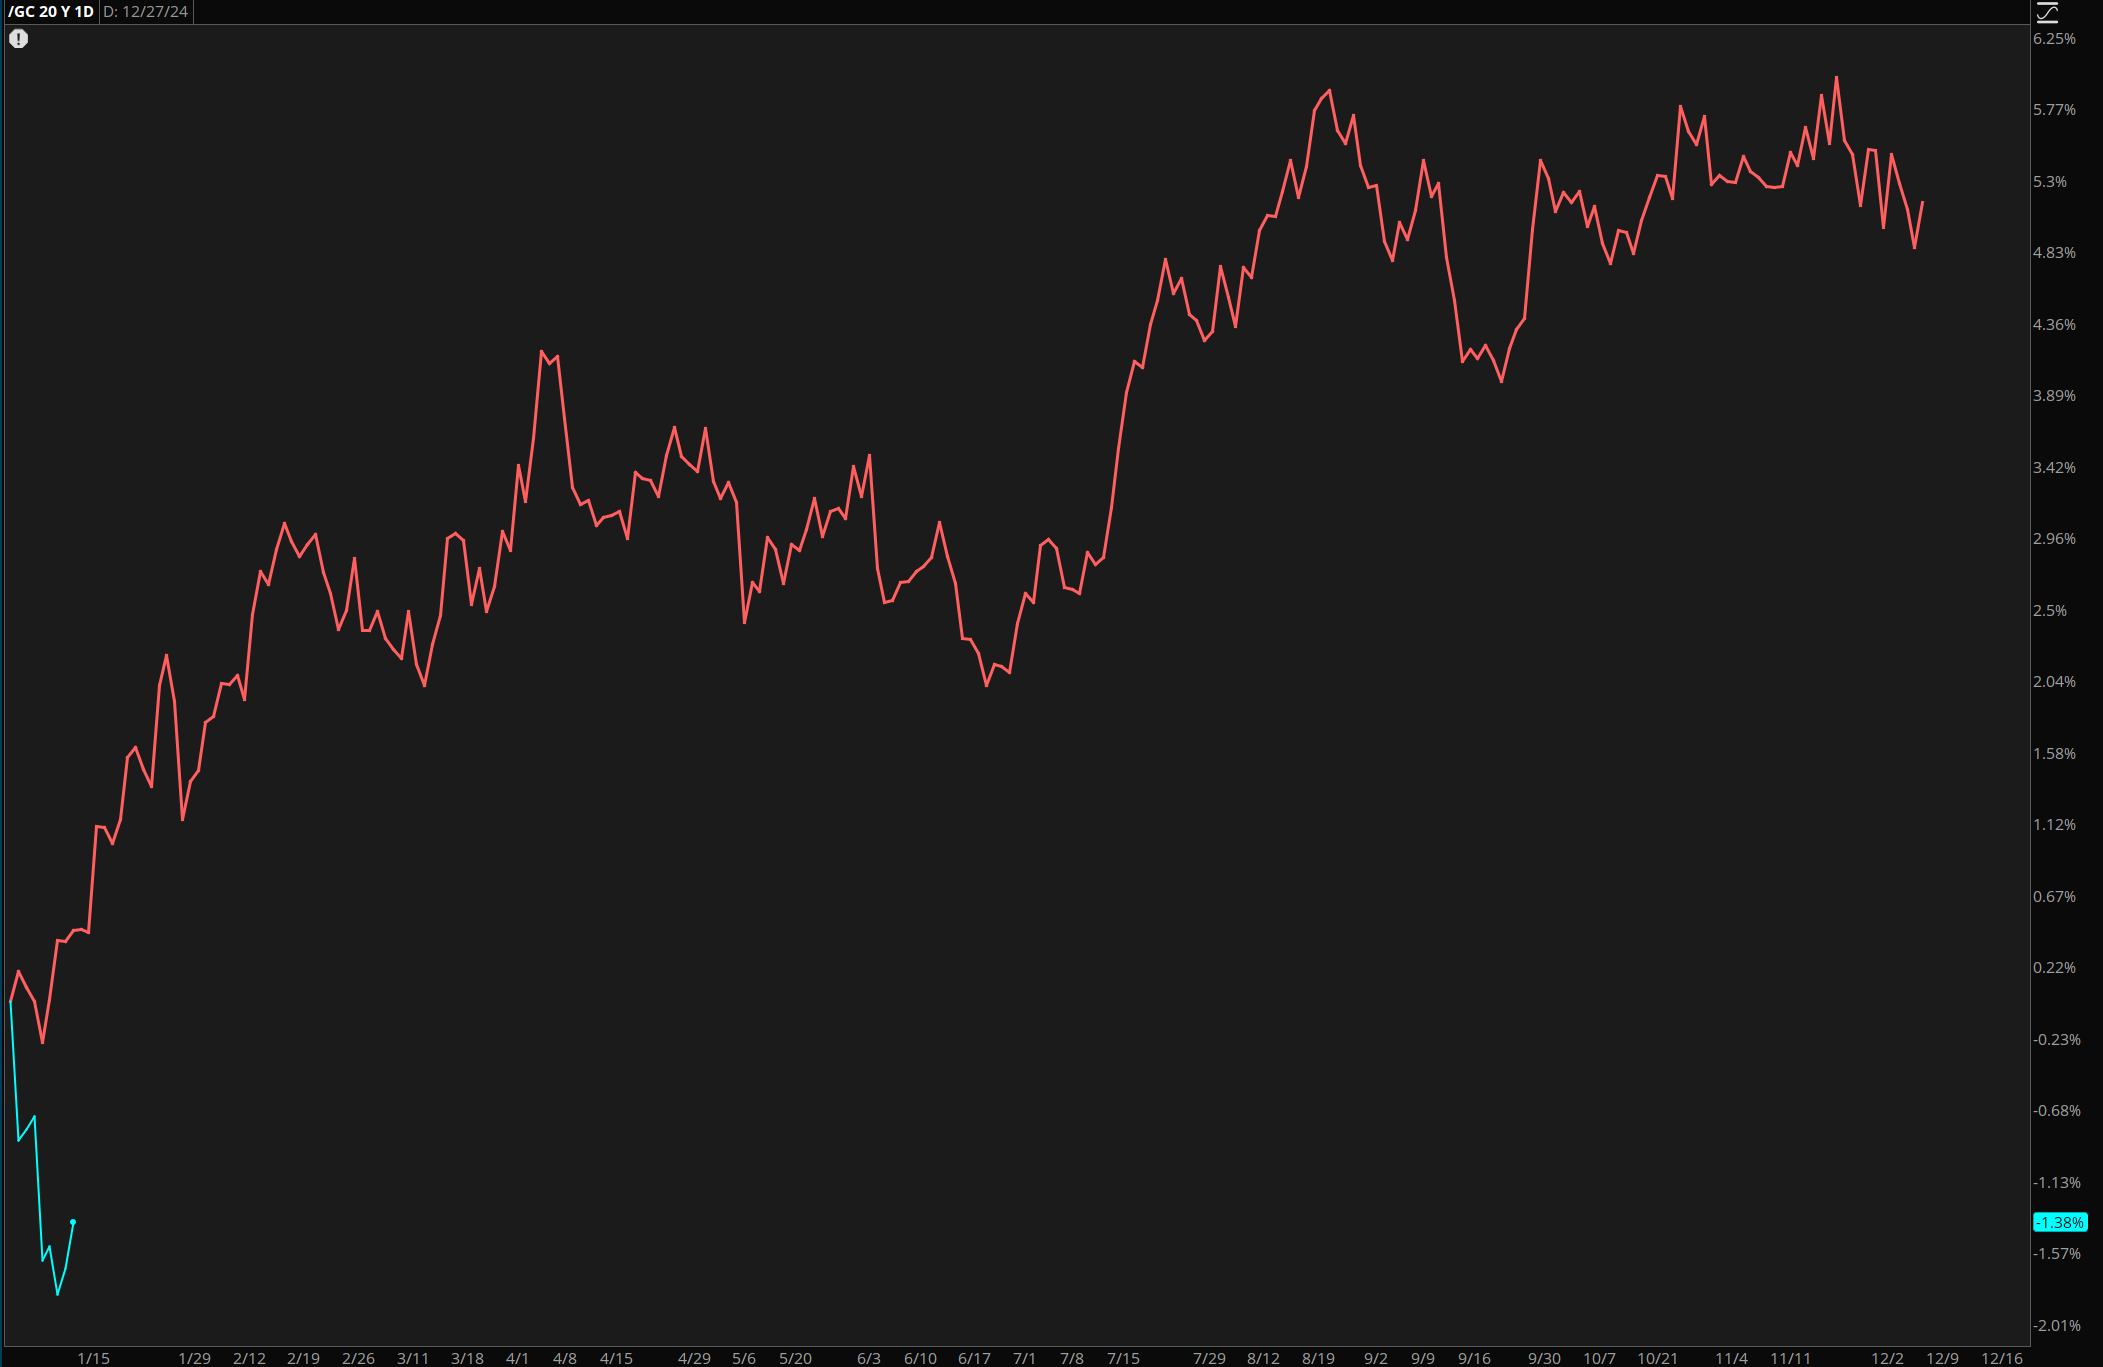
Seasonally, we’re supposed to be in a strong period for Gold, but prices have yet to move.
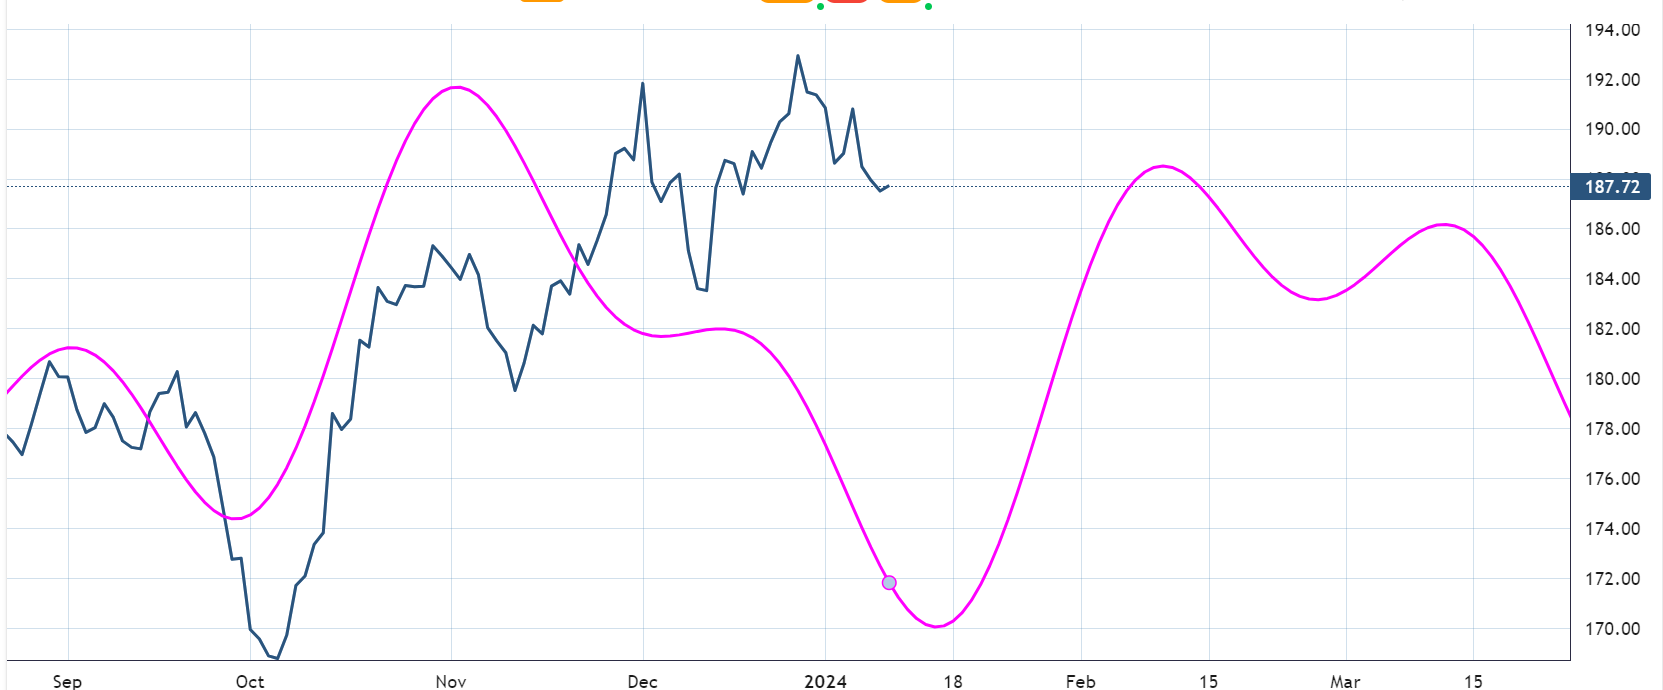
Even cycles are mixed at this daily time frame. Possible an upswing after January 20th. GLD below.
Bitcoin
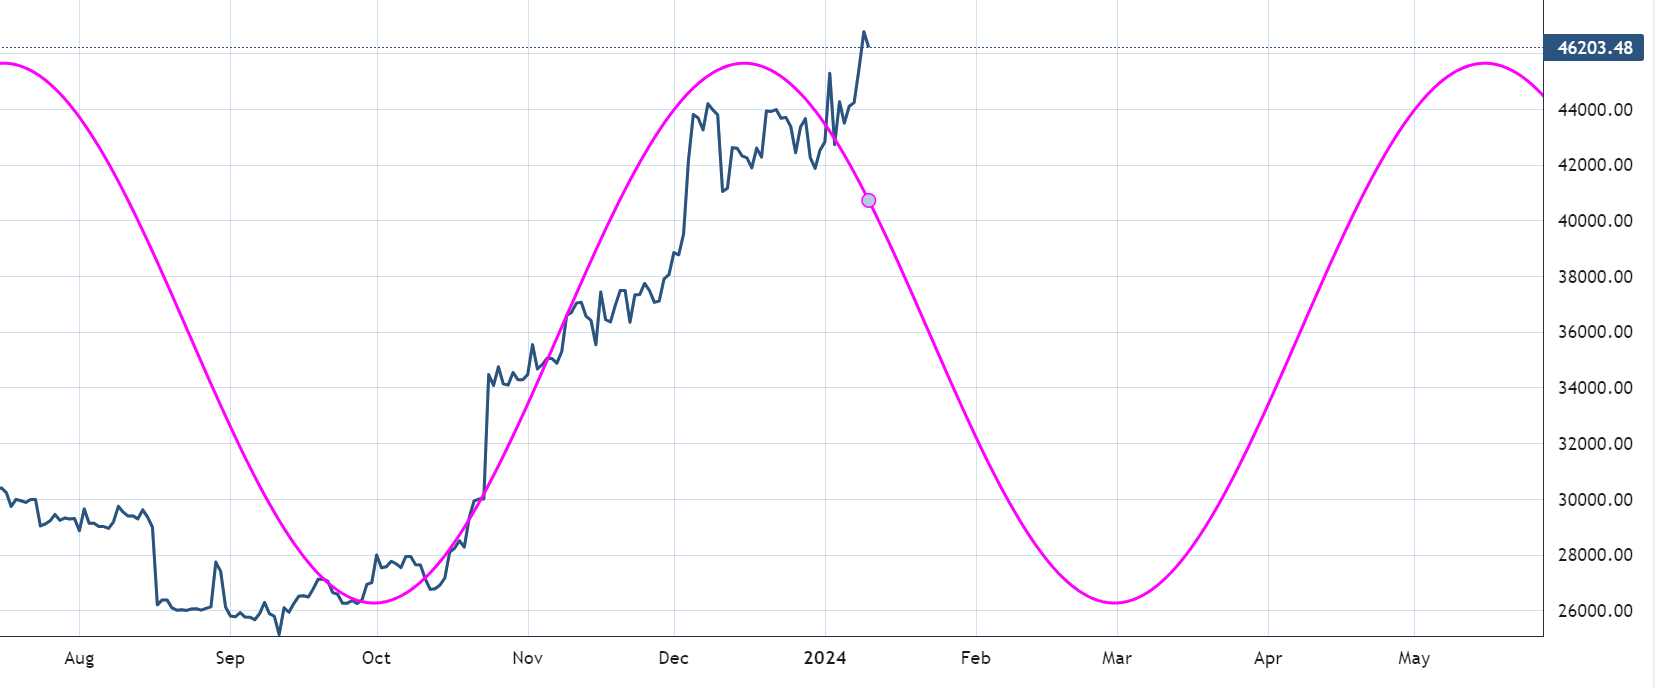
Today was the first day of trading for roughly 10 Bitcoin ETFs. While the flows were positive and impressive for the first day, the price has not done a whole lot. There was a quick rally close to 49k followed by a decent pullback of 3k lower. Both weekly and daily charts have not yet provided enough evidence that this uptrend has been violated in any way. My count remains the primary view as we’re very near equality between waves, both in time and in price. If there is a “hangover” after the ETF release party, prices should start to break 43k over the next several sessions. It’s been volatile and choppy since the end of December. This market is now fully institutionalized, and that comes with positives and also negatives. Don’t put anything behind Wall Street’s ability to engage and distort this market. Options on those ETFs will be just the beginning. Then leveraged ones.
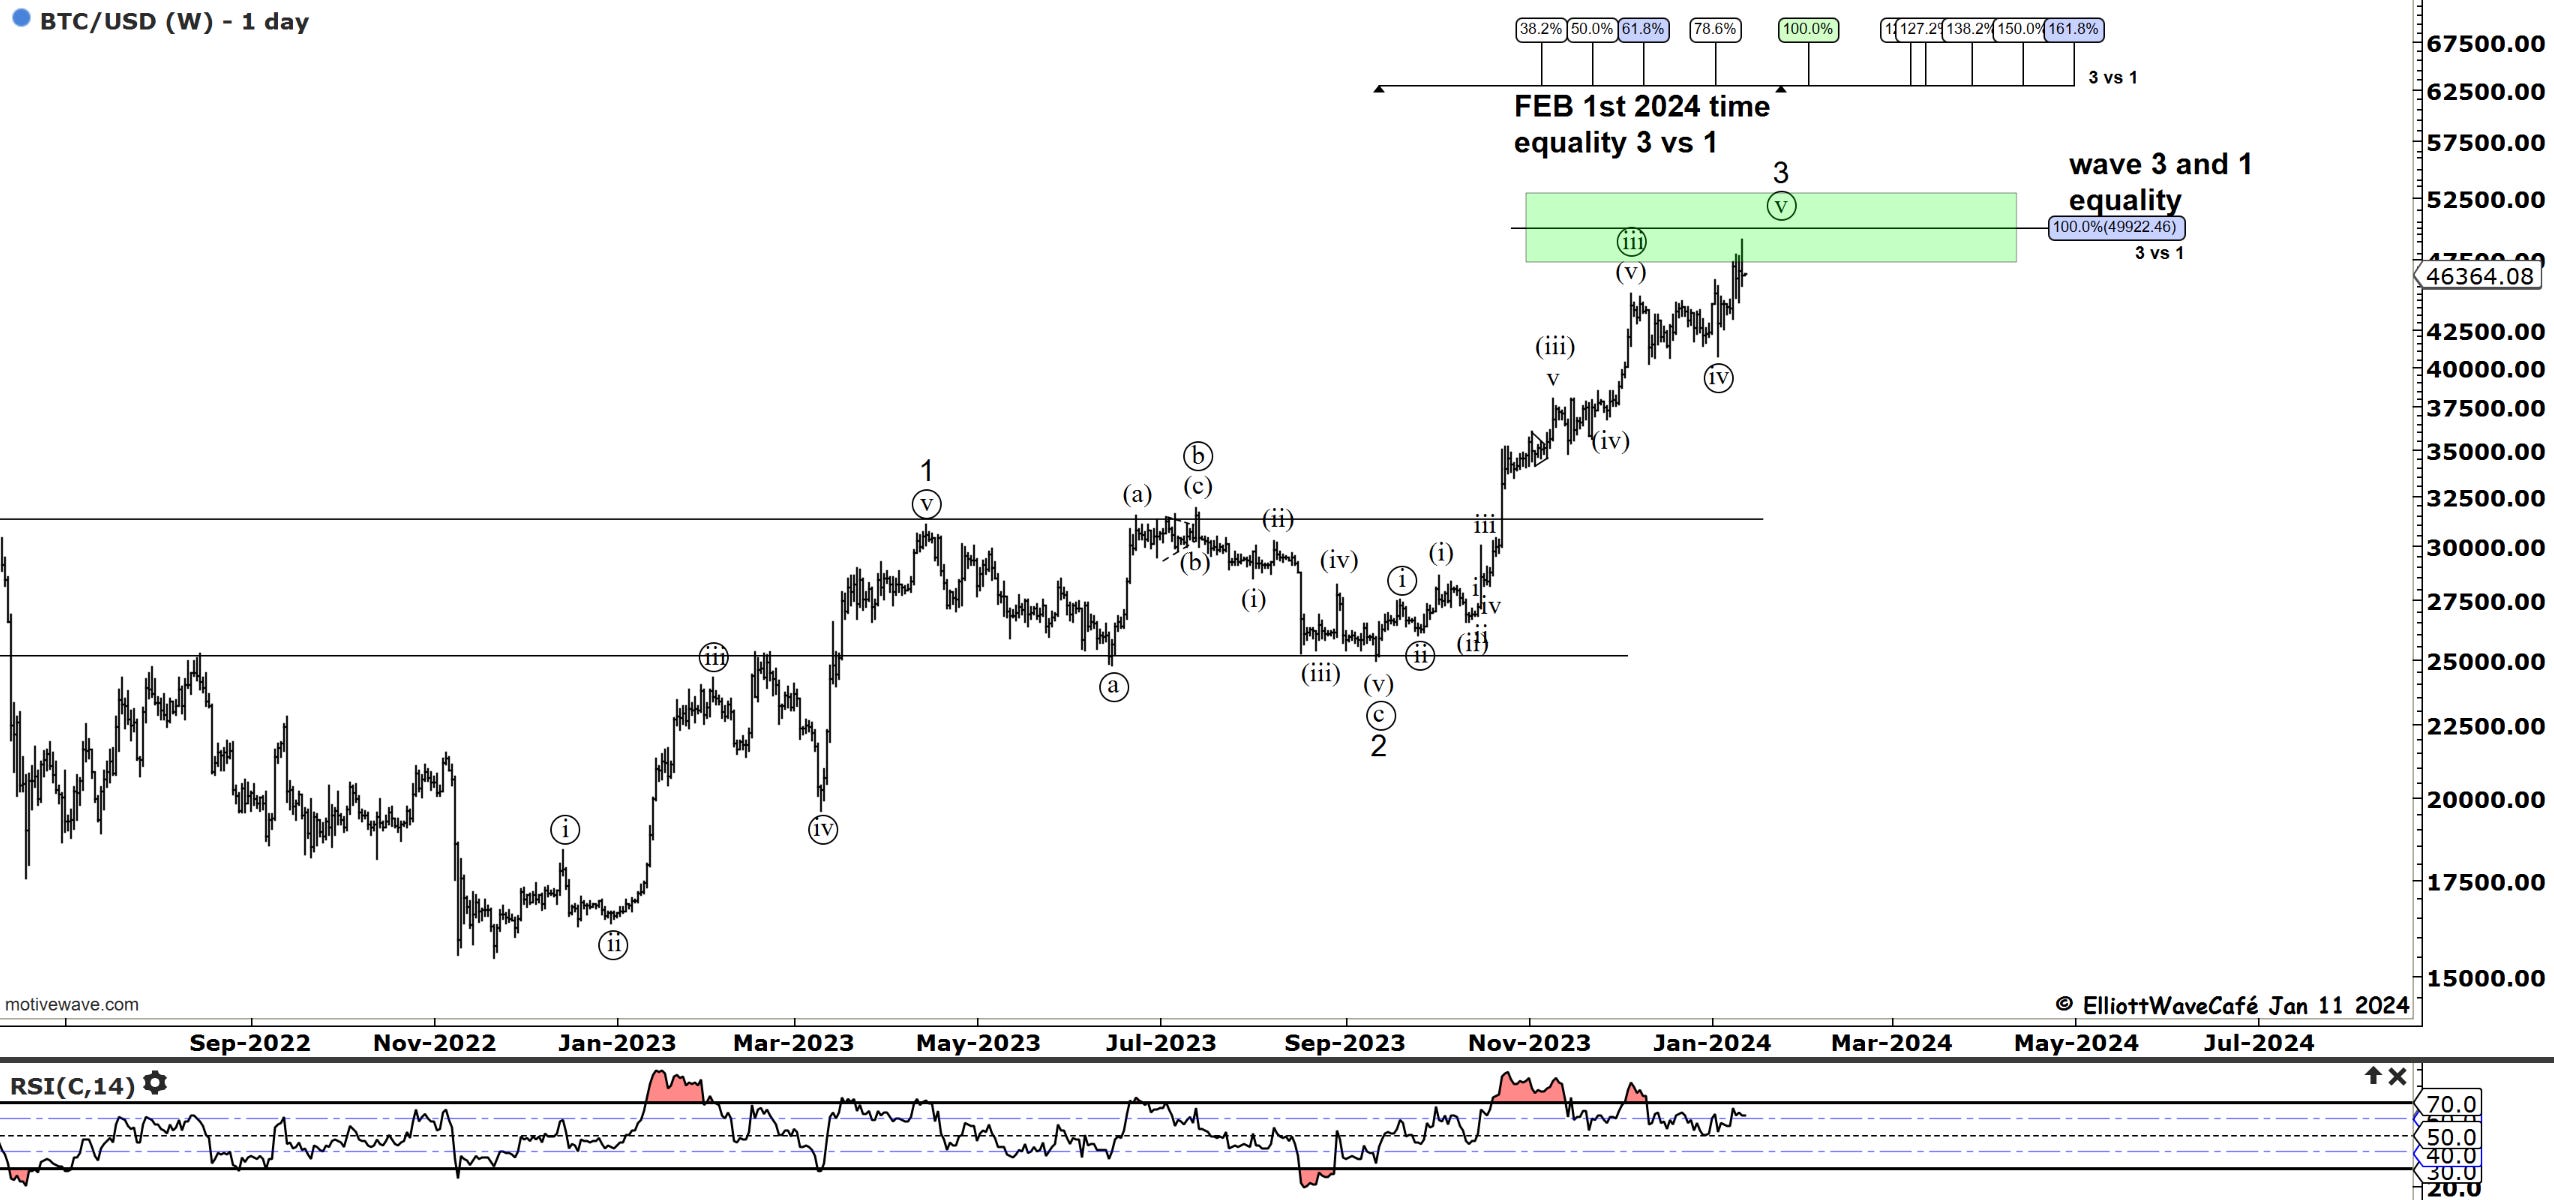
BTC time cycle update.
“Double shot” Daily member video coming up next,
If you’re new to Elliott Wave or need to refresh, there is a 7-hour video course with downloadable slides under The Coarse tab on the website.
Have a great day wherever you are! - trade well, and don’t forget to subscribe and drop a like if this letter helps you in any way.
Cris
email: ewcafe@pm.me