
The Daily Drip
Core markets charts updates and commentary
Note: The counts on the right edge are real-time, and they are prone to adjustments as price action develops. Elliott Wave has a fluid approach, is evidence-based, and requires constant monitoring of certain thresholds.
In the counts below, this (( )) = circle on chart
SP500
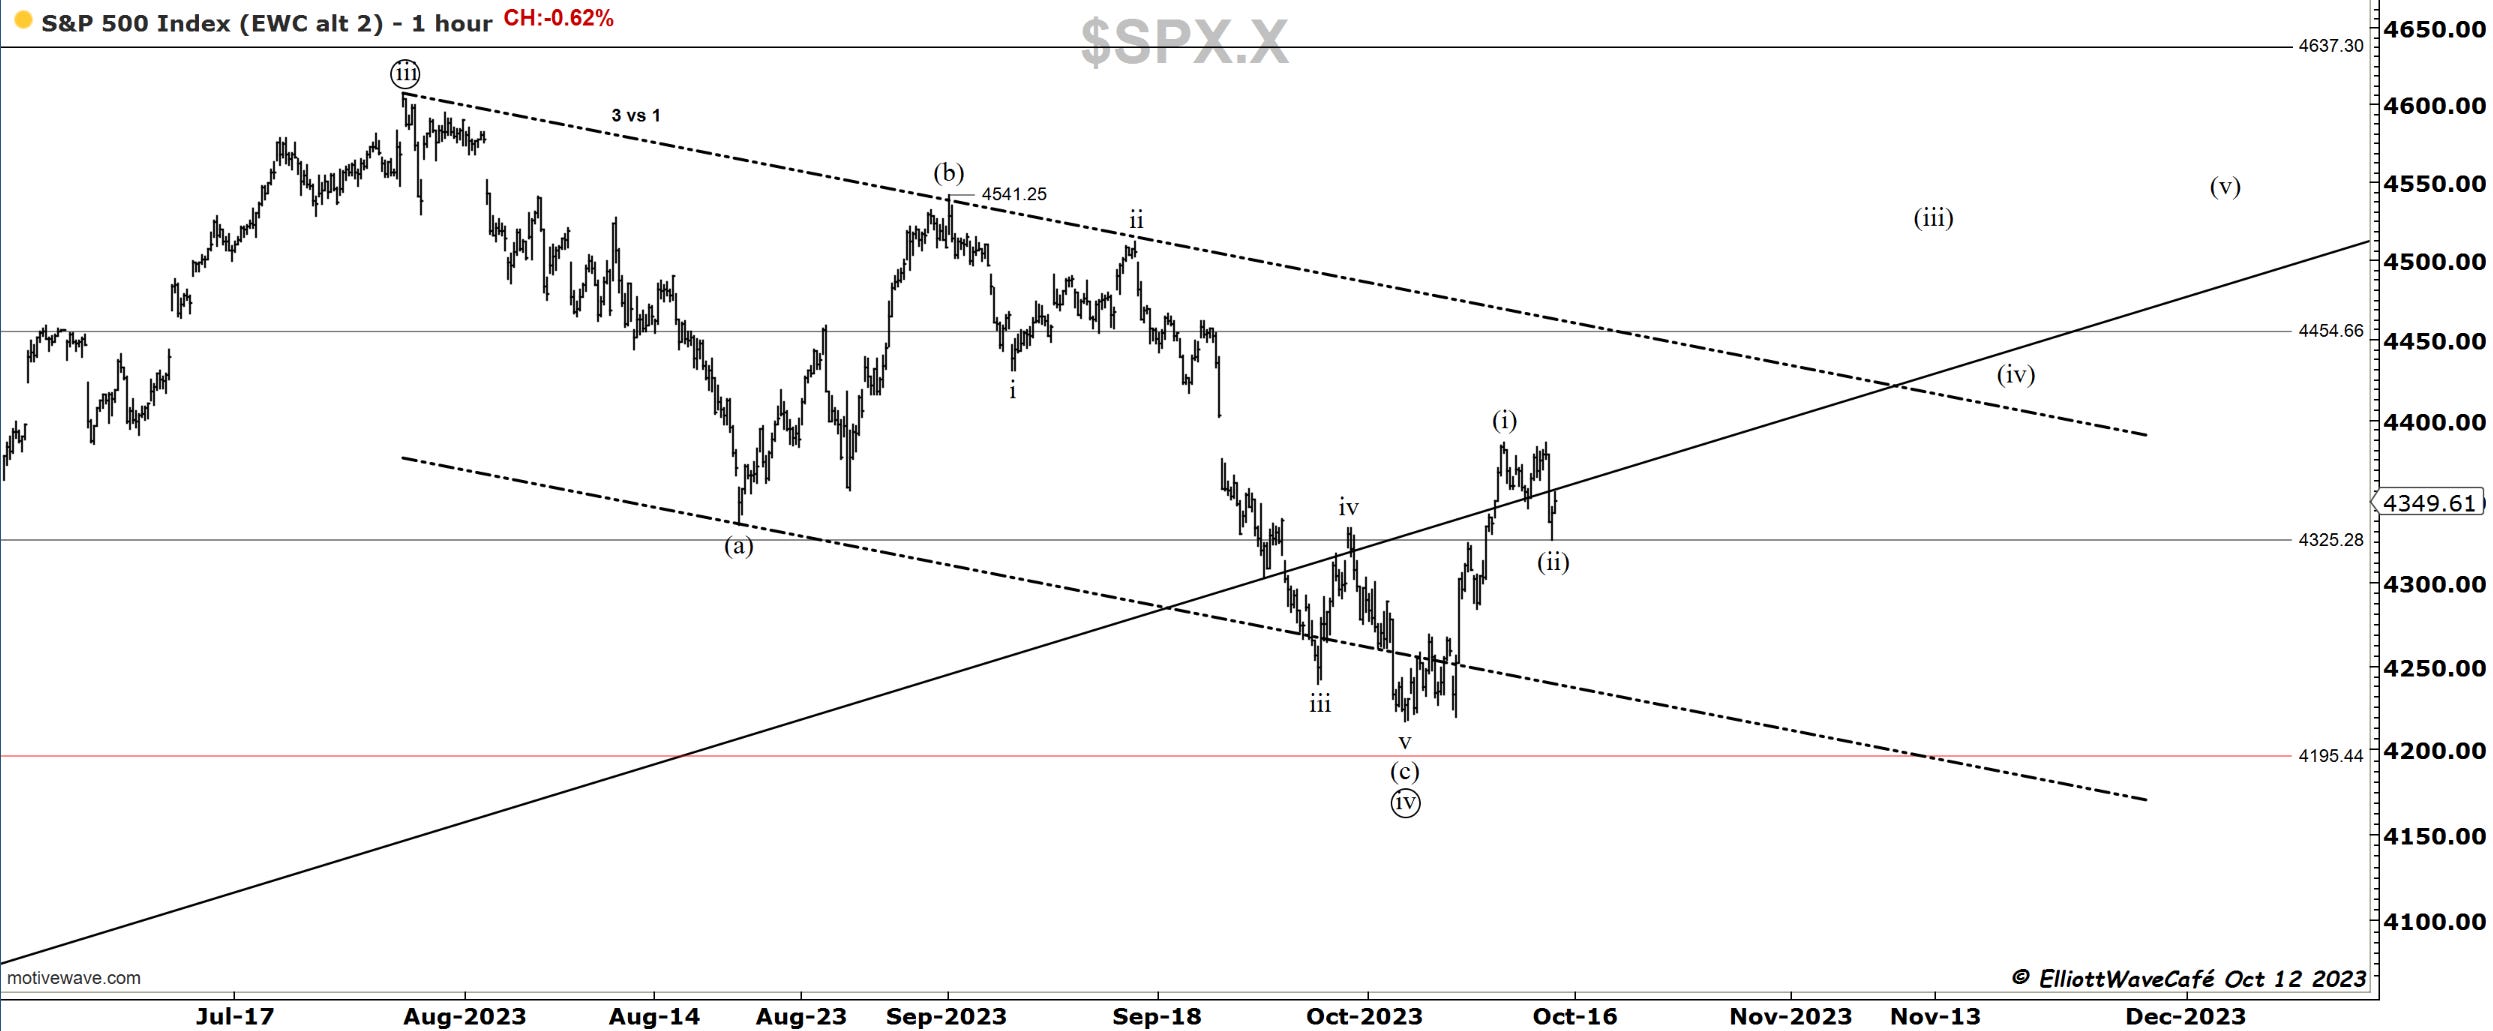
A -60bps loss in the index today after a quick attempt at the highs. I heard something about the 30-year bond auction being very weak and apparently, that’s what prompted the selloff. Sure, I will remember this next year when I squint at the chart. Bottom line, whatever it was, it’s not coming as a surprise if you’ve been following along the commentaries. We were prepared for the chances of a wave (ii) pullback. It’s possible that the high we got this morning was a quick 5th wave and wave (ii) is has a bit more to go. You can also argue for a flat in either (ii) or iv . Bottom line, it is a corrective move in my view and we should resume higher upon completion. If we lose the 4250 zone, then I am willing to to consider lower prices.
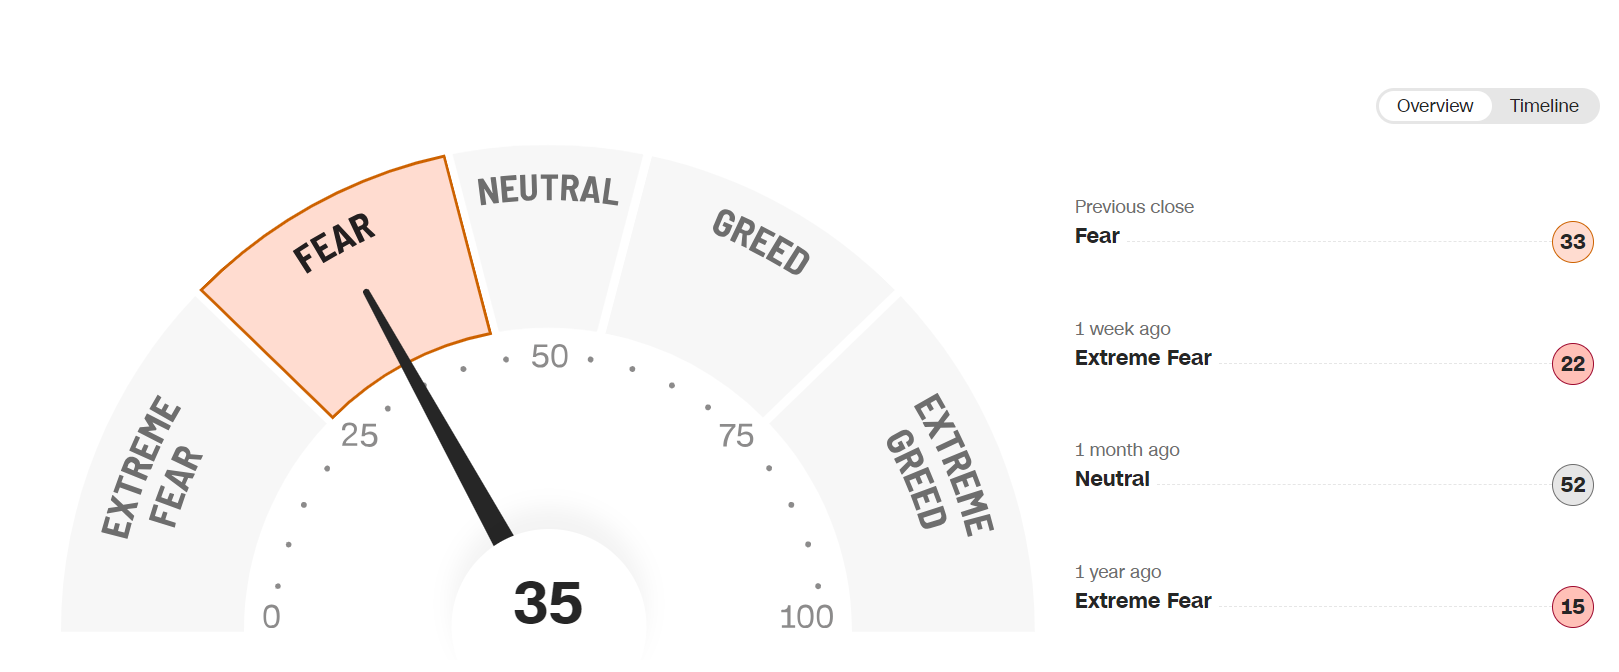
Heavy put buying continues spiking on any day with increased volatility. You can feel the fear thru the computer screen.
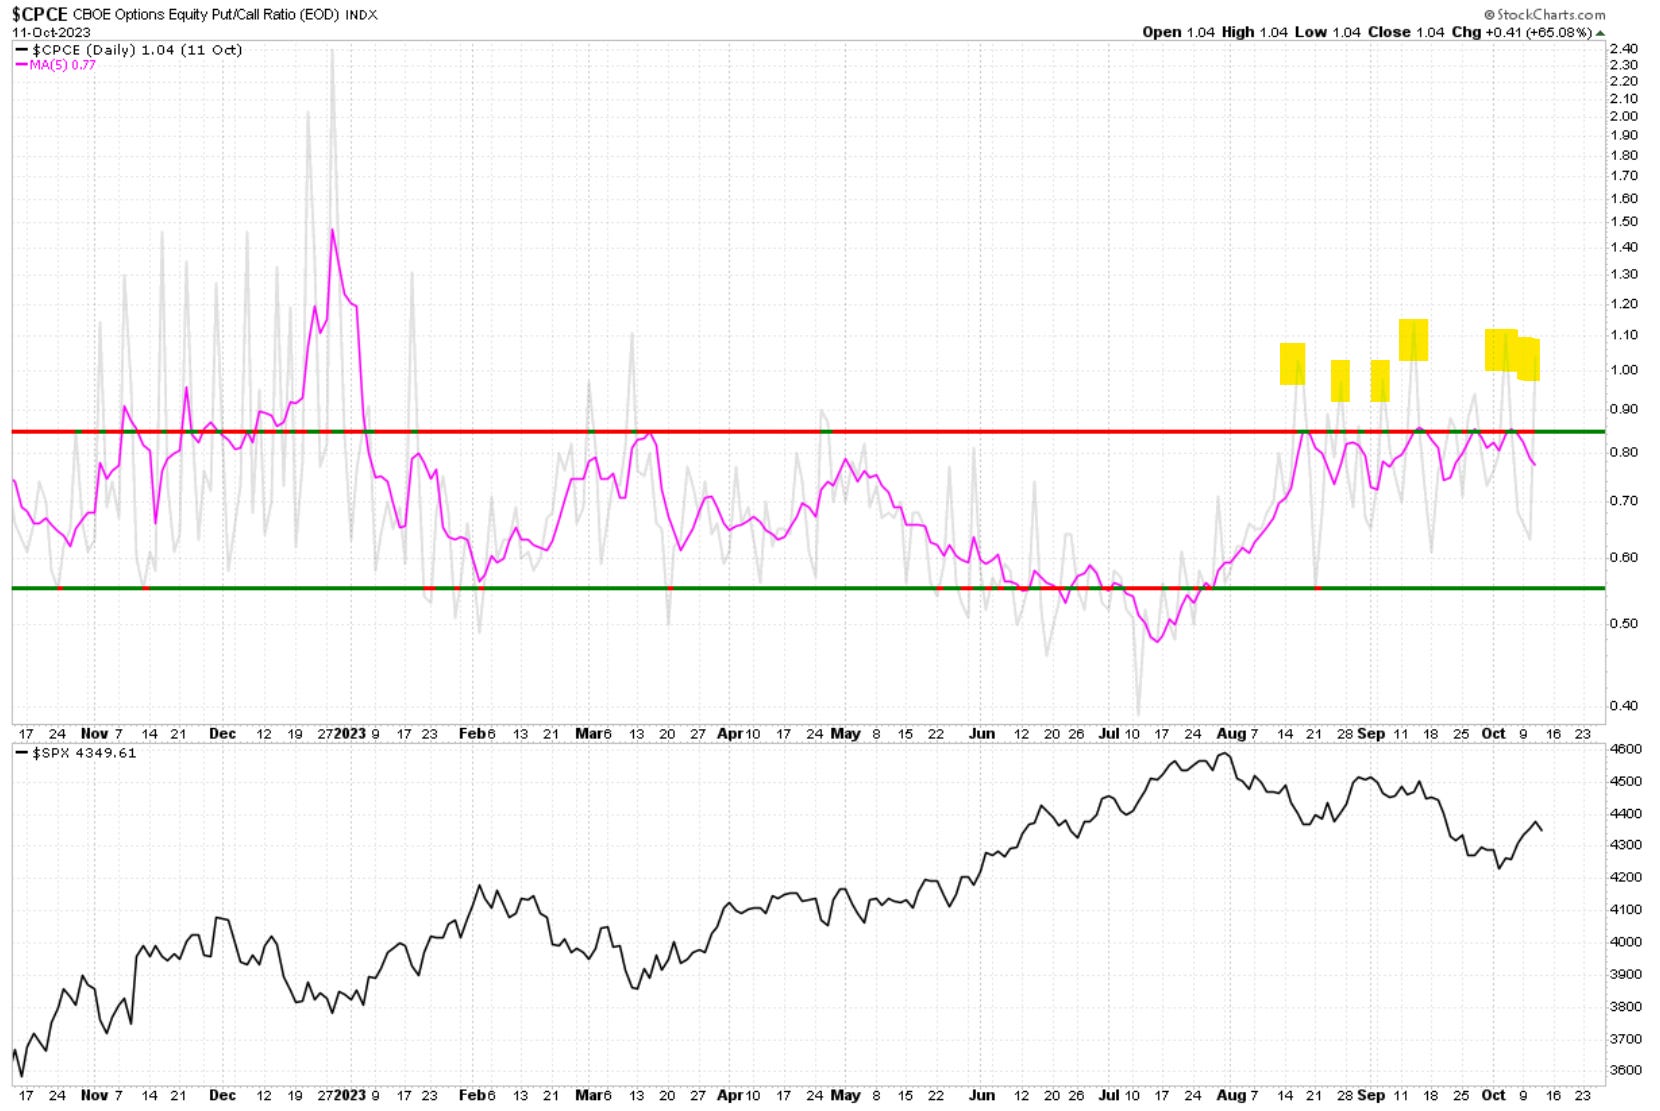
Not as extreme as it was about a week ago but still lurking.
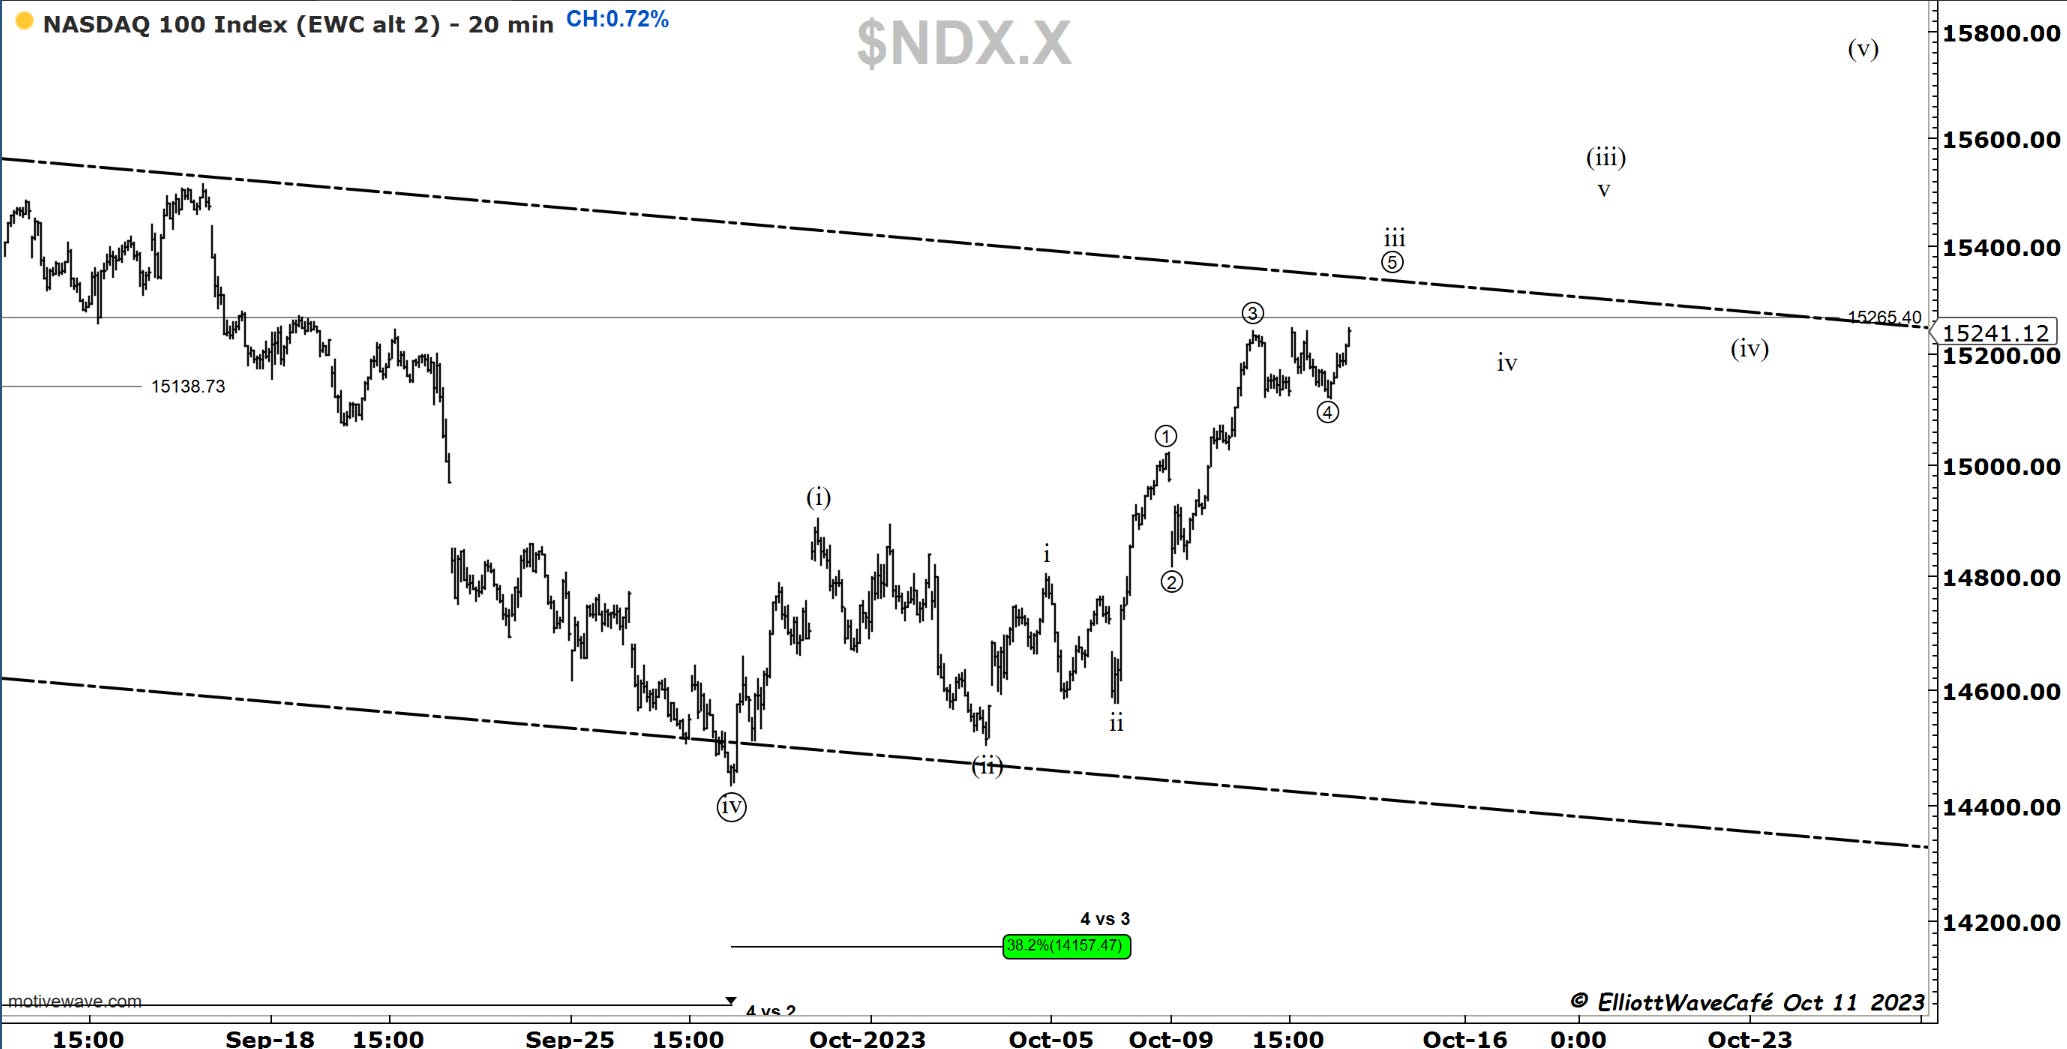
Nasdaq100
I did not modify anything on the charts from yesterday. We got the 5th wave and then sold off. We also tagged the trendline to perfection. While you can argue that wave iii is complete, we still have waves iv and v, and then wave (iv) and (v). If it would only be that easy. I am sure the market will throw a monkey wrench into this and morph a little bit differently. But that’s OK. What we do now is that we should be trending higher still and we could do so in a messy way. There is room for a flat just like in the SP500 but I won’t clutter the chart with that.
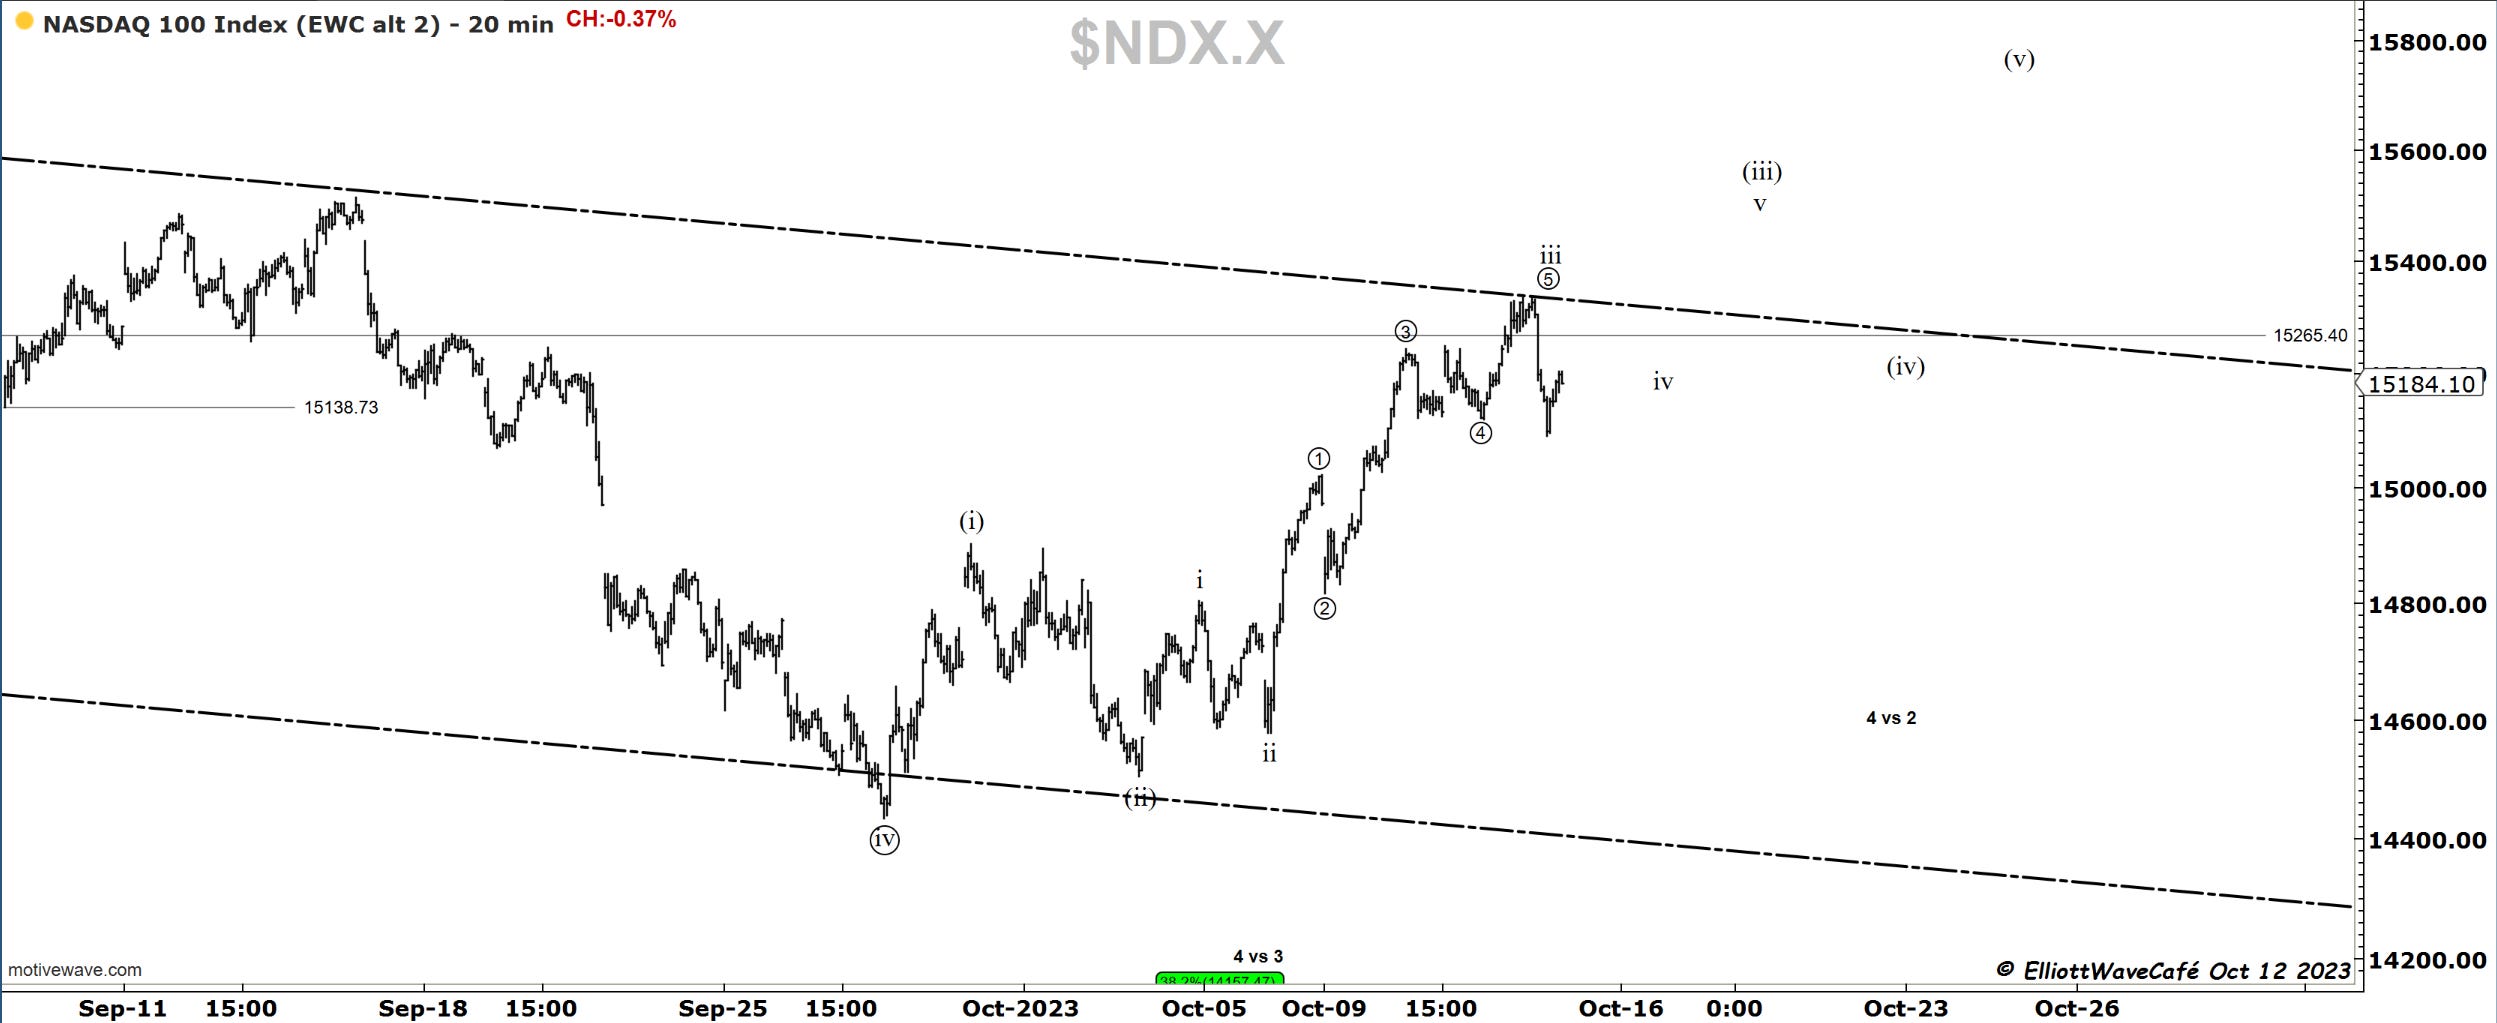
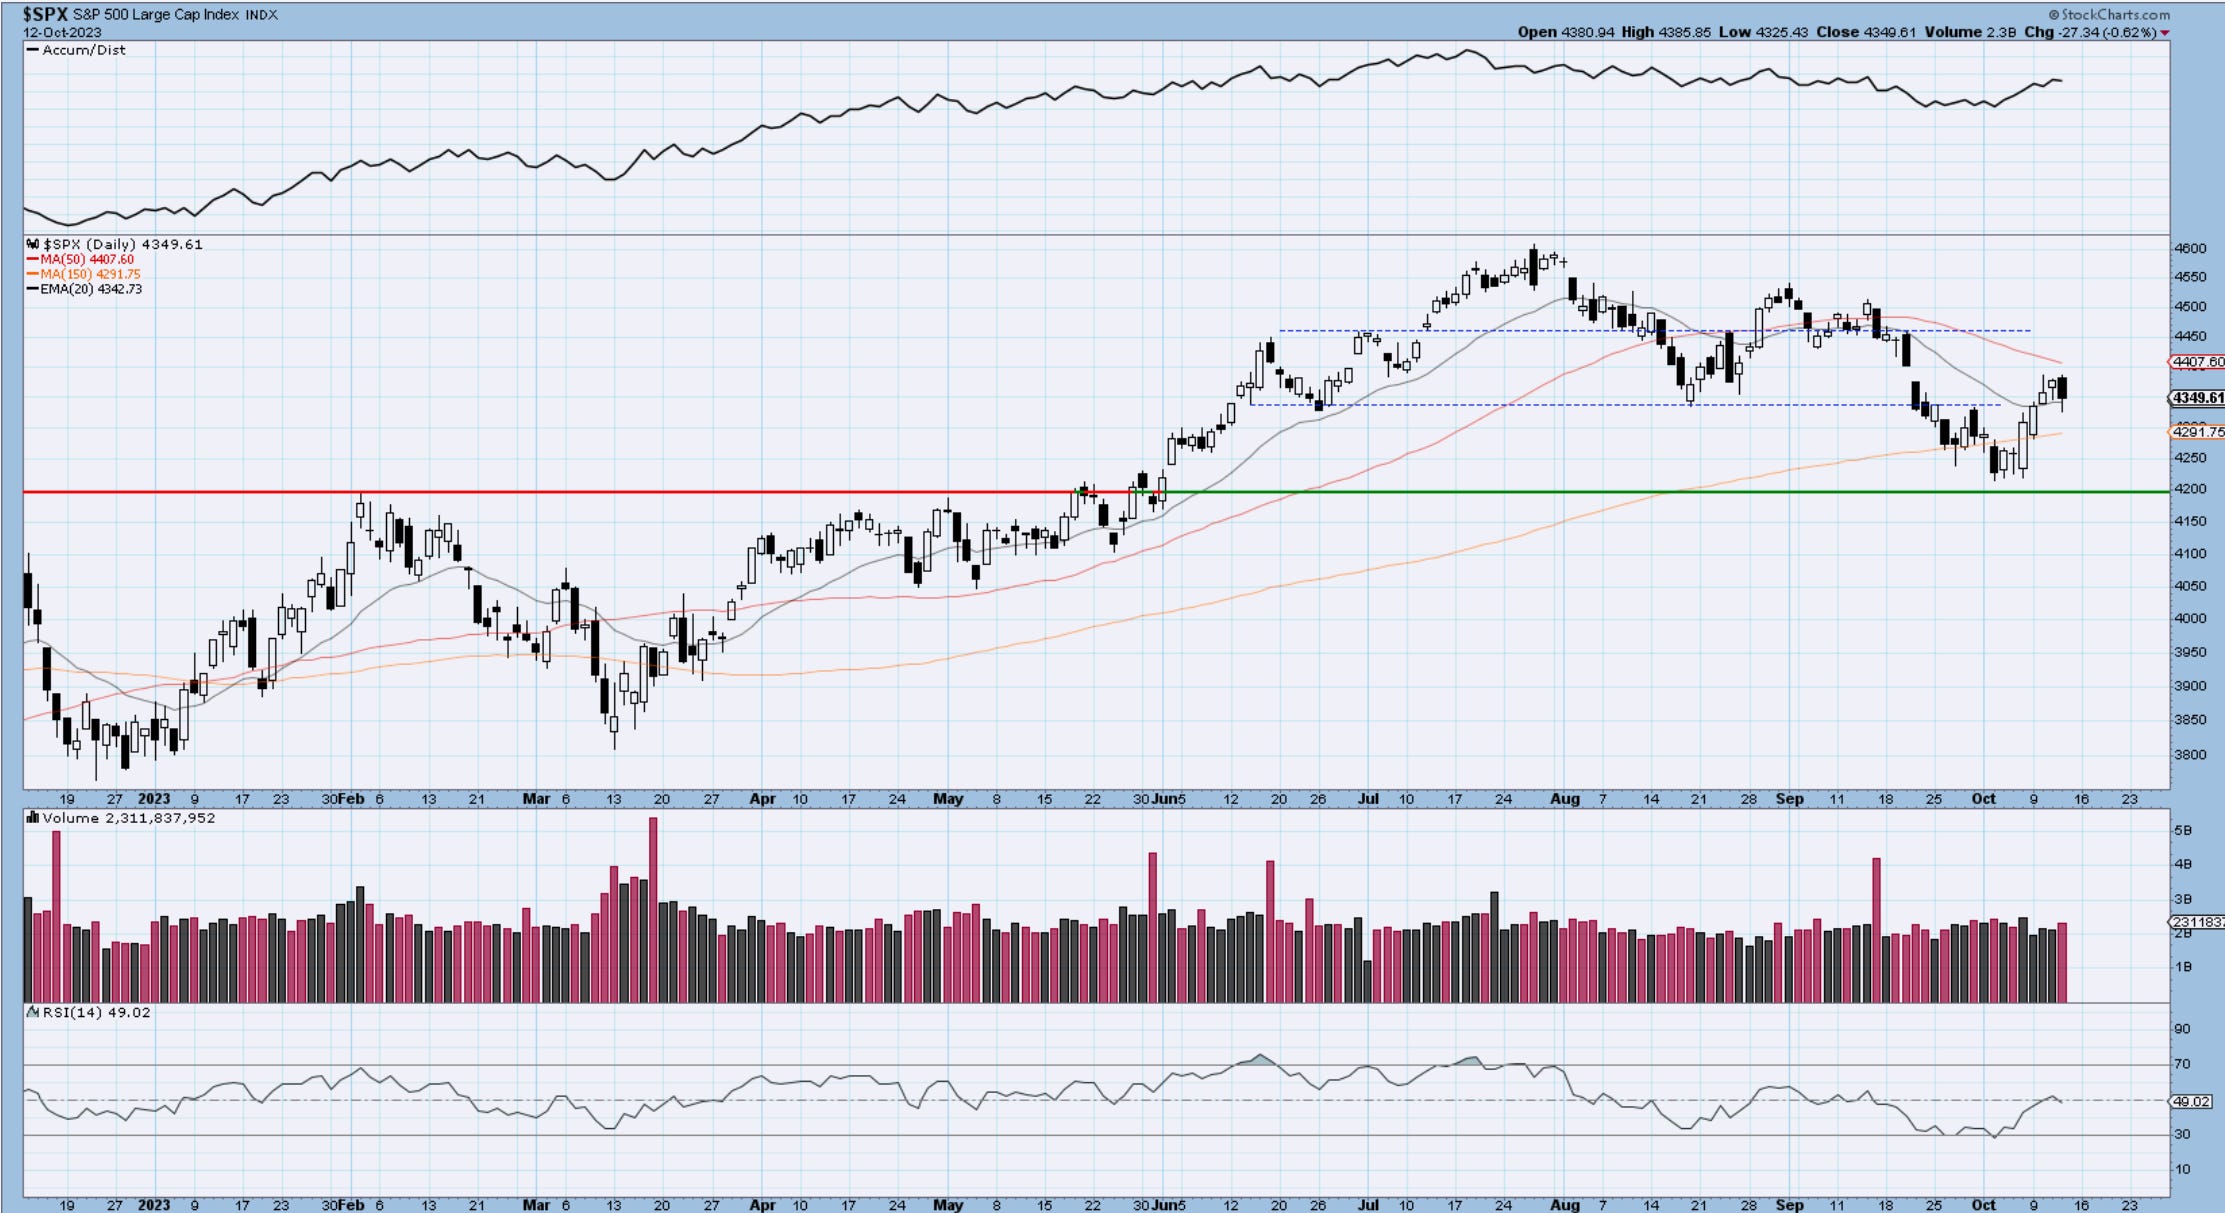
Daily chart horizontal supply level tagged. Small daily candle, but Twitter made it sound like the end of the world is here.
Dow30
Did not take long before we got this drop into the suggested wave ii and the idea of building a right inverted shoulder. This shall not spend a lot of time dragging sideways or down, but rather start moving up and breaking the blue line. If the former happens, then the odds of a break below 33k are increasing. It’s a basic “if this” then “that” approach. I think it’s called deductive reasoning but don’t quote me on that. But that’s all Elliot Wave is in the end. A process through which we constantly make assumptions that get validated or not. We eliminate the weird possibilities and are left with somewhat of a cleaner roadmap.
Look at the Dow since the year began. What a mess.
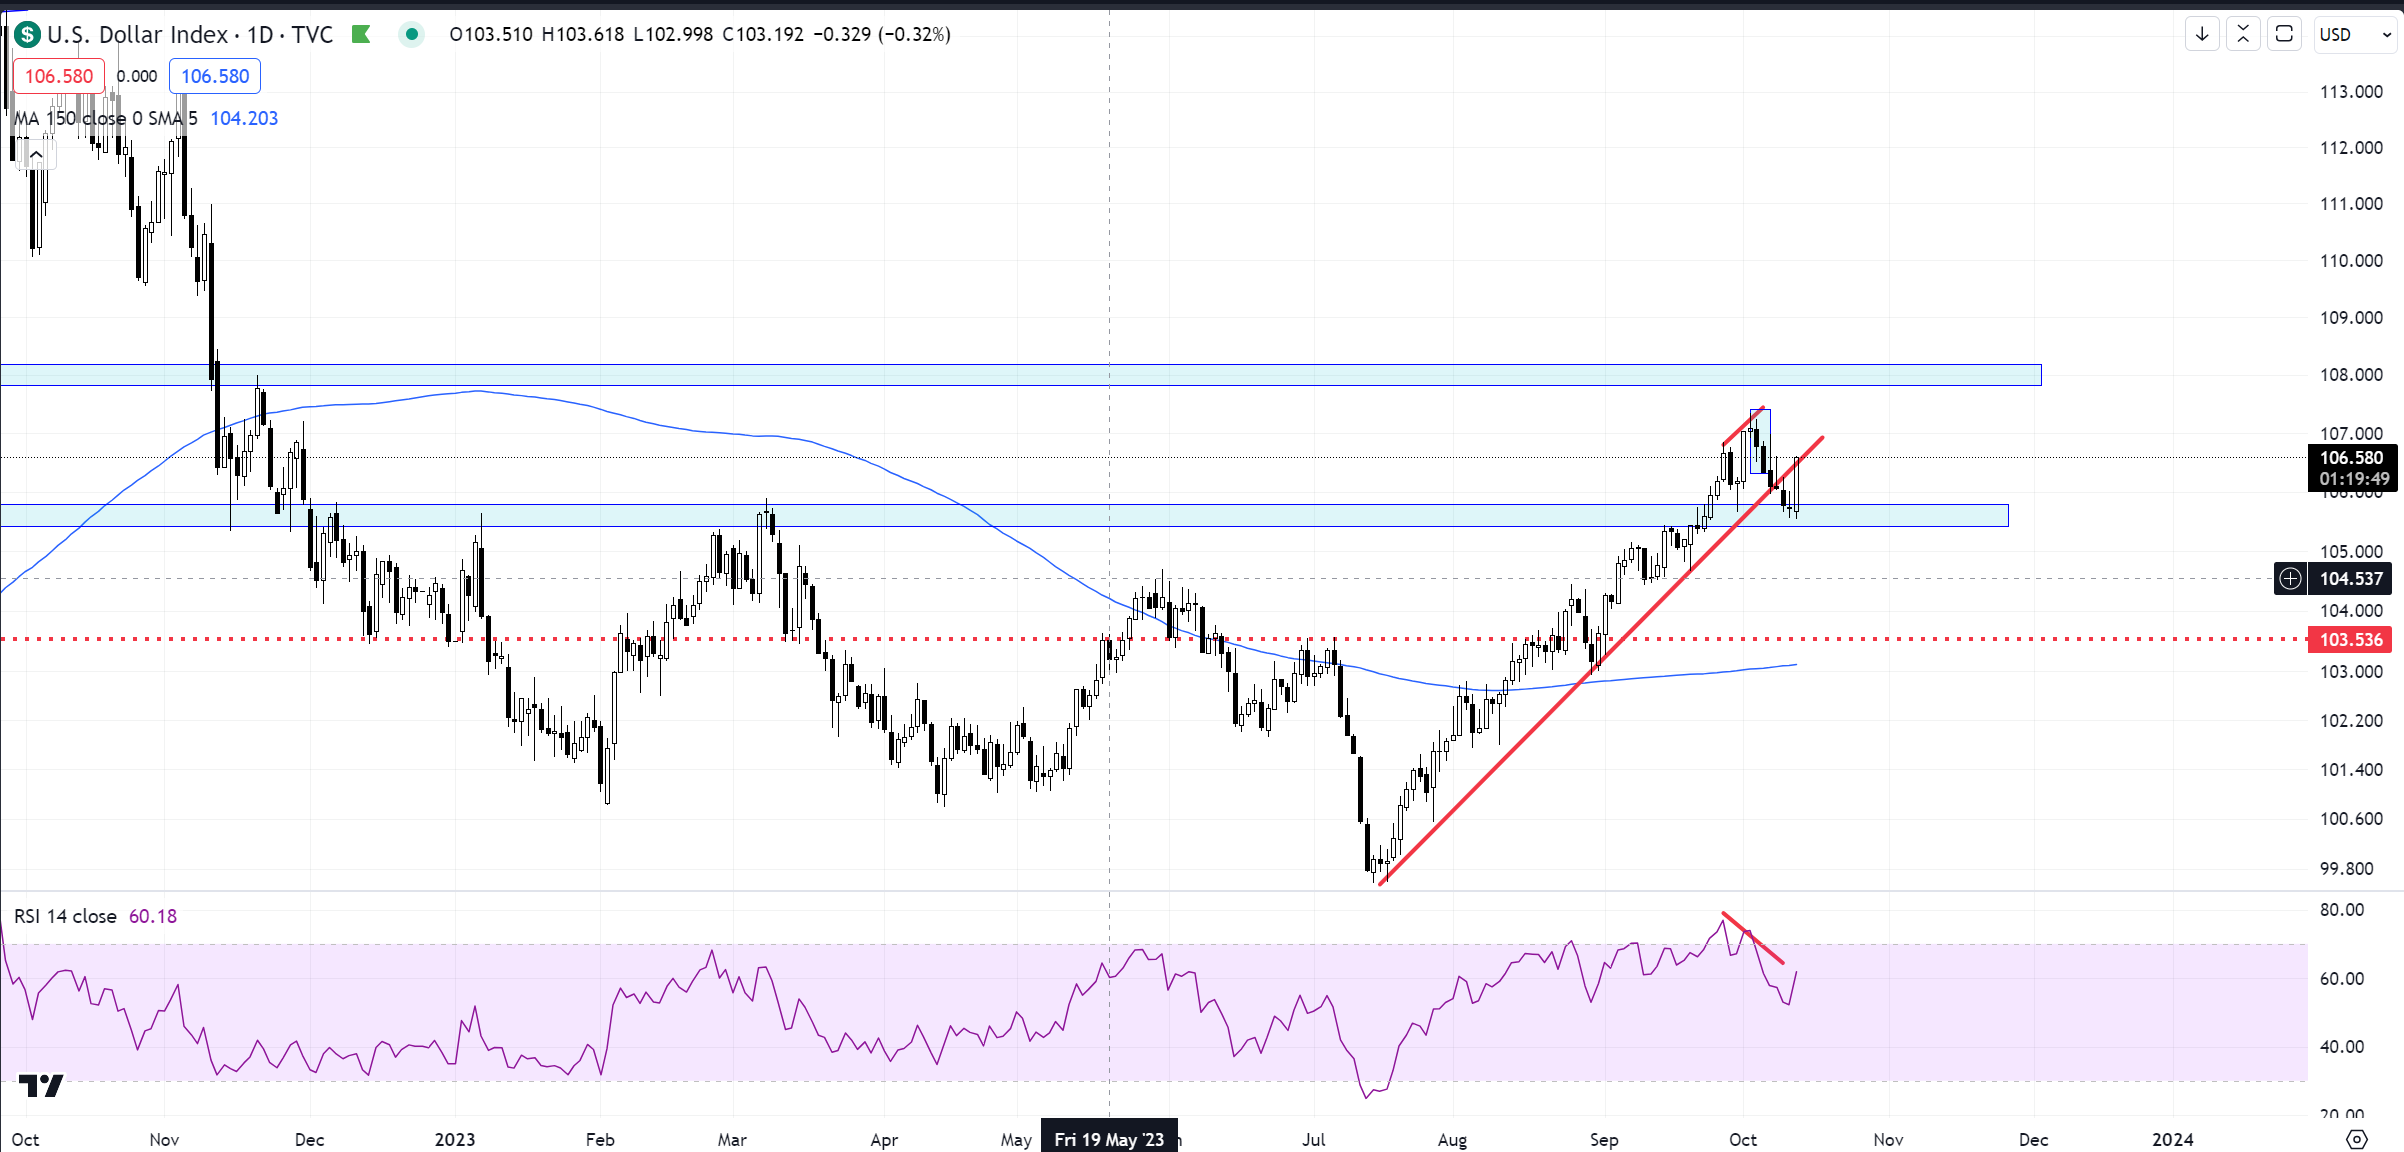
US Dollar
The first test of old resistance now support , held well. Risk is tied at the hip. Small jump in yields, small pump in dollar, selloff in risk. It’s all one trade. Even if the dollar makes a marginal new high it should be short-lived. The multi-week continuous buying has run it course.
Gold
What better place for that wave (i) to stop if not the old support line? I don’t think asking for a pullback is too much. Usually wave (ii) hits 61.8% of (i). Will see what happens here. I would there to buy some given that chance.
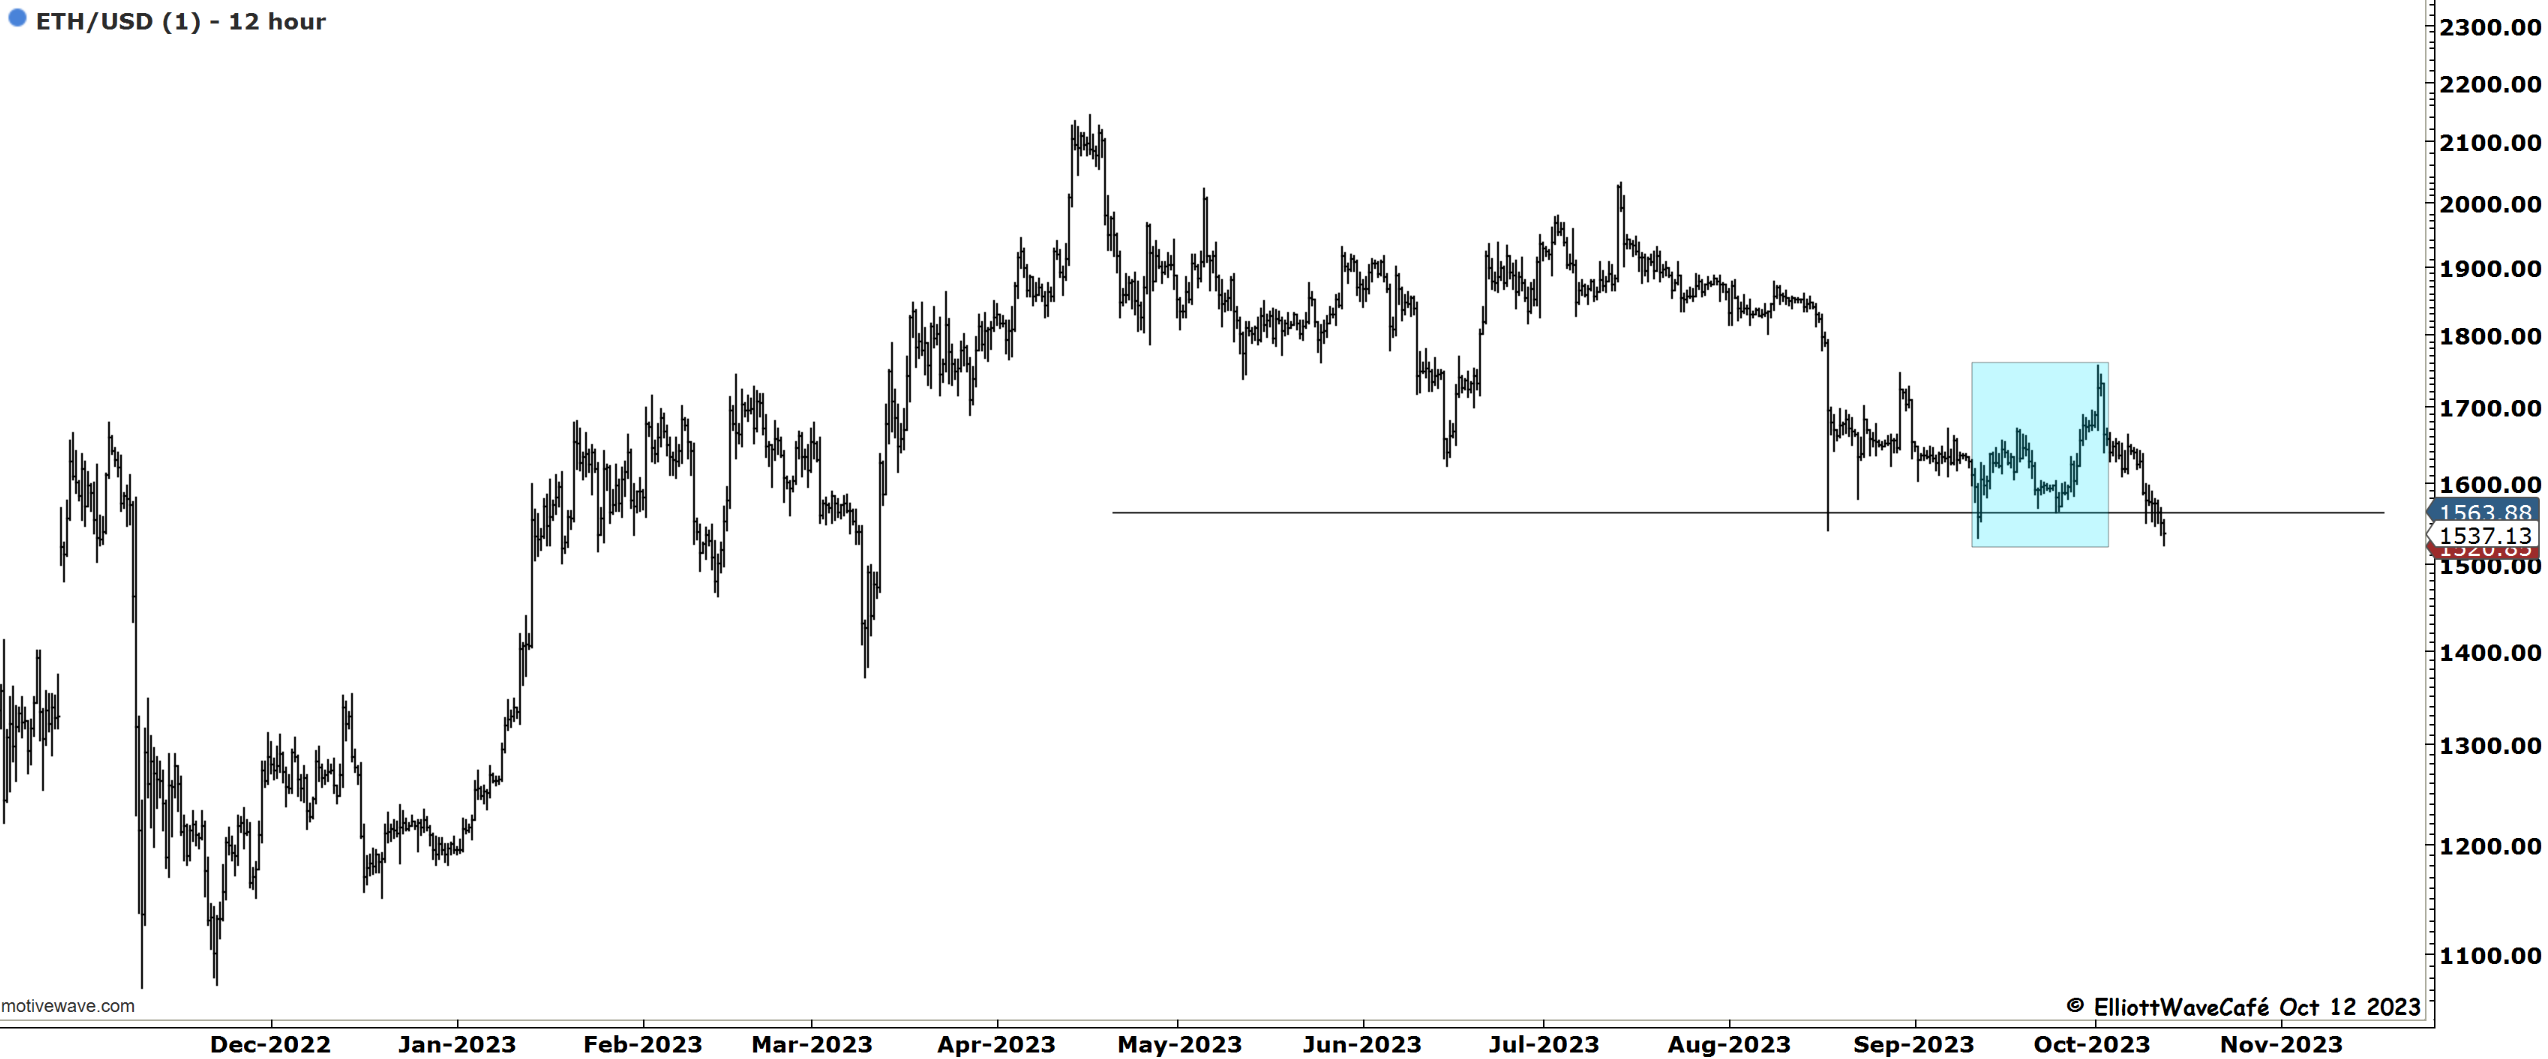
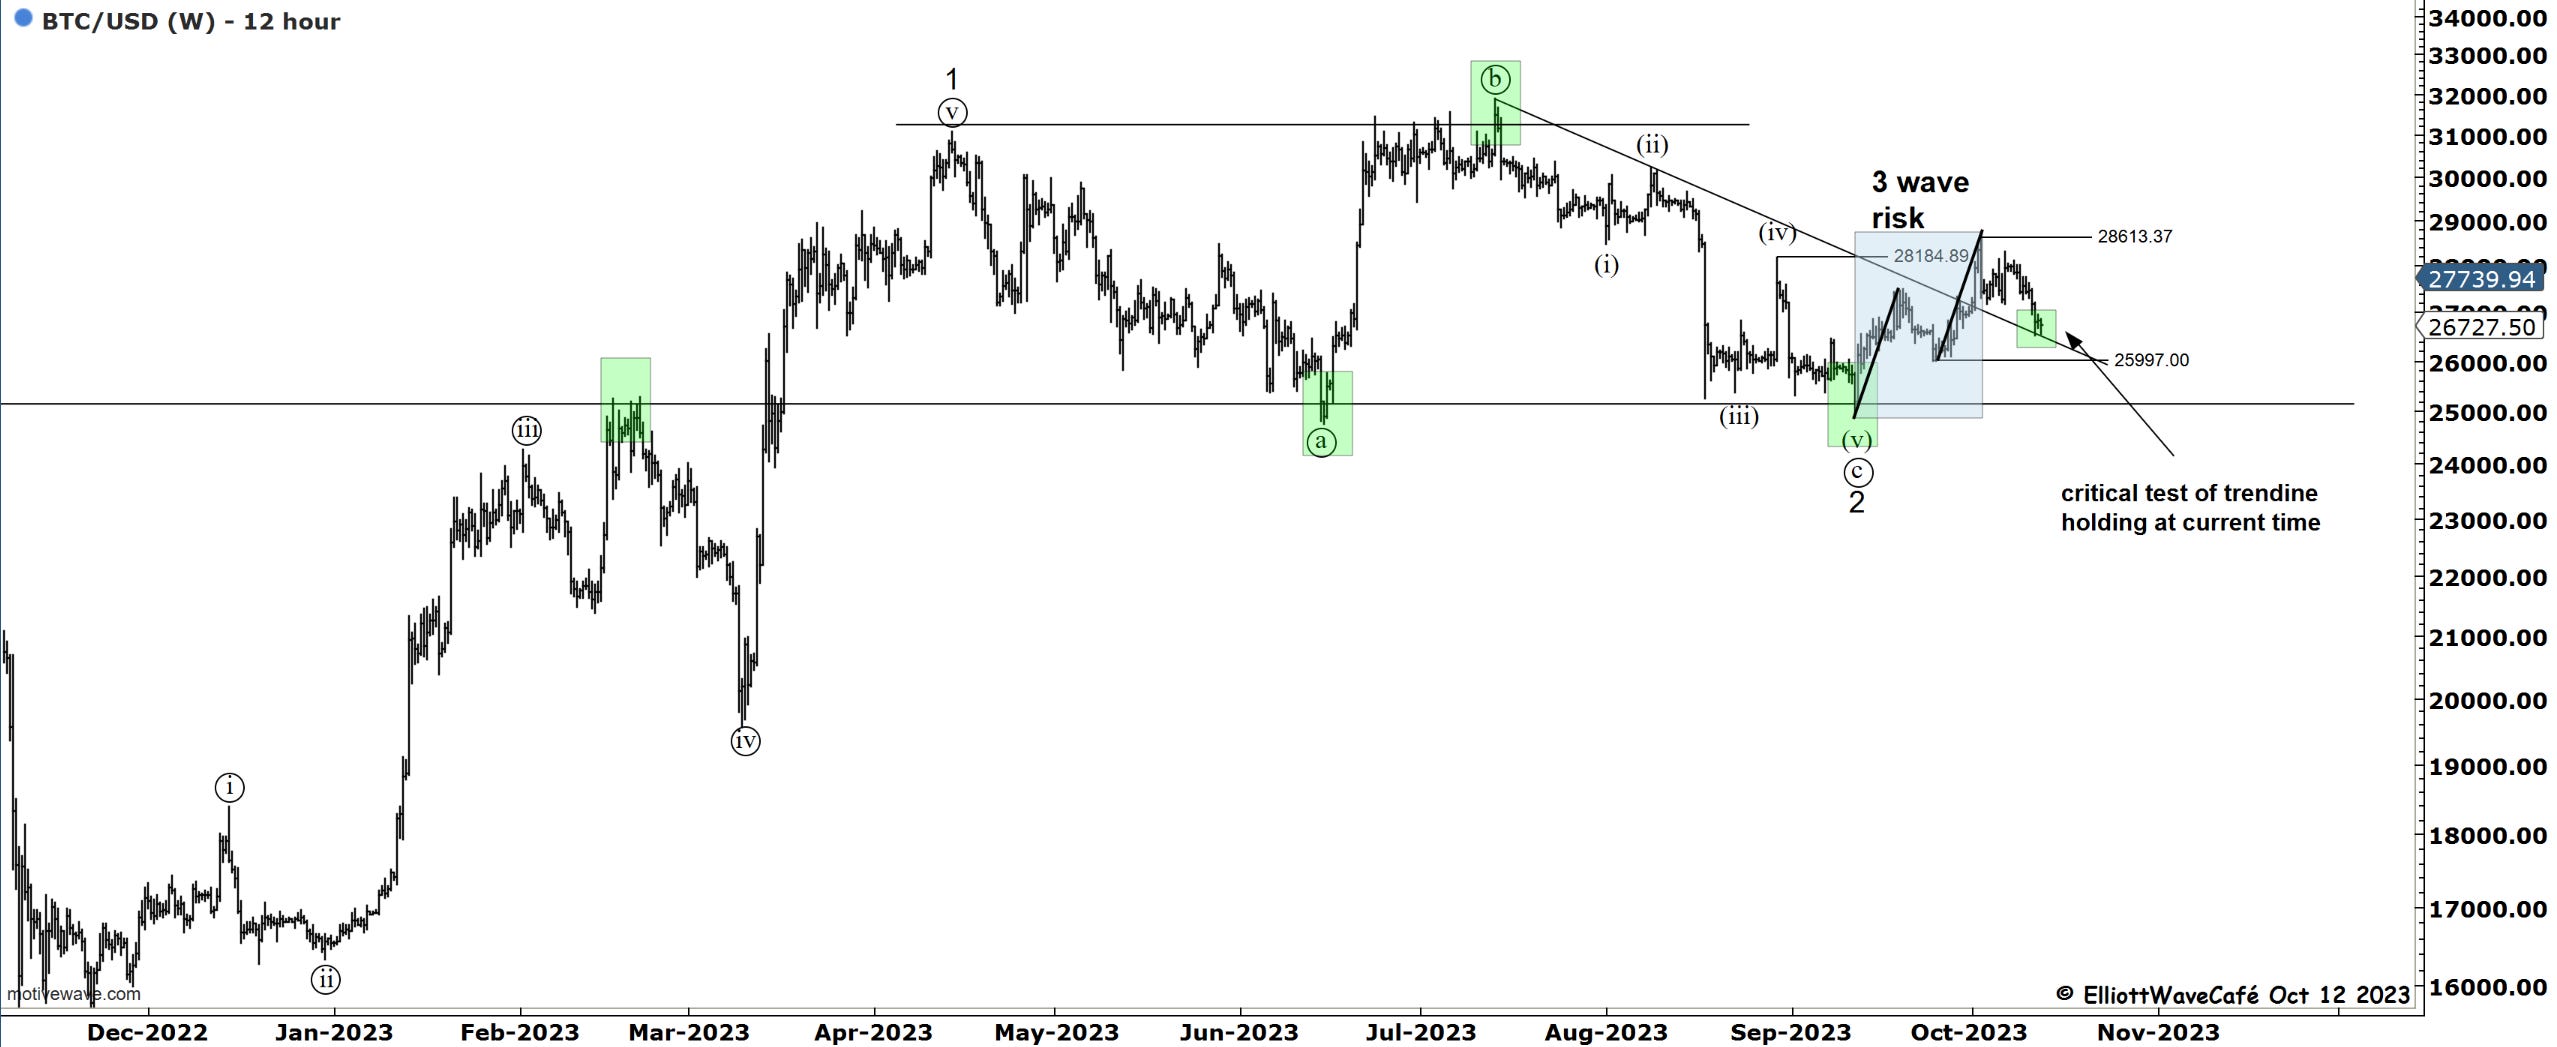
Bitcoin
Previous comments remain as BTC continues to hold the spot. Ethereum is not that lucky.
Moment of truth for BTC here as the up-3 wave risk is unfolding. The price is testing the broken trendline. A hold and bounce here above 28k would be a great sign. We cannot lose 26k. If we do, 25k will come under severe attack. Possibly the strong demand will hold it, but it becomes a tougher bet.
Daily video coming up next,
See you next week- trade well,
Cris
email: ewcafe@pm.me