
The Daily Drip
Markets review, strategy and analysis
Note: The EW counts on the right edge are real-time, and they are prone to adjustments as price action develops. Elliott Wave has a fluid approach, is evidence-based, and requires constant monitoring of certain thresholds.
In the counts below, this (( )) = circle on chart
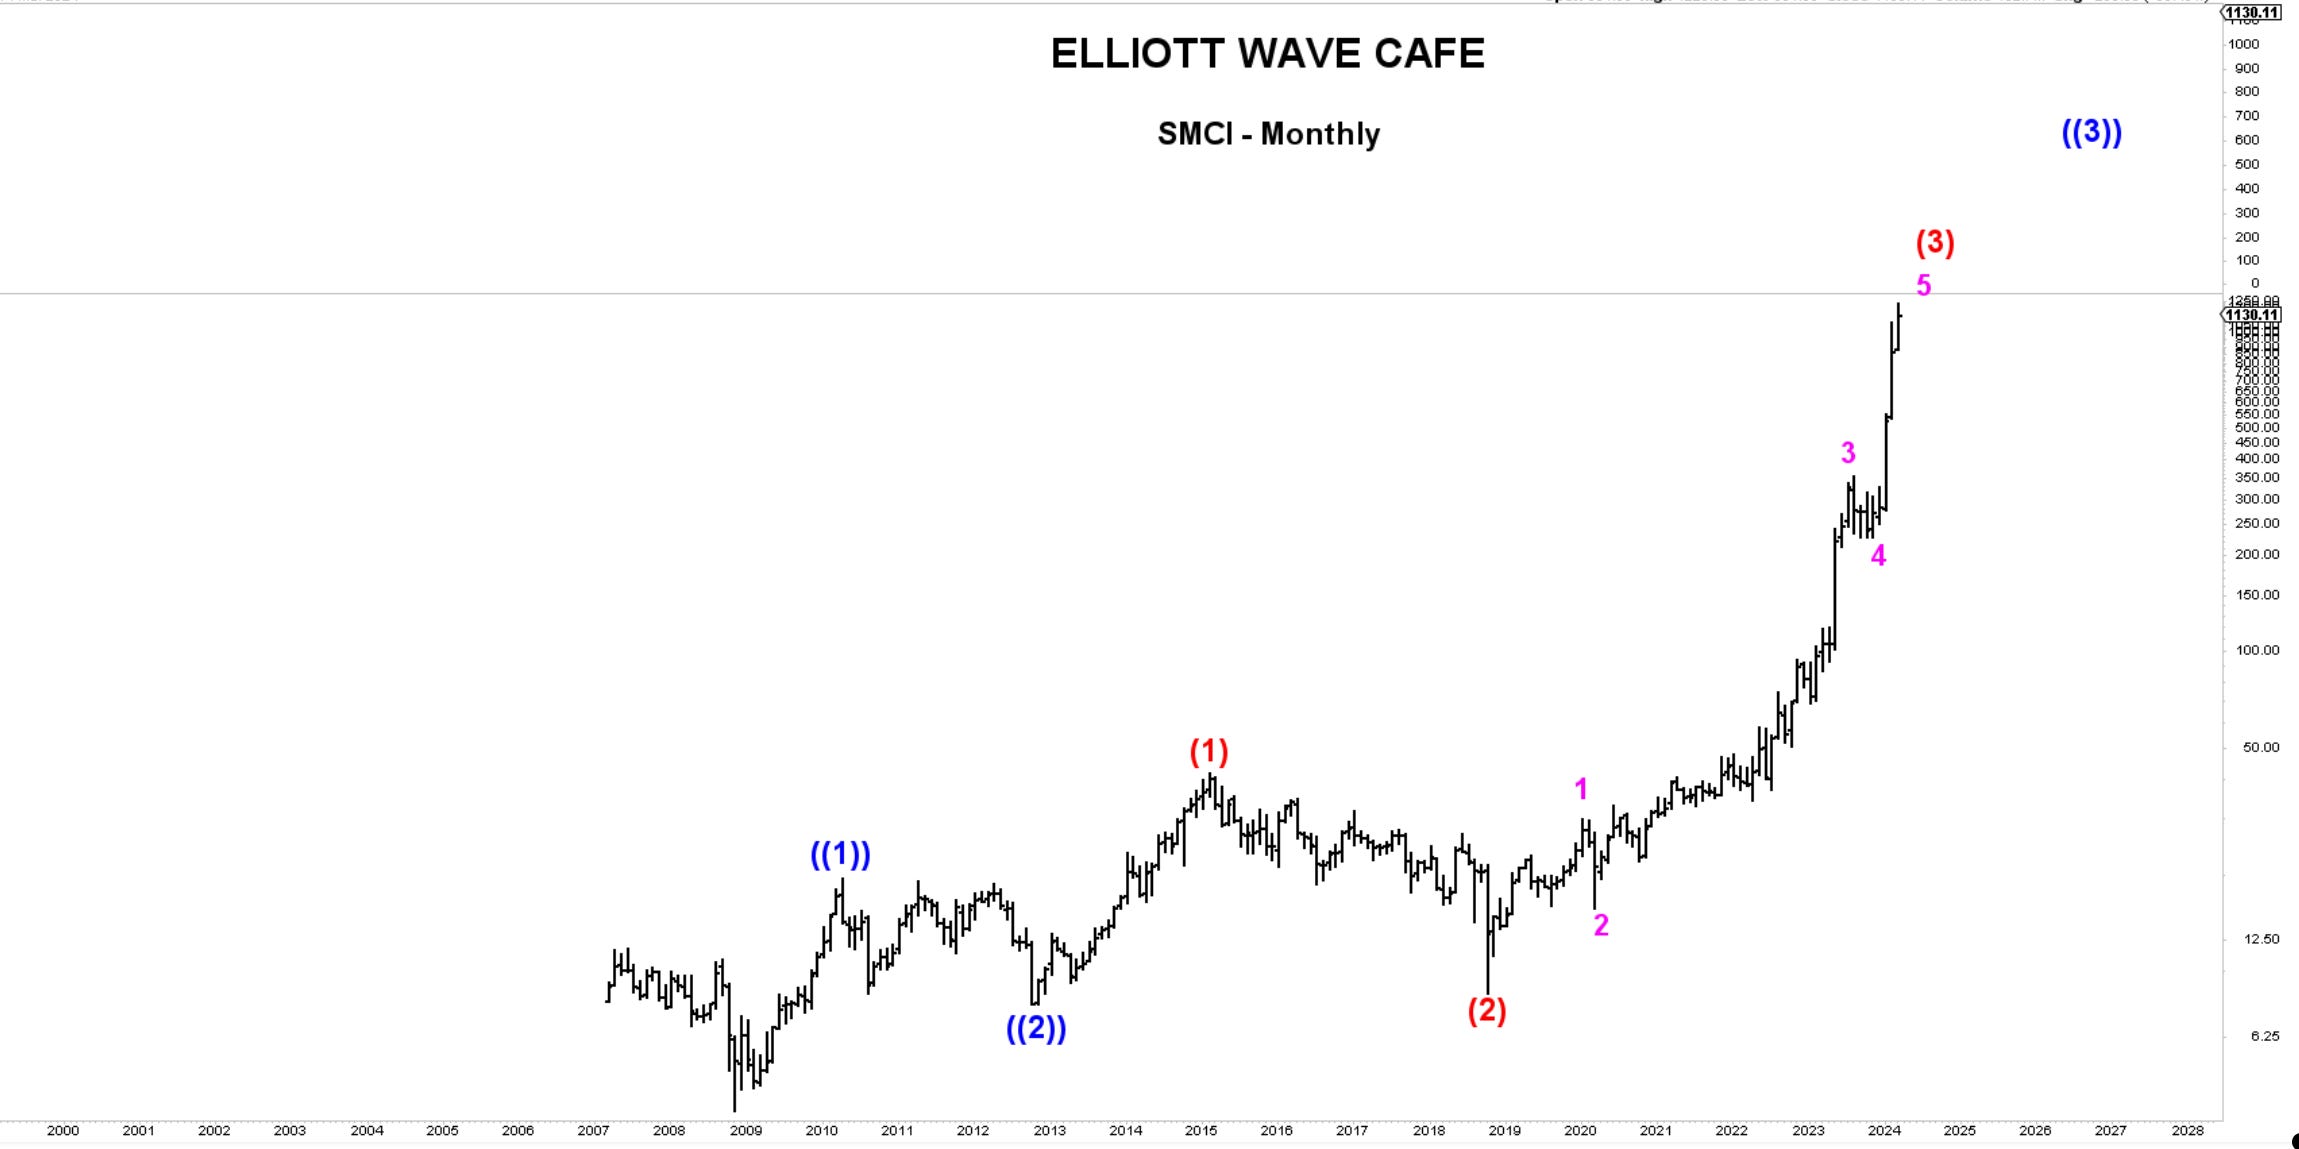
Chart of the Day—SMCI—The introduction into SP500 will likely be the start of wave (4) red. Wave (2) lasted 44 months, so I would expect wave (4) to be at least that, if not more.
It's not a day we’re used to seeing that often. Other than some very short-term trendlines, nothing has been damaged to the extent that we can say a larger correction has started. People were hiding into energy today and, to a lesser extent, into some large-cap tech. Some of these moves are likely related to the monthly options expirations tomorrow as dealers are preparing to pay some of the premium buildup to date.
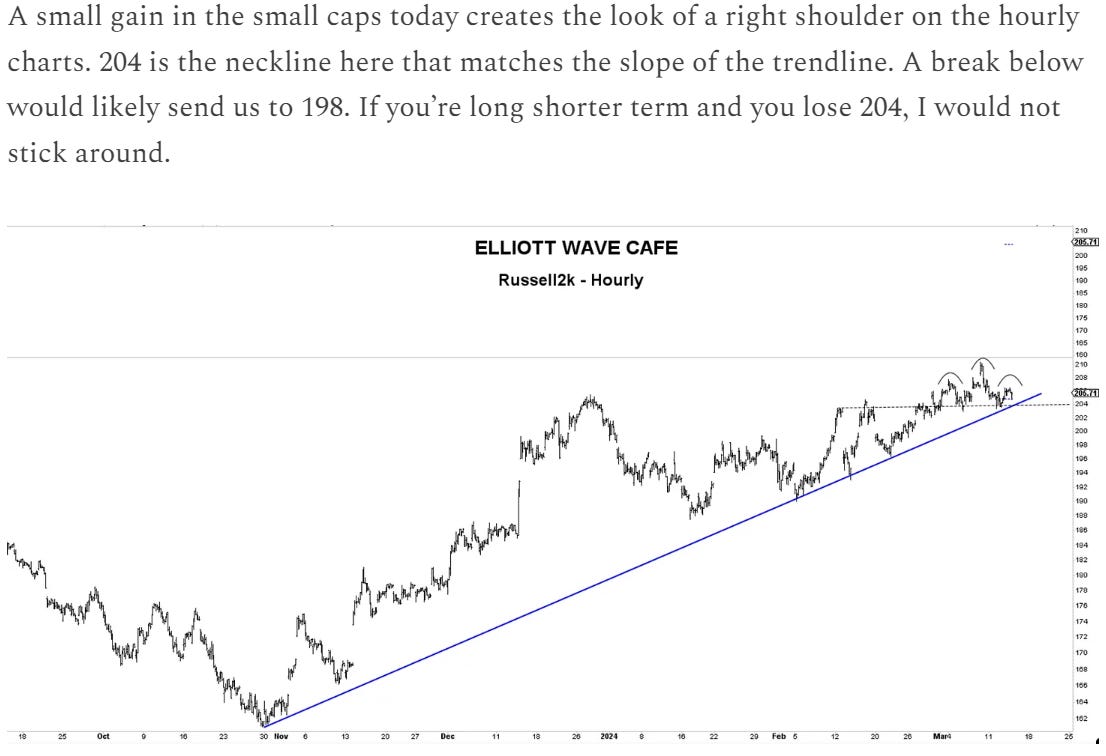
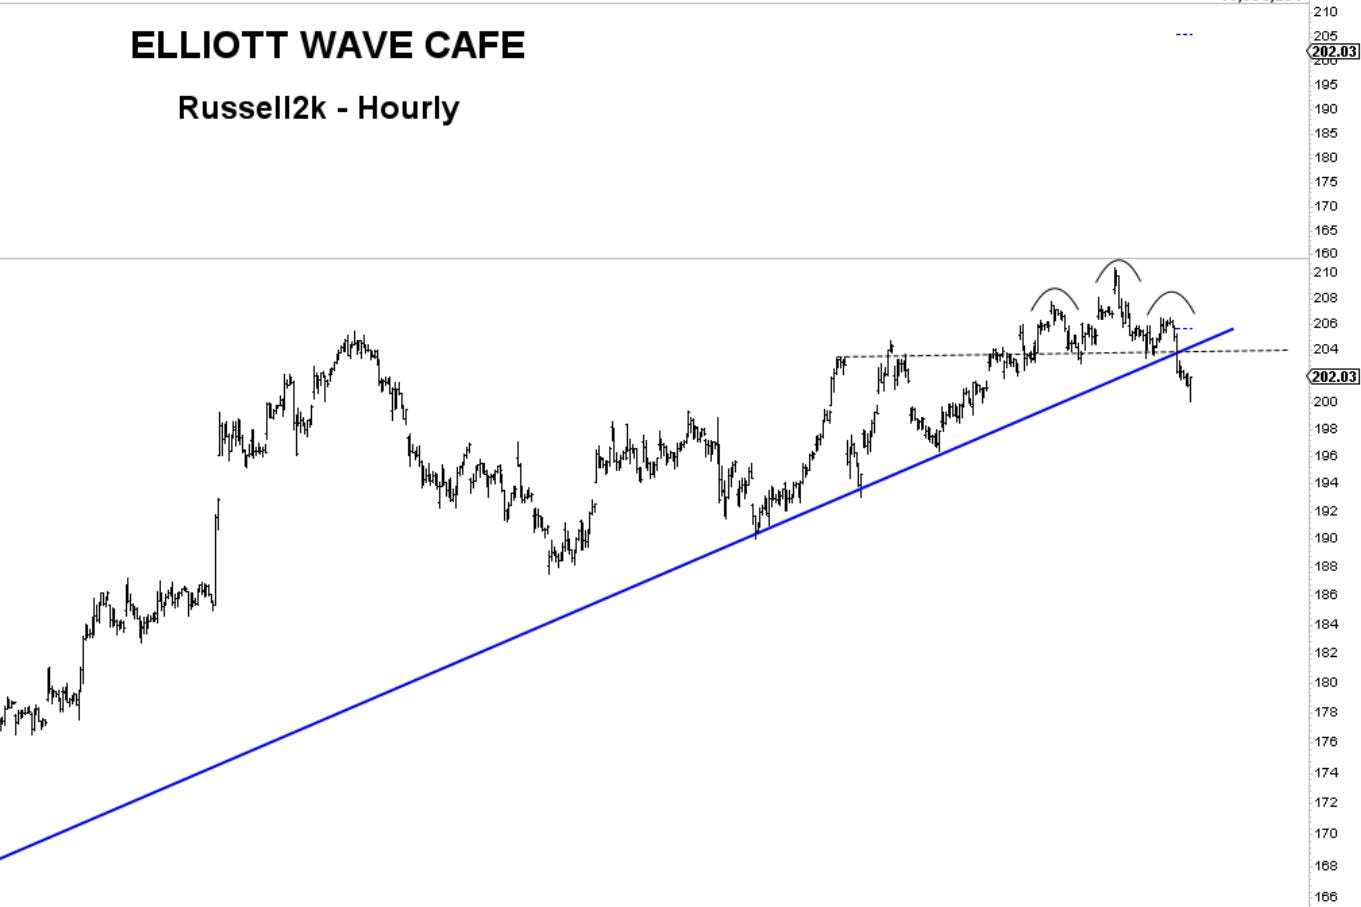
In yesterday’s written note, I showed quite a few hourly charts with levels of action and what we need to see to get into selloffs. Today, IWM showed us how a simple short-term HS top with a neckline breaking can lead to acceleration.
Here is the note below:
In the video, I reviewed longer-term charts of TSLA, PYPL, and MMM and explained some of the wave counts behind them.
In today’s video, I will discuss some of the larger-cap crypto coins and their current setups.
The note below will continue, as always, with coverage of core markets, looking at some cycles, wave counts, and trends.
A free trial will get you 7-day access!
