
The Daily Drip
Core markets charts updates and commentary
Note: The counts on the right edge are real-time, and they are prone to adjustments as price action develops. Elliott Wave has a fluid approach, is evidence-based, and requires constant monitoring of certain thresholds.
In the counts below, this (( )) = circle on chart
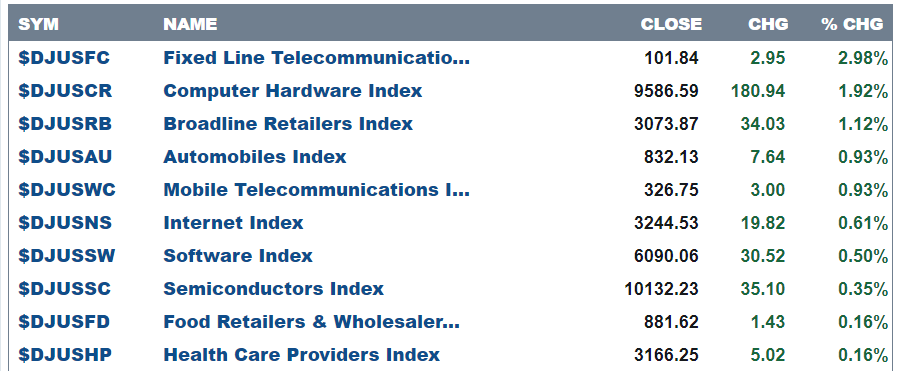
Here are today’s top 10 best performers out of 104 industries.
13 positive closes and 91 negative.
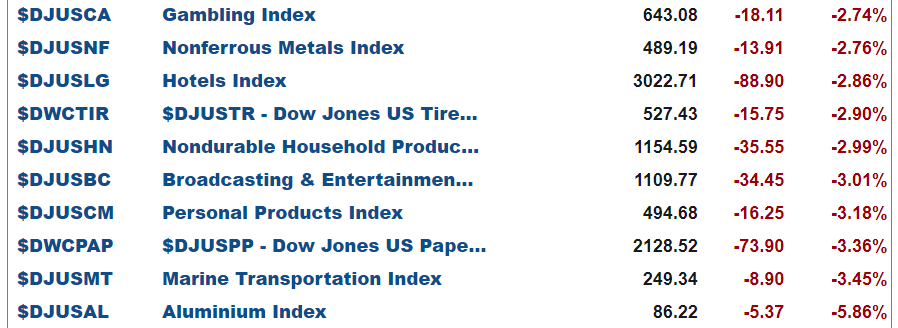
and bottom 10 …
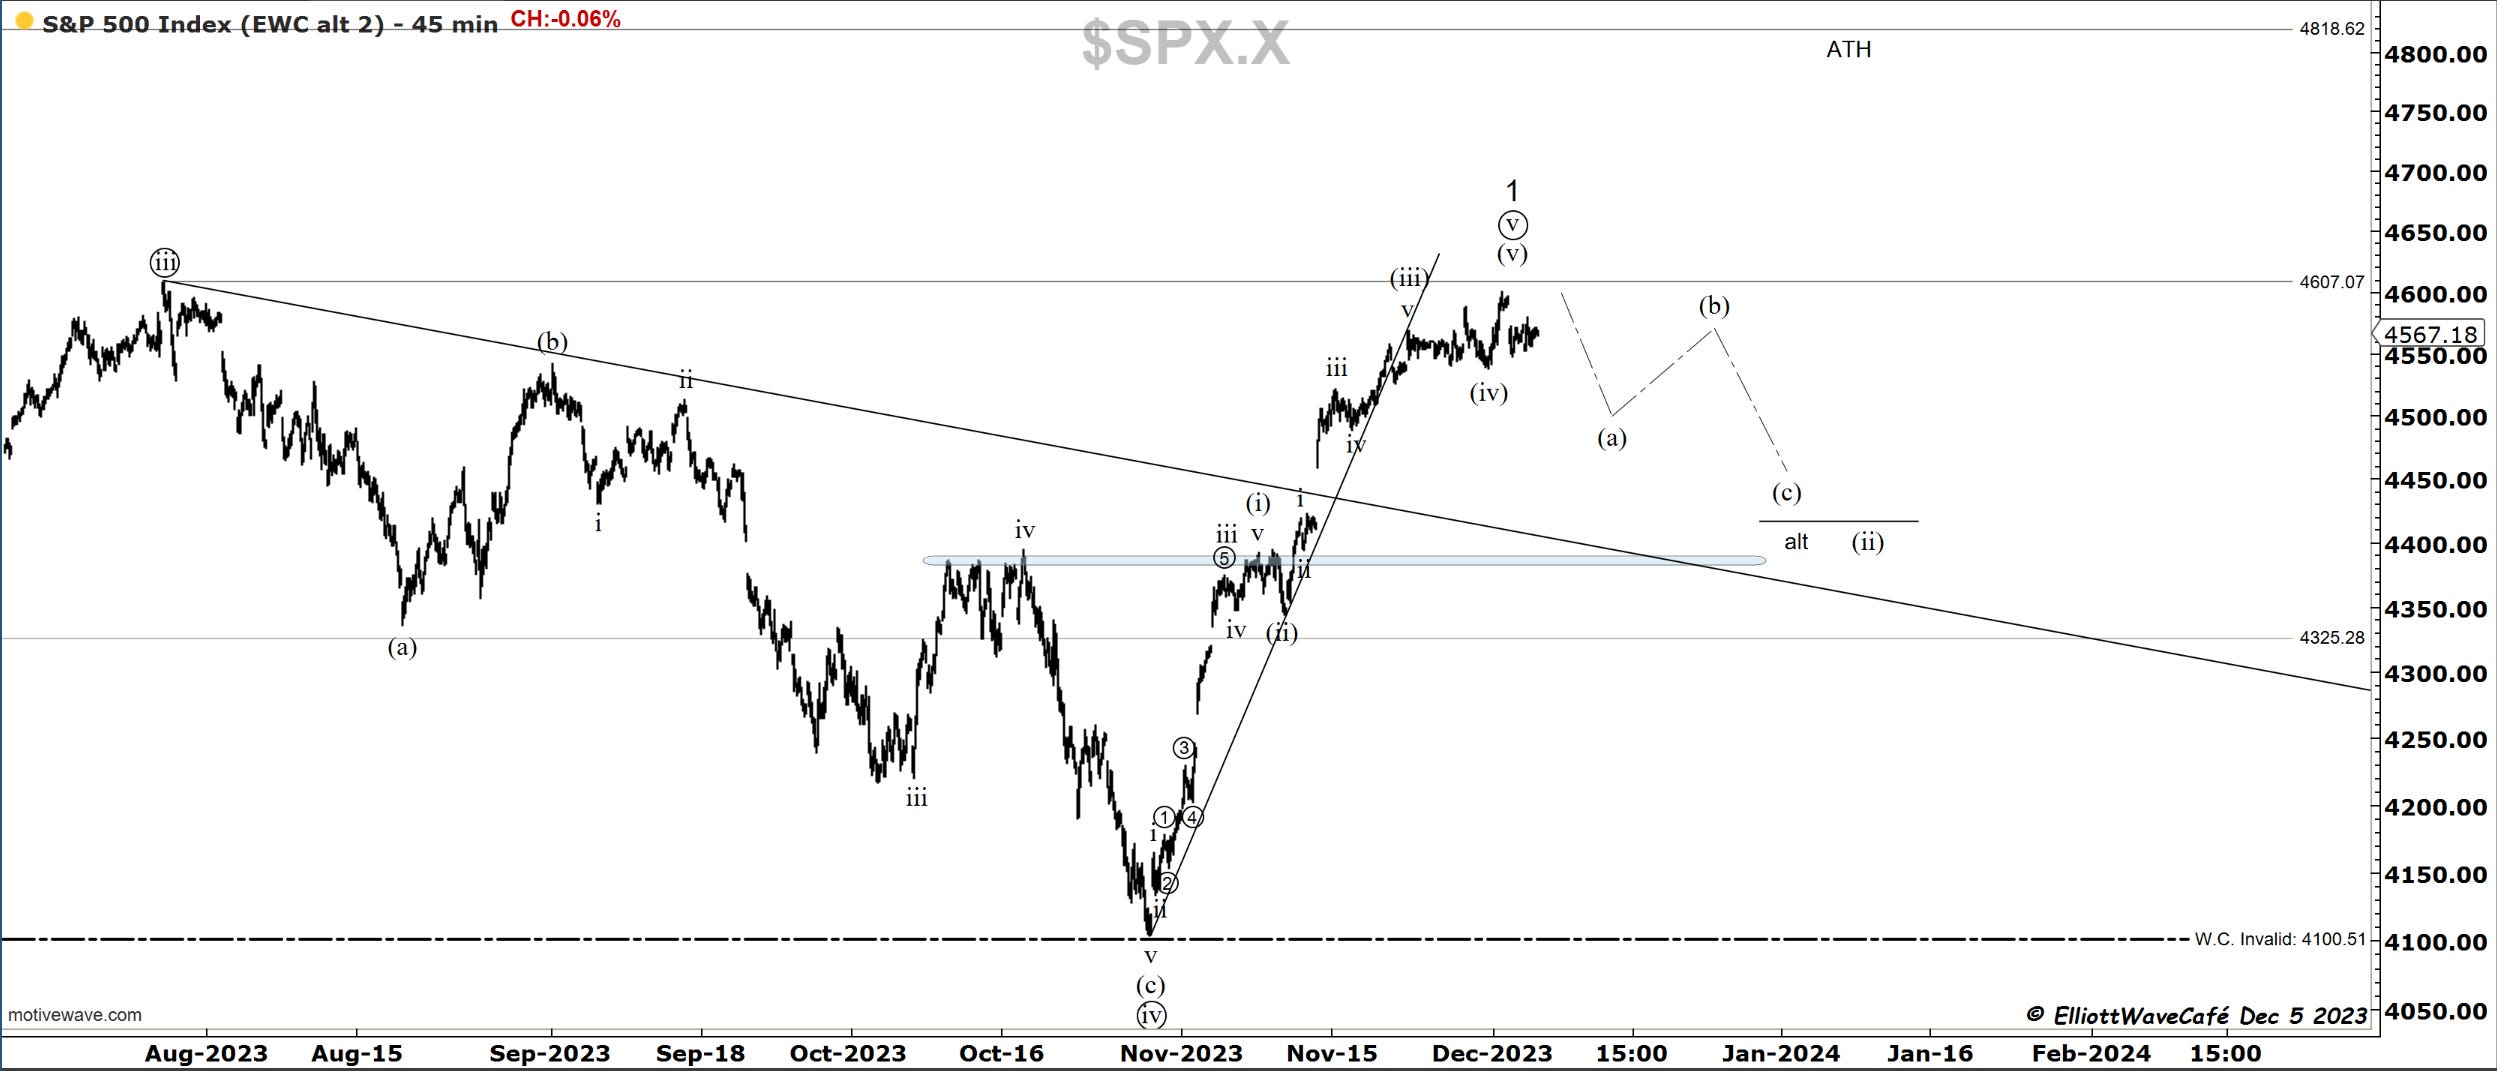
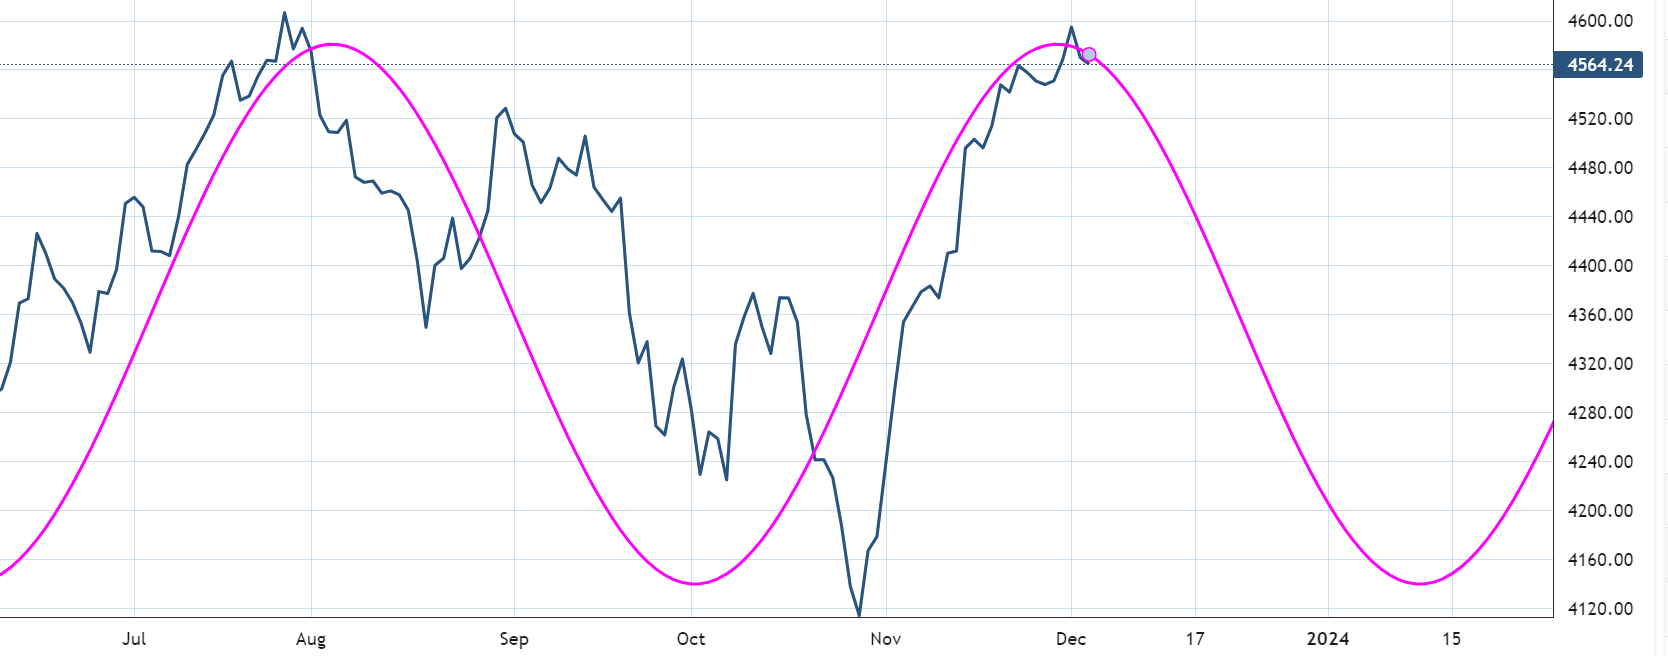
SP500
Ever since we broke that steep trendline, this index could not continue sustaining the advance. It is getting weaker with each passing day. A corrective push should take us towards 4500 first and eventually 4400 zone.
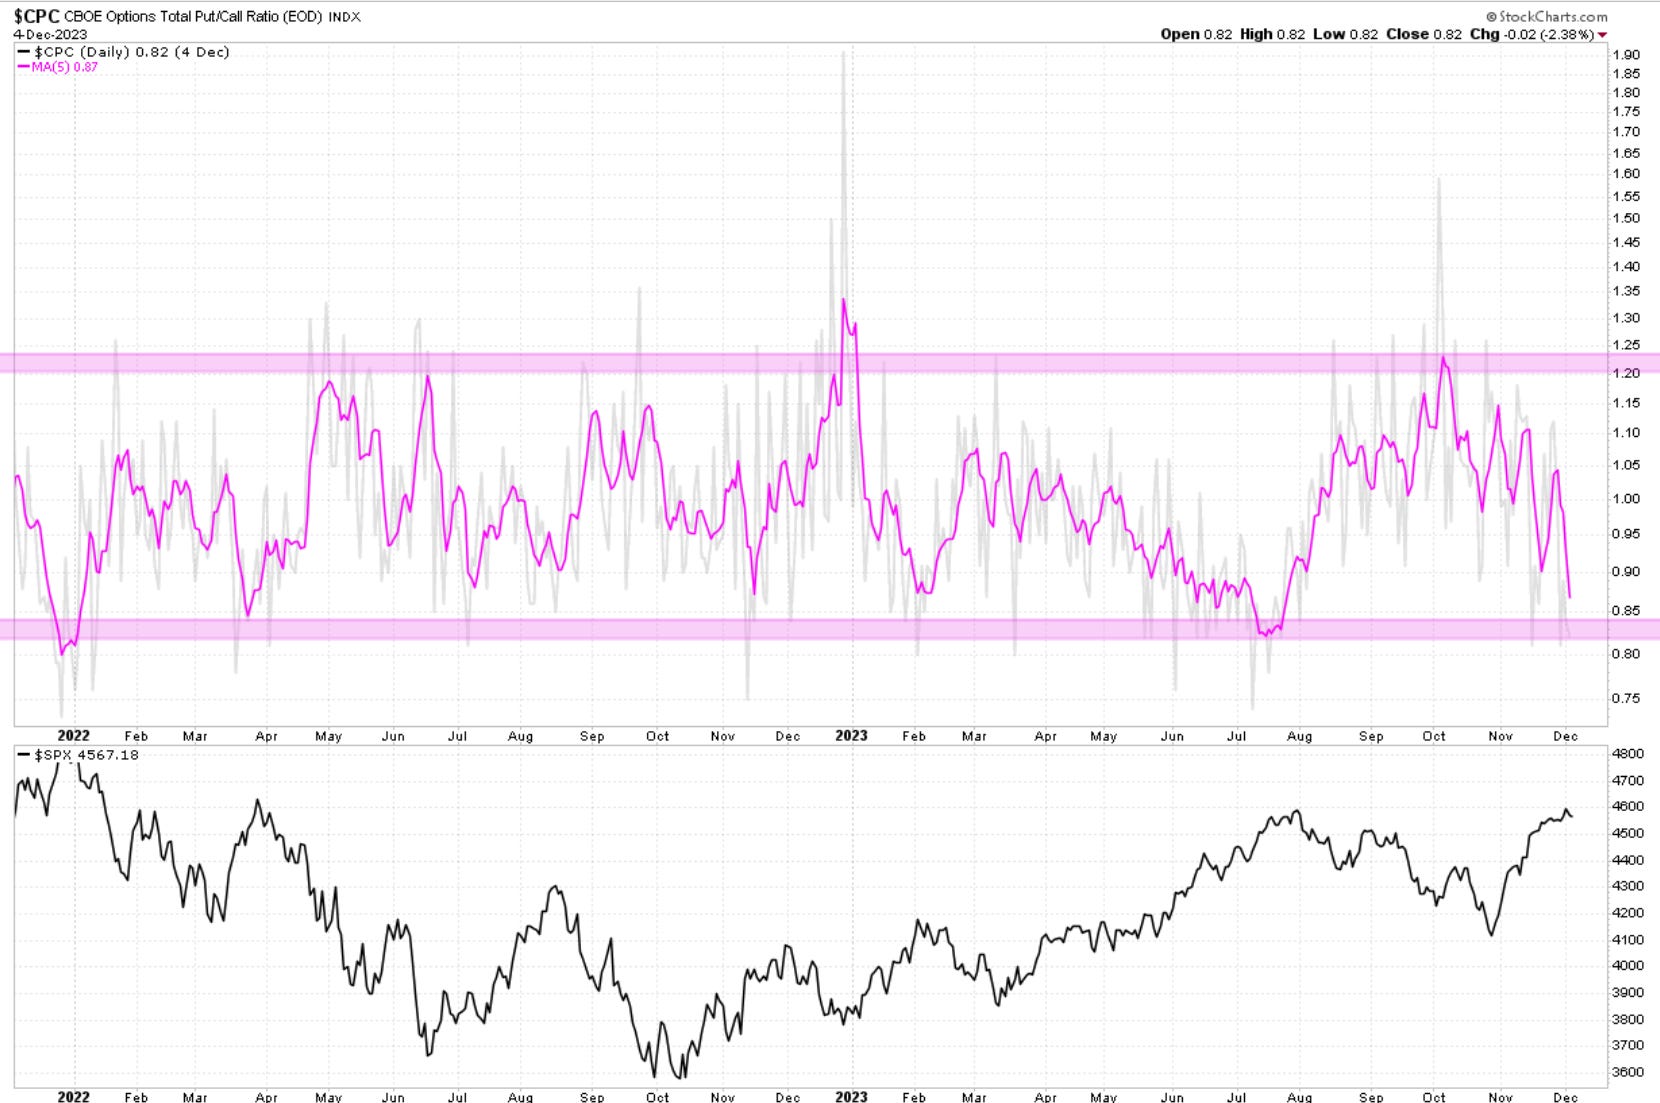
Here are some more signs that are coming together to paint a full picture. The options total P/C ratio is getting into Hot teriotorry as traders increase call option buying. This type of action shows excitement and increasing bets towards higher prices. Not something that the market usually rewards.
Same thing if we move to an equity-only P/C ratio. Approaching that zone where one must be wary of looking too much to the long side.
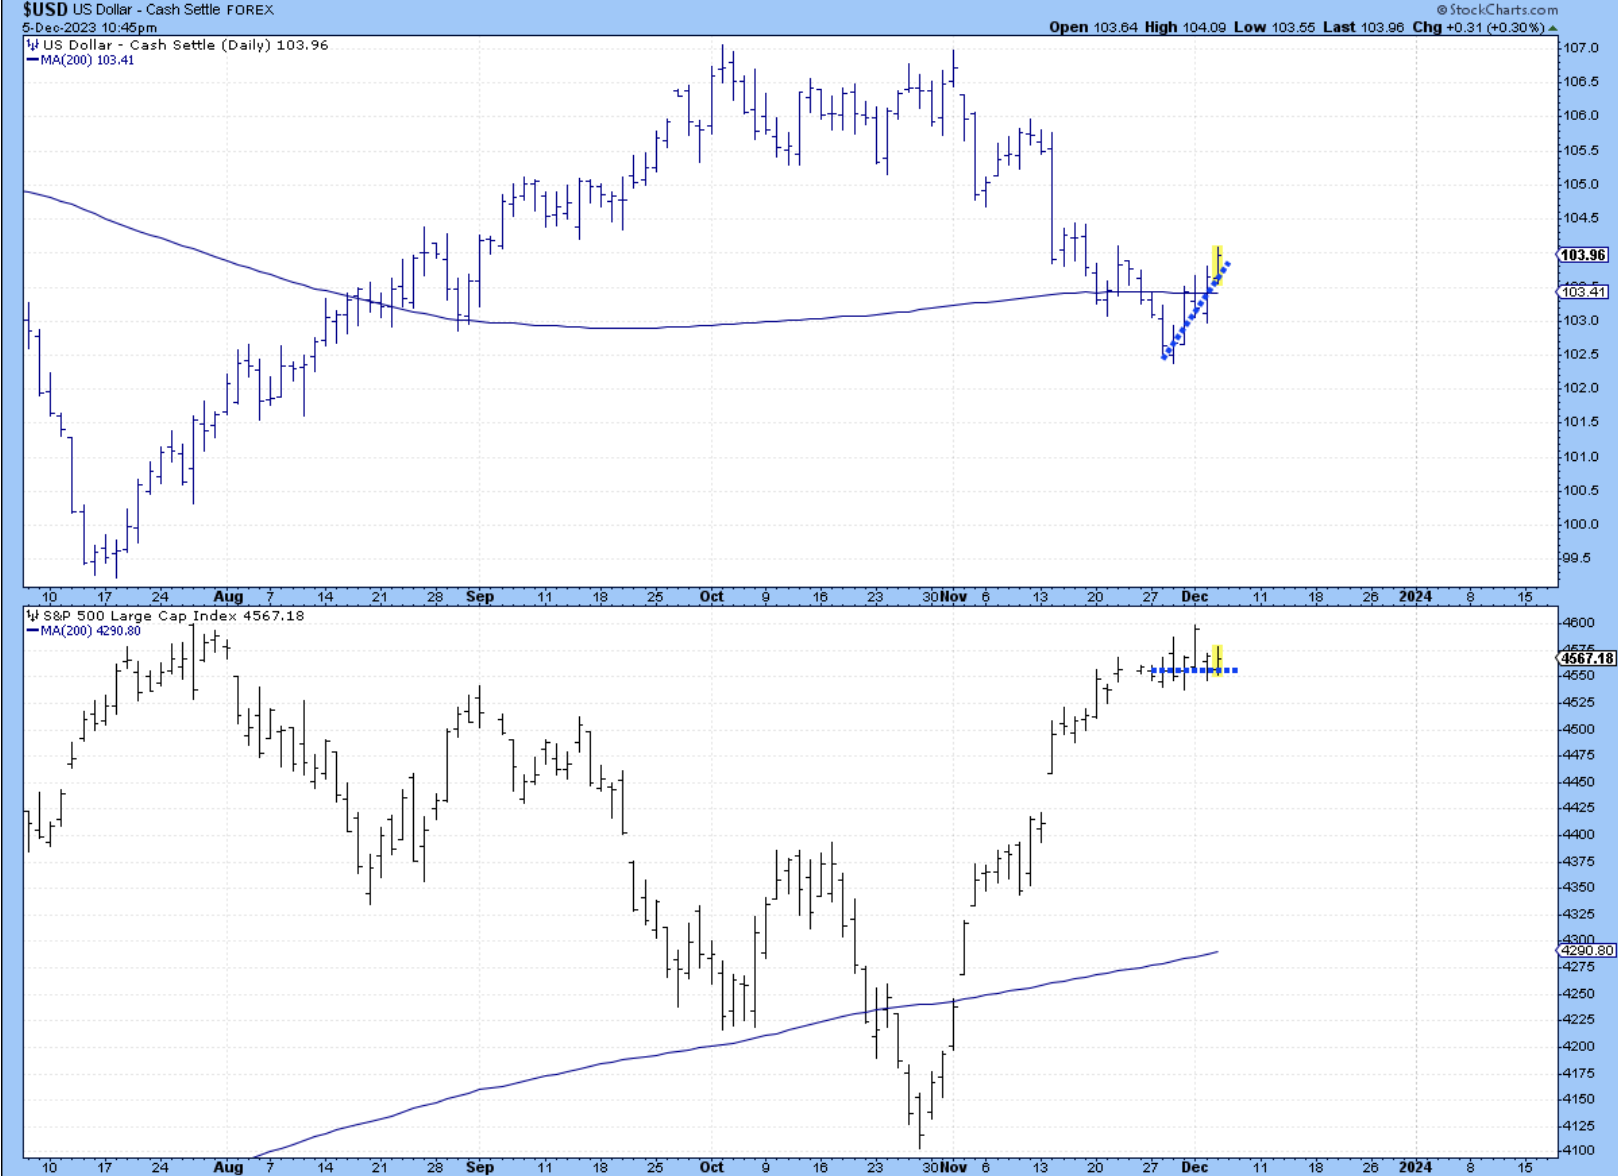
Here is our friend, the Dollar. There has been clear underperformance from equities ever since that bottom on Nov 29th.
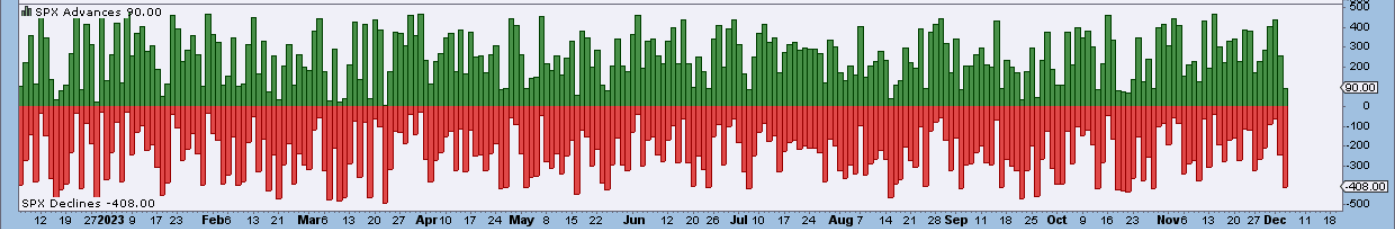
You might not have been able to tell just by looking at the tape, but today, -408 stocks declined vs 90 that advanced. One of the weakest days since mid-October.
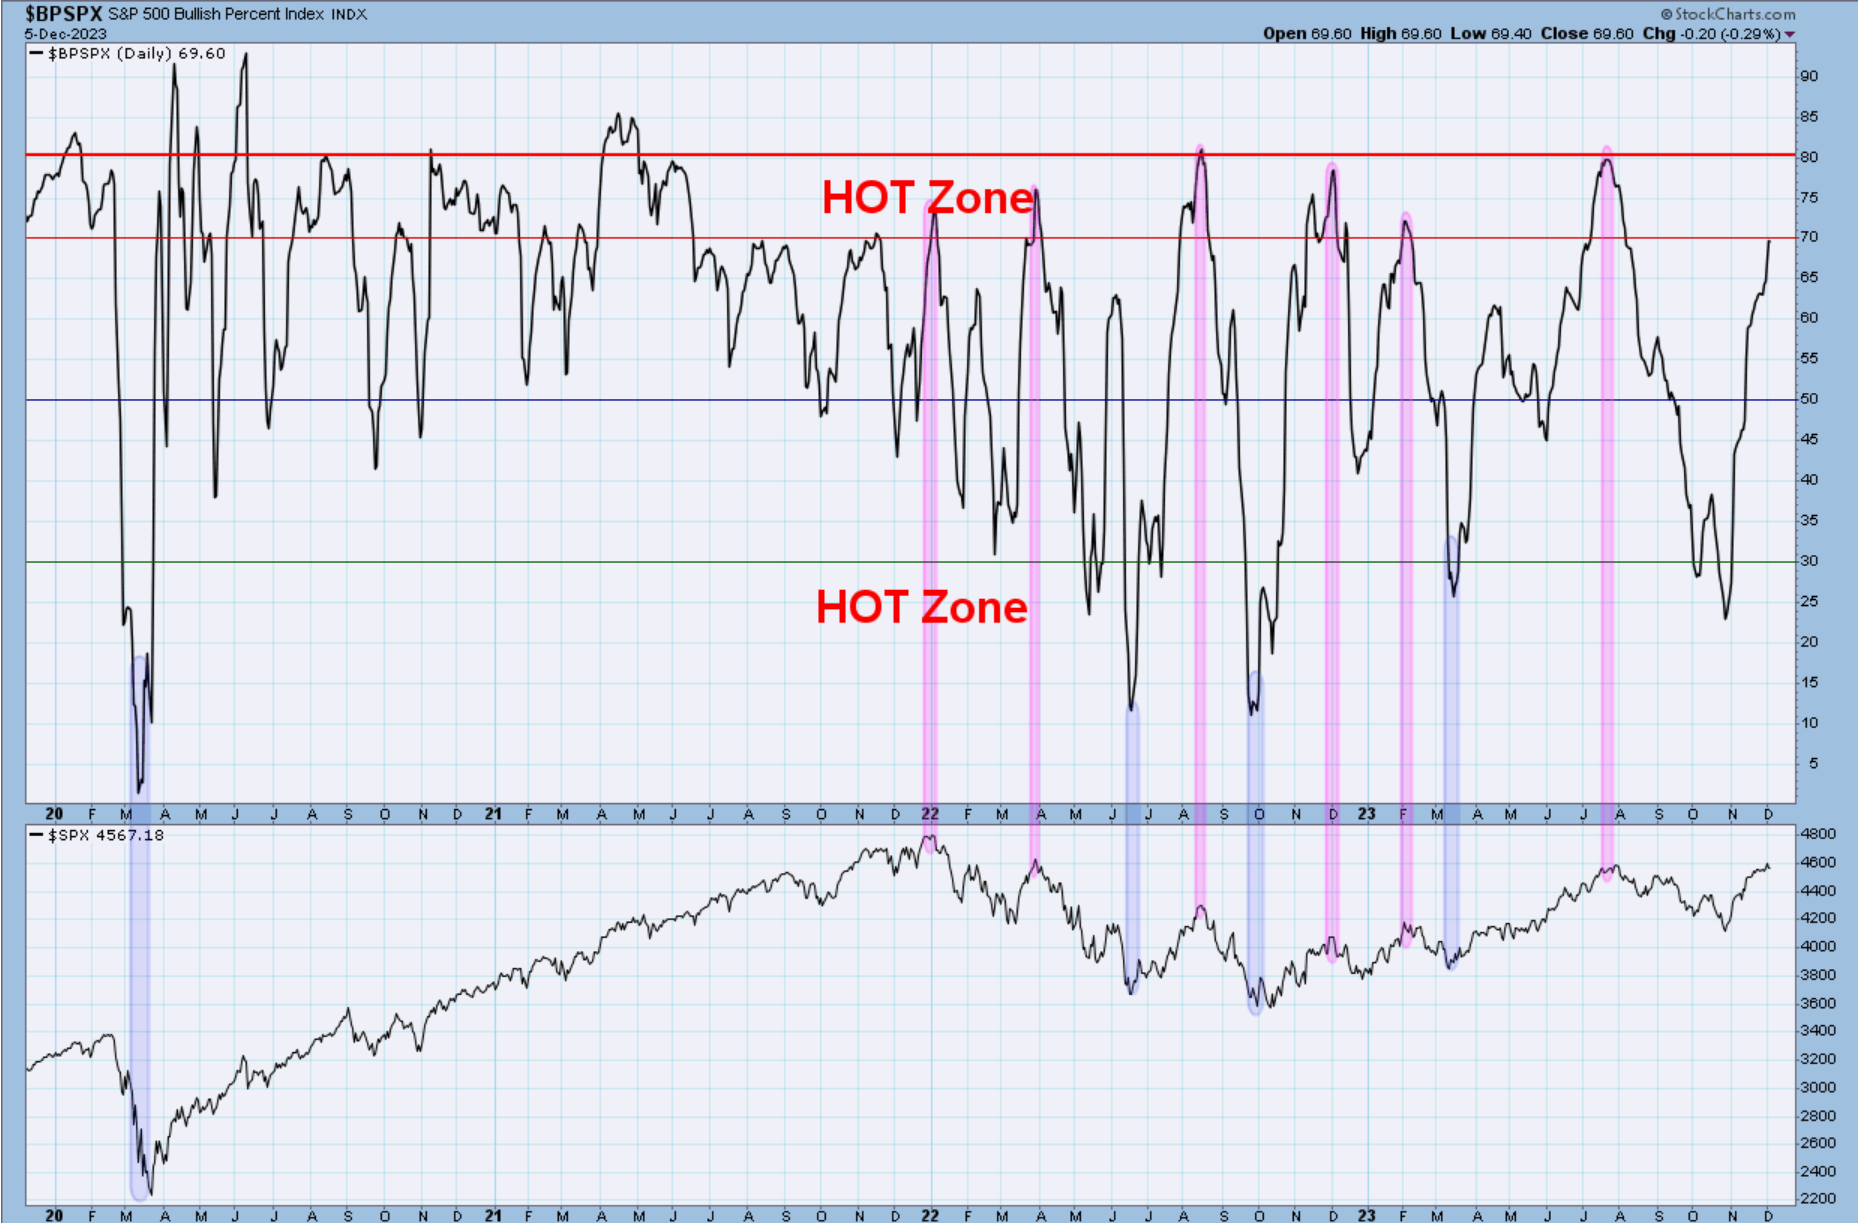
The BPI is finally approaching the Hot Zone as well.
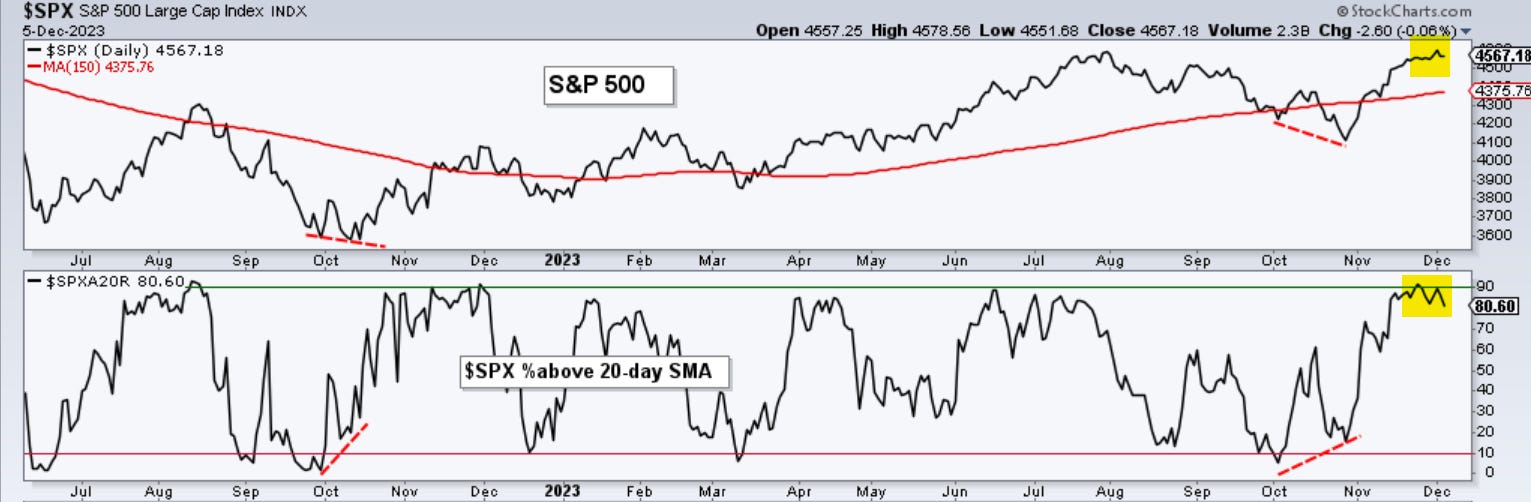
The first discrepancies we will always see are in the short-term moving averages. Here, you can see how the number of stocks above the 20-day is dropping, showing that there is a bubbling weakness underneath the surface.
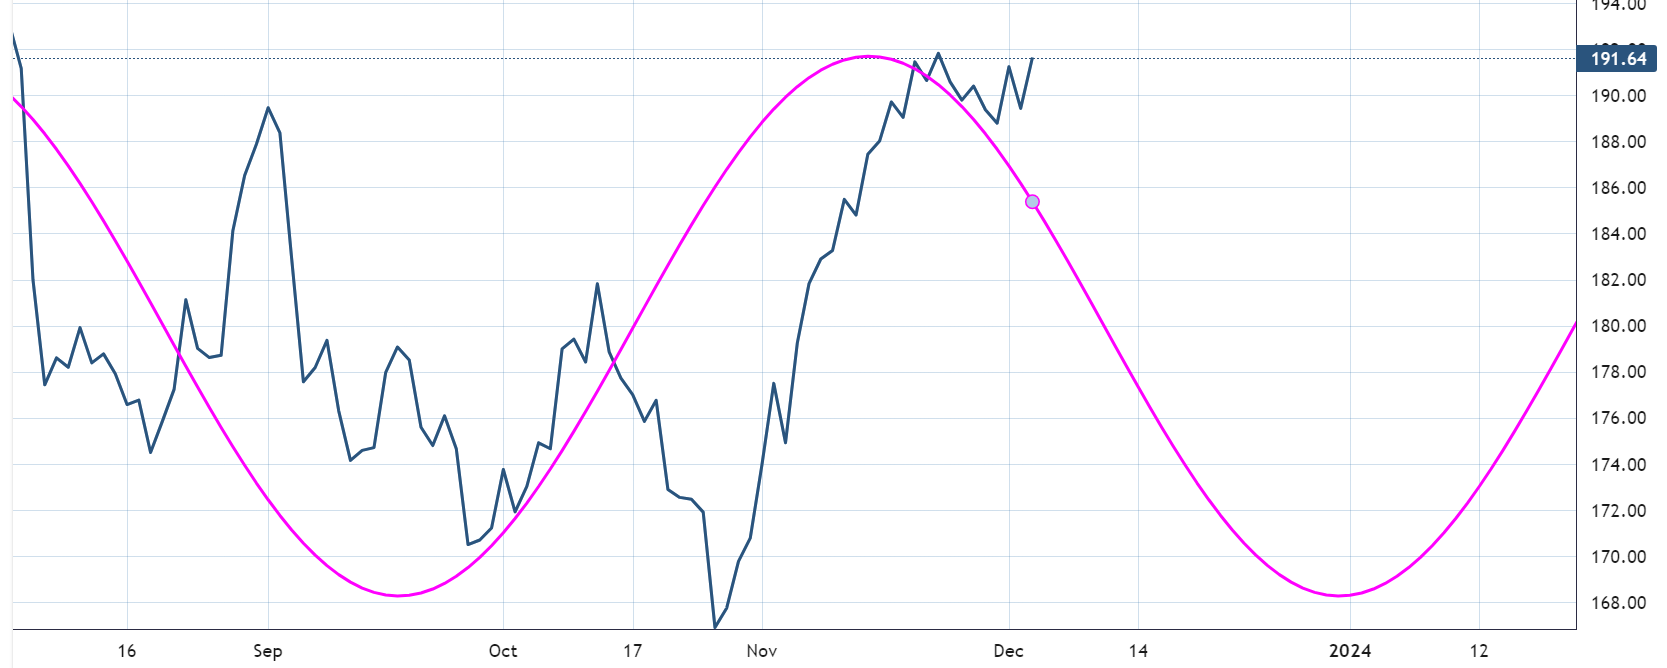
The dominant 80-day cycle is not favorable for equities at this point and shows weakness into early next year.
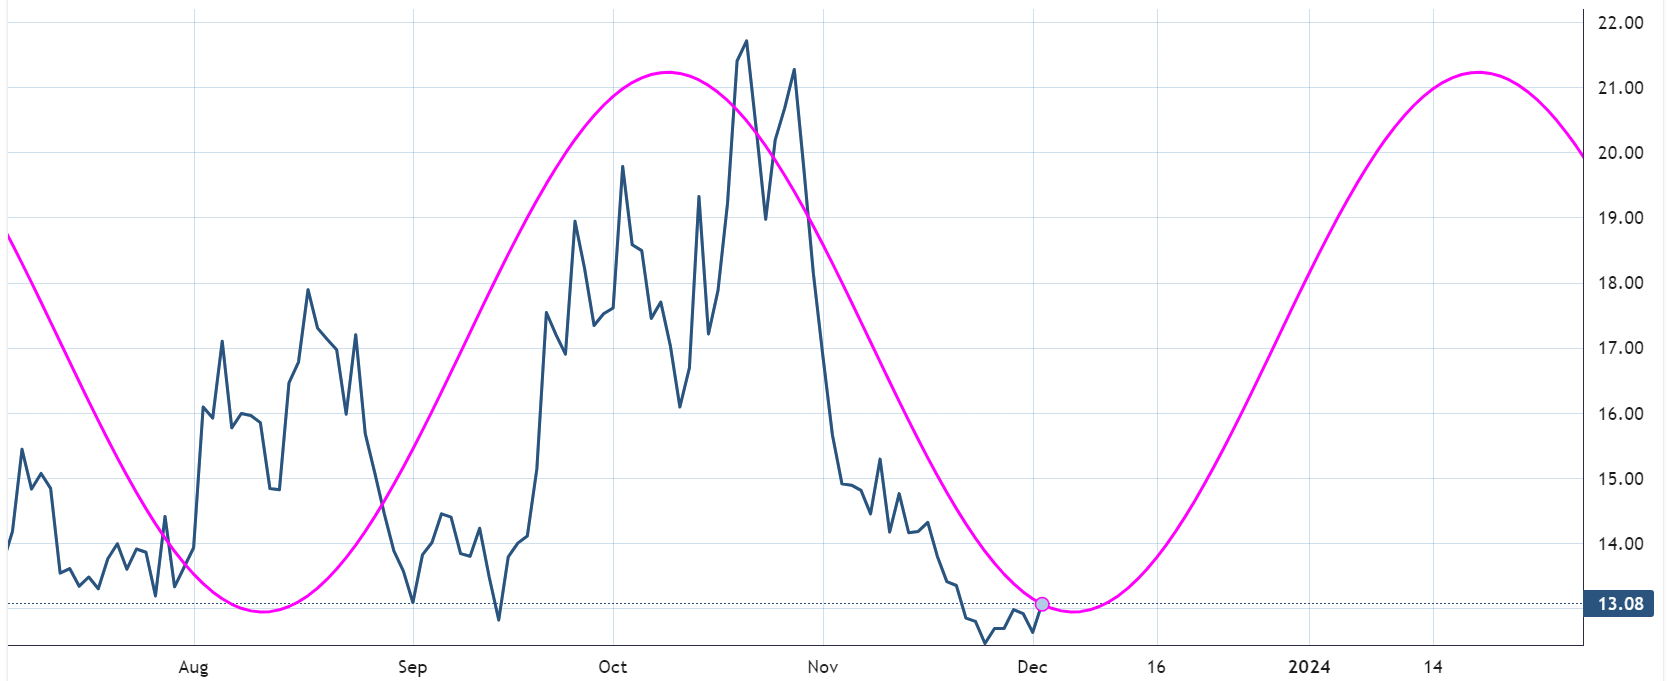
Here is the VIX running on fumes before an upper cycle gets going.
In conclusion, I expect the next couple of weeks to be difficult. Many of the large-cap stocks are showing signs of stalling and increased odds of corrective patterns.
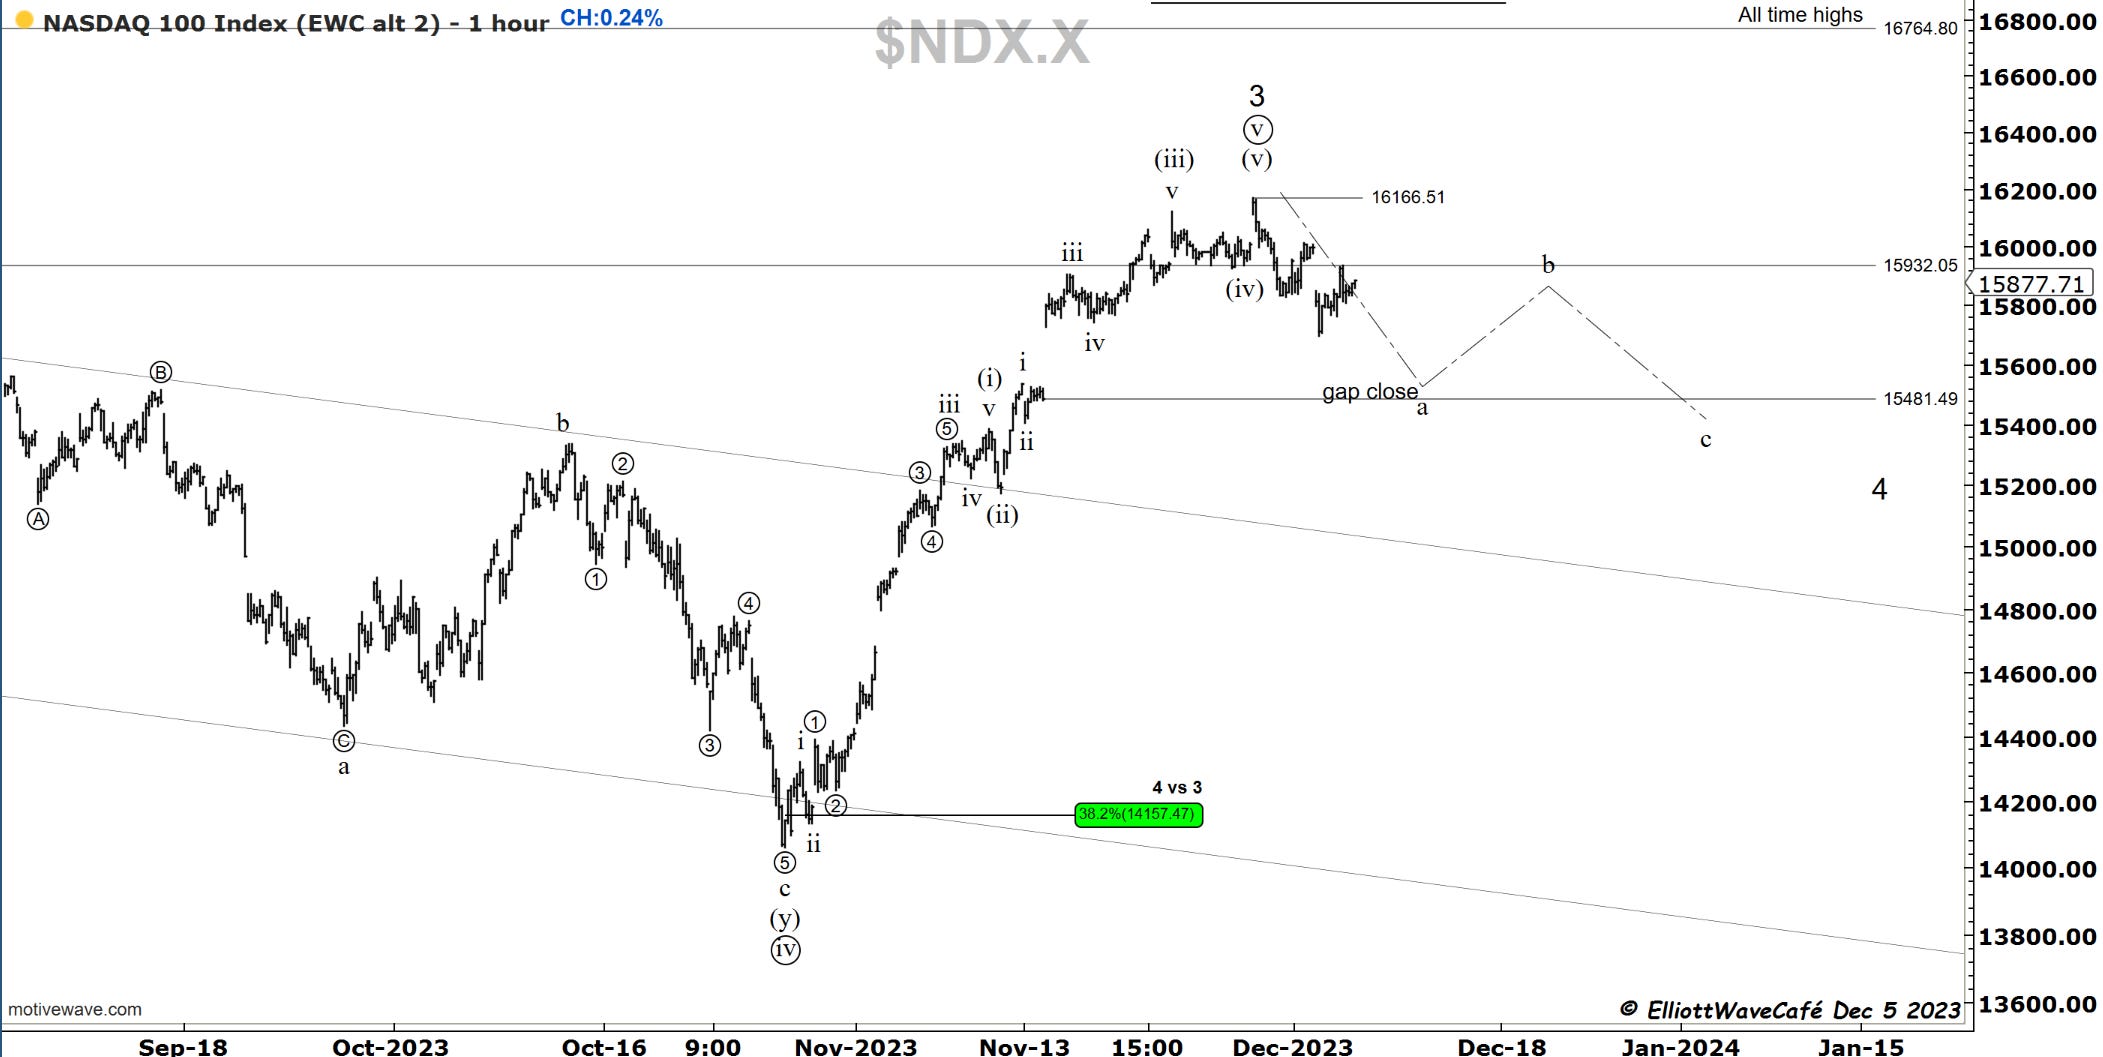
Nasdaq100
Nasdaq100 was a winner today, mostly due to AAPL’s performance. But if we study that price chart, it seems likely that a 5th wave was just hit. ( 2nd chart).
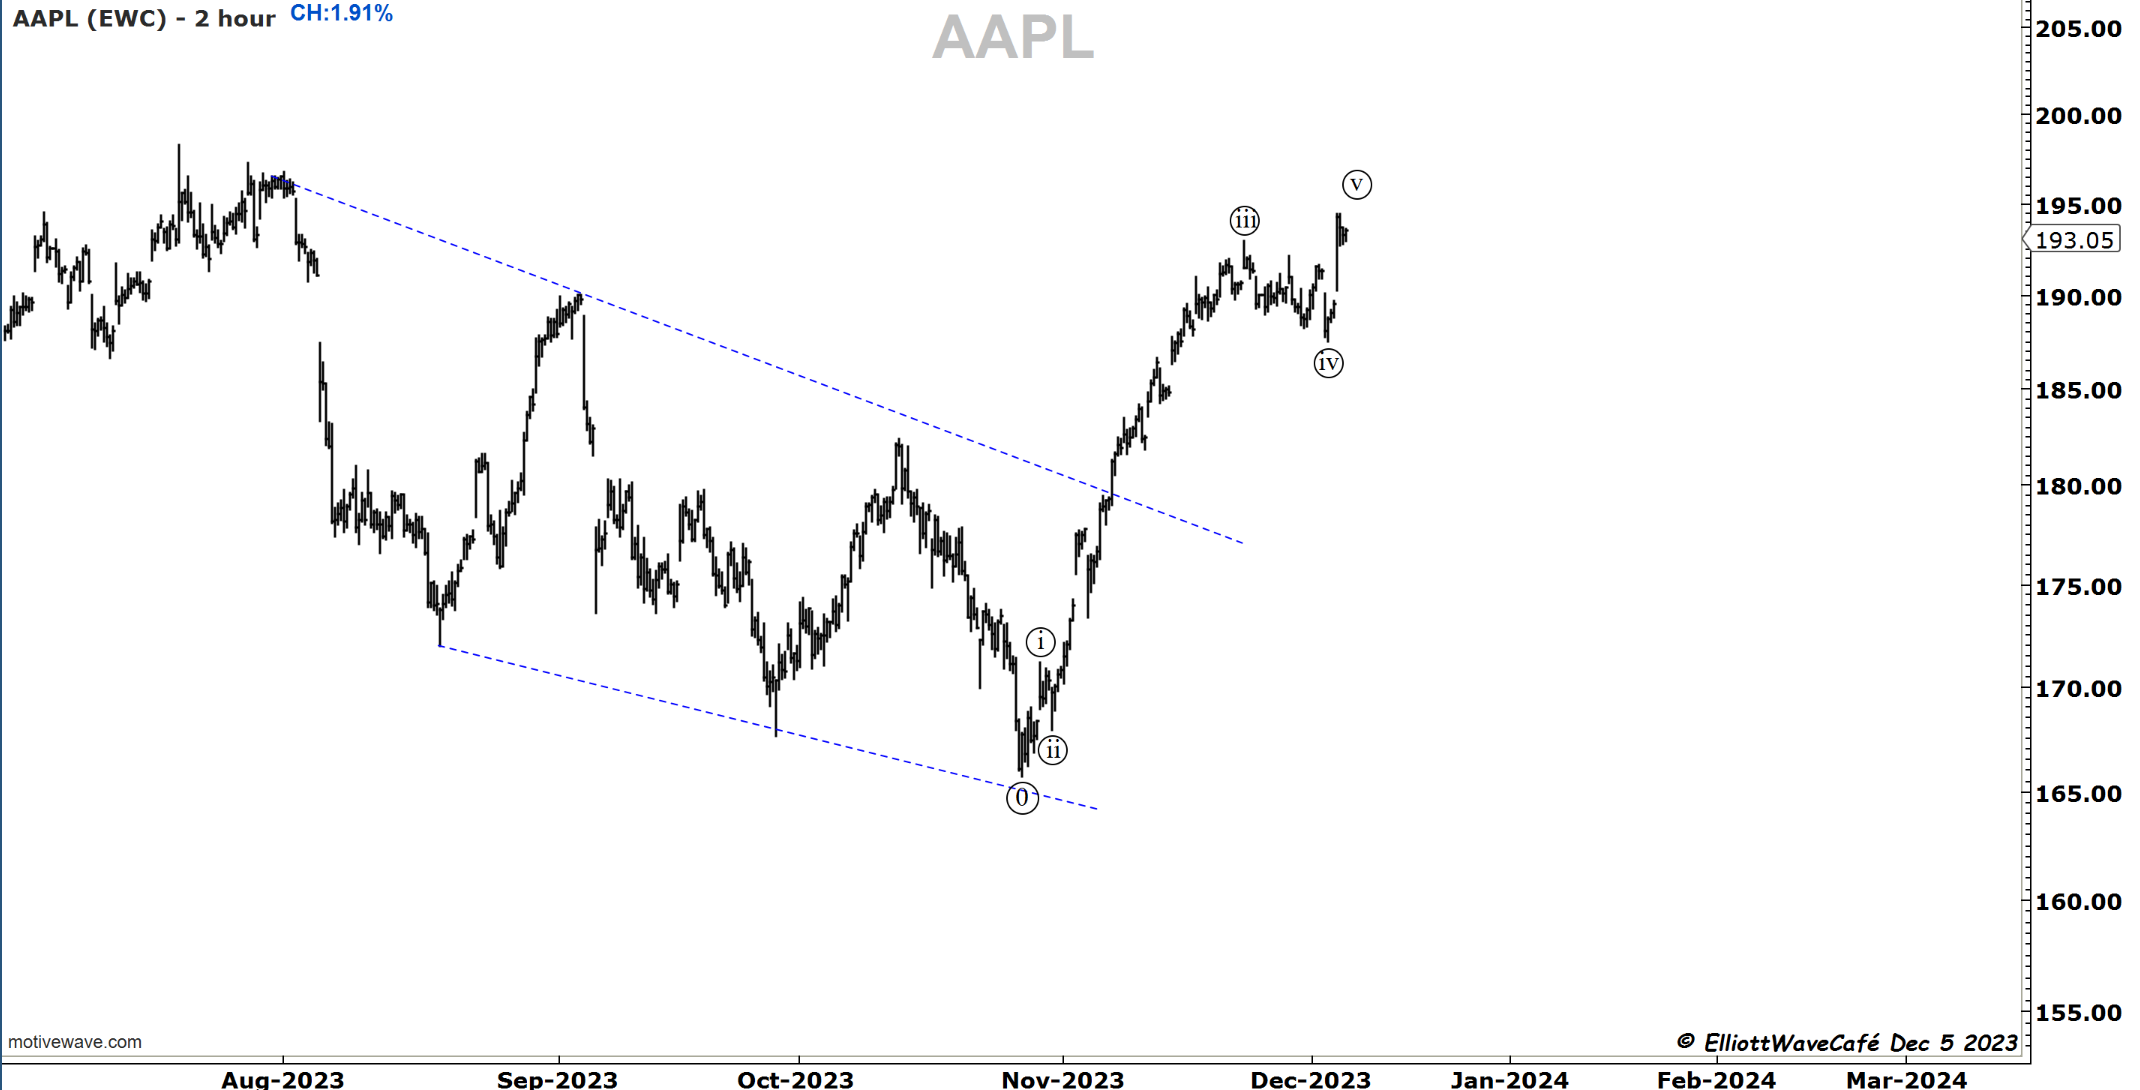
The 80day cycle in AAPL is not that favorable either. If this stock underperforms, I don’t think Nasdaq100 can go far.
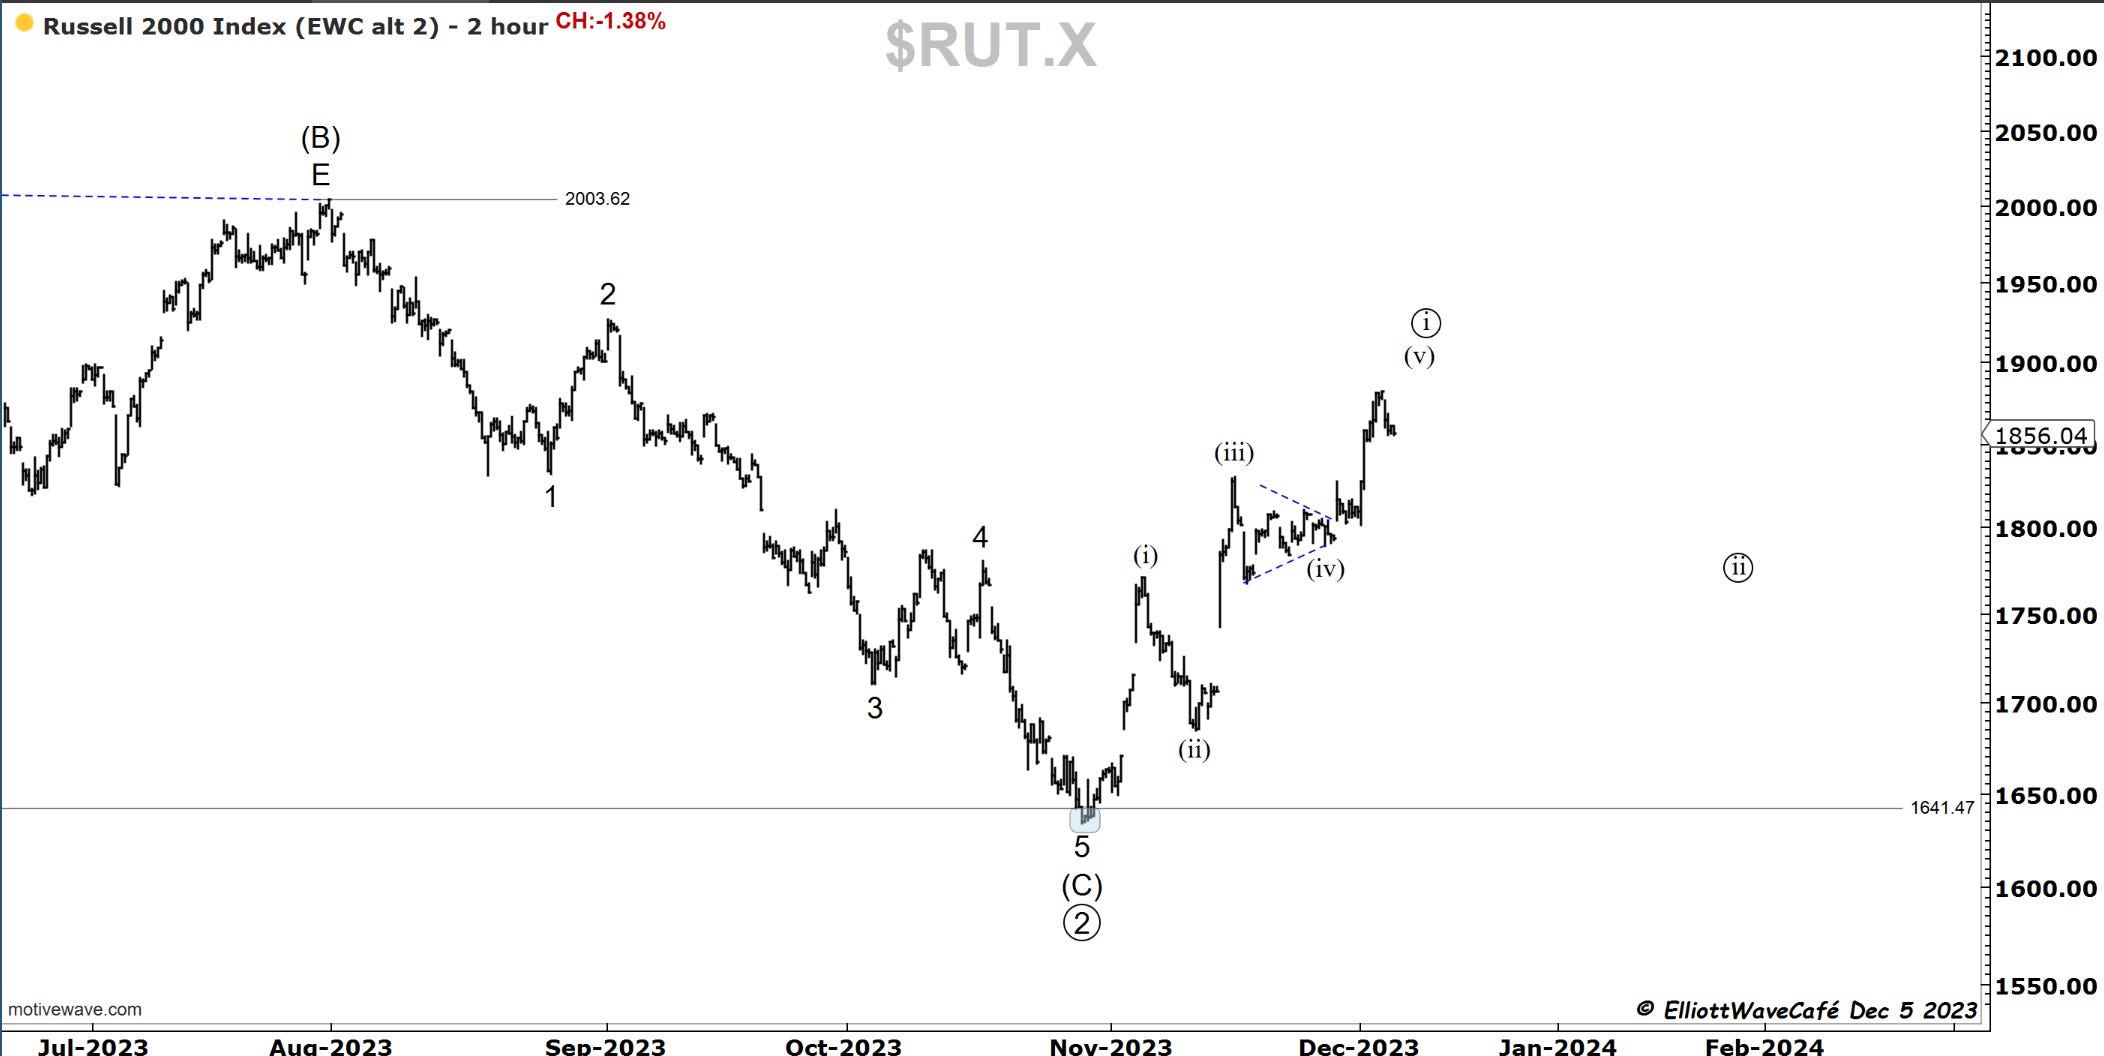
RUSSELL 2000
Russell lost -1.38% today. Traders shifted a bit from small caps to large caps. A 5-wave move here continues to appear evident. I would expect a countertrend corrective move as we’re running this year to the end.

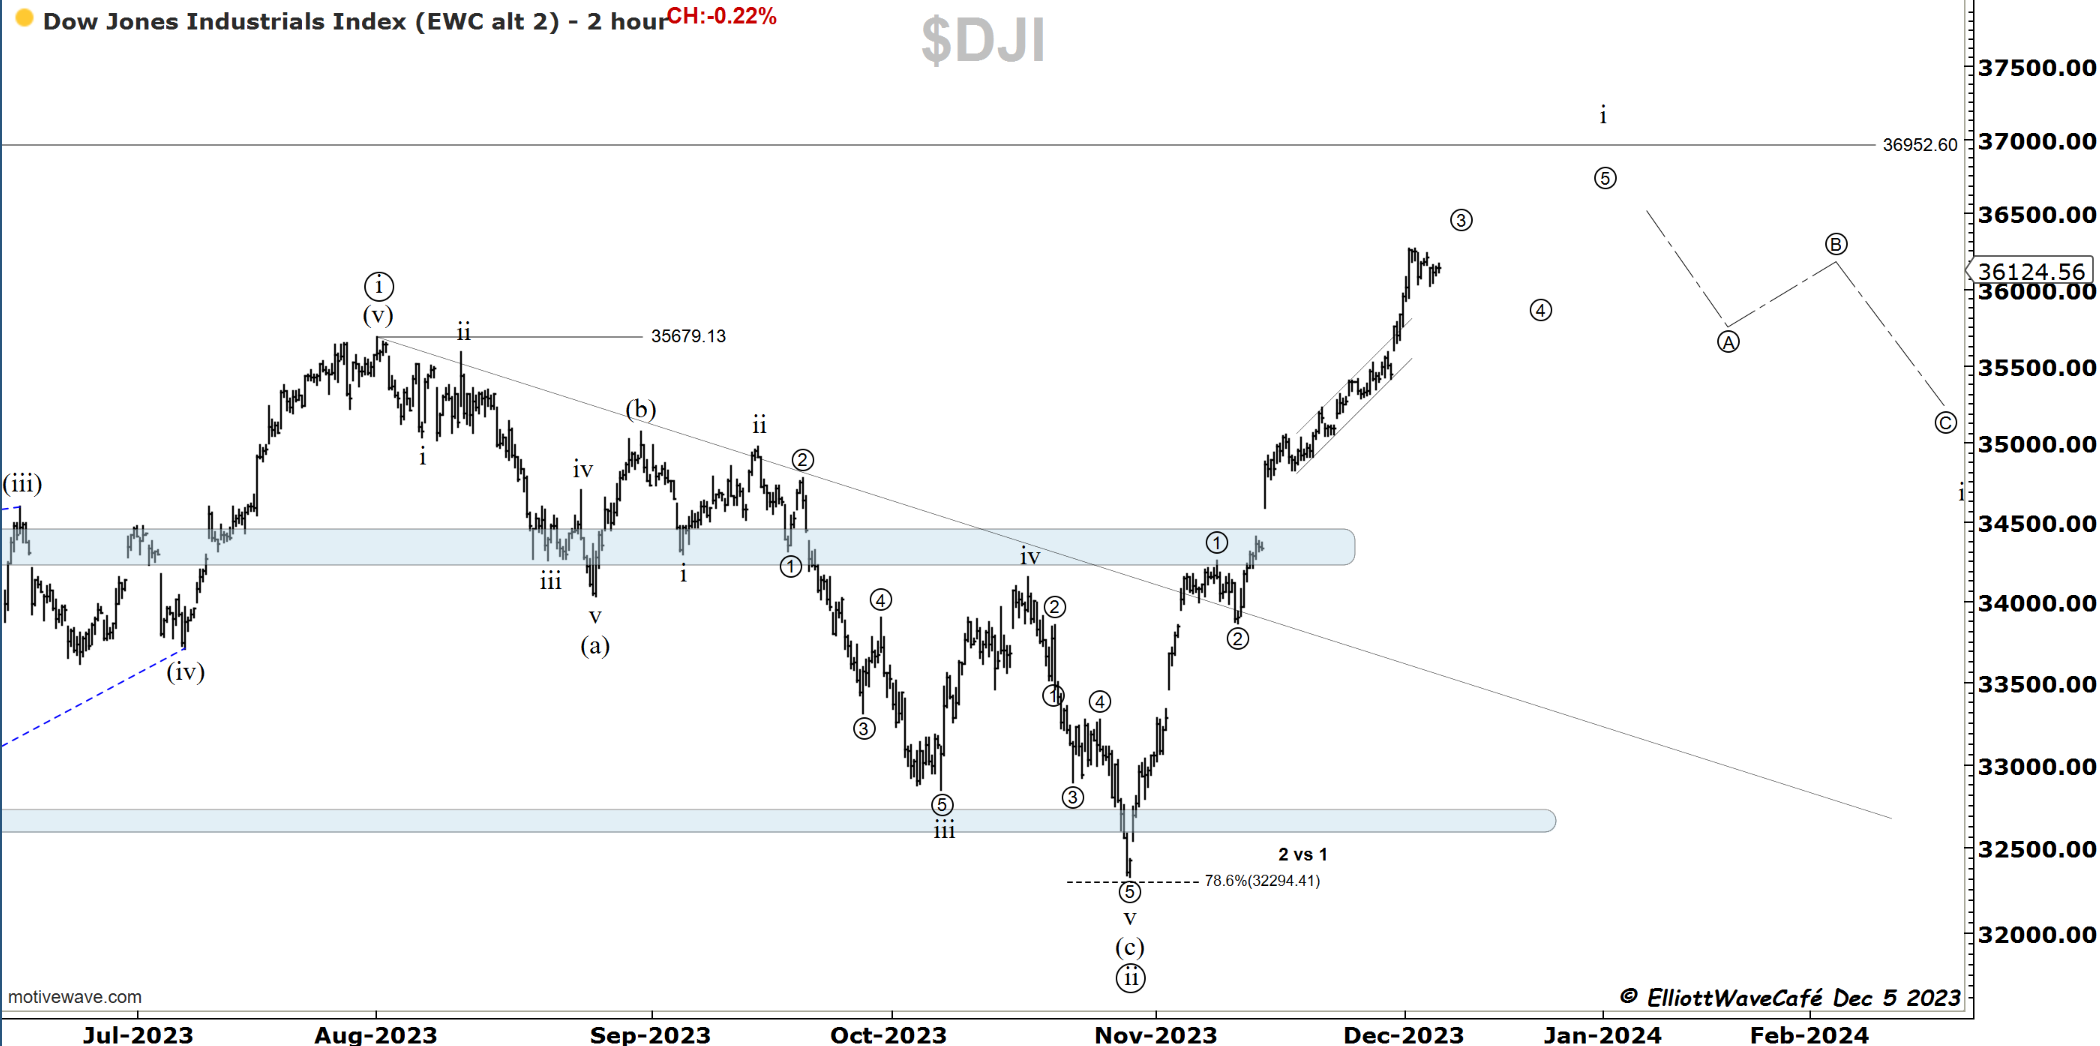
Dow30
Signs of tiredness continue to appear in this balanced index. The count seems to agree with what’s happening in the BPI index. A hot zone that suggests profit-taking is more appropriate rather than the opening of new long positions.
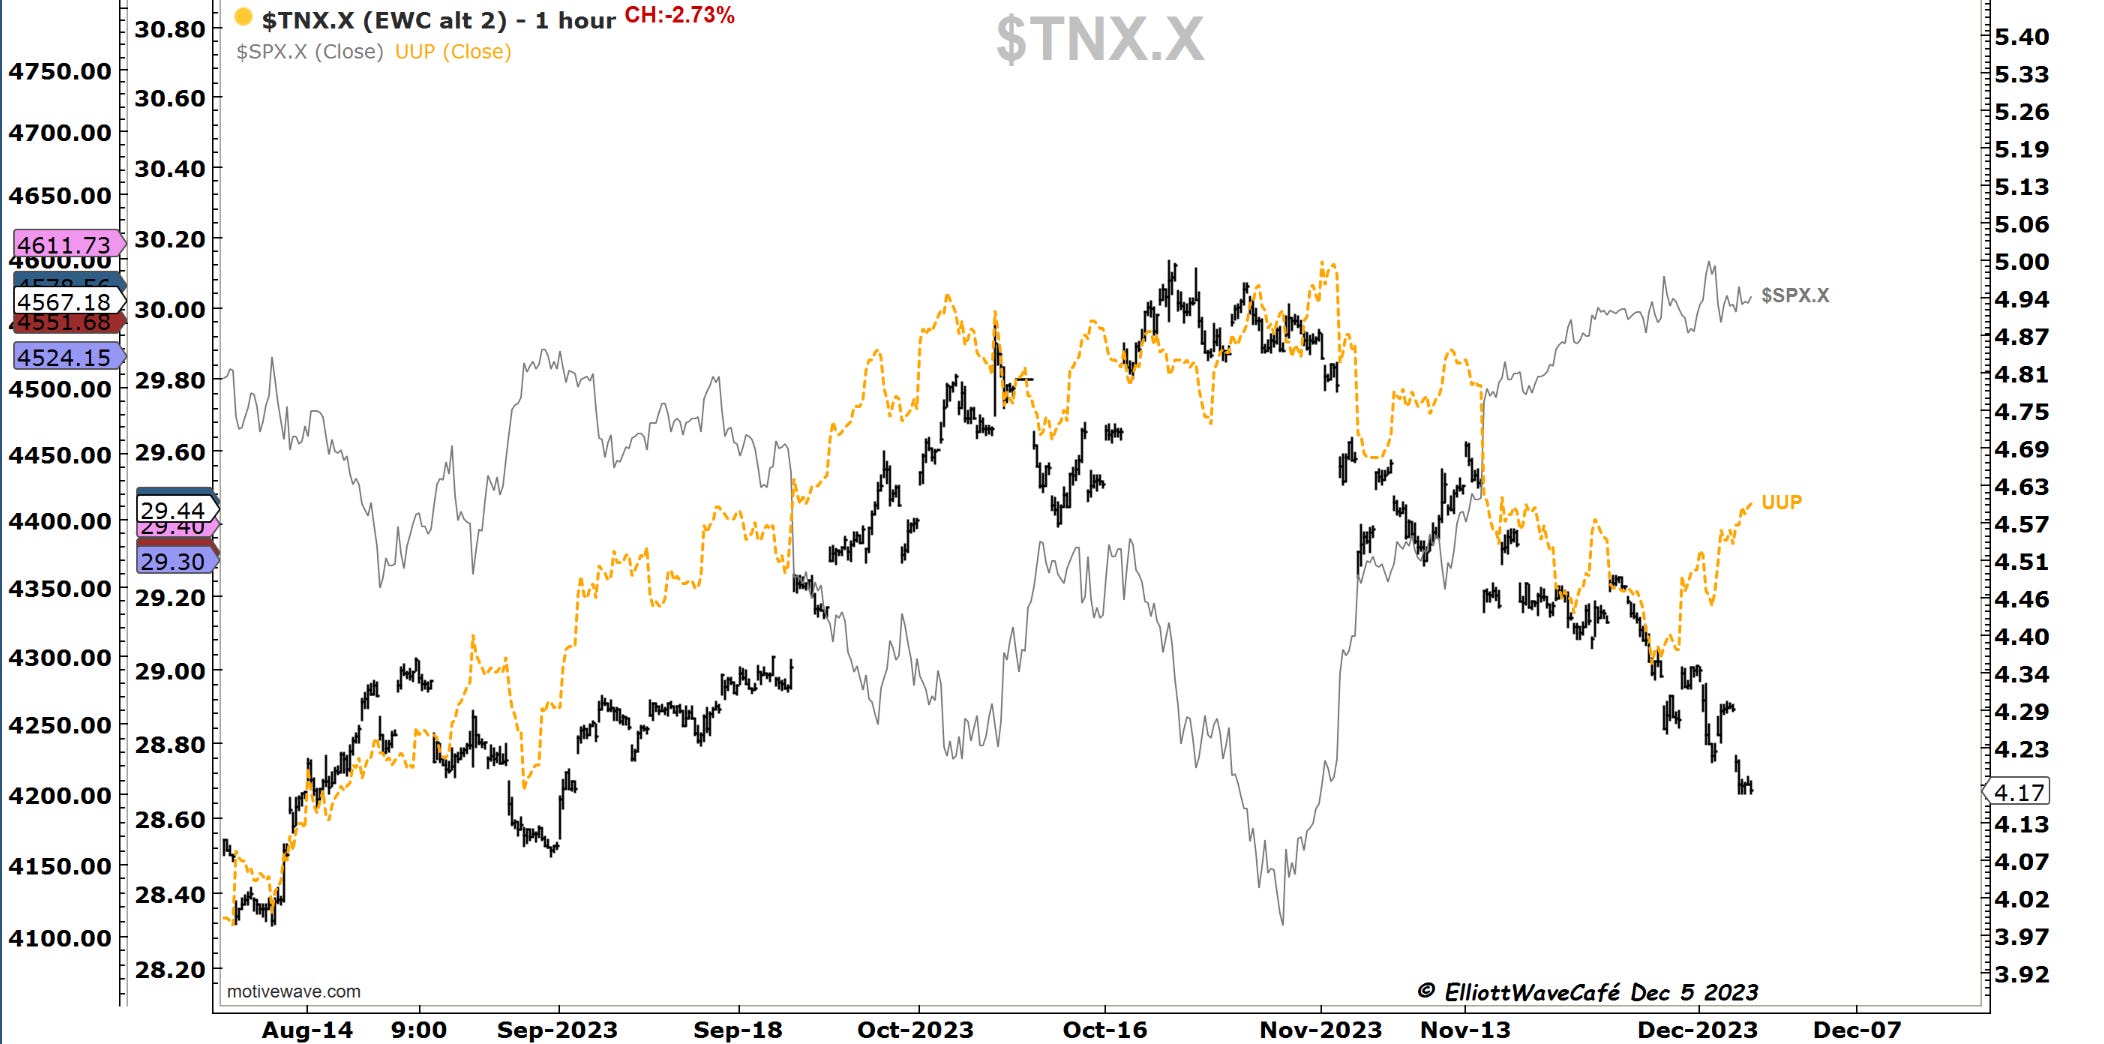
US Dollar and Yields
Let’s see if this is what the Dollar has in store.
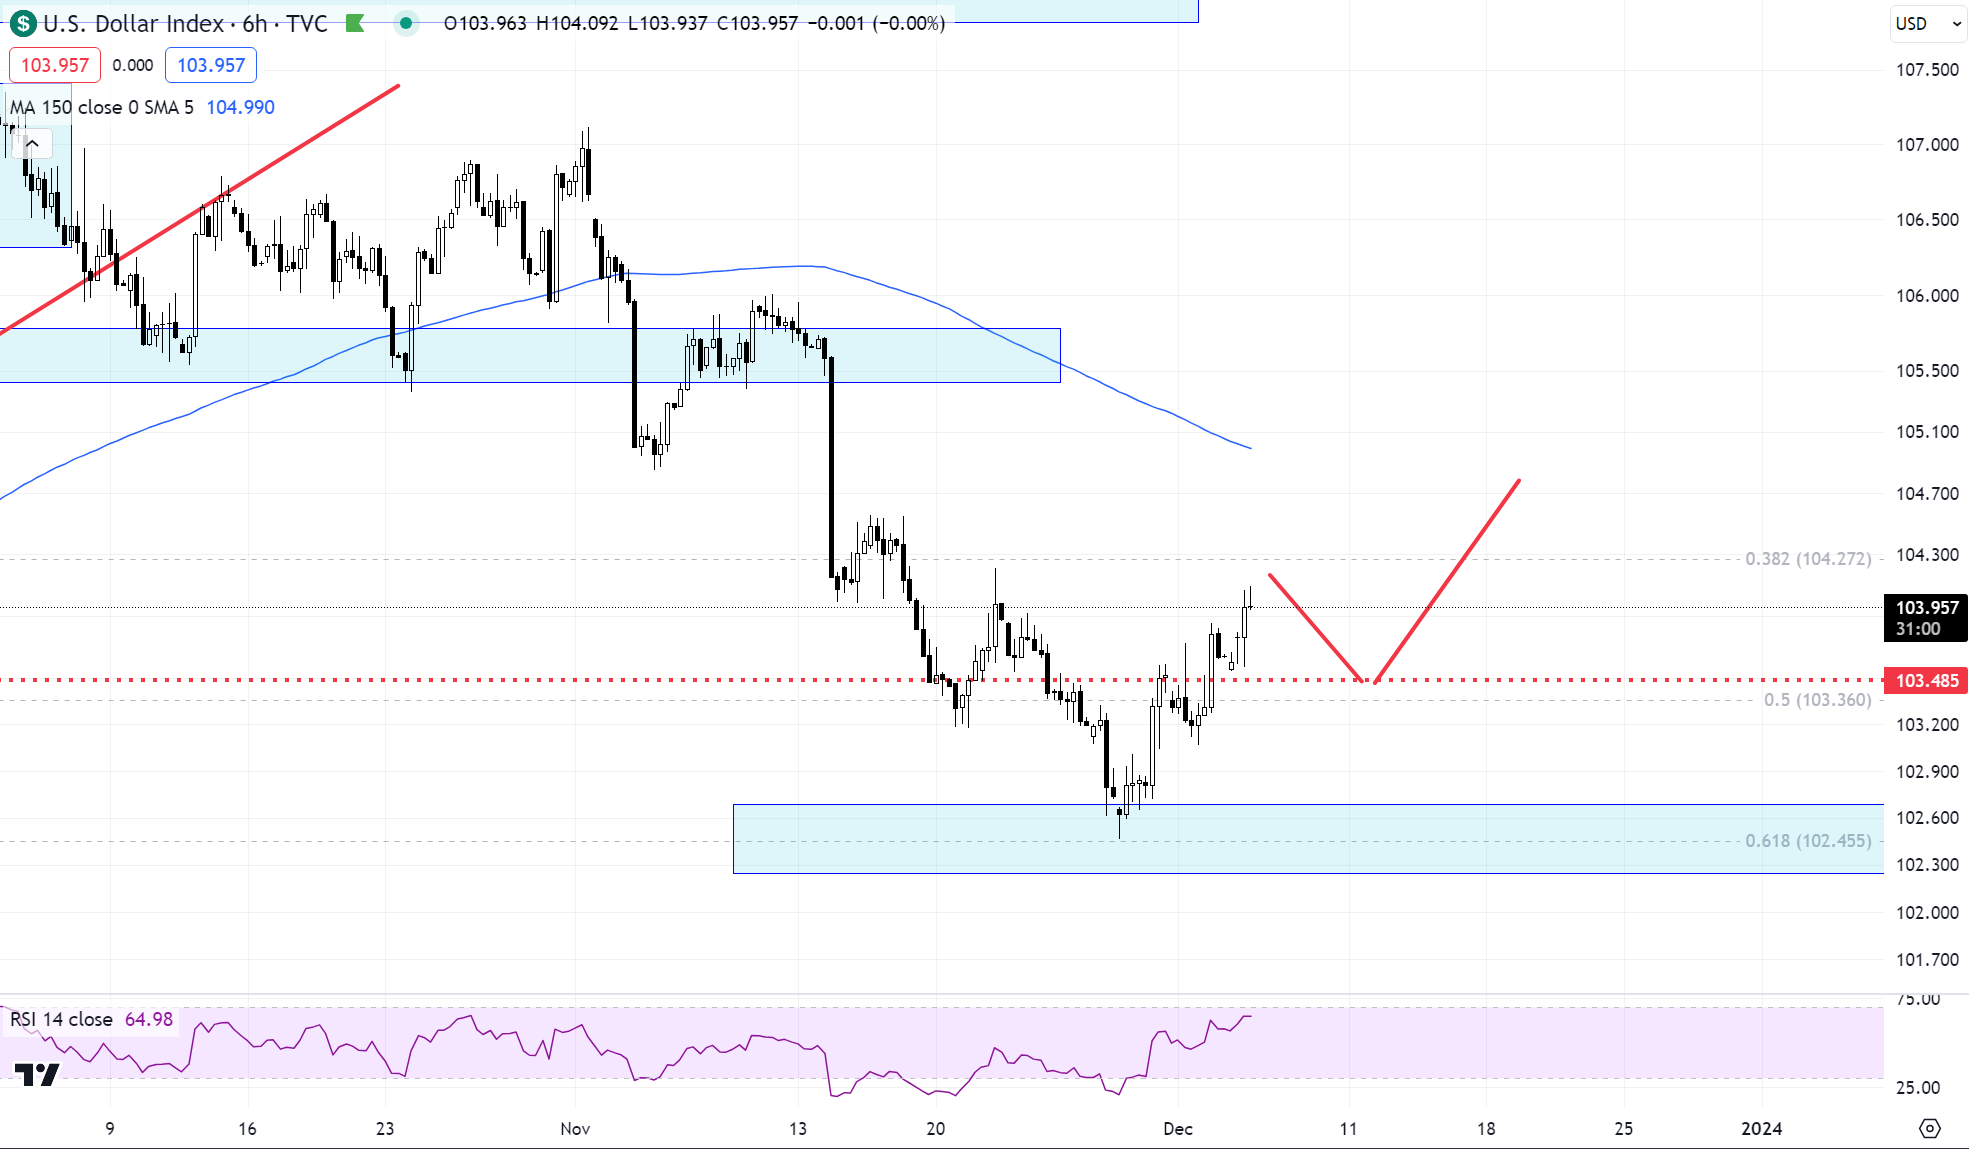
Not sure what’s cooking here but yields and the dollar have at least a temporary break in the correlation. What I do notice is yields nearing 4.15% and no excited reaction from the equity markets. Are they sniffing lower rates suggest economic trouble? I won’t get into a macro discussion here, will leave that to brighter minds. If stocks were not able to rally with yields dropping lately, what will it happen if yields have a jump higher? Something tells me, no good things.
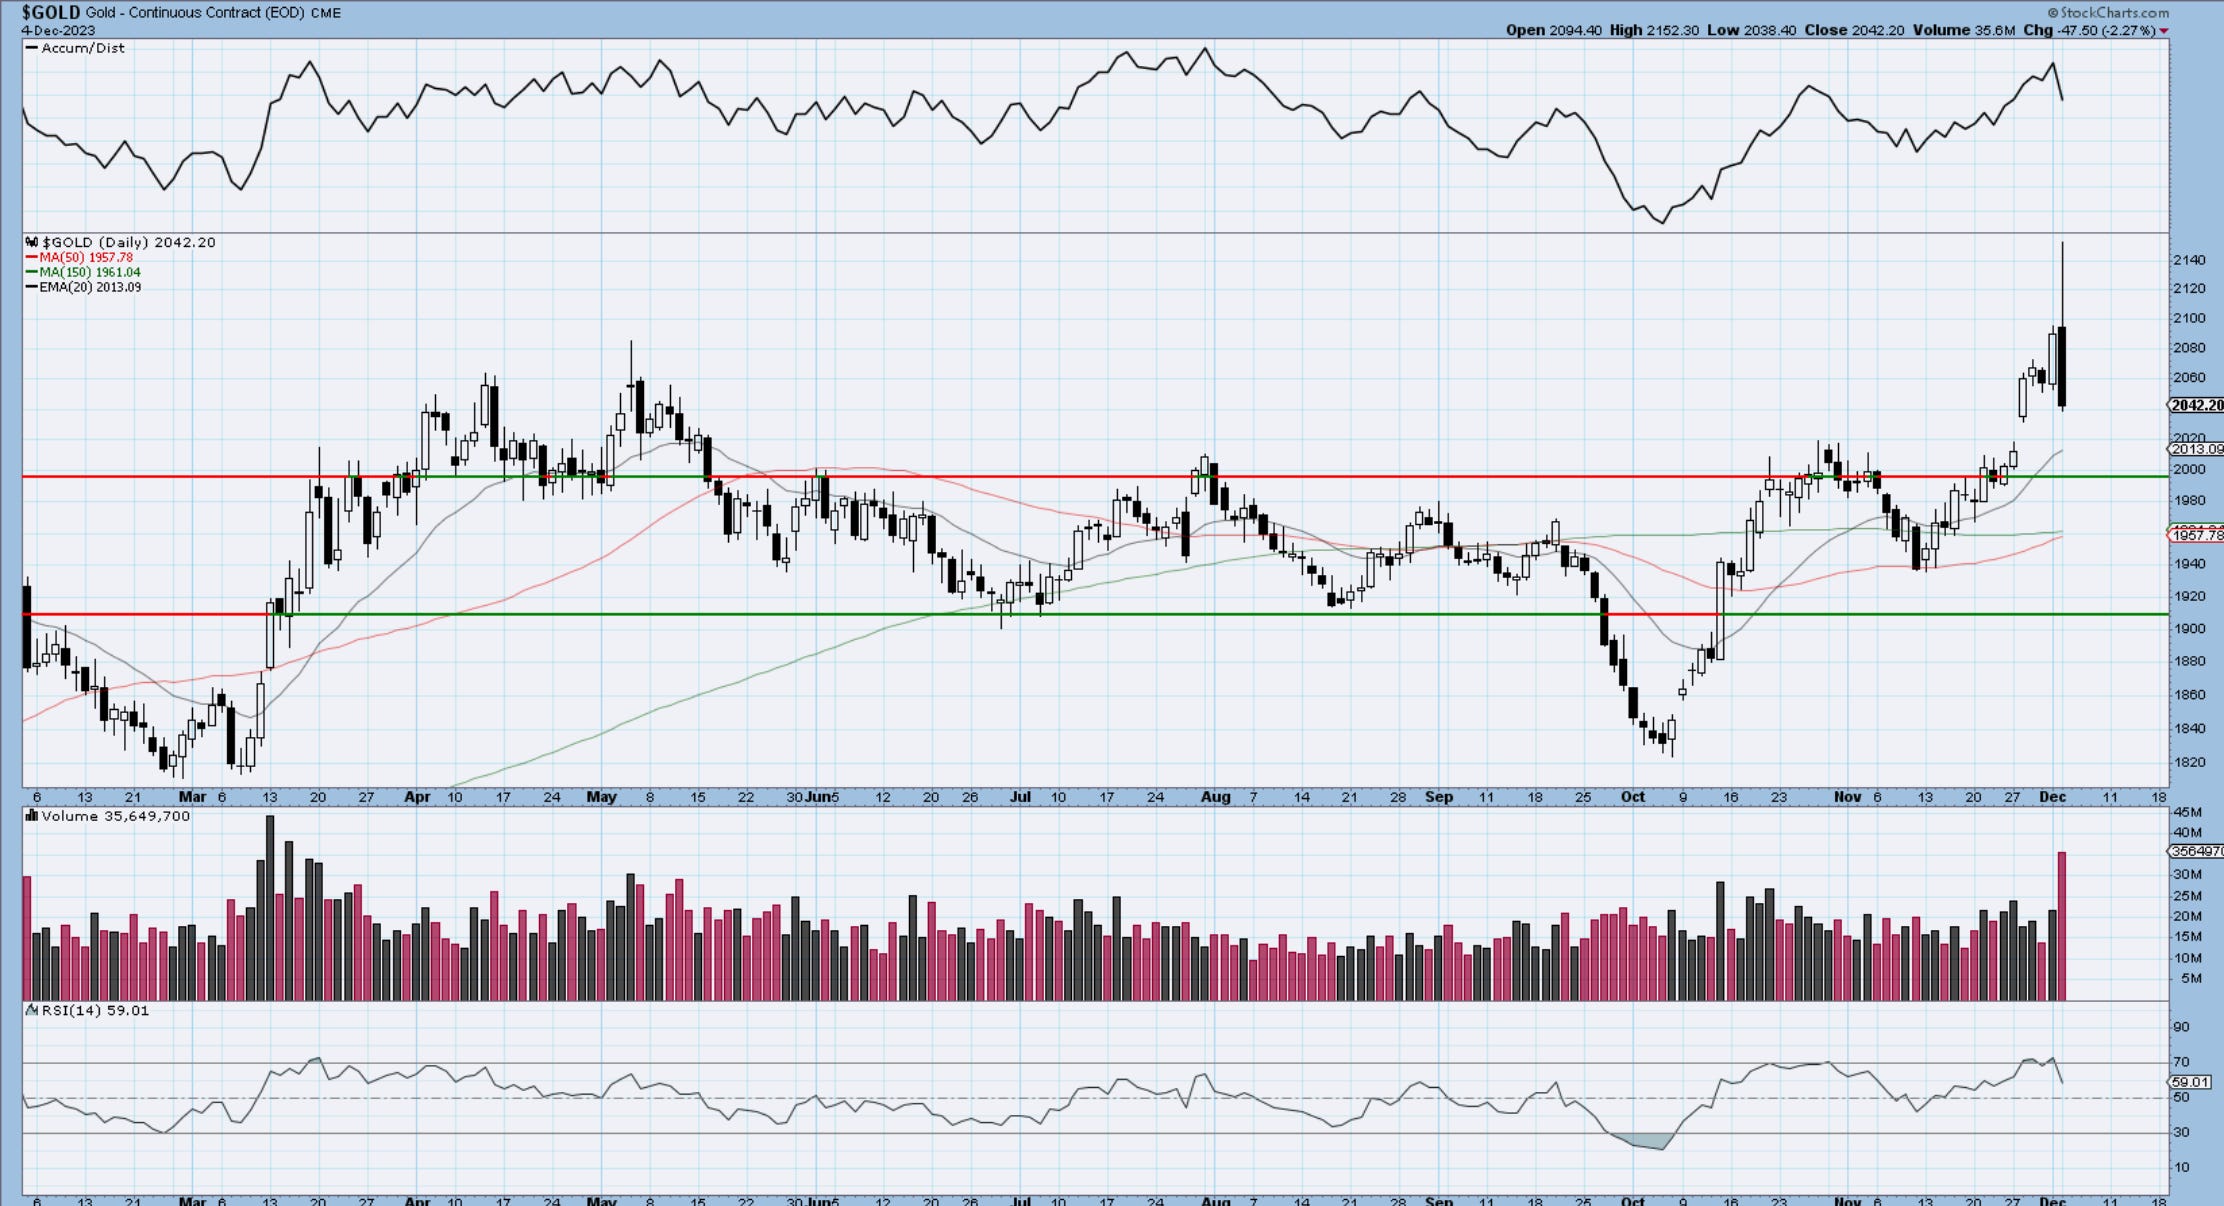
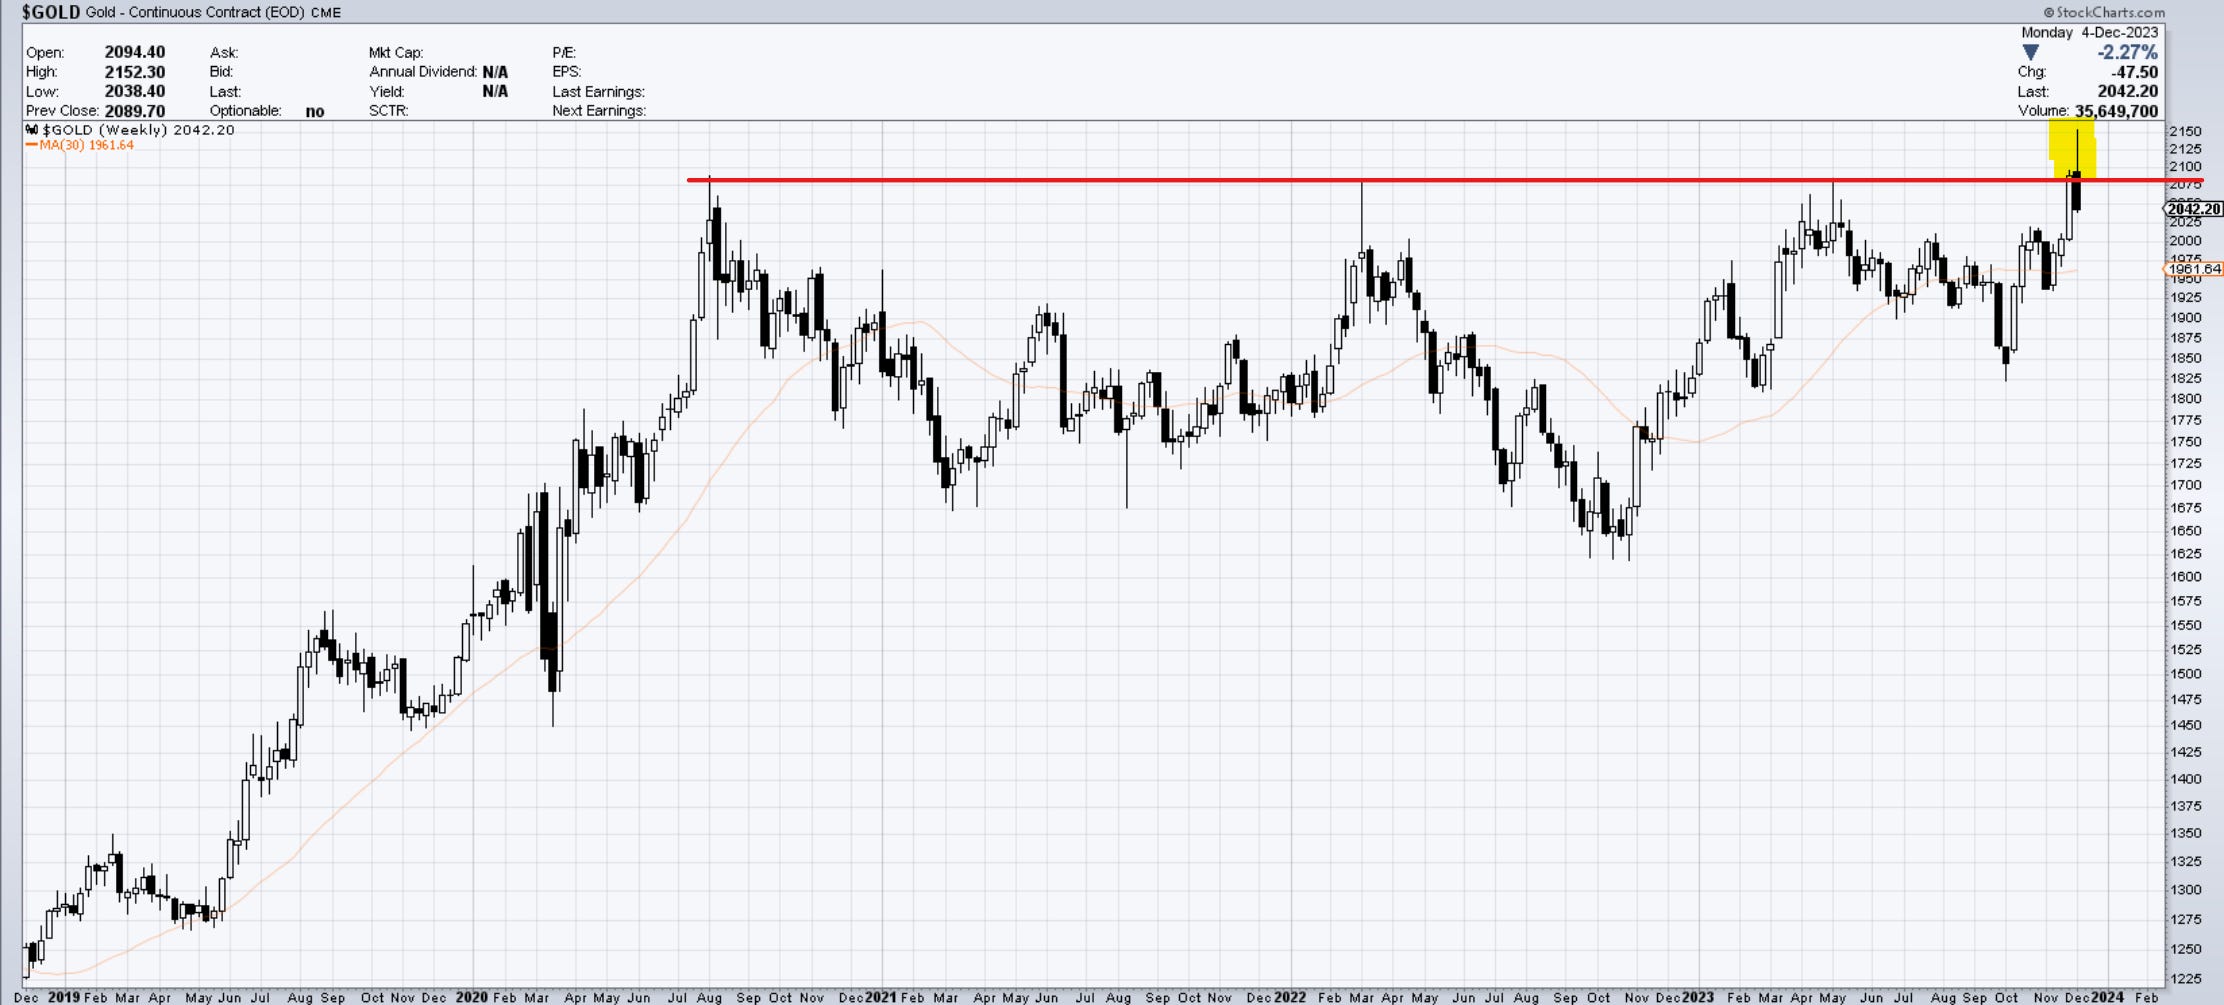
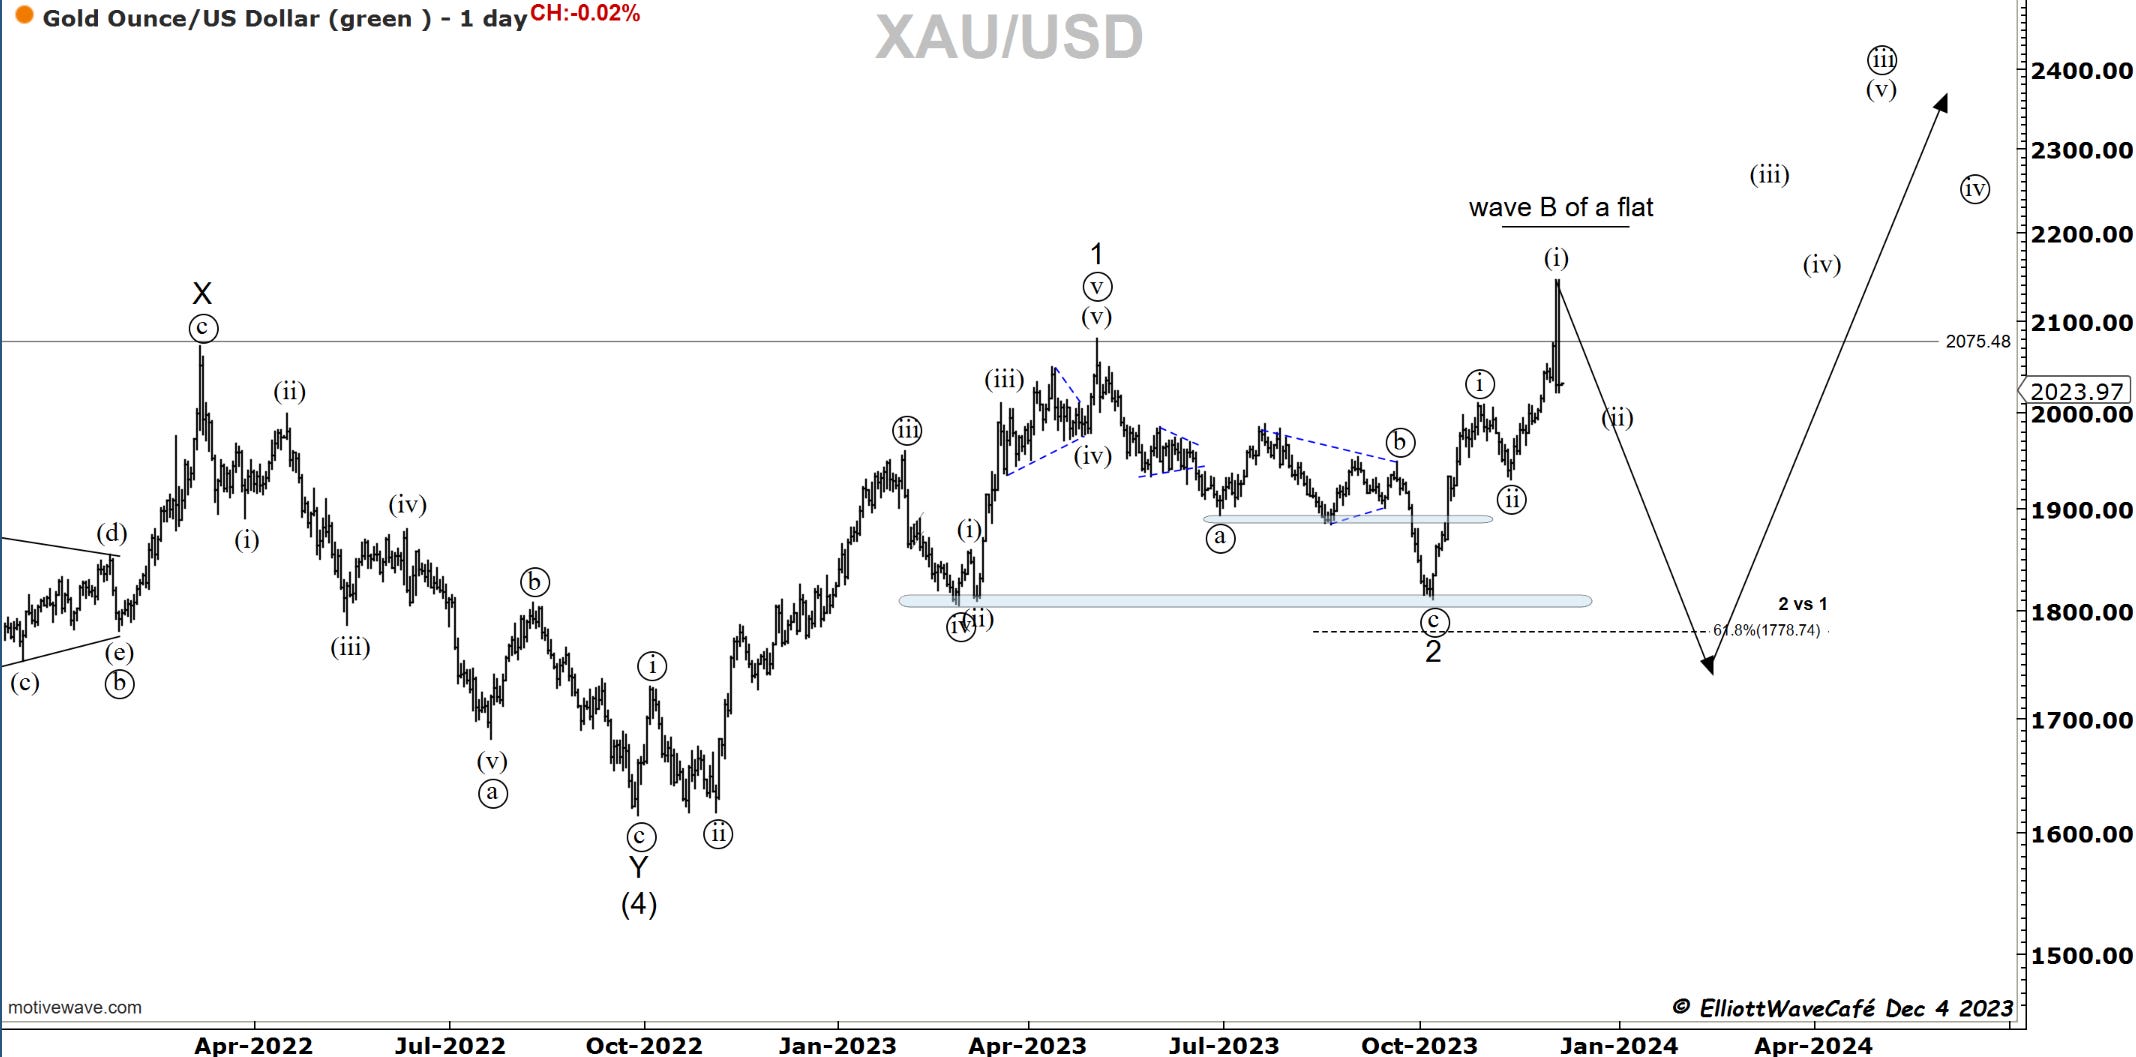
Gold
Prior comments in Gold remain. - no matter how gold bulls want to spin this, the behavior here is not positive. Nothing else but a hugely disappointing failed breakout. Will revisit if anything changes. I want to see what they do if she manages to rally for a bit back to 2075.
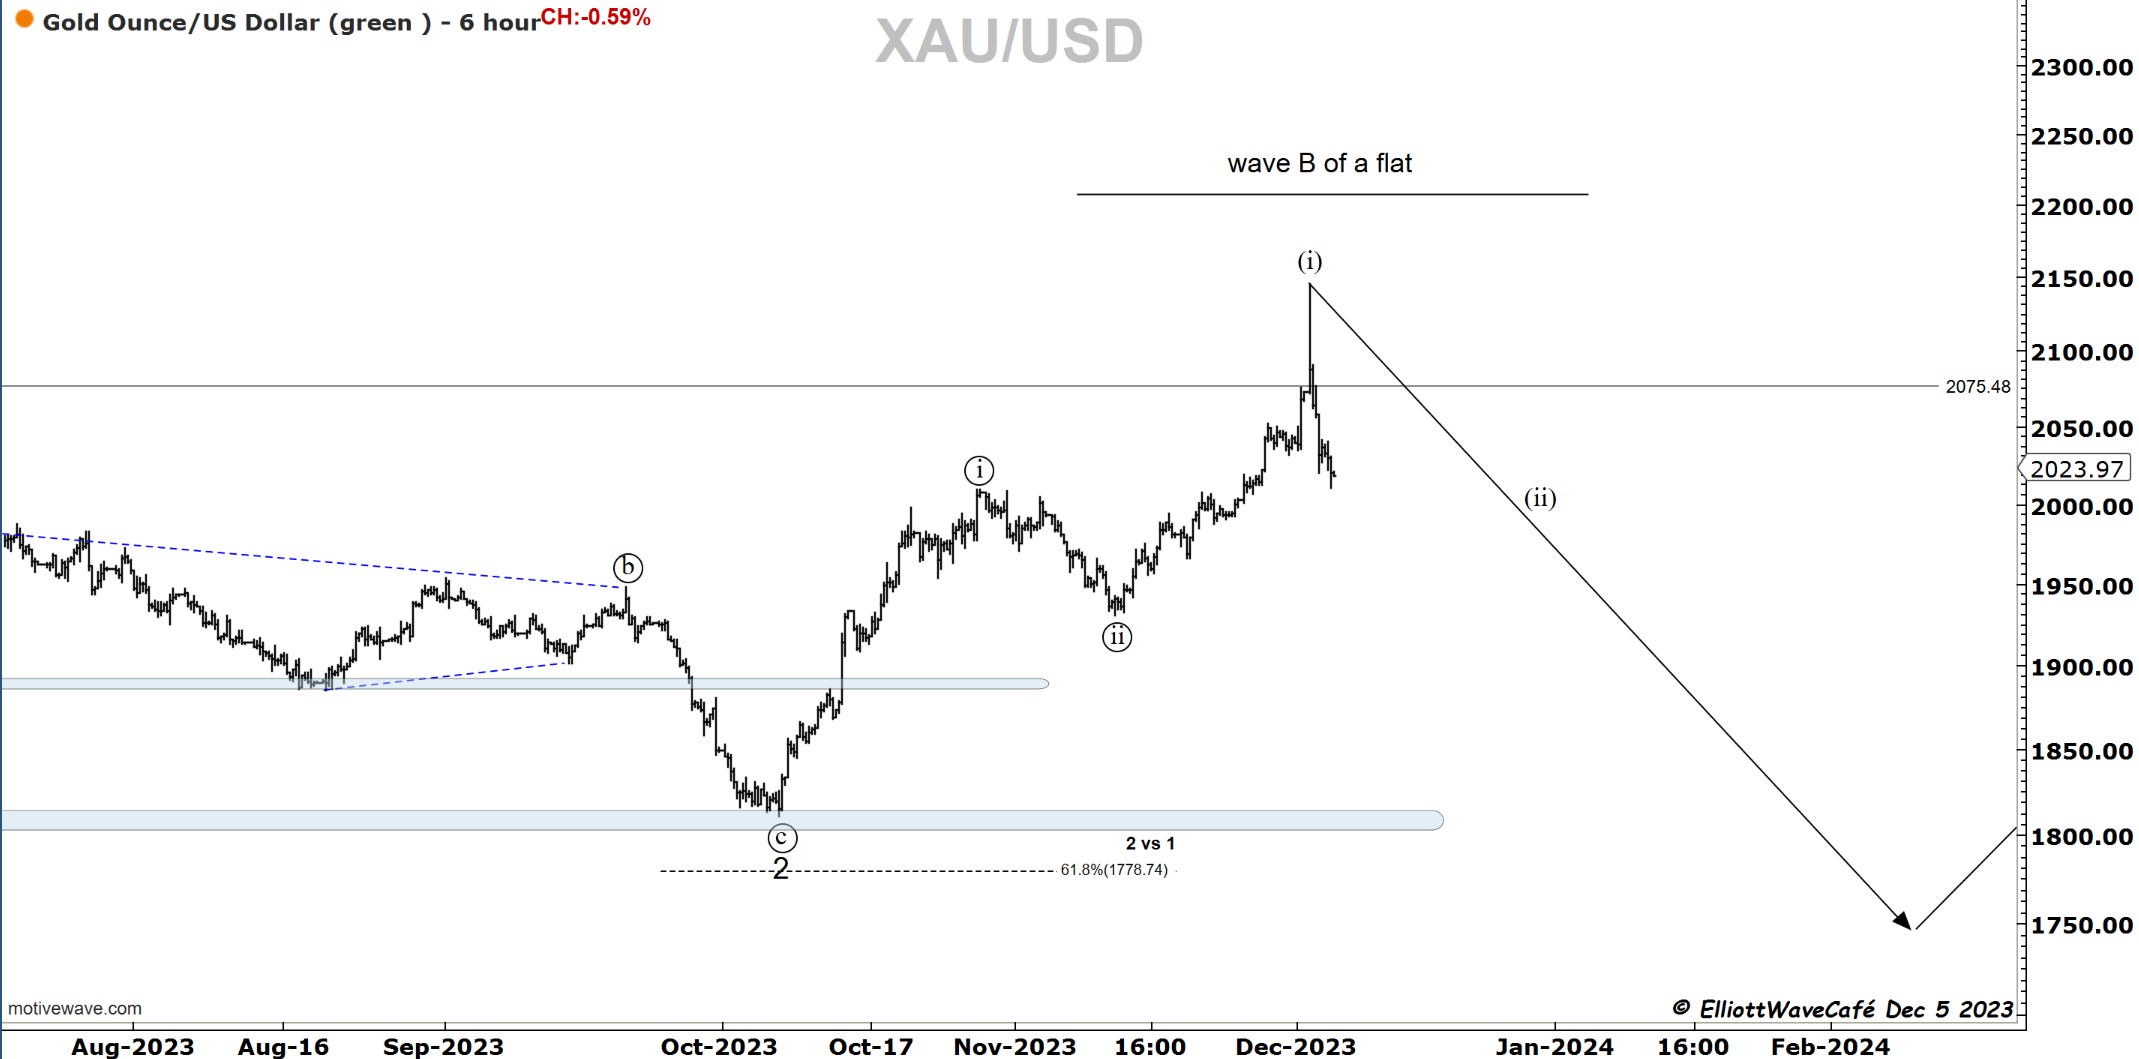
That’s one ugly failure in Gold. Just as I was saying above, when two assets don’t talk to each other the results can be disturbing. It’s the type of reaction that maybe is meant to scare traders before we actually resume higher. Imagine being long and seeing that rejection. If it can stabilize and bounce, then maybe it was nothing else then an isolated event. What gold bulls don’t want to see here, is further selling and metal moving below 2000. If that happens it will explain that there are still many trapped longs above 2100 and can accelerate even below 1850 in the months to come. Will keep an eye on its behavior.
Here is the wave B of a flat scenario. If we hold as a (ii) that’s great news for longs.
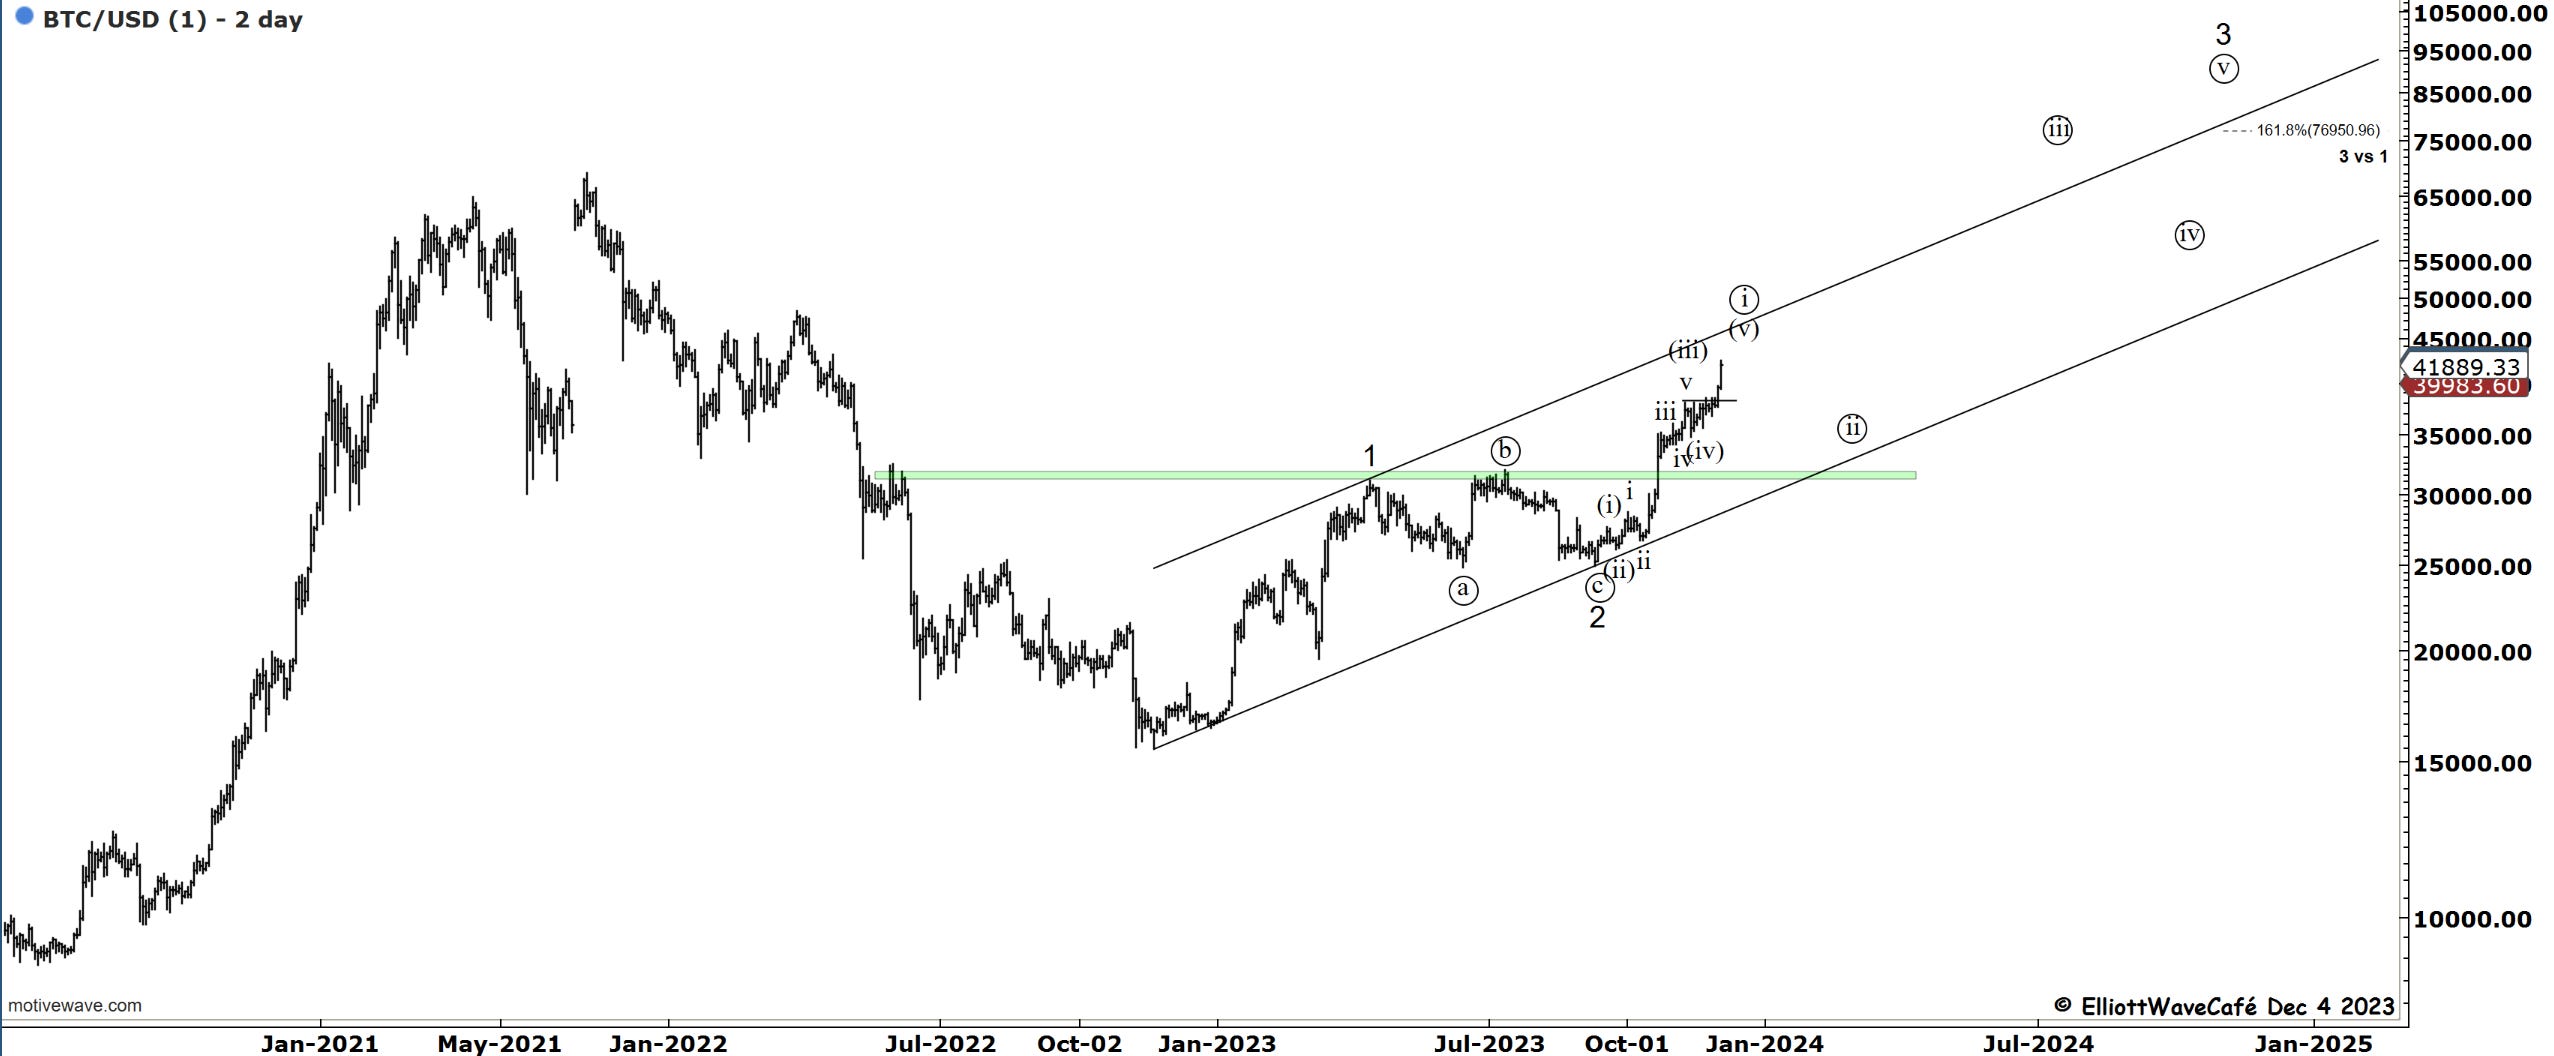
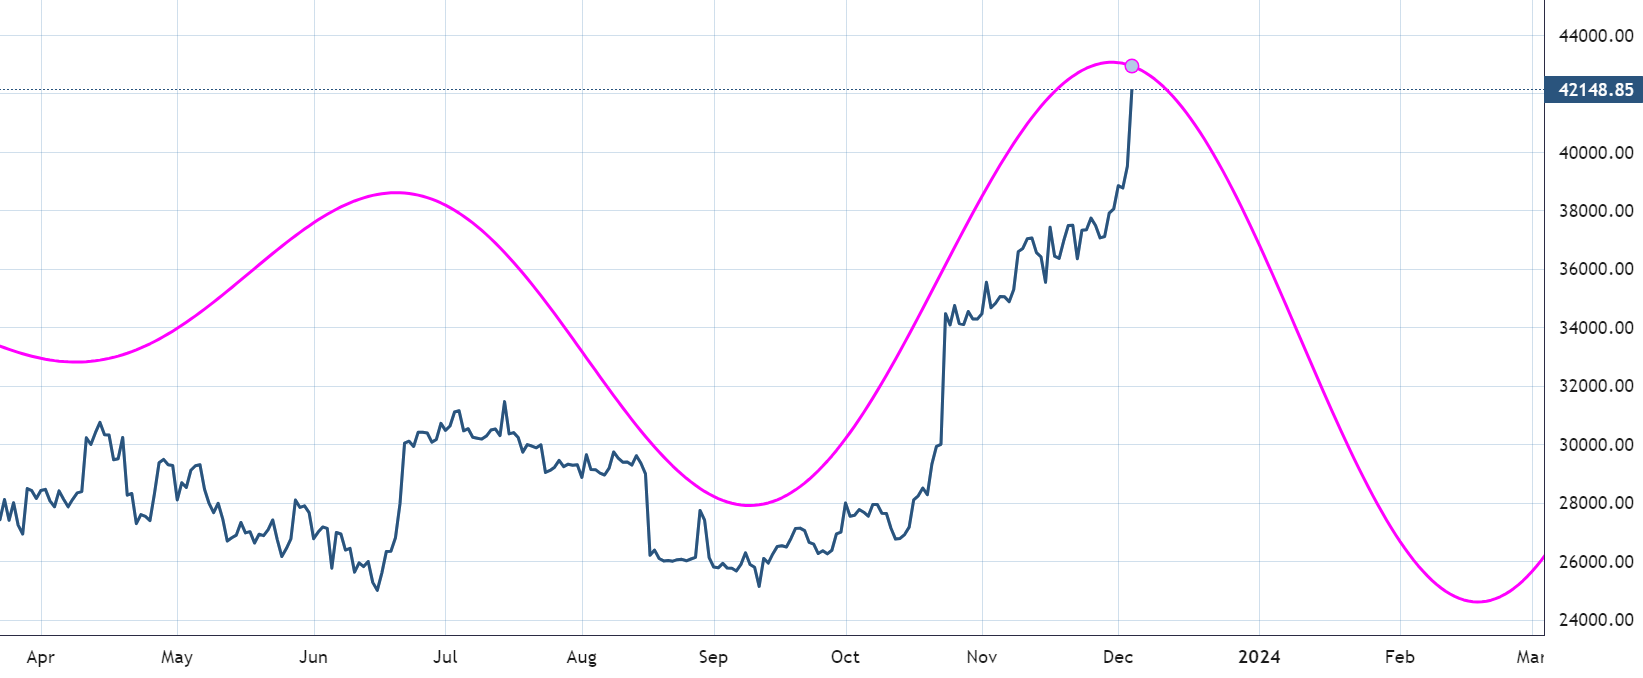
Bitcoin
Bitcoin has gotten to the top of that channel quite fast. Technical analysis of channels tells us this is a place where usually markets stop, pause, and retreat. There could be a couple of smaller degree subdivisions still forming along with the higher degree completing the sequence, but overall one must be very careful here not to be overrun with excitement. As I said on Thursday last week, the path to 47k does not have much resistance in the way. On the second chart, that level is obvious. So is a beautiful third-wave type price action. Tighten the stops and ring registers on the way up, rather than on the way down.
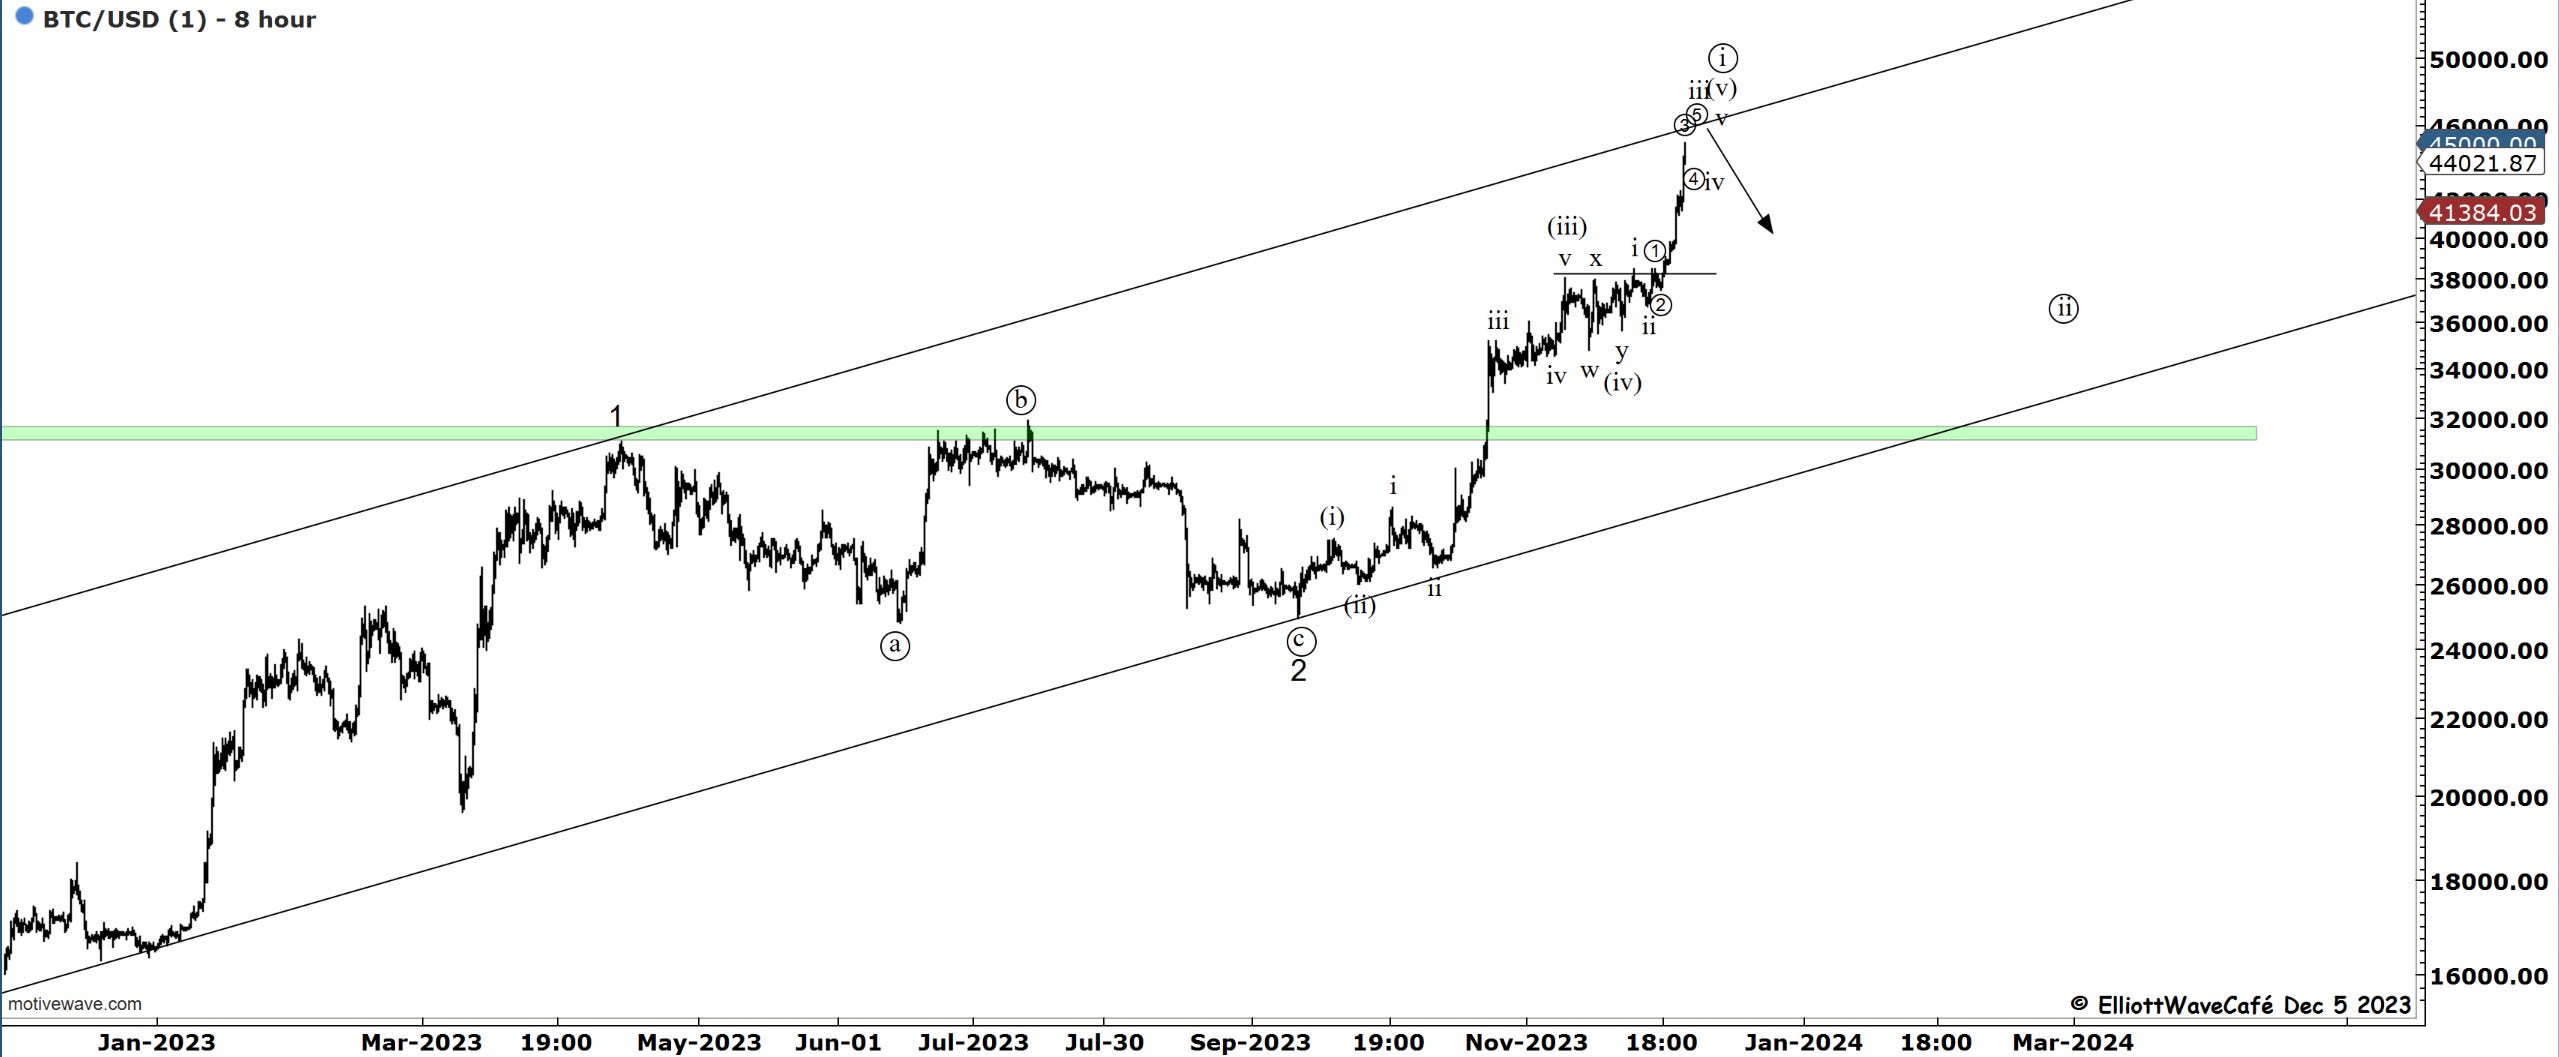
This BTC cycle is still in the back of my mind. It might just start after the top of the trending channel is hit above. I would tighten stops and take partial profits if that fits your trading strategy.
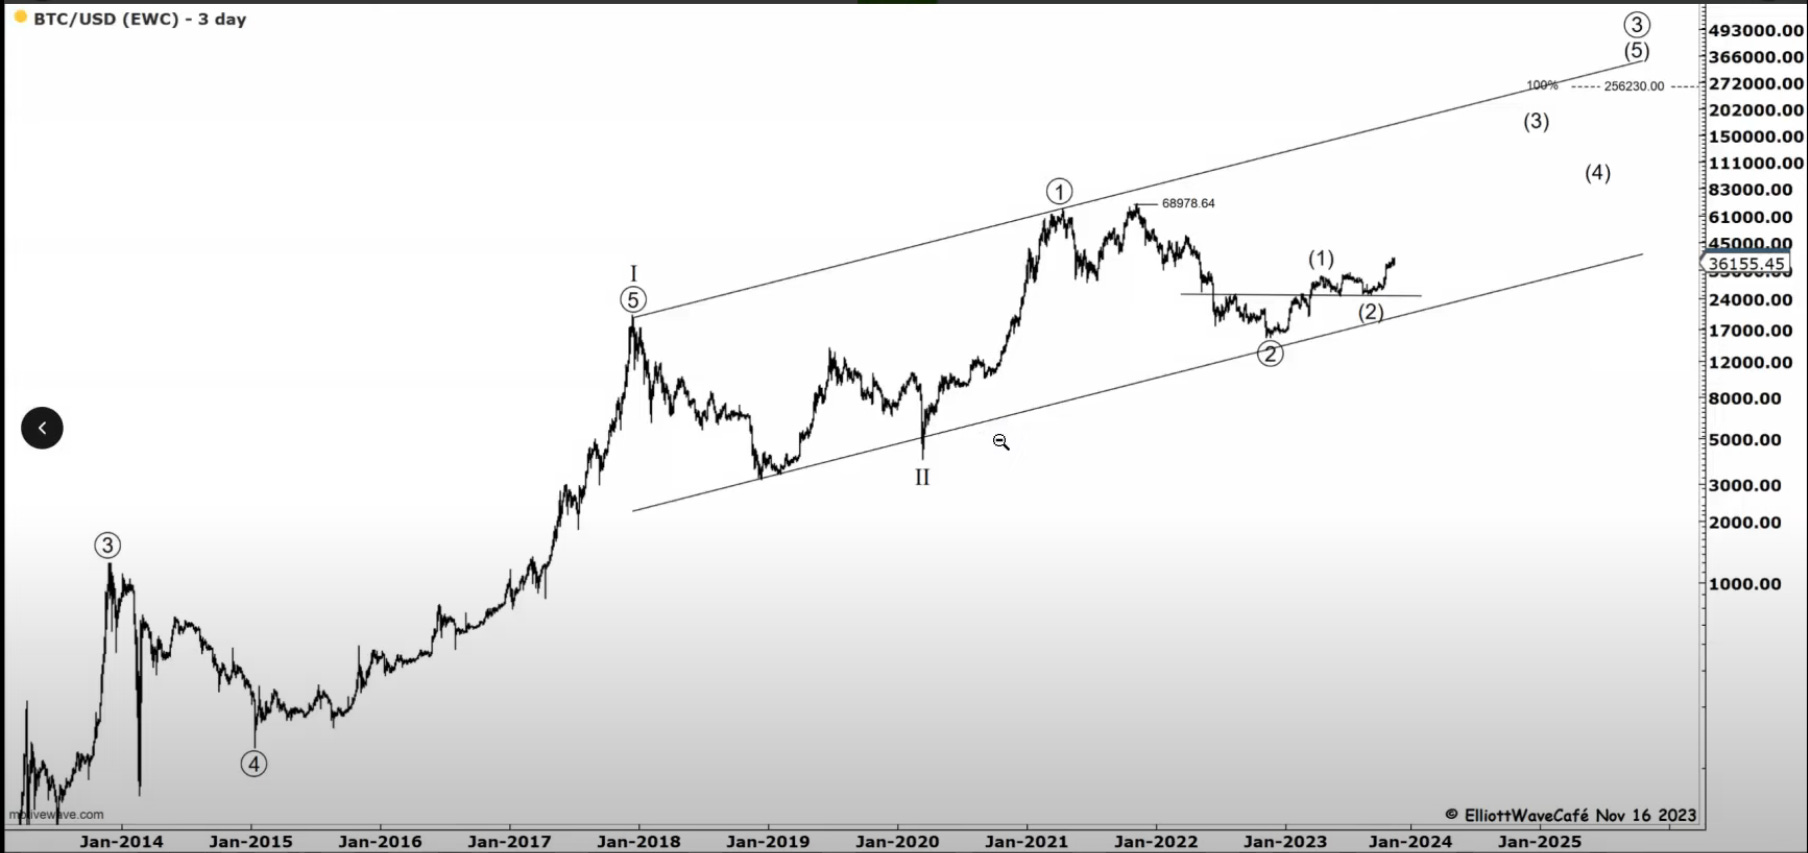
The much larger count can be found here. Presented this on Nov 16th note.
Daily video coming up next,
Have a great day wherever you are! - trade well, and don’t forget to subscribe and drop a like if this letter helps you in any way.
Cris
email: ewcafe@pm.me