
The Daily Drip
Core markets charts updates and commentary
Note: The counts on the right edge are real-time, and they are prone to adjustments as price action develops. Elliott Wave has a fluid approach, is evidence-based, and requires constant monitoring of certain thresholds.
In the counts below, this (( )) = circle on chart
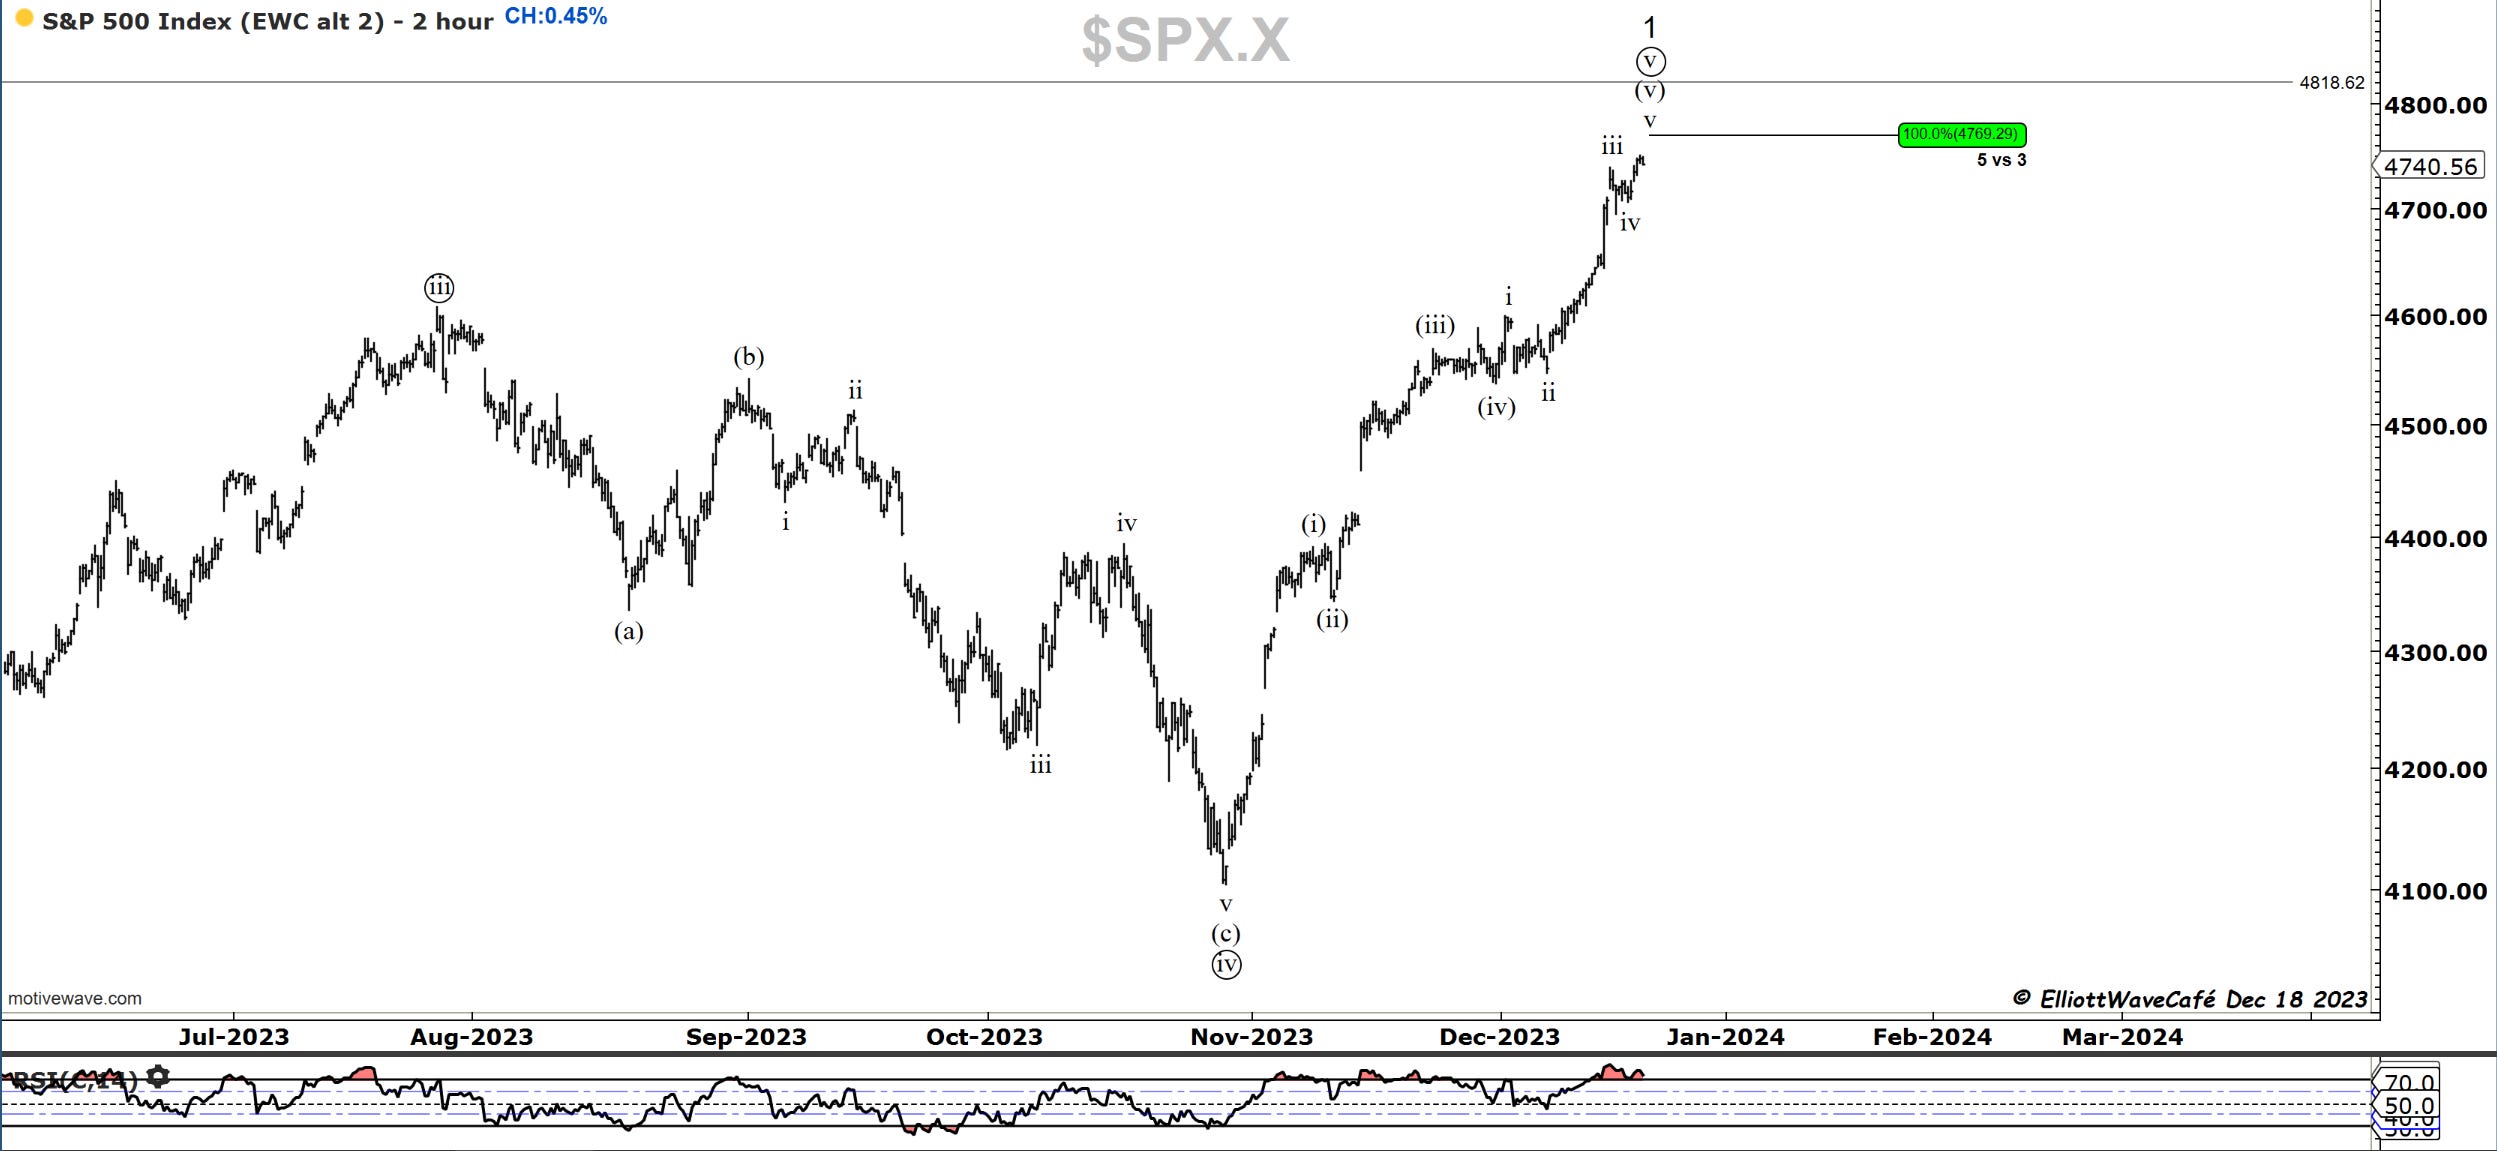
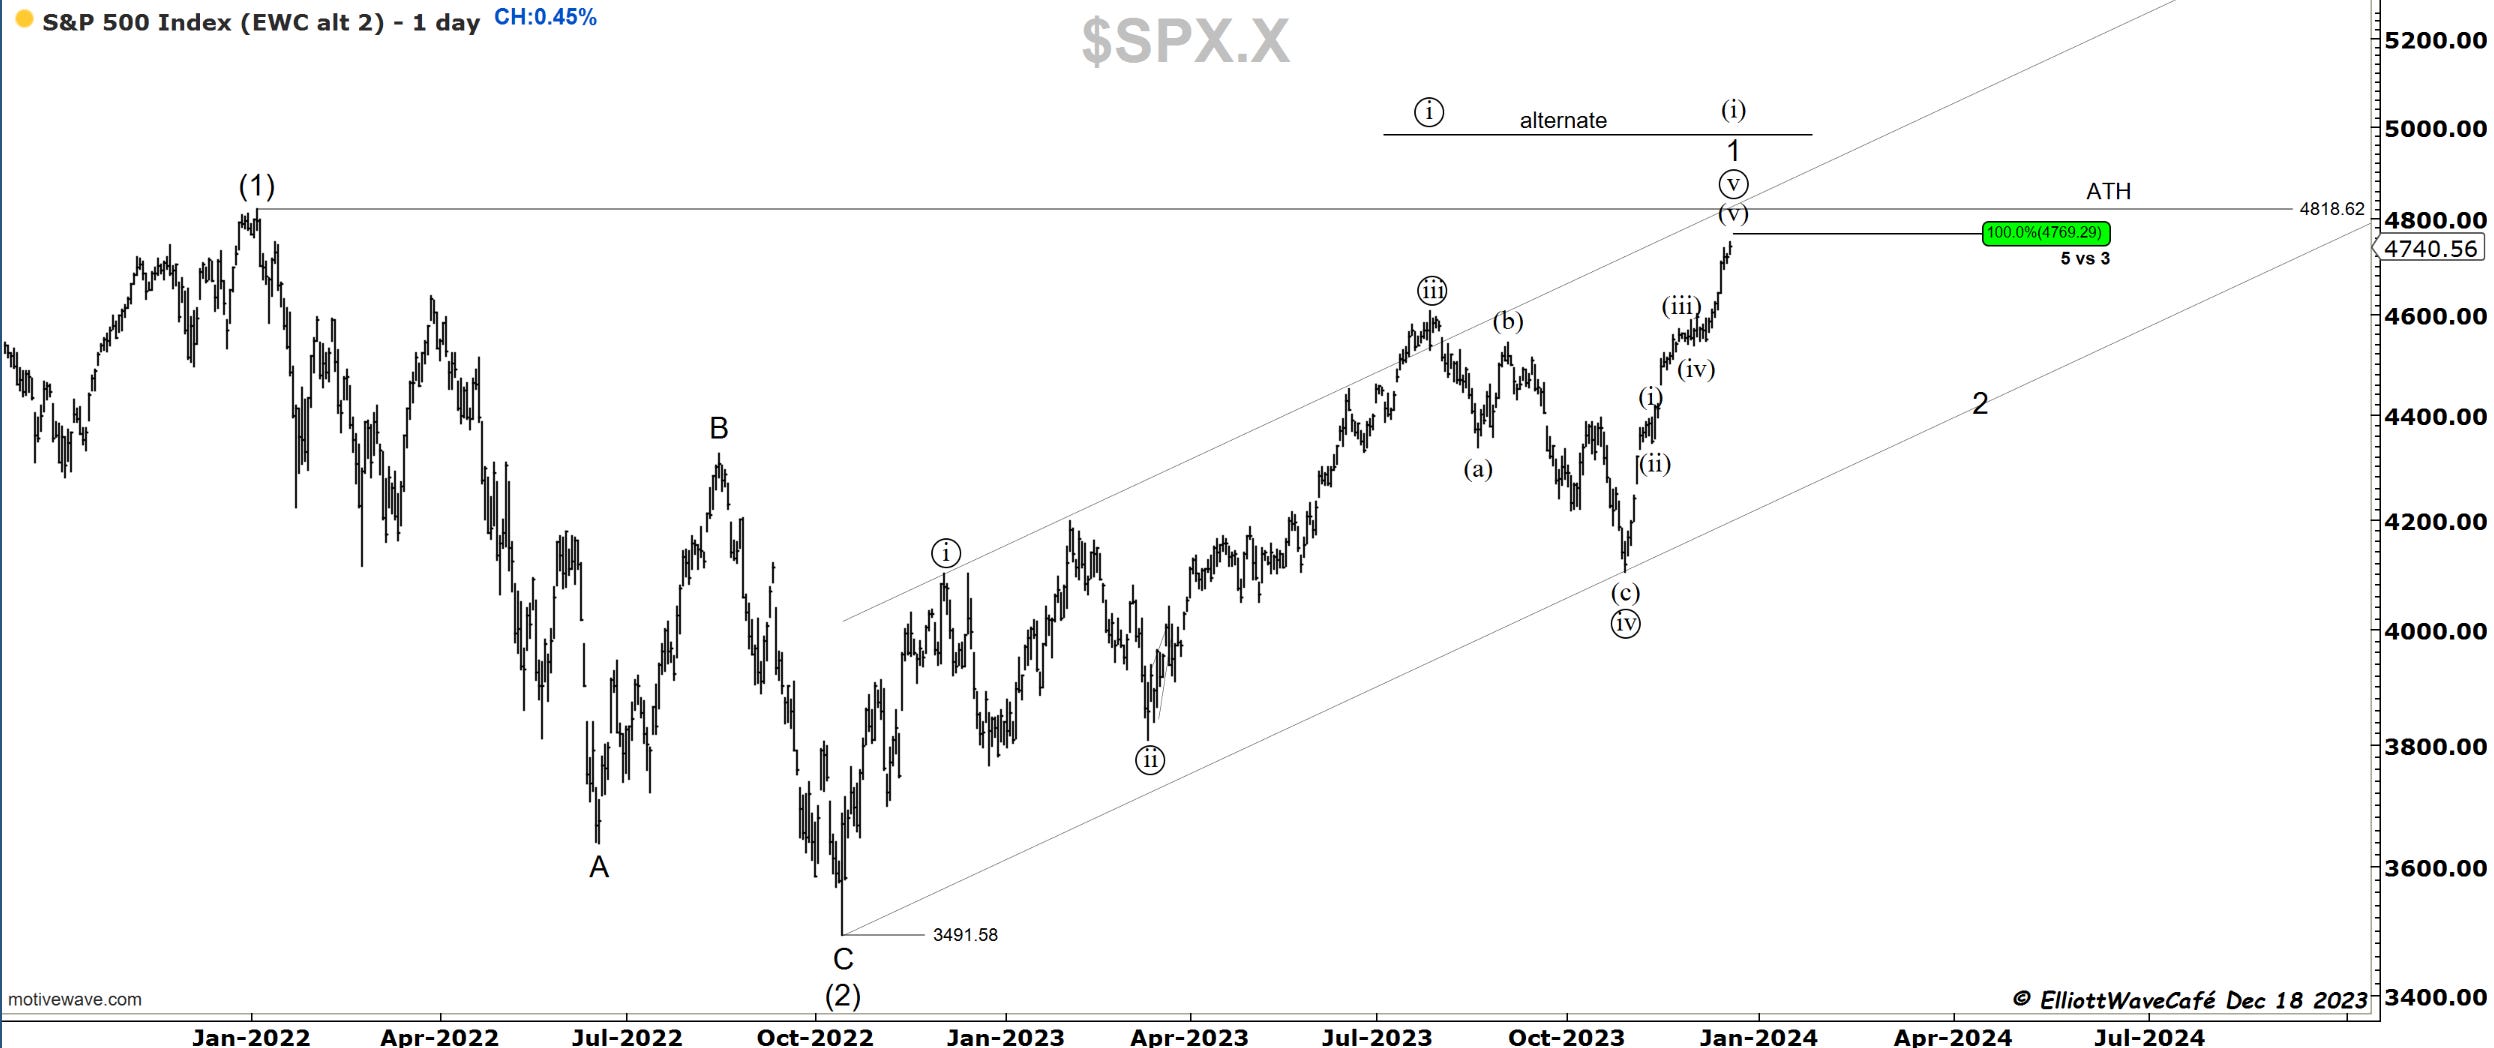
SP500
Hello, everyone, and welcome to another week of market coverage in EWCafe.
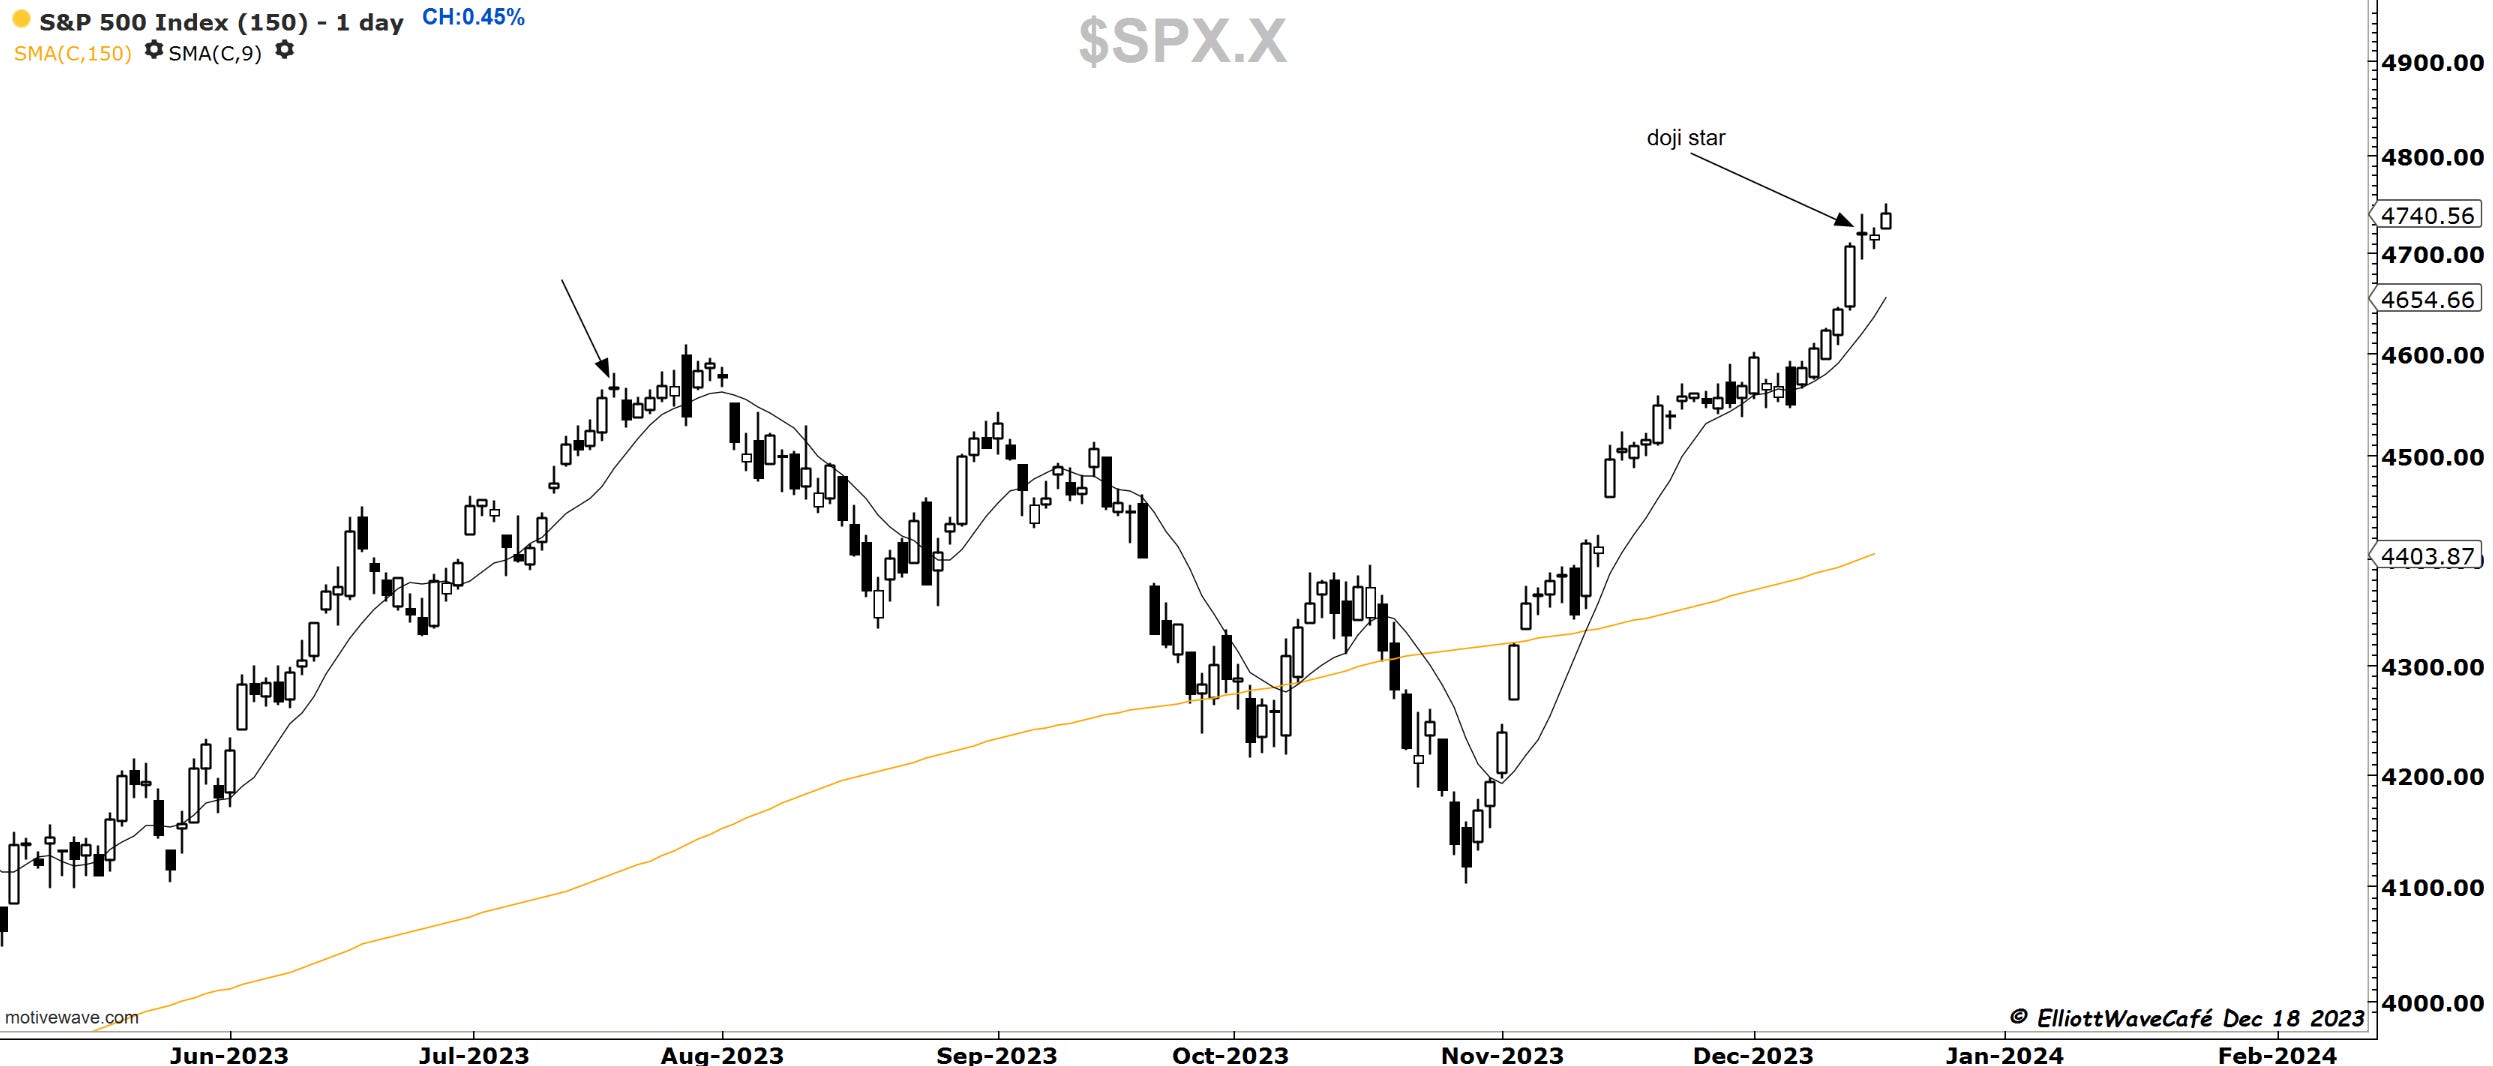
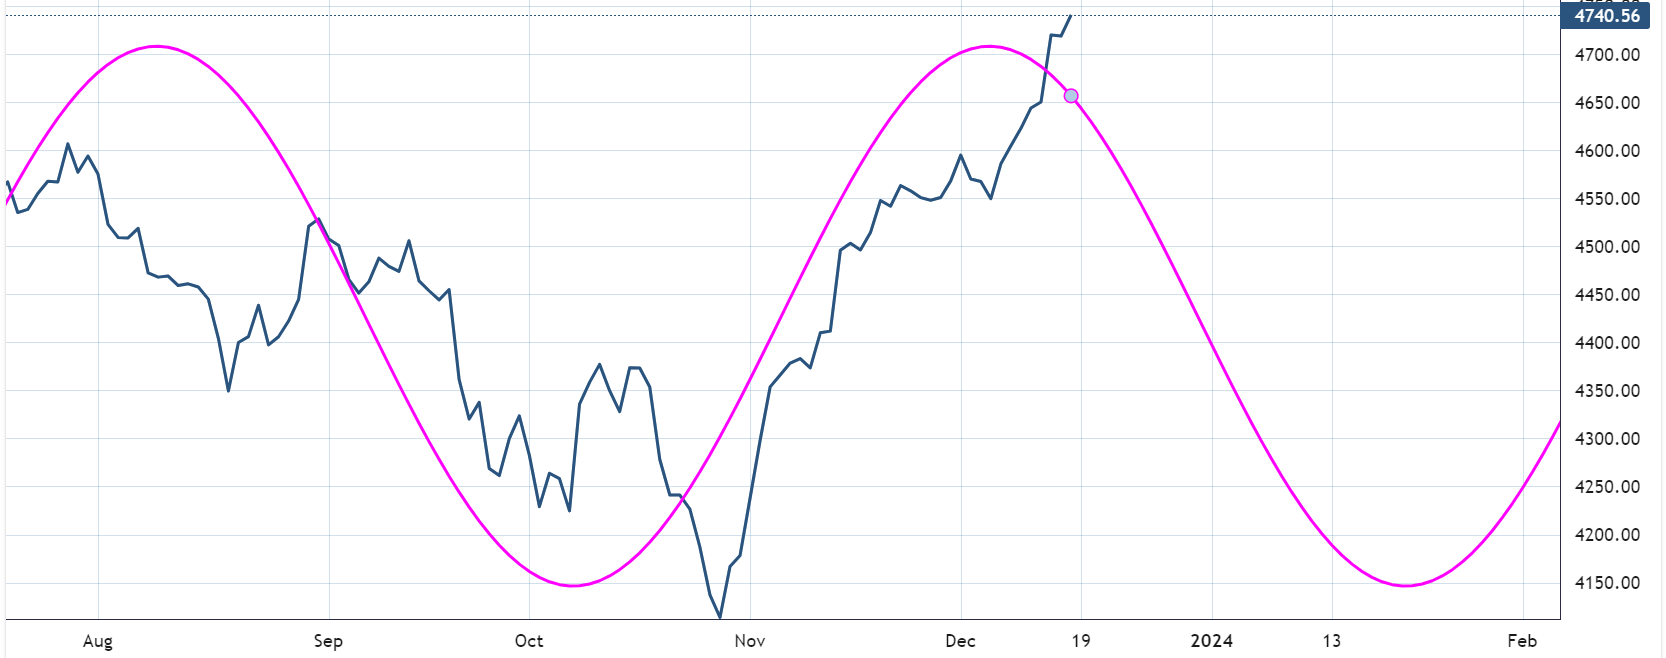
The market managed to stage another slight rally to a marginal new high after spending the last couple of days from the last week consolidating. The behavior here displays a bit of exhaustion, but we have yet to see any significant signs from price that a correction has started. I would like to see a break below that wave iv low and a close below the 9day ma. The doji displayed Thursday was never really followed by selling, but its importance remains that of a more indecisive market at current levels. Current 80day market cycles cautions towards a period of upcoming weakness into Feb next year.
Nasdaq100
Today, we have gotten the additional push higher discussed last week. We are now within inches of a new ATH in the Nasdaq 100. The high in Nov 2021 was 16,764.85, and today, two years later, it was 16,764.32. This move from early Dec is a wave (v) showing a near-completed structure. It has to be confirmed by price with a drop back below 16,400.
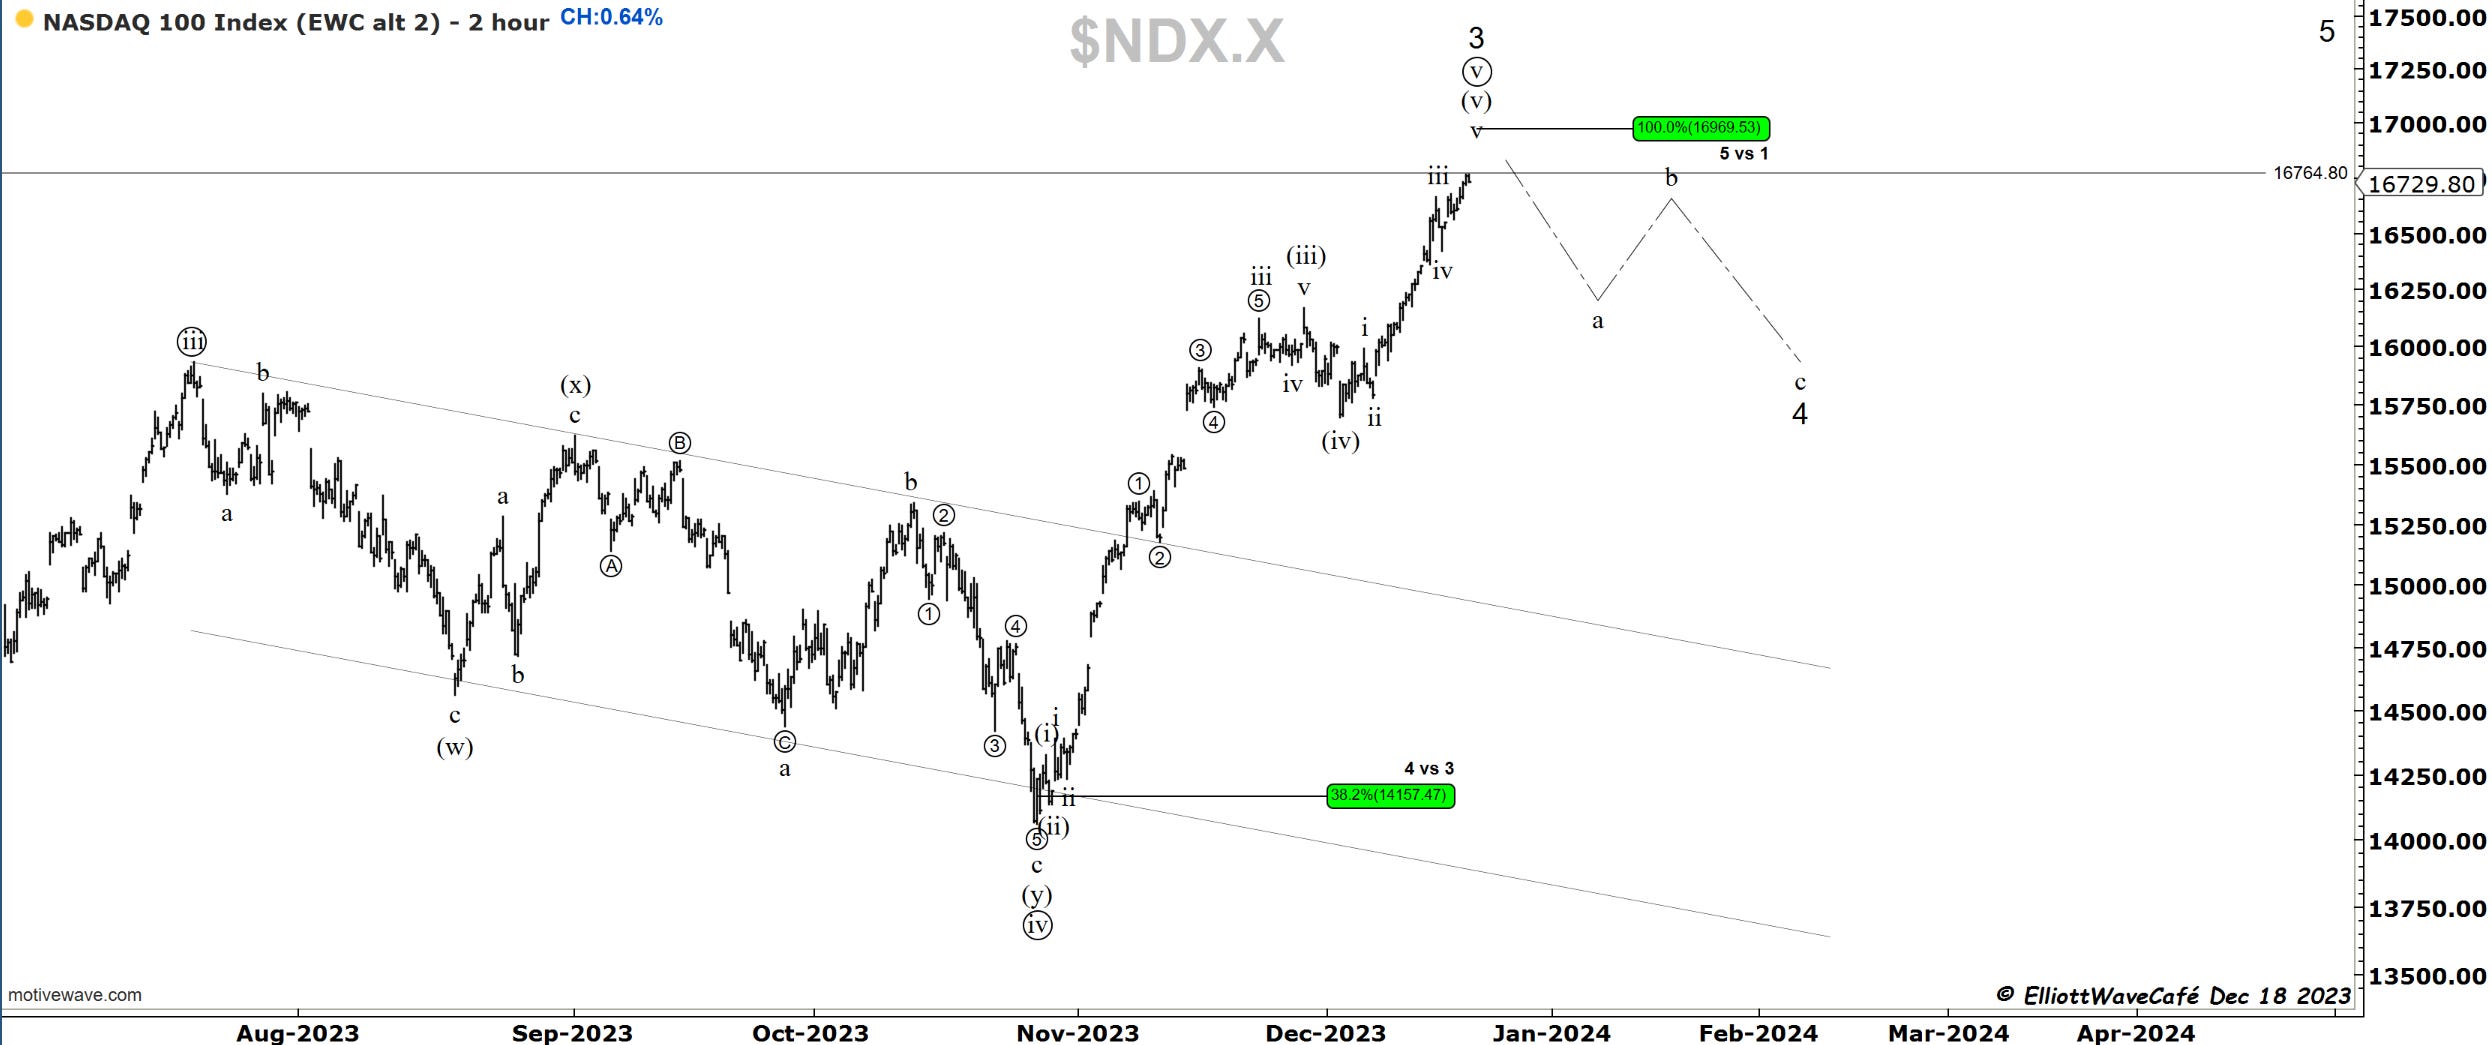
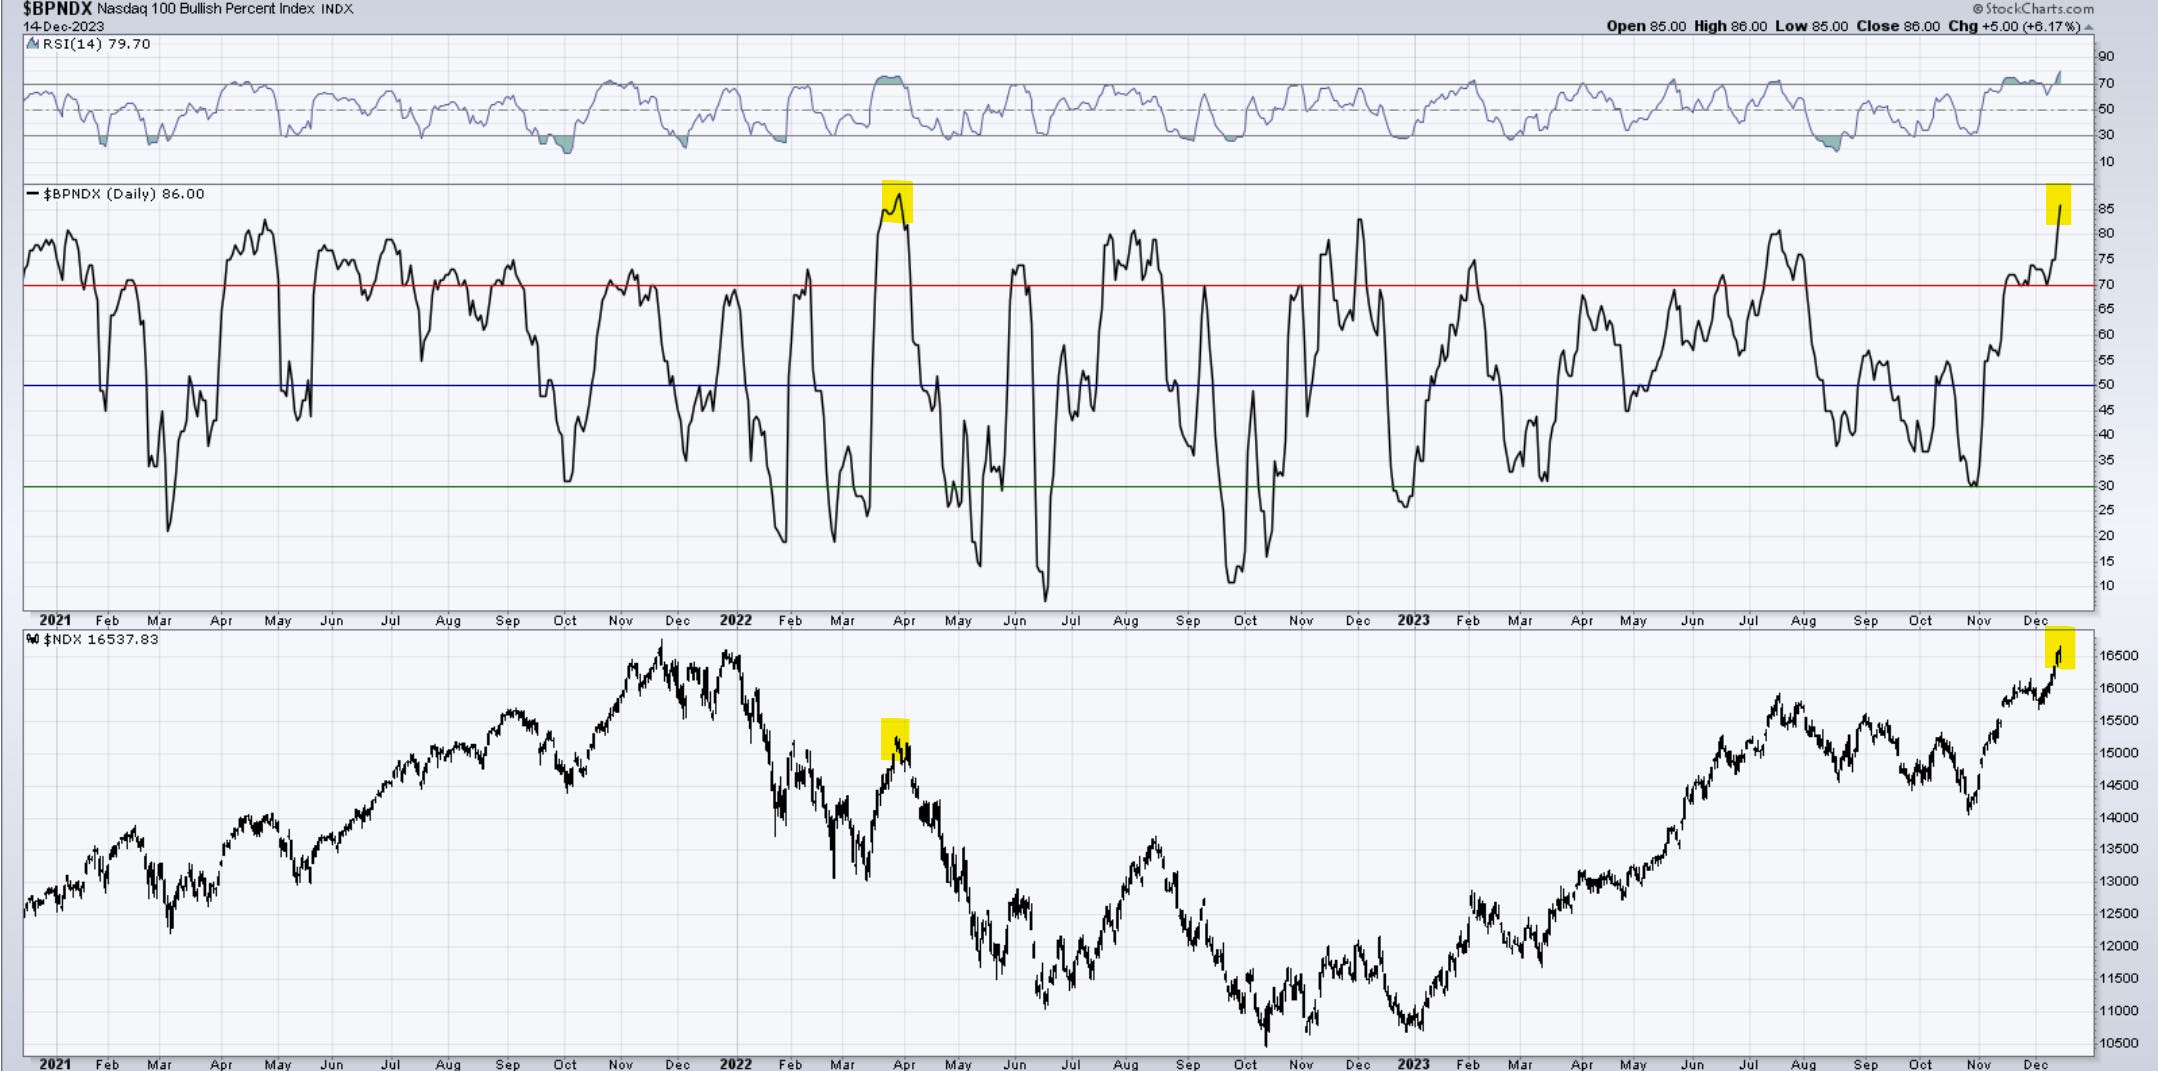
This is now quite a stretch. Check out the BPI in a territory that we have not seen since March 2022. I don’t think this is sustainable, and I would be on high alert for reversals.
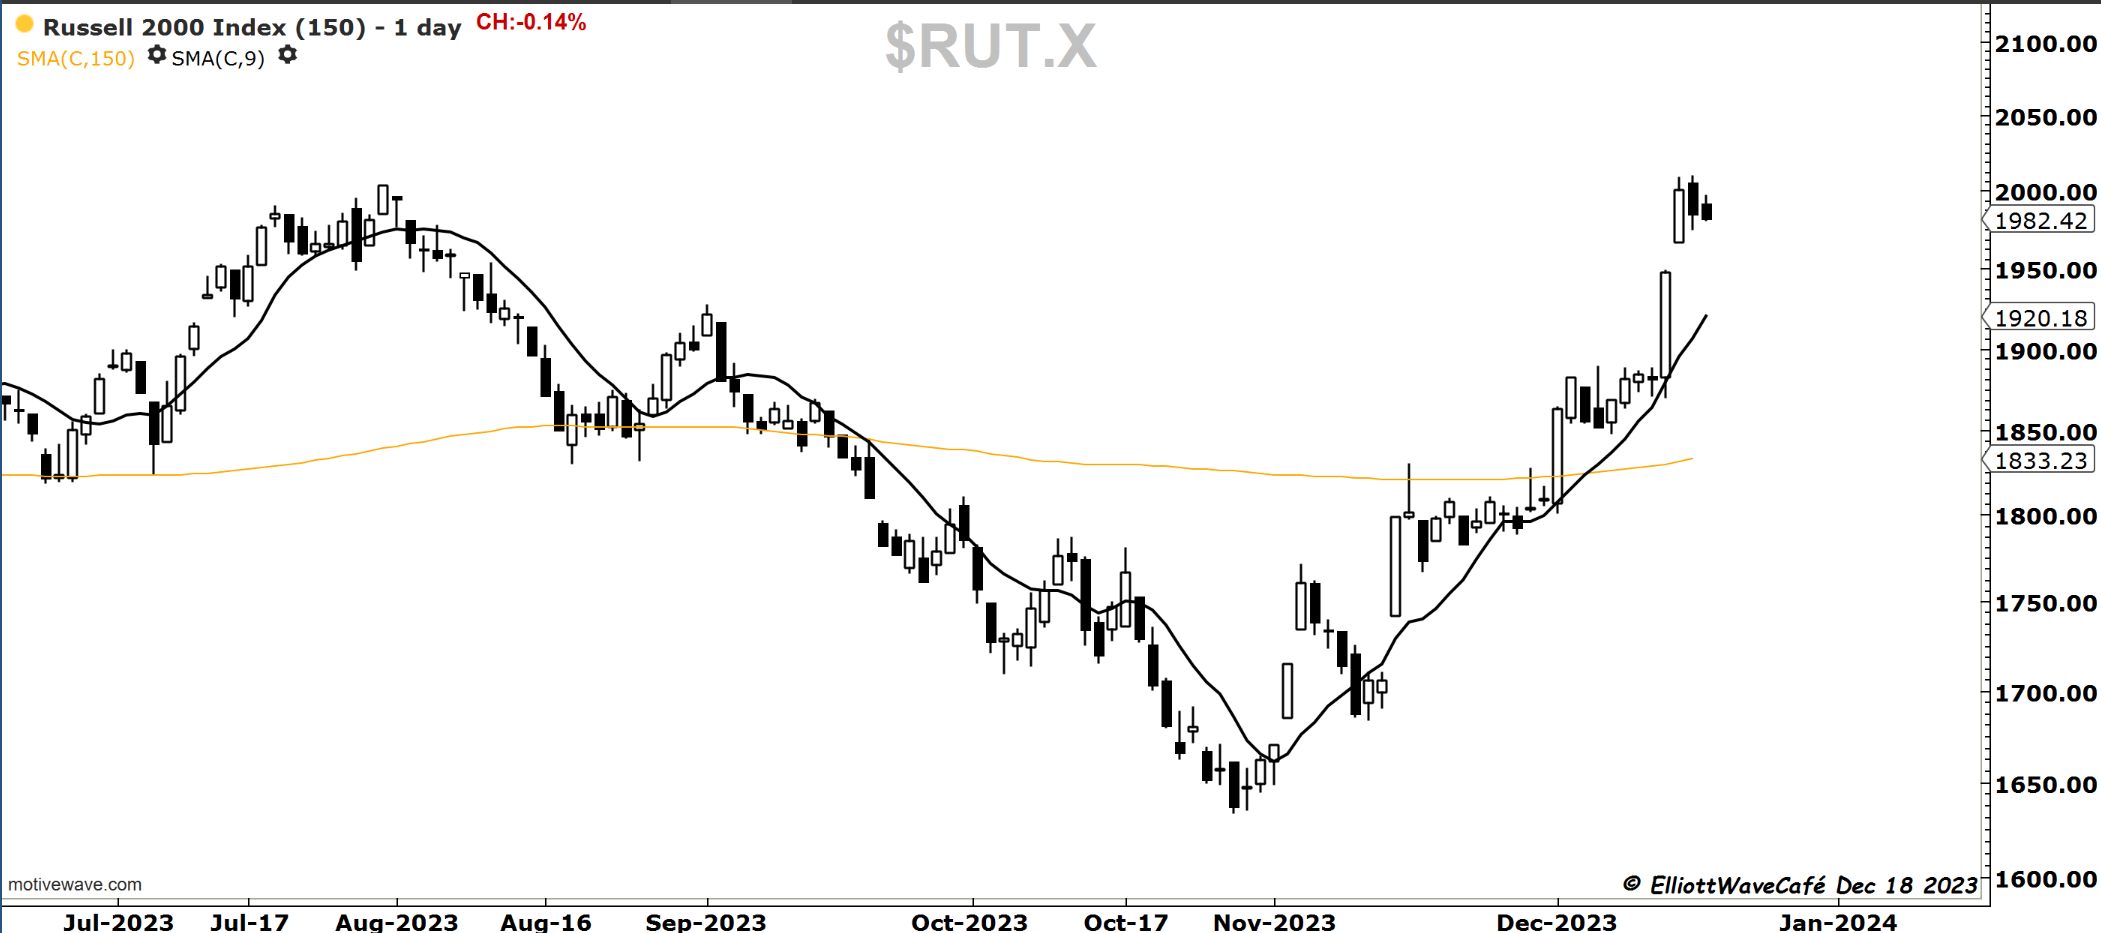
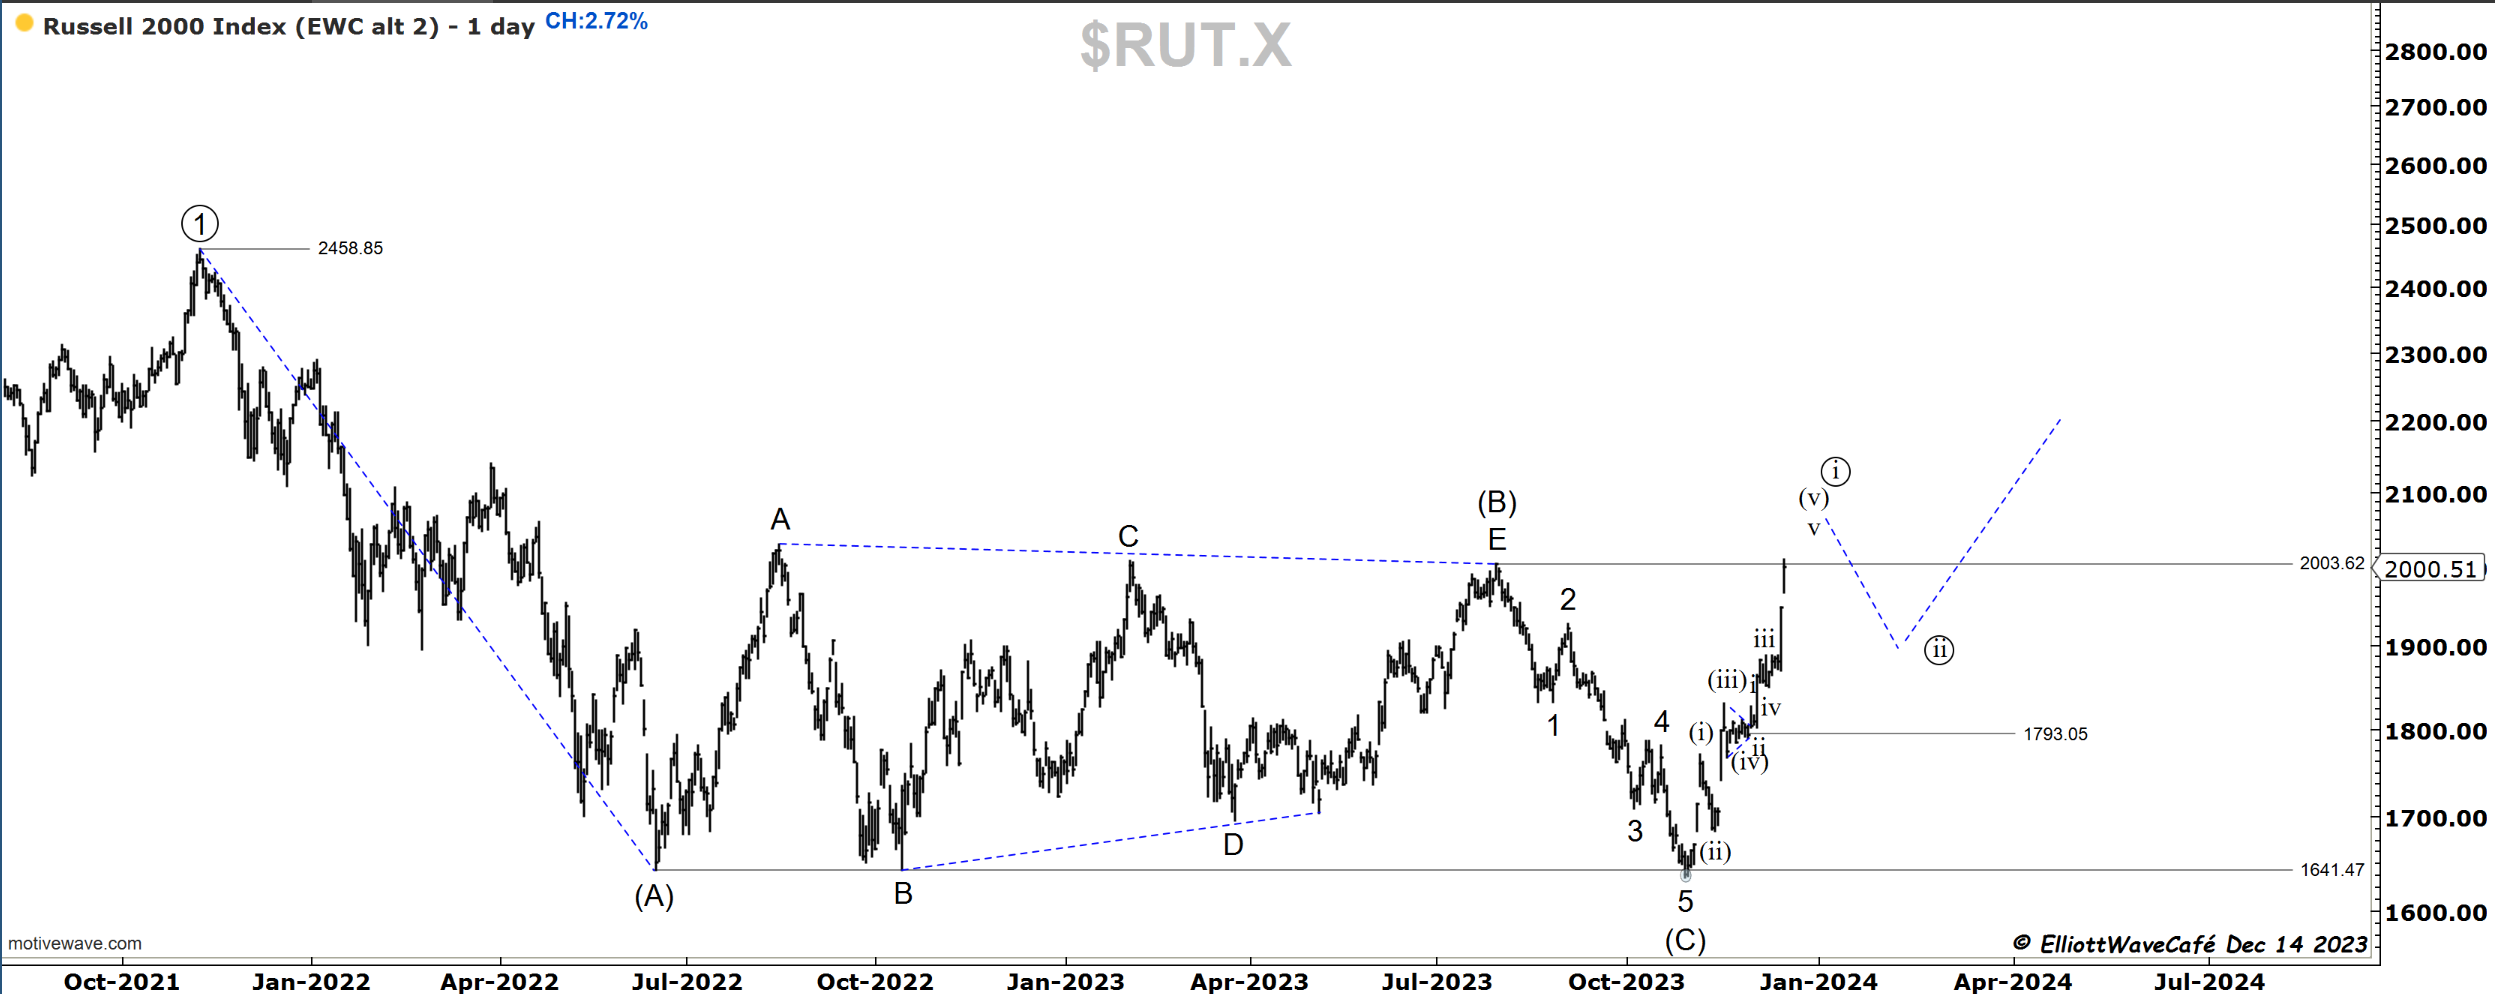
RUSSELL 2000
The small caps were mostly flat today in a tape dominated by a few large names. It does seem like one more push would complete the sequence, followed by a more significant pullback.
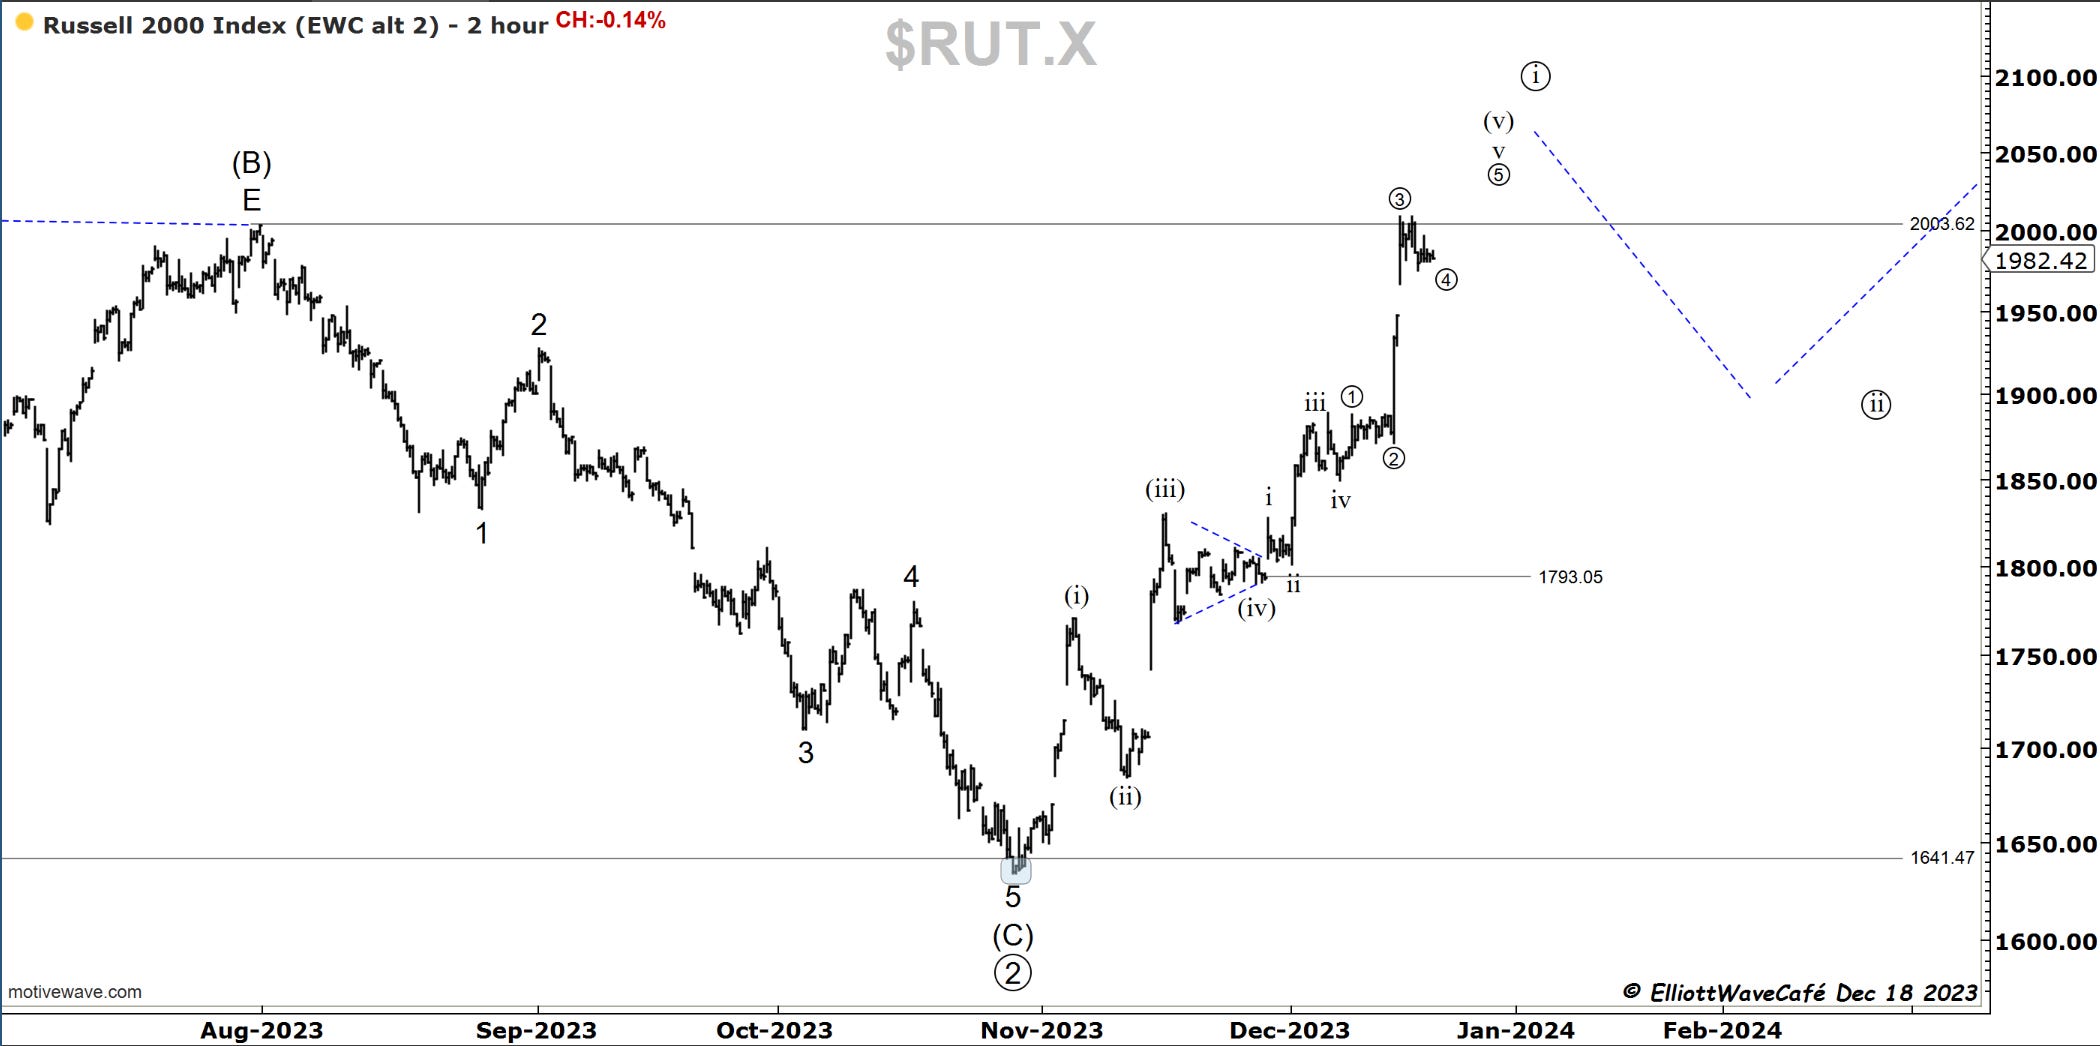
The challenge of the (B) wave highs is important. It suggests a correction (A) (B) (C) is complete. I do expect the correction in wave ((ii)) to lead to the next opportunity for longs.

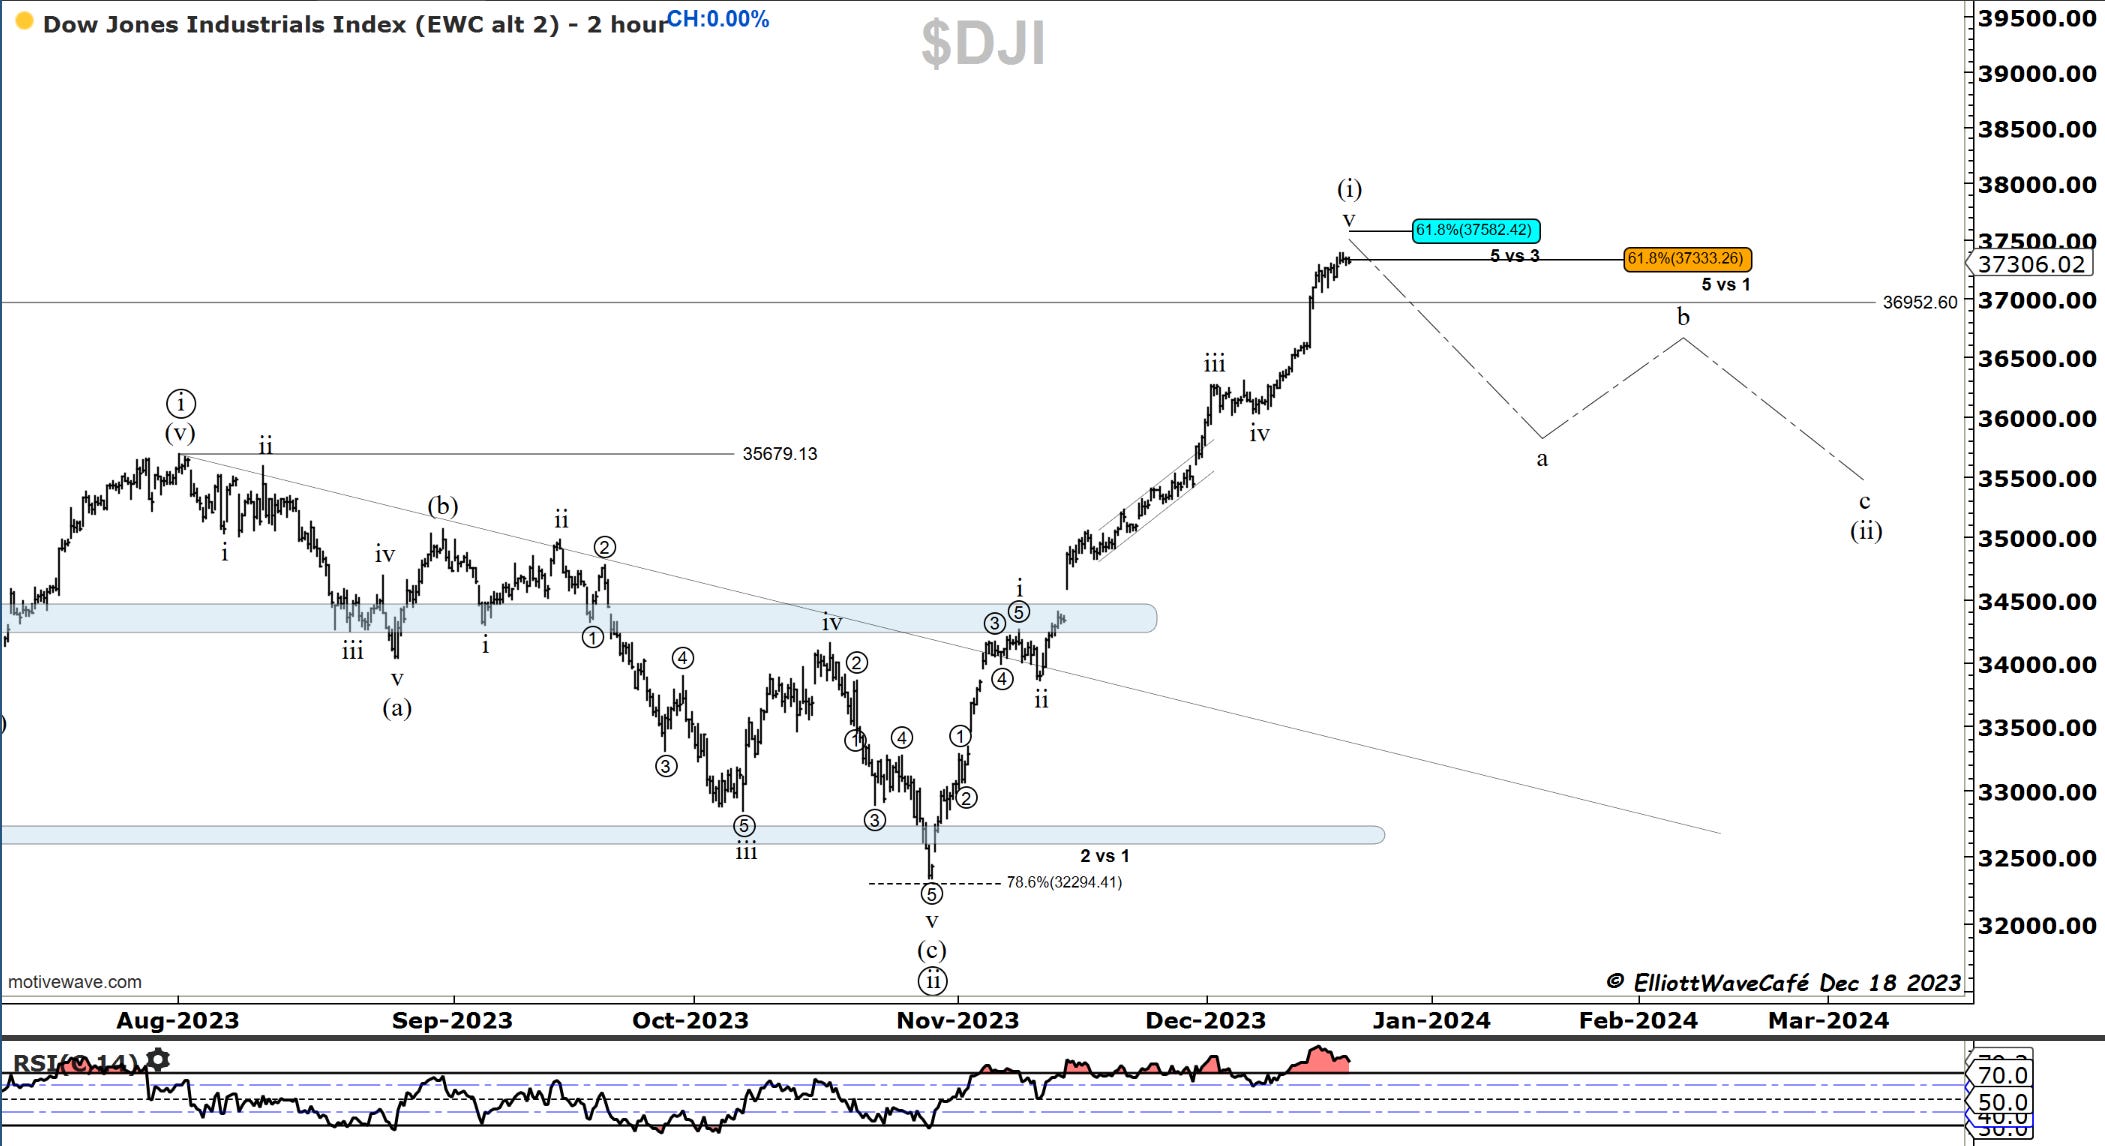
Dow30
no changes here after a dead flat close. prior comments remain.
I have placed the confluence zones for wave v. You can see how both 5 vs. 1 and 5 vs. 3 come in very close to each other. The market tends to respect fibs that come in the same areas. I remain on high alert for an appropriate correction.
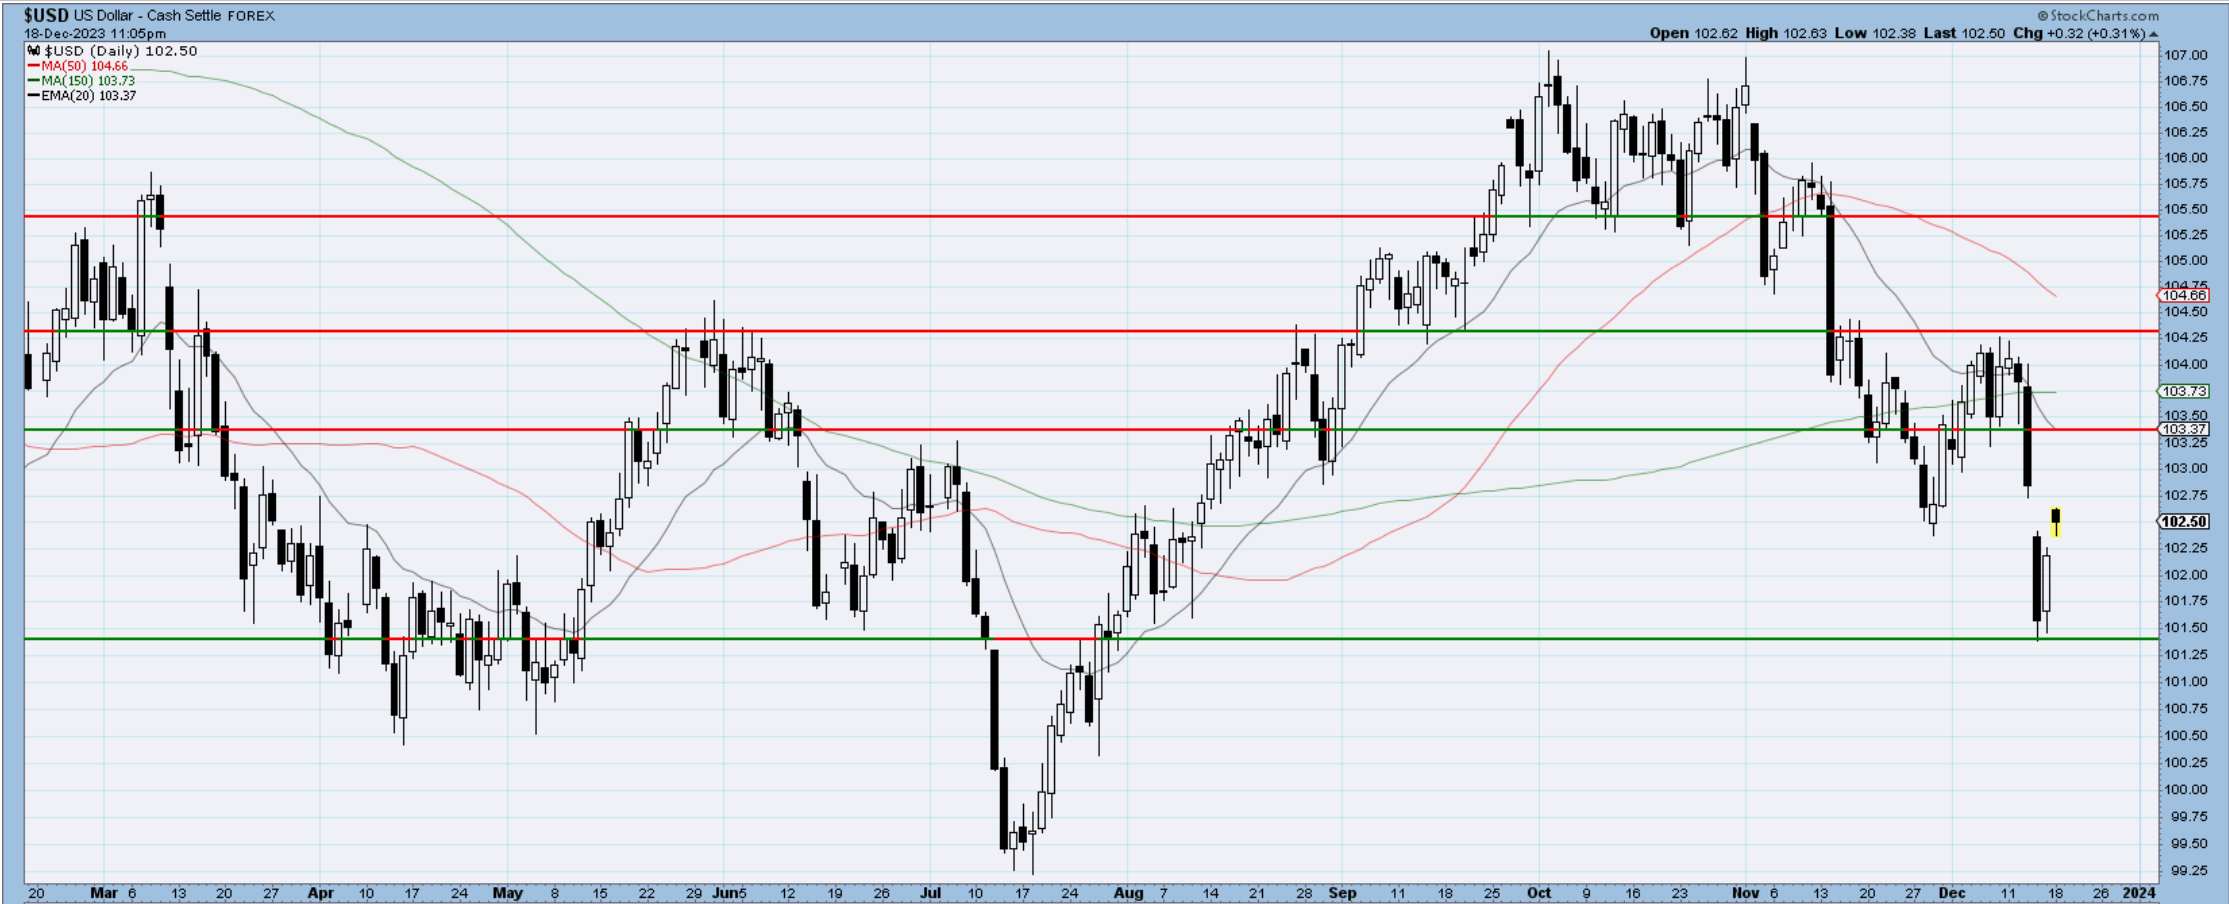
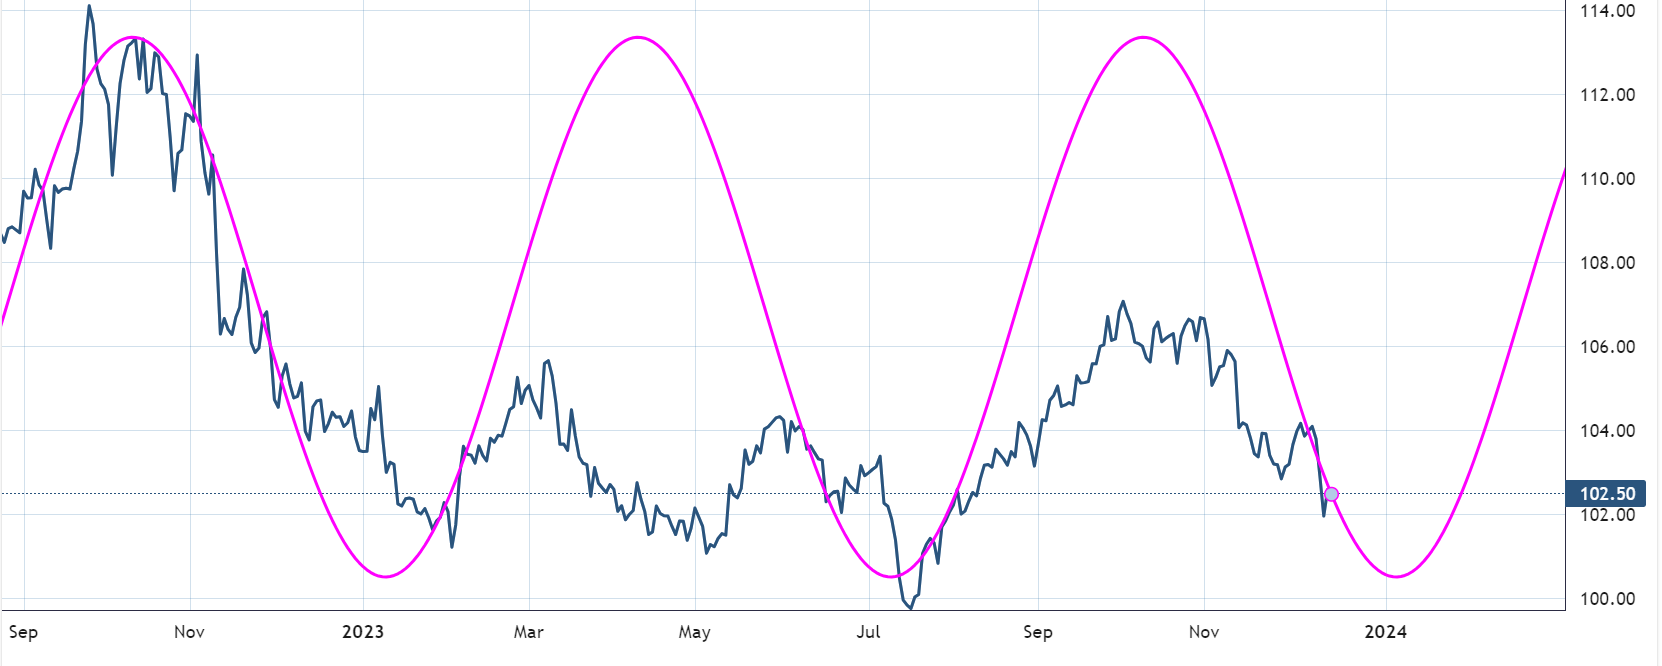
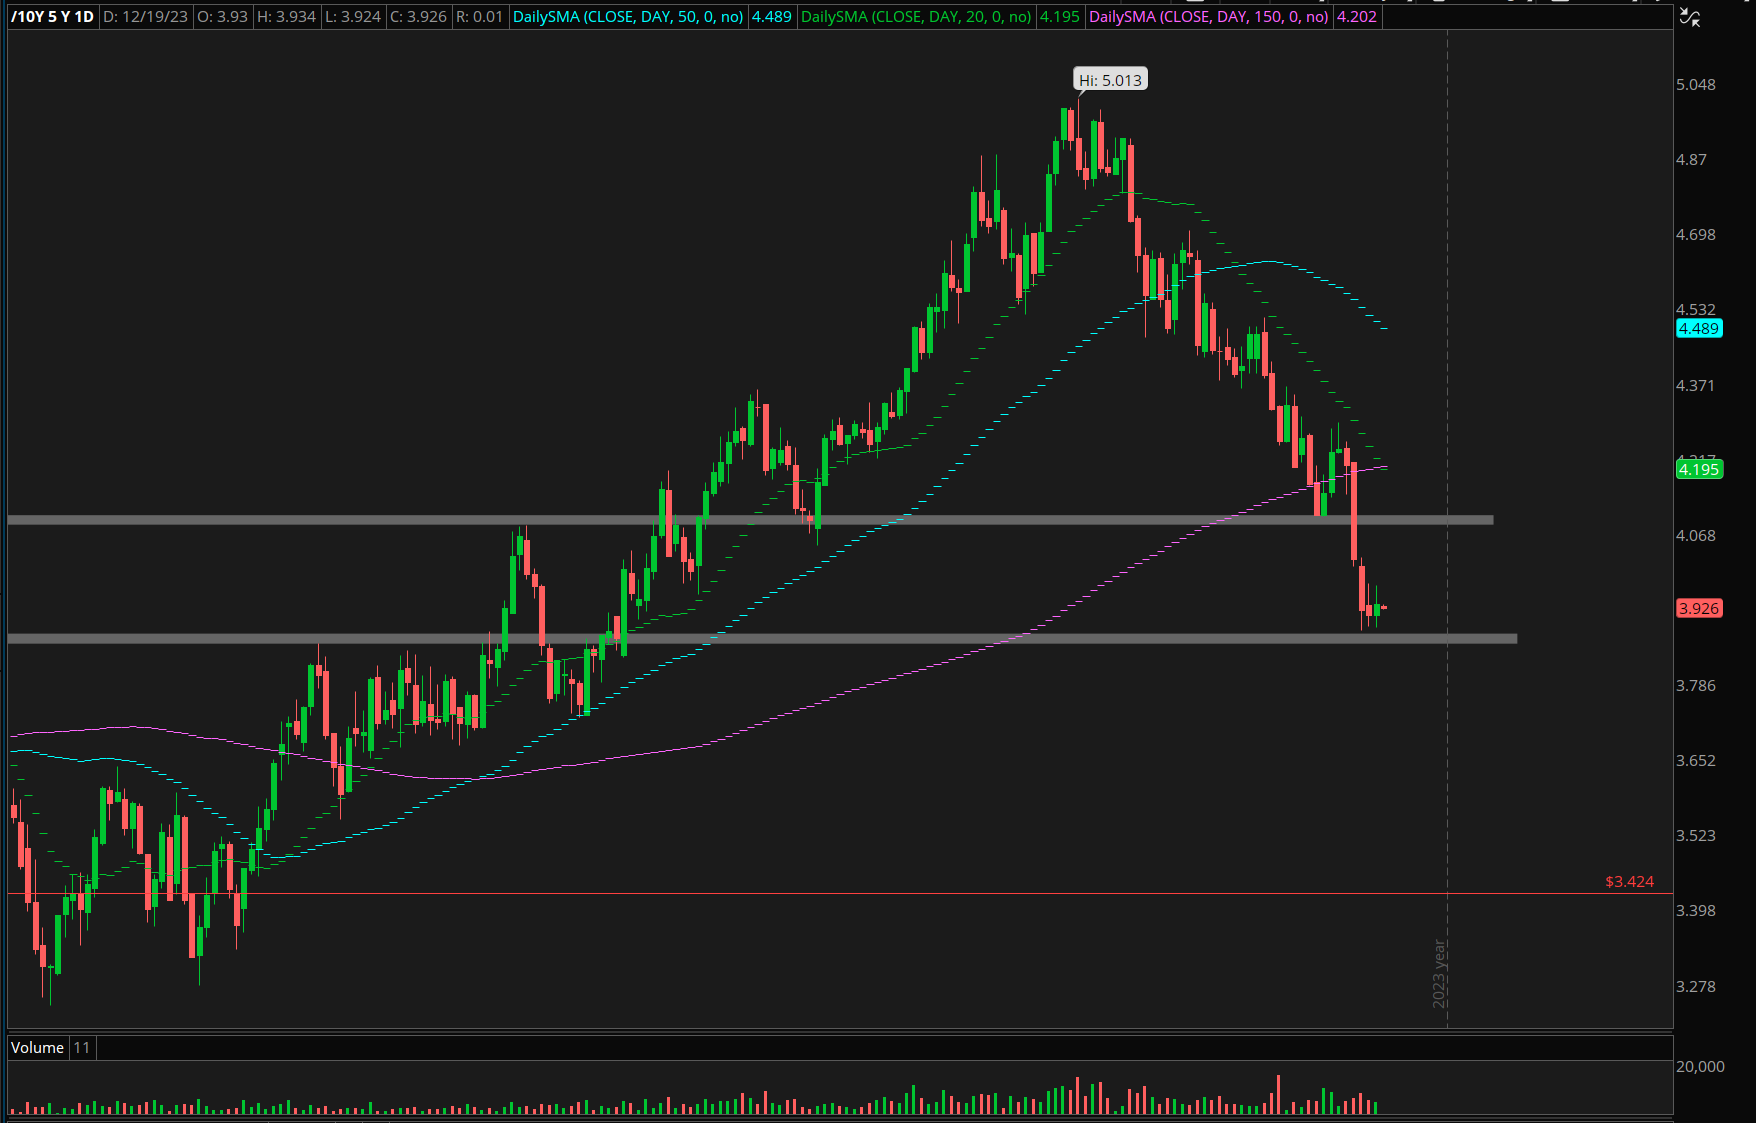
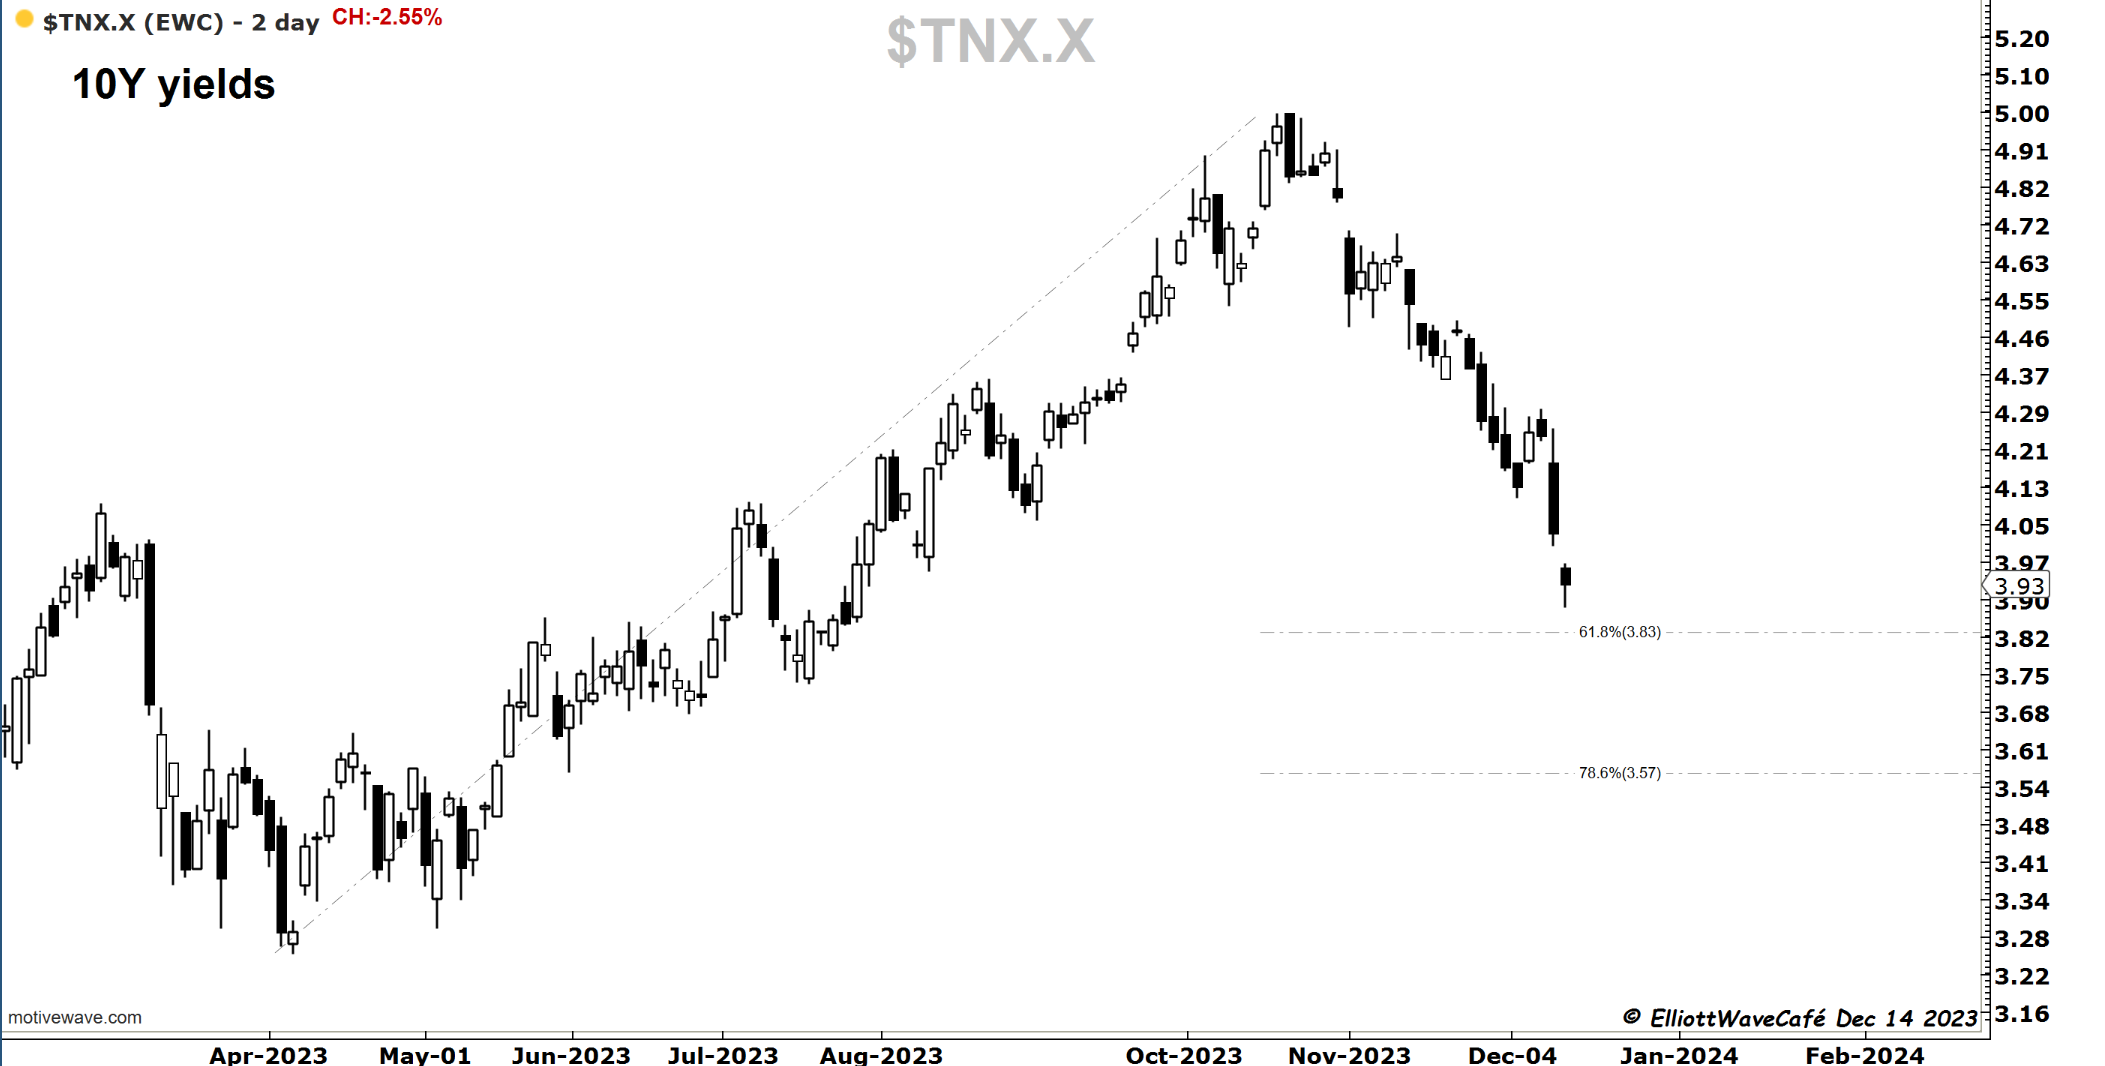
US Dollar and Yields
We got a decent bounce in the greenback over the past few days from the 101.50 support. We identified that drop as a 5th wave. A move back towards the 103.50 zone would be expected. Some of my cycle work shows the dominant 130day cycle, prone for an upswing come early 2024.
Yields decline has stabilized just above 3.87%. It will be much tougher to continue sliding from here. The market has already staged a pretty strong decline in anticipation of Fed-rate cuts. Any hint that it gets delayed could lead to a severe repricing of bonds. In my view, the risks are to the upside from current levels.
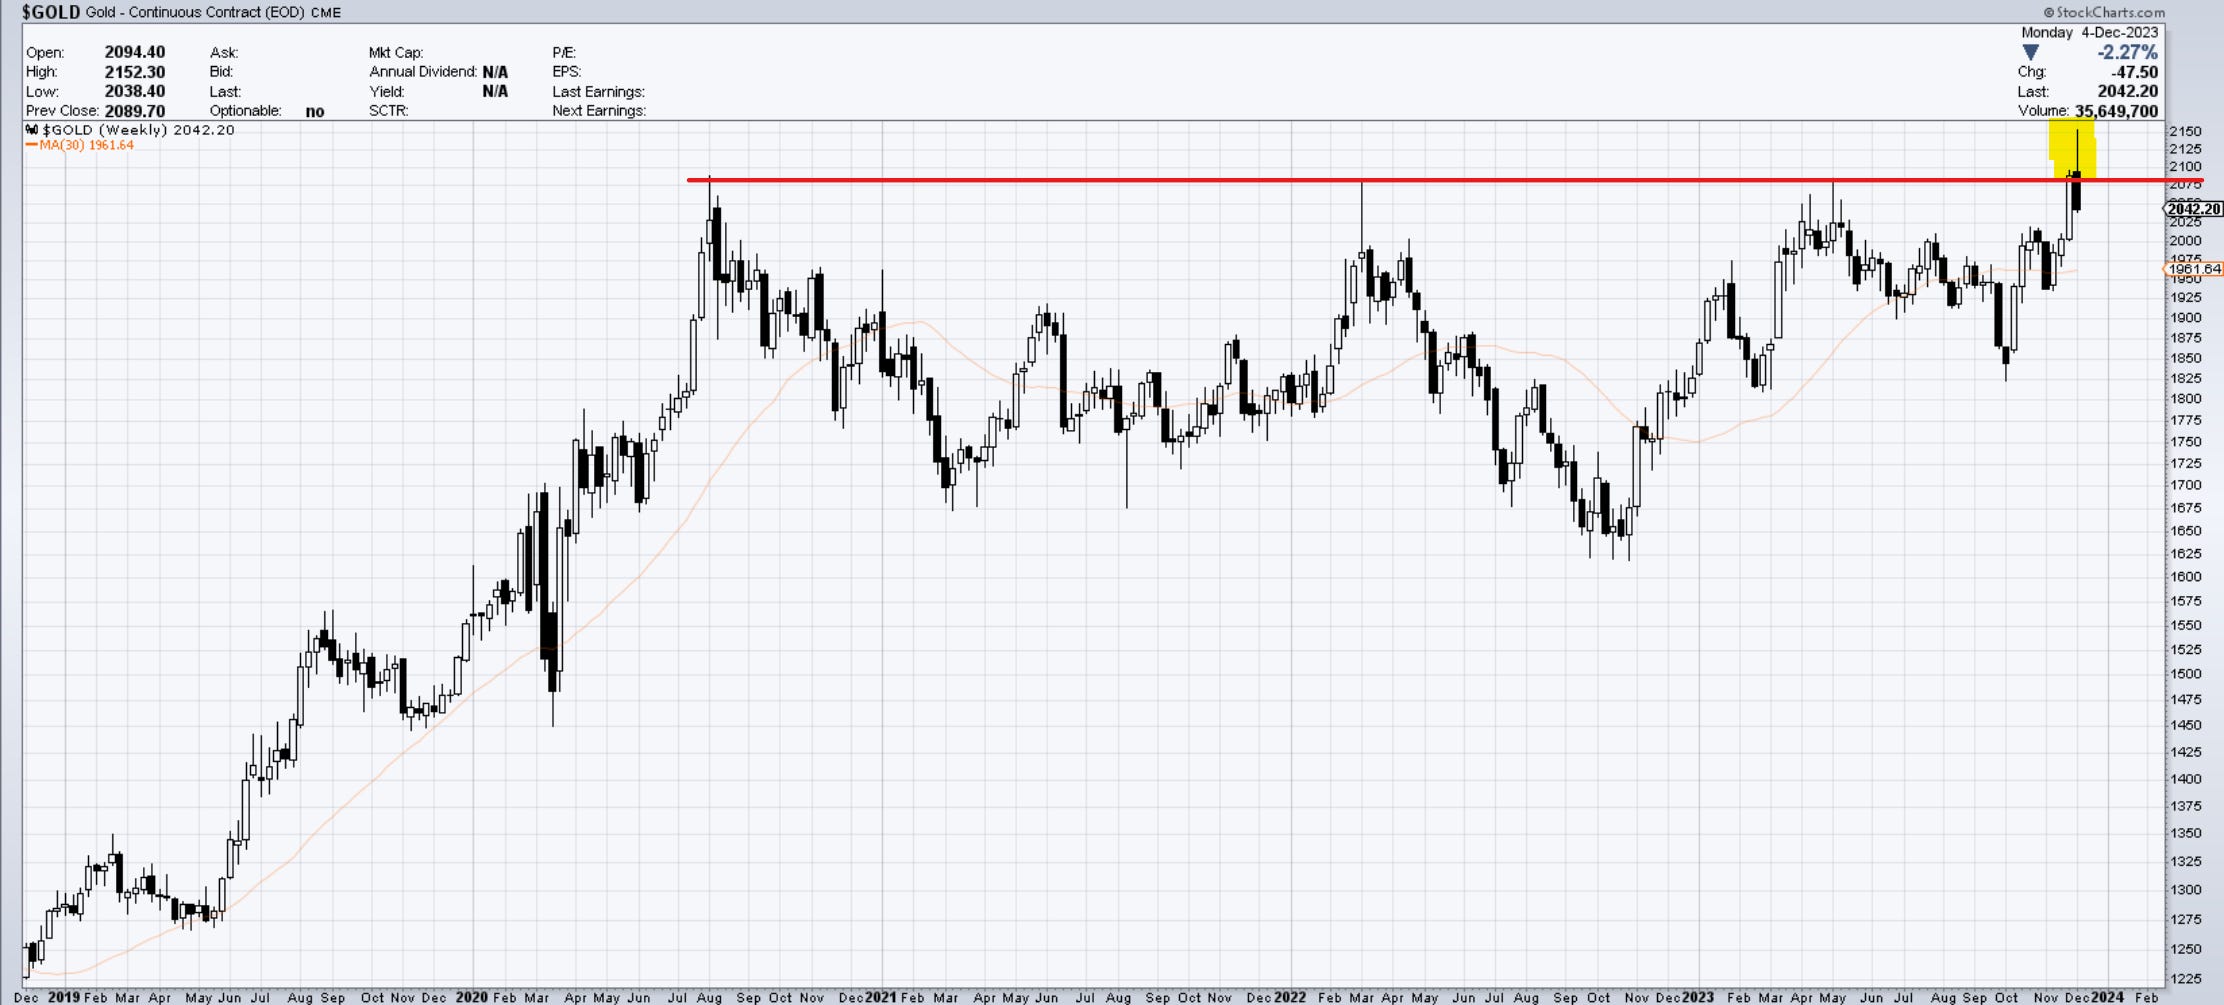
Gold
Gold was flat today, continuing to work a direction after the weekly breakout failure. As long as we’re below 2100, being long is a risky proposition.
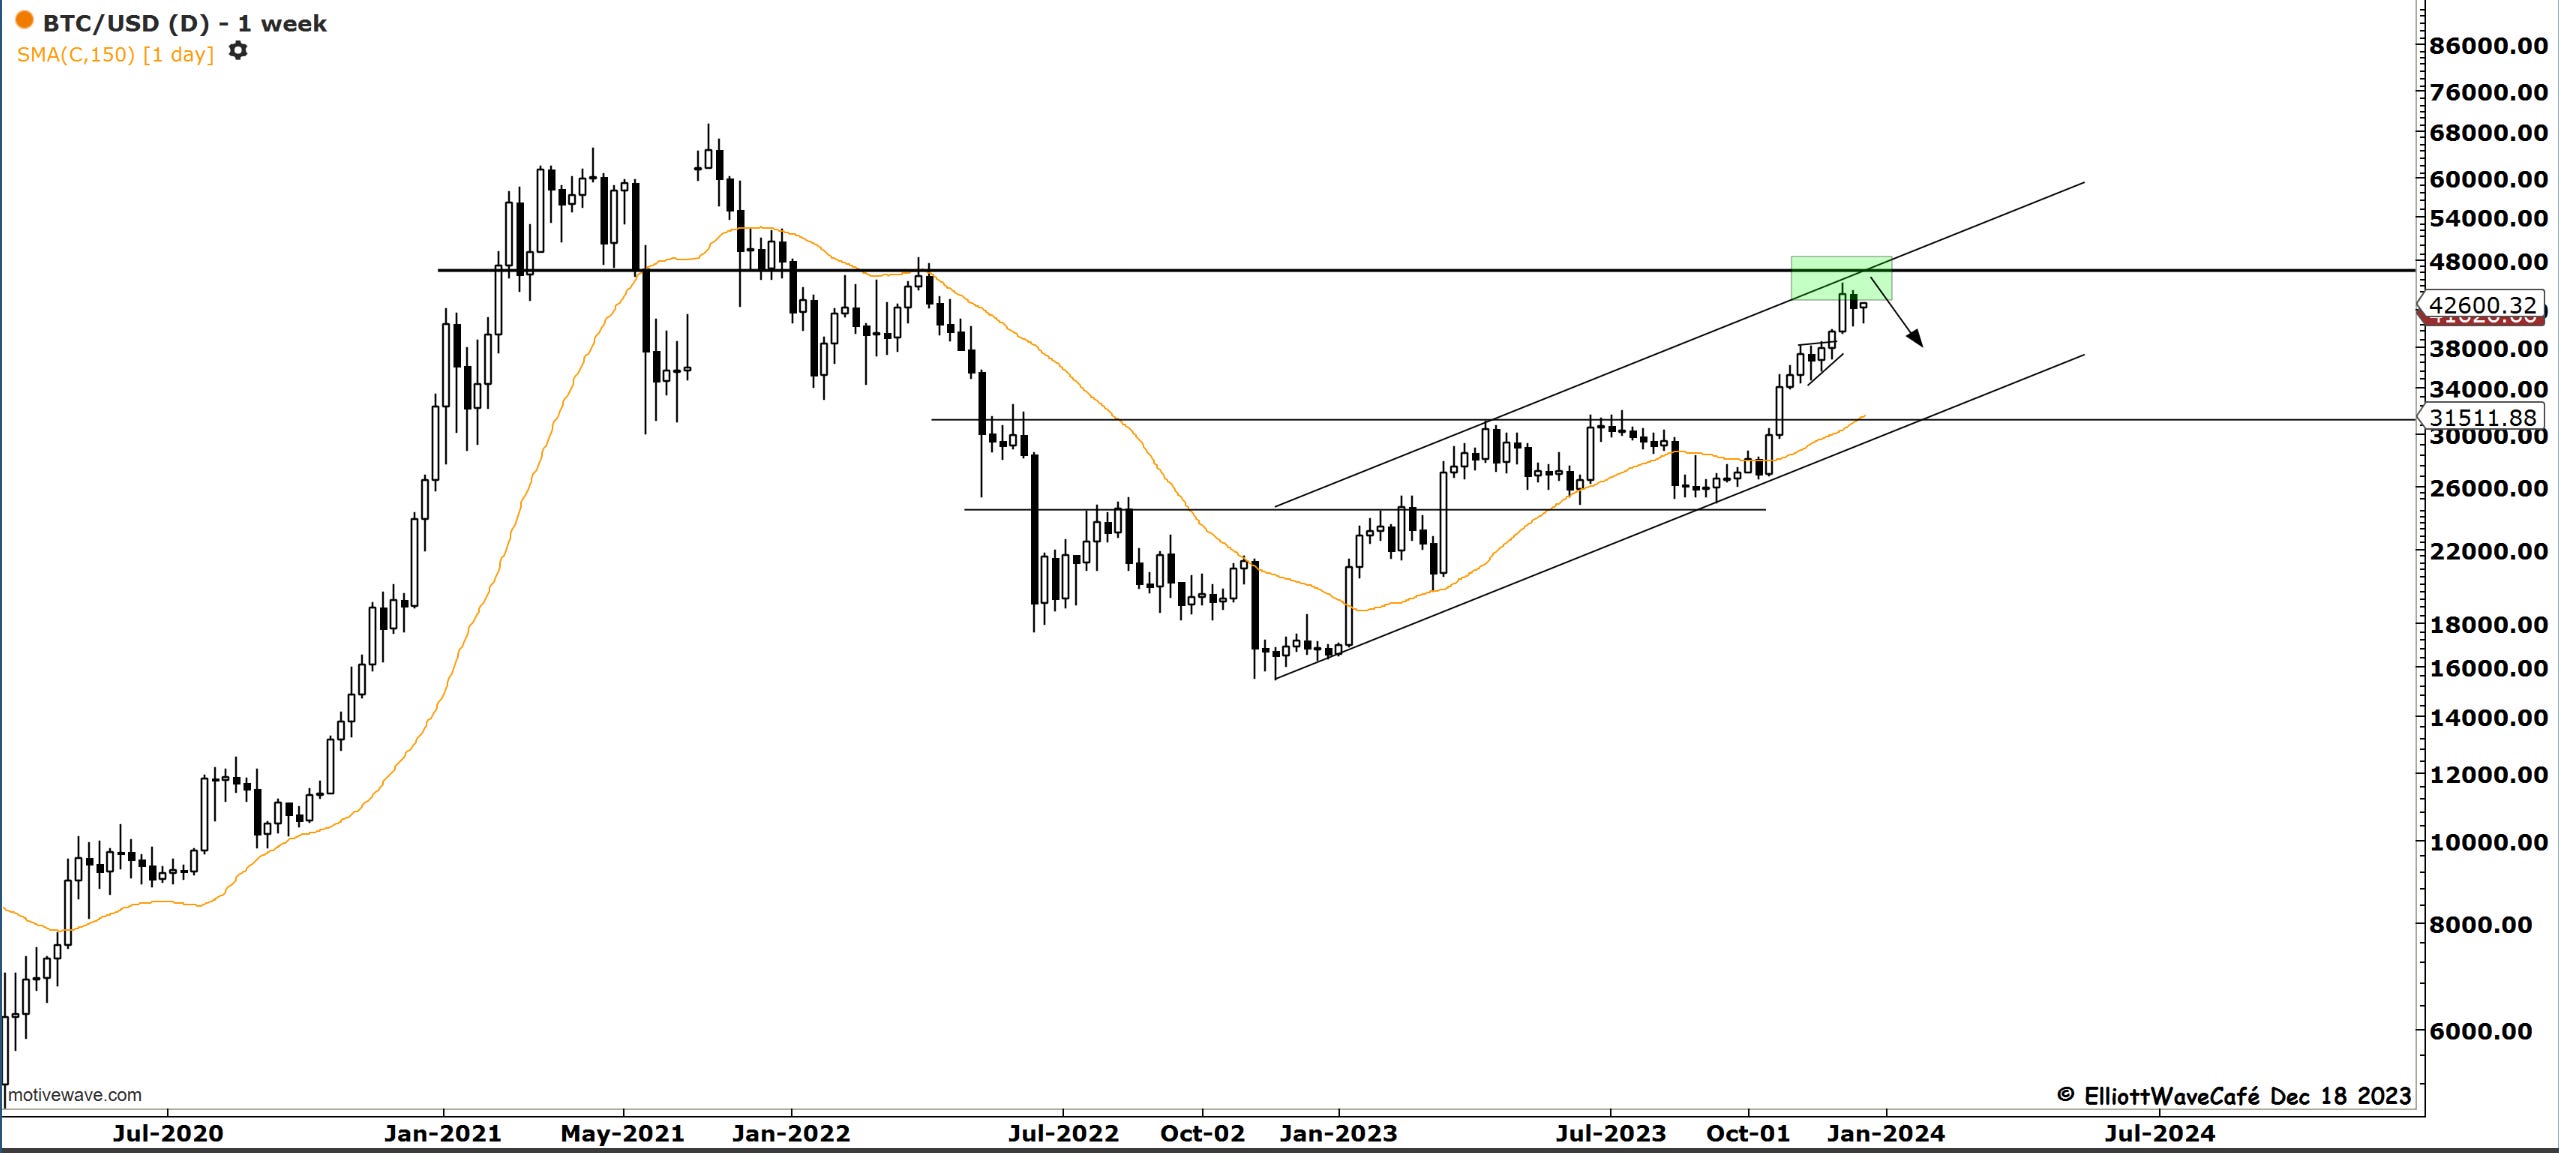
Bitcoin
Bitcoin declined as suggested since the last update. It is messy and not necessarily directional. My view remains that bounces should be met with offers until we correct in time and price this large advance from early Sept lows.
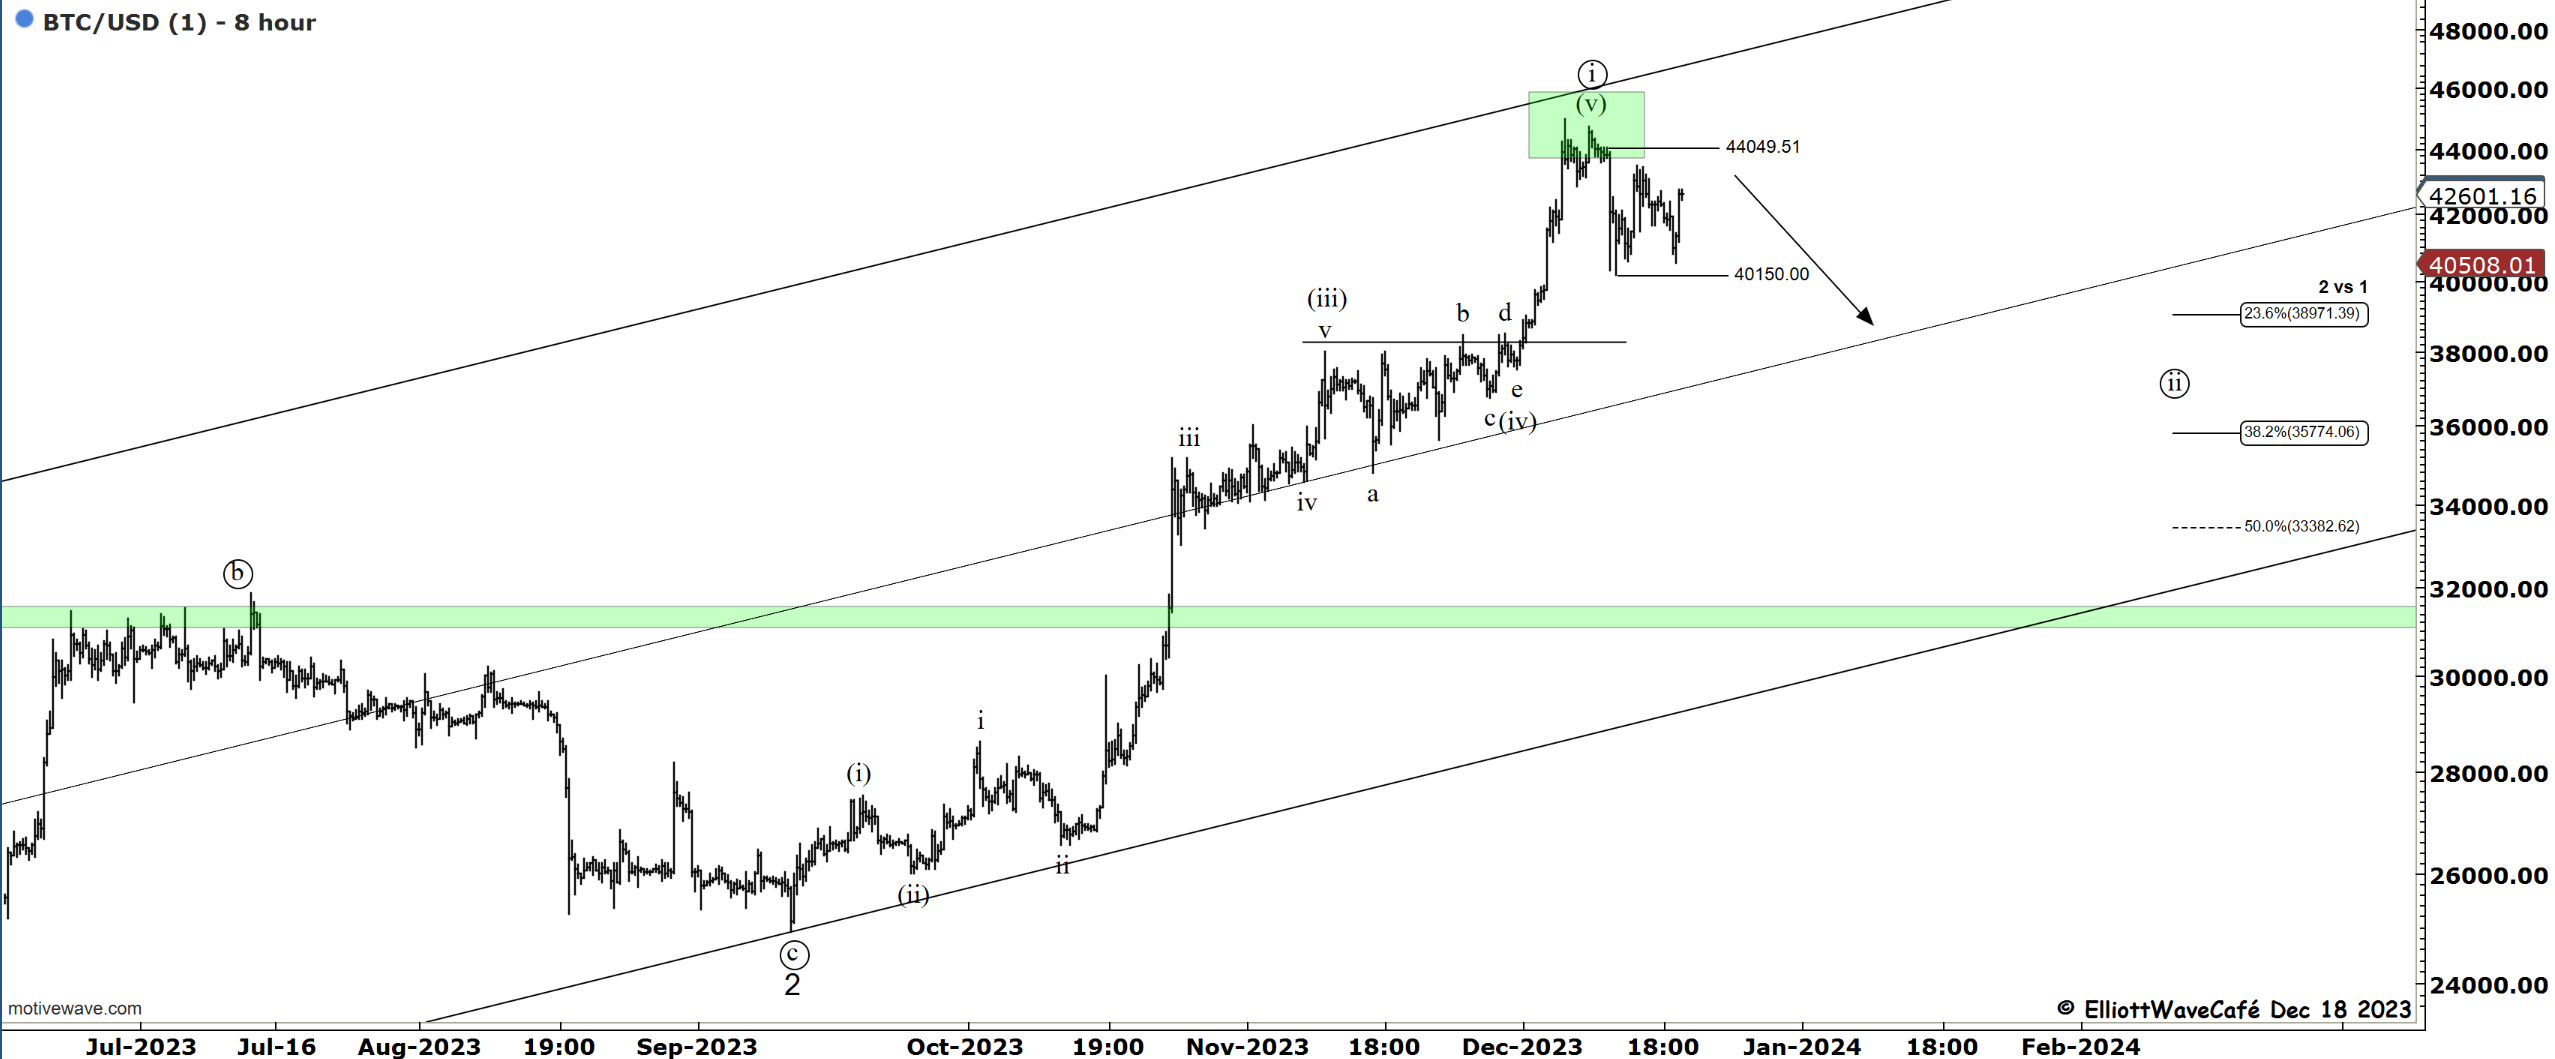
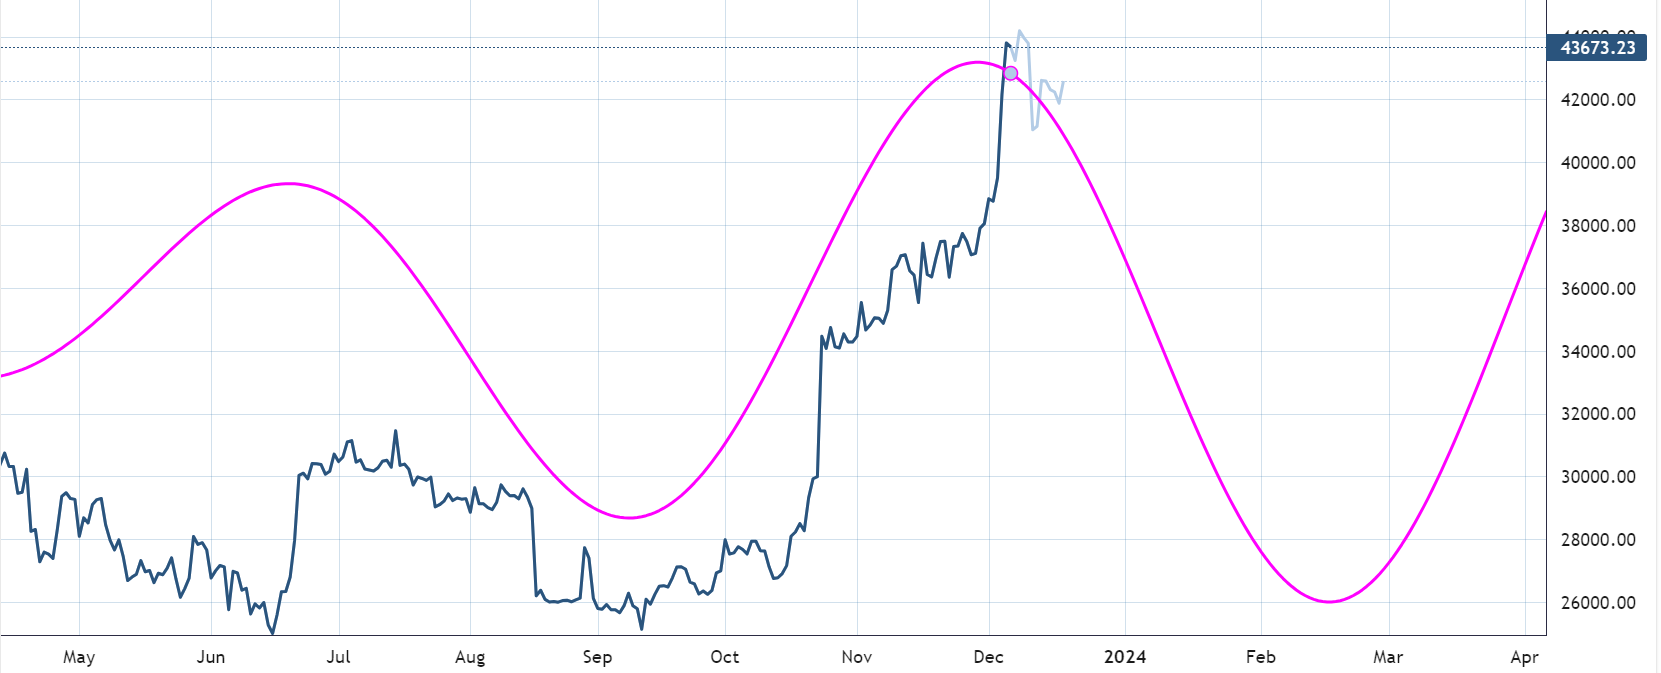
Here is an updated price action in BTC since cautioning of a likely topping cycle.
“Double shot” Daily video coming up next,
Have a great day wherever you are! - trade well, and don’t forget to subscribe and drop a like if this letter helps you in any way.
Cris
email: ewcafe@pm.me