
The Daily Drip
Markets review, strategy and analysis
Note: The EW counts on the right edge are real-time, and they are prone to adjustments as price action develops. Elliott Wave has a fluid approach, is evidence-based, and requires constant monitoring of certain thresholds.
In the counts below, this (( )) = circle on chart
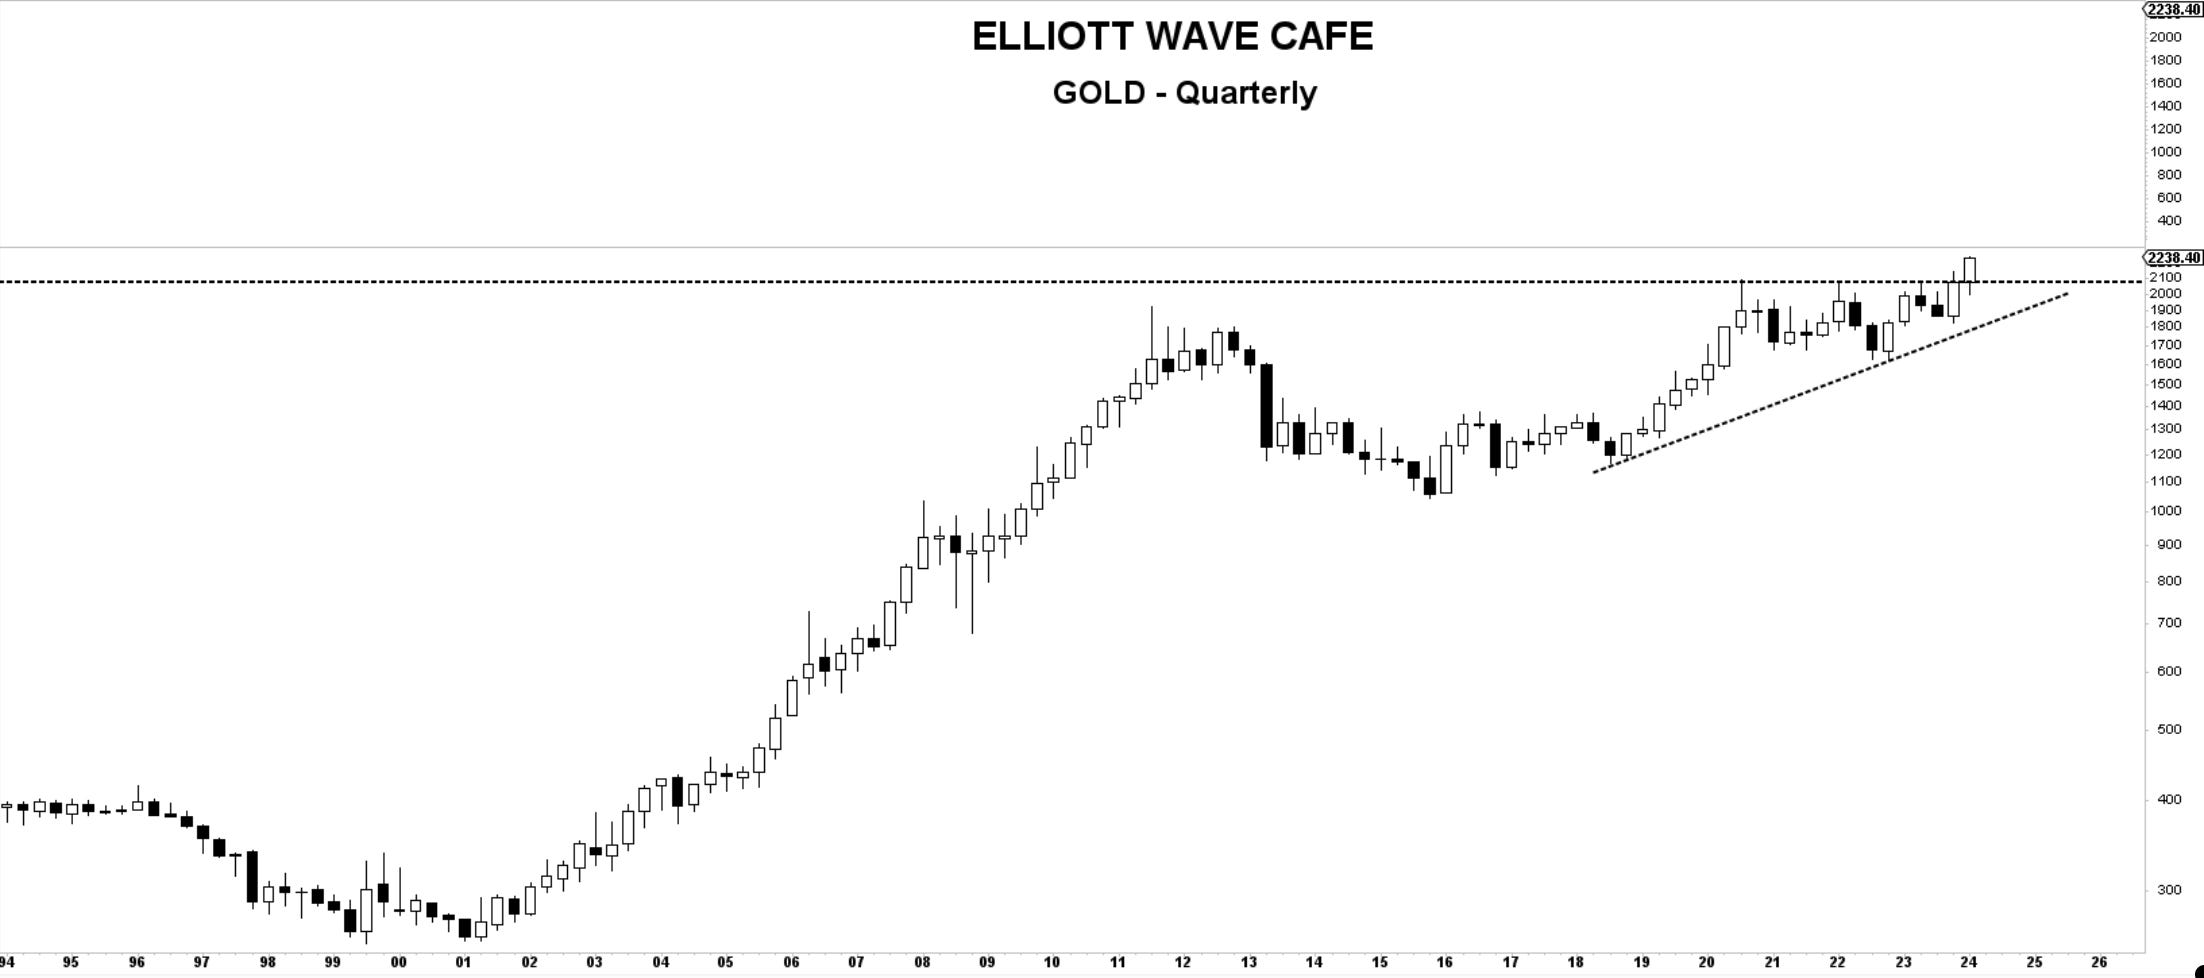
Chart of the Day—GOLD—Gold is entering a new dimension of price discovery, with the quarterly close at an all-time high of 2,238.40. This is a very bullish development, but for fresh money, I would not hang around if we get a weekly close below 2100.
Markets in the US and worldwide have had a great first quarter in 2024. I will show some larger charts and discuss trends in today’s video…
In today’s written note, I will focus on IWM, my targets, and the potential it presents going forward…
Let's dive into the charts below …
