
The Daily Drip
Core markets charts updates and commentary
Note: The counts on the right edge are real-time, and they are prone to adjustments as price action develops. Elliott Wave has a fluid approach, is evidence-based, and requires constant monitoring of certain thresholds.
In the counts below, this (( )) = circle on chart
SP500
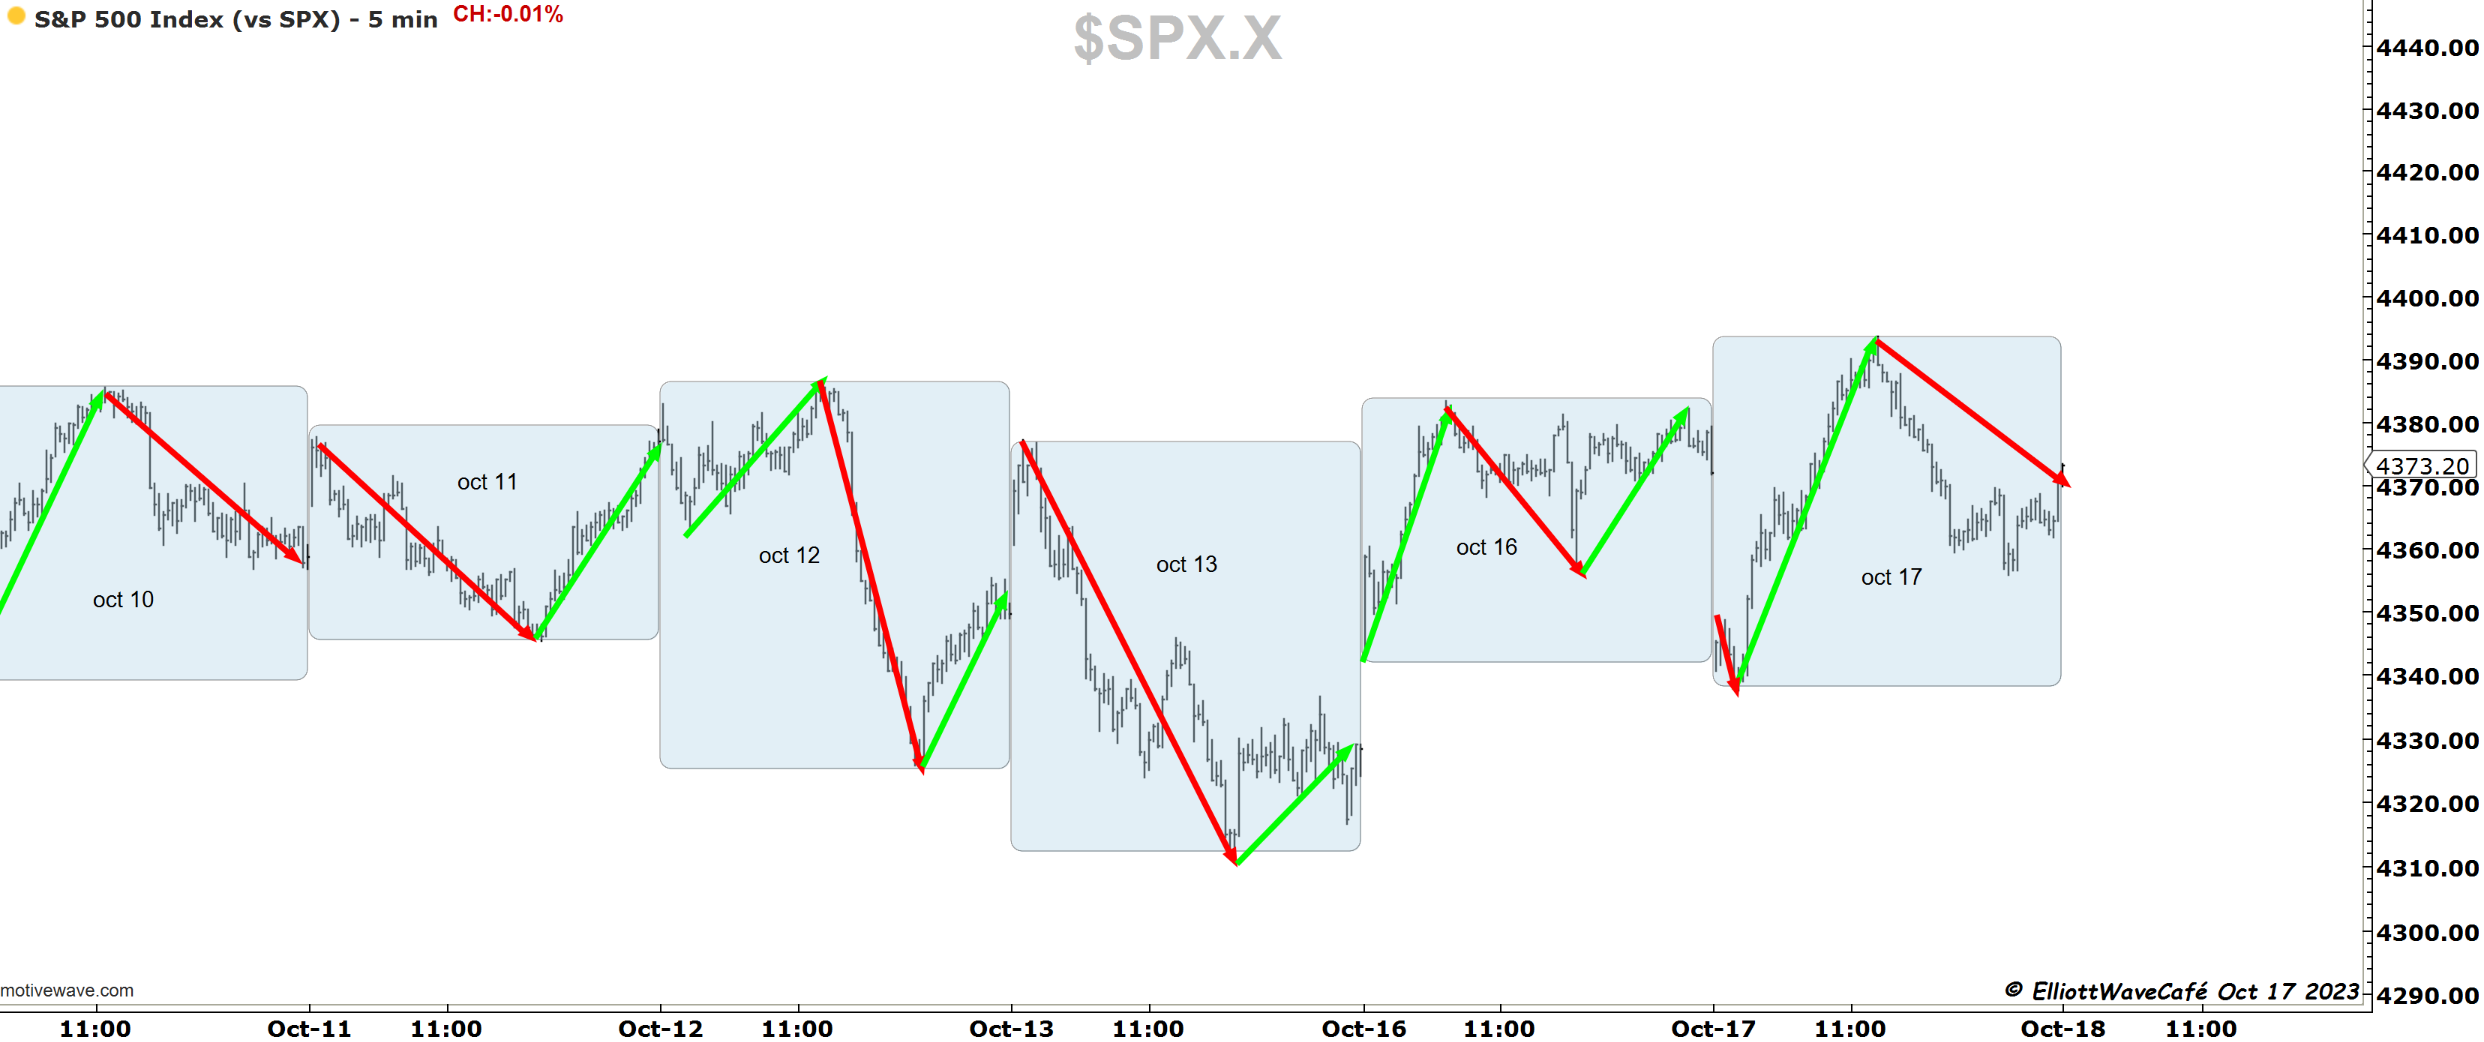
The index gapped lower overnight and spent half the day closing that gap and moving higher. ( 2nd chart). We gave up half of that rally and ended up closing at the same price from the prior day. A bit of yoyo drama that ended in a wash.
Nothing has changed in terms of counts but the 4385 resistance is proving quite strong. I remain of the opinion that based on the buying that came of the Oct 6th lows after the job report, we will overtake these levels and move towards 4450 and above.
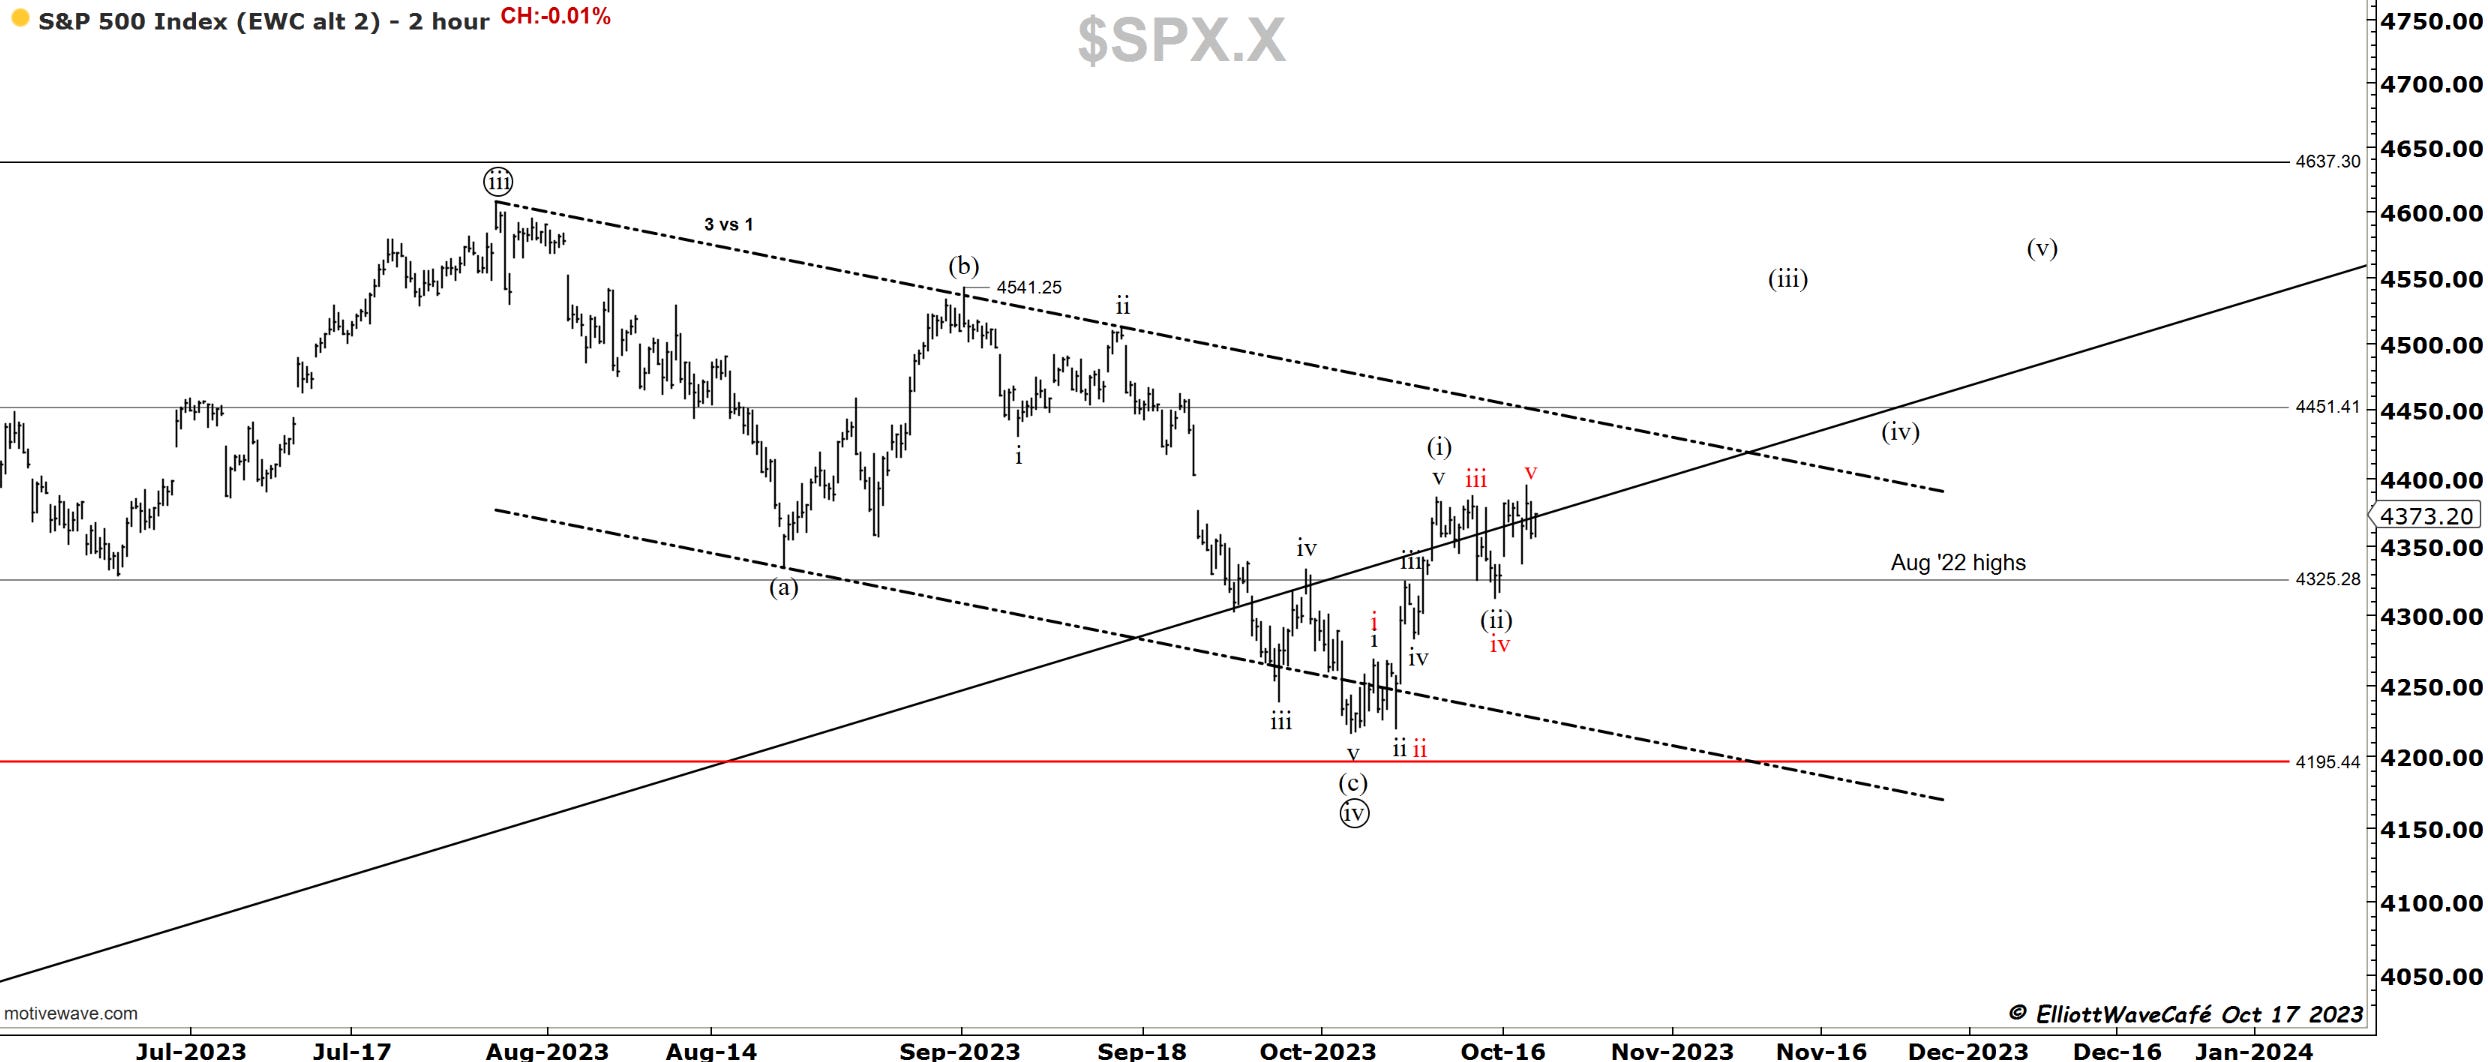
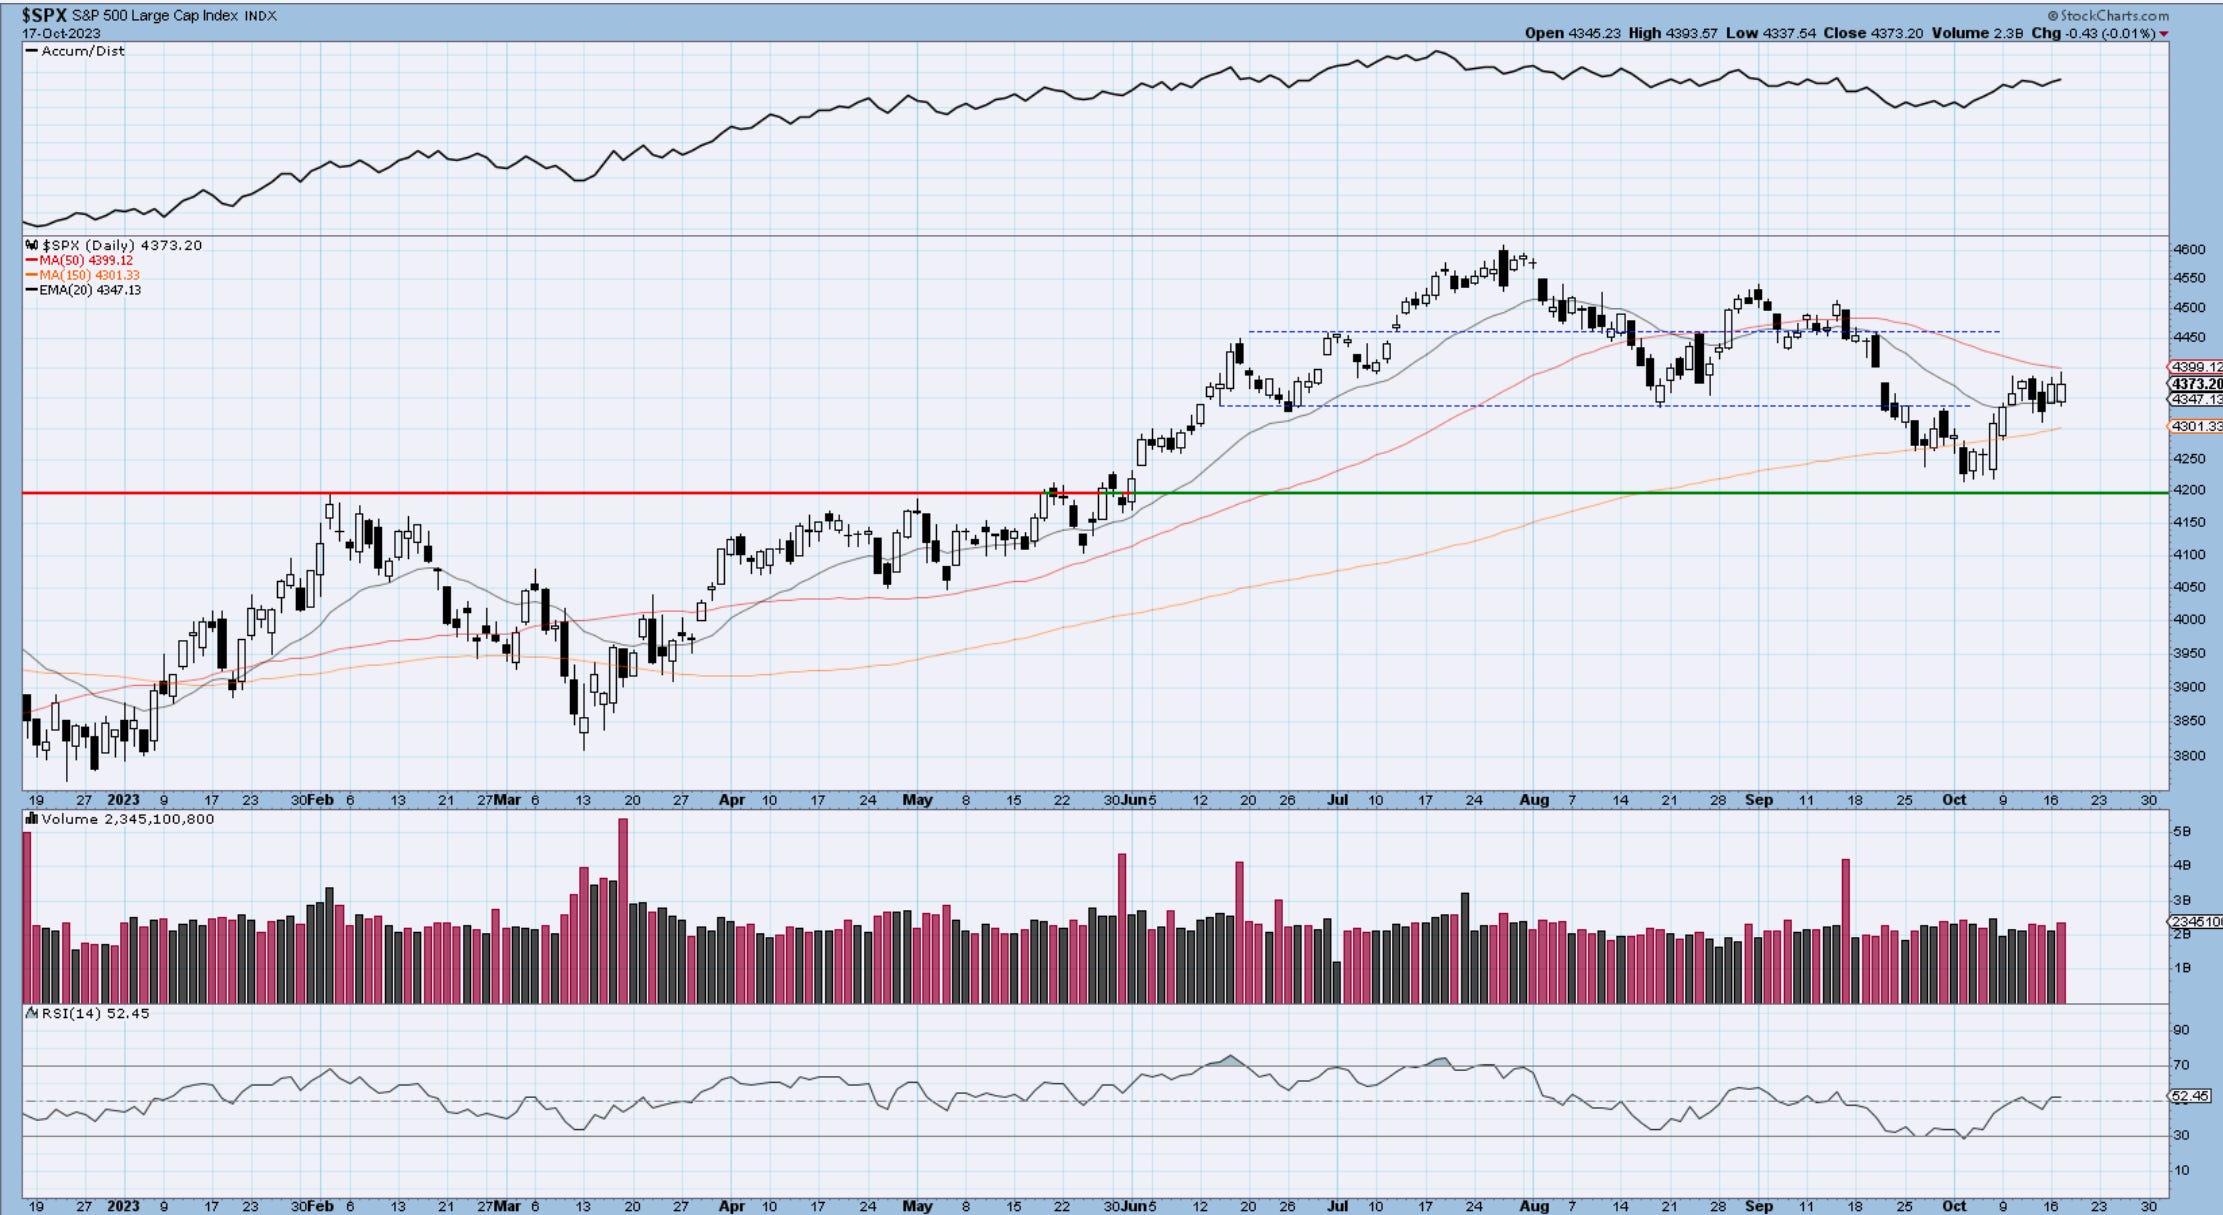
The 50day MA is holding the advance here, a close above it should begin to fuel the advance towards 4600.
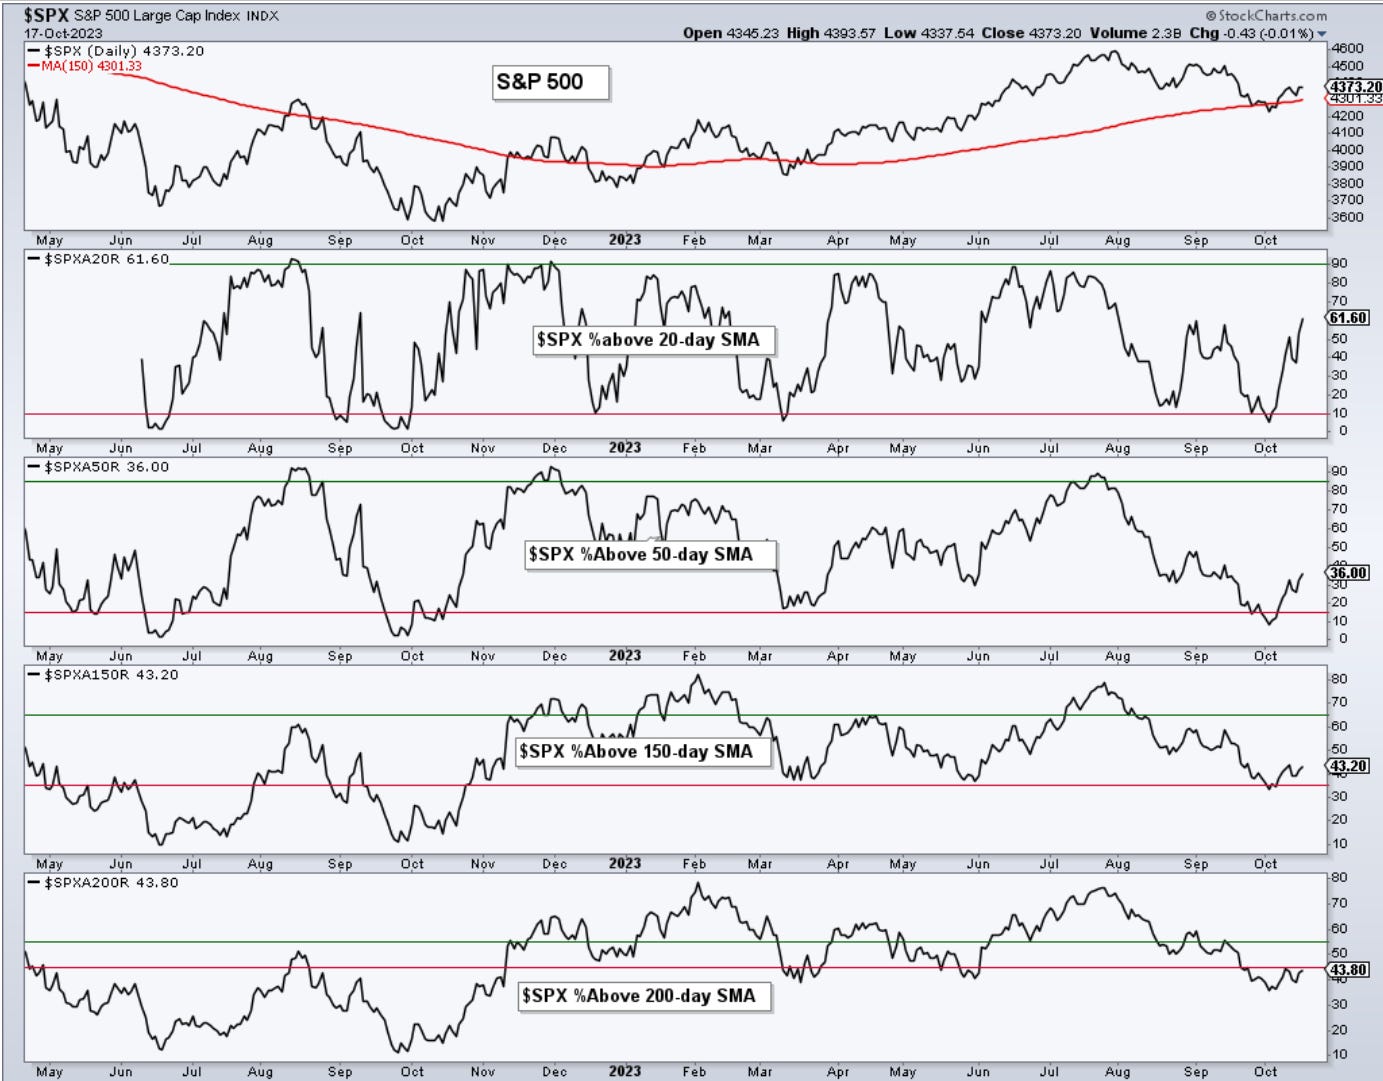
The breadth continues to improve with 60% of the Sp500 stocks being above the 20day and rising. The others are pulling themselves off the oversold levels as well. If we can see more than 50% of stocks above the 200-day, we can discuss a full return to the bullish trend.
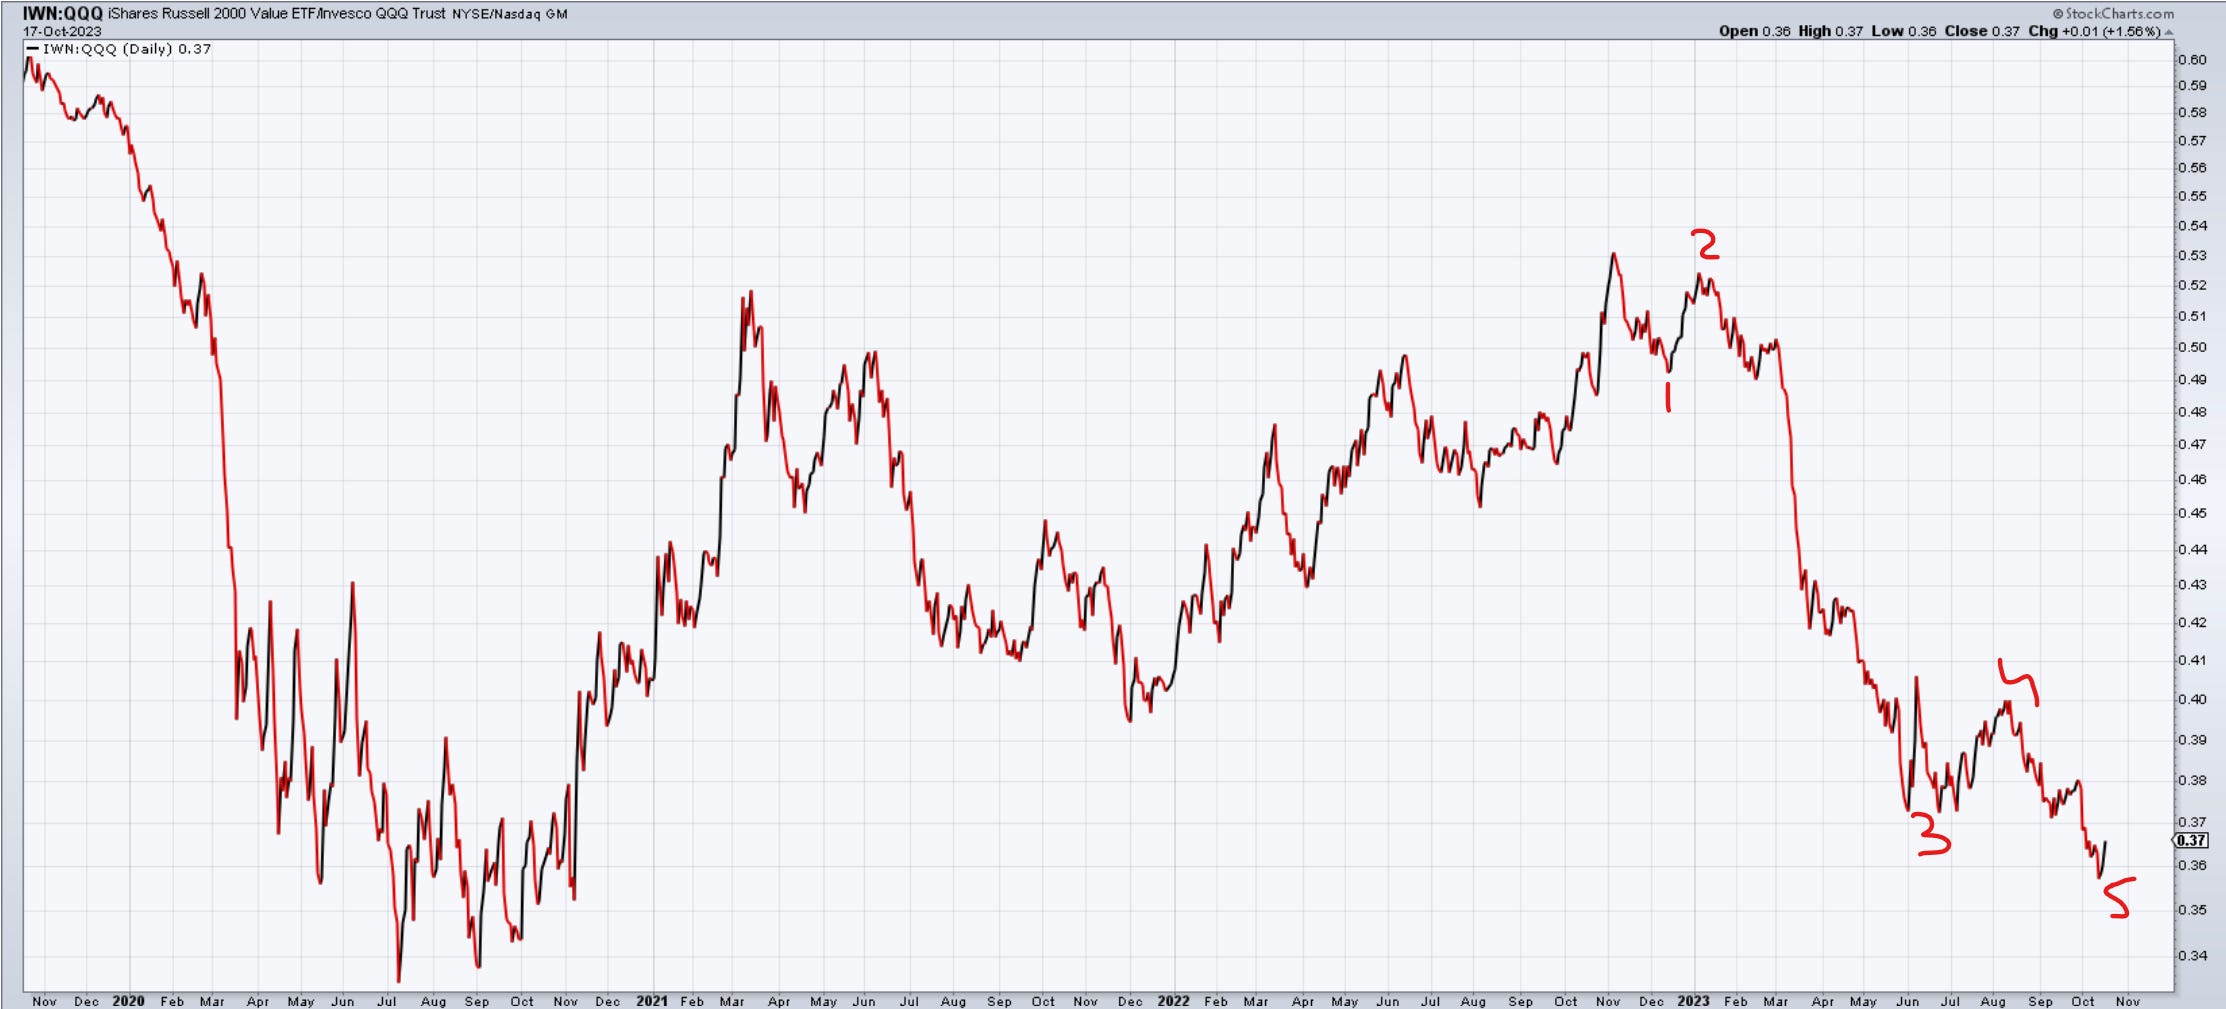
This ratio below is also quite interesting and today’s action in small caps prompted me to check it out. This is IWN vs QQQ. It has been running strongly in favor of Nasdaq for the good part of the year 2023. I can see a 5-wave decline there running its course while also being close to support from 2020. I think the chances are increasing here of a good outperformance from small caps value vs the Qs. The IWM:QQQ looks weaker but similar in the count structure.
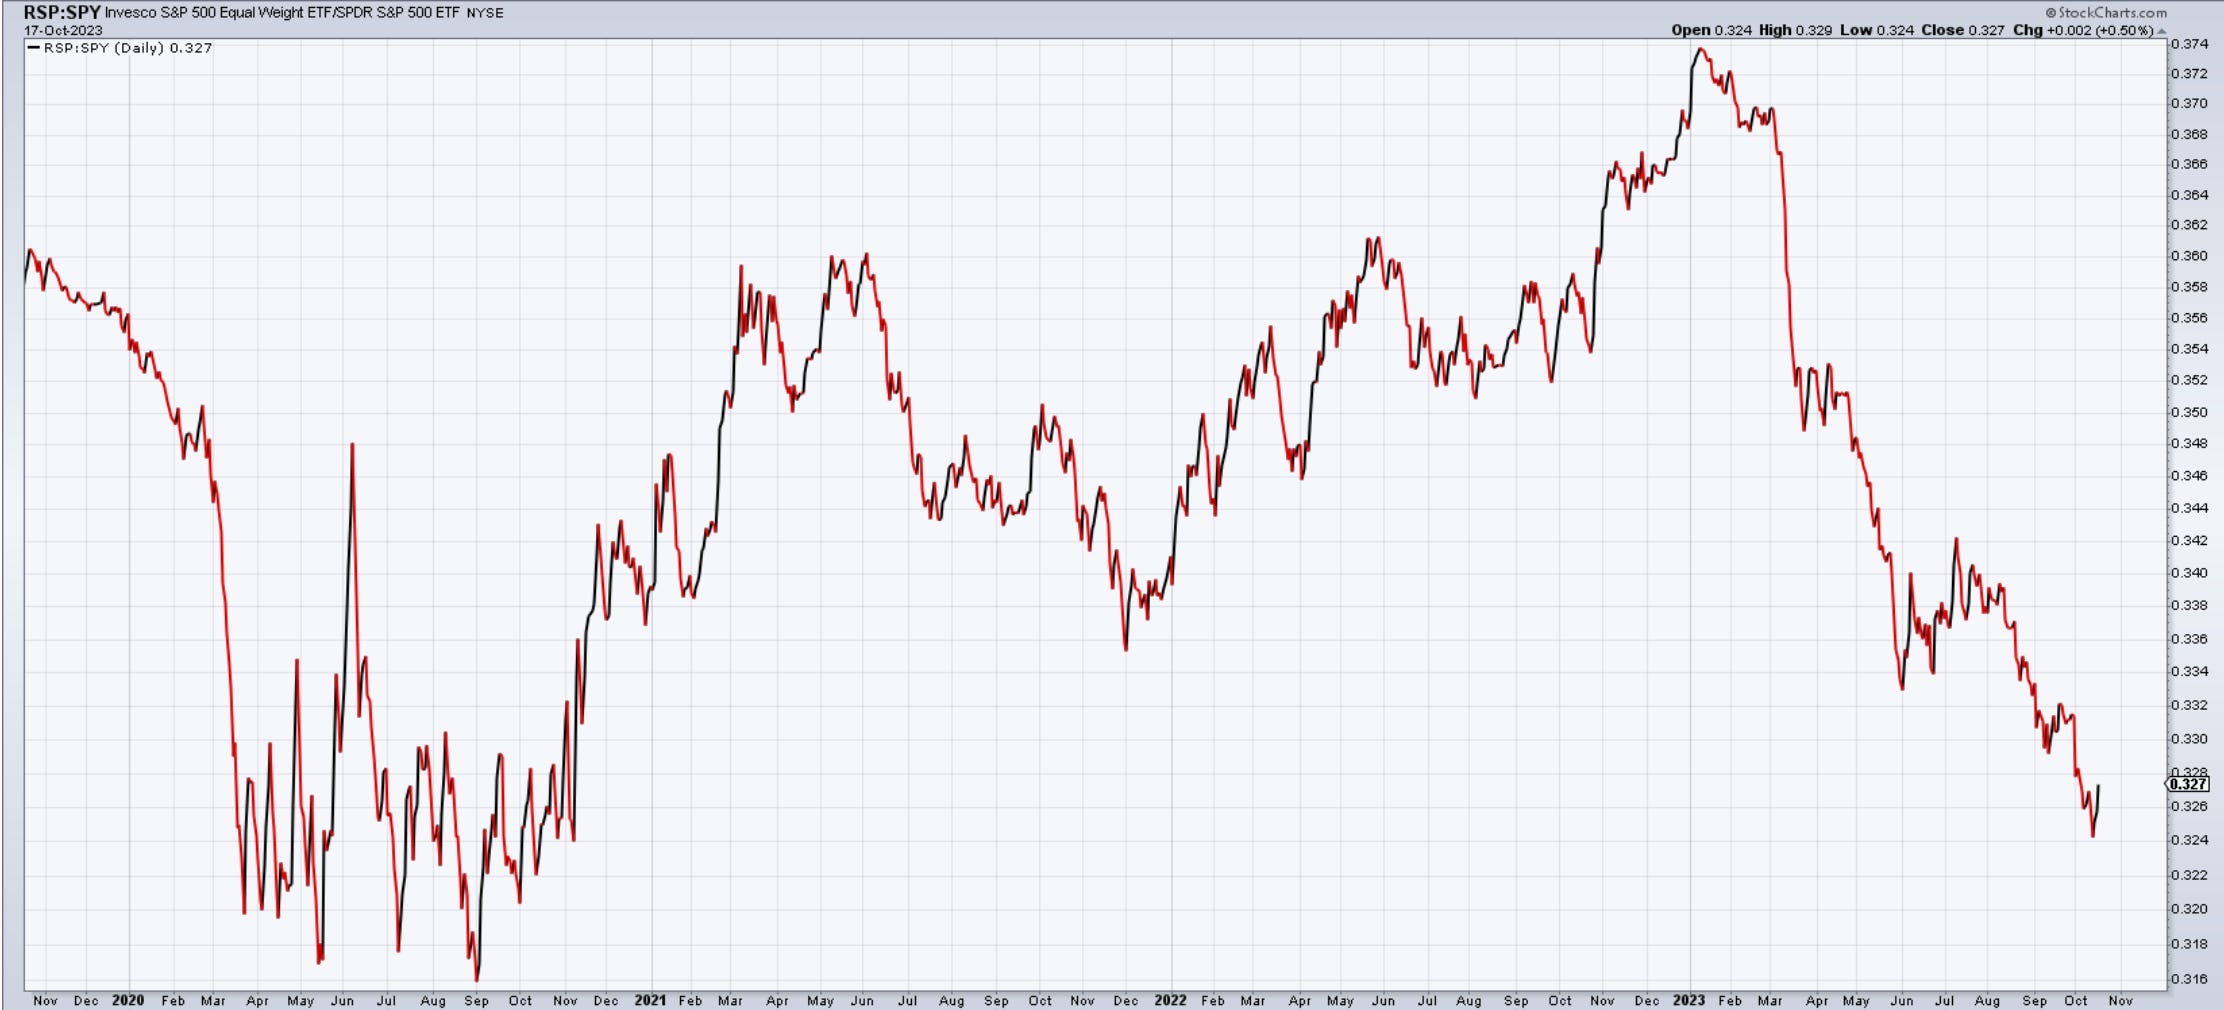
Time to look at the Equal Weight SP500 vs the Cap weight. Yes, the larger cap stocks have been outperforming which is a great thing, but if the outperformance has run its course we should get greater participation next and possibly a healthier advance.
Nasdaq100
No major changes in the Nasdaq structure, I just noticed it was a bit weaker today vs its peers. We gapped down early but closed it all up and ended up -0.33% on the day. I am still debating if we’re in wave iv or (iv) but along as we stay above 14900, the odds of moving higher are there.
Dow30
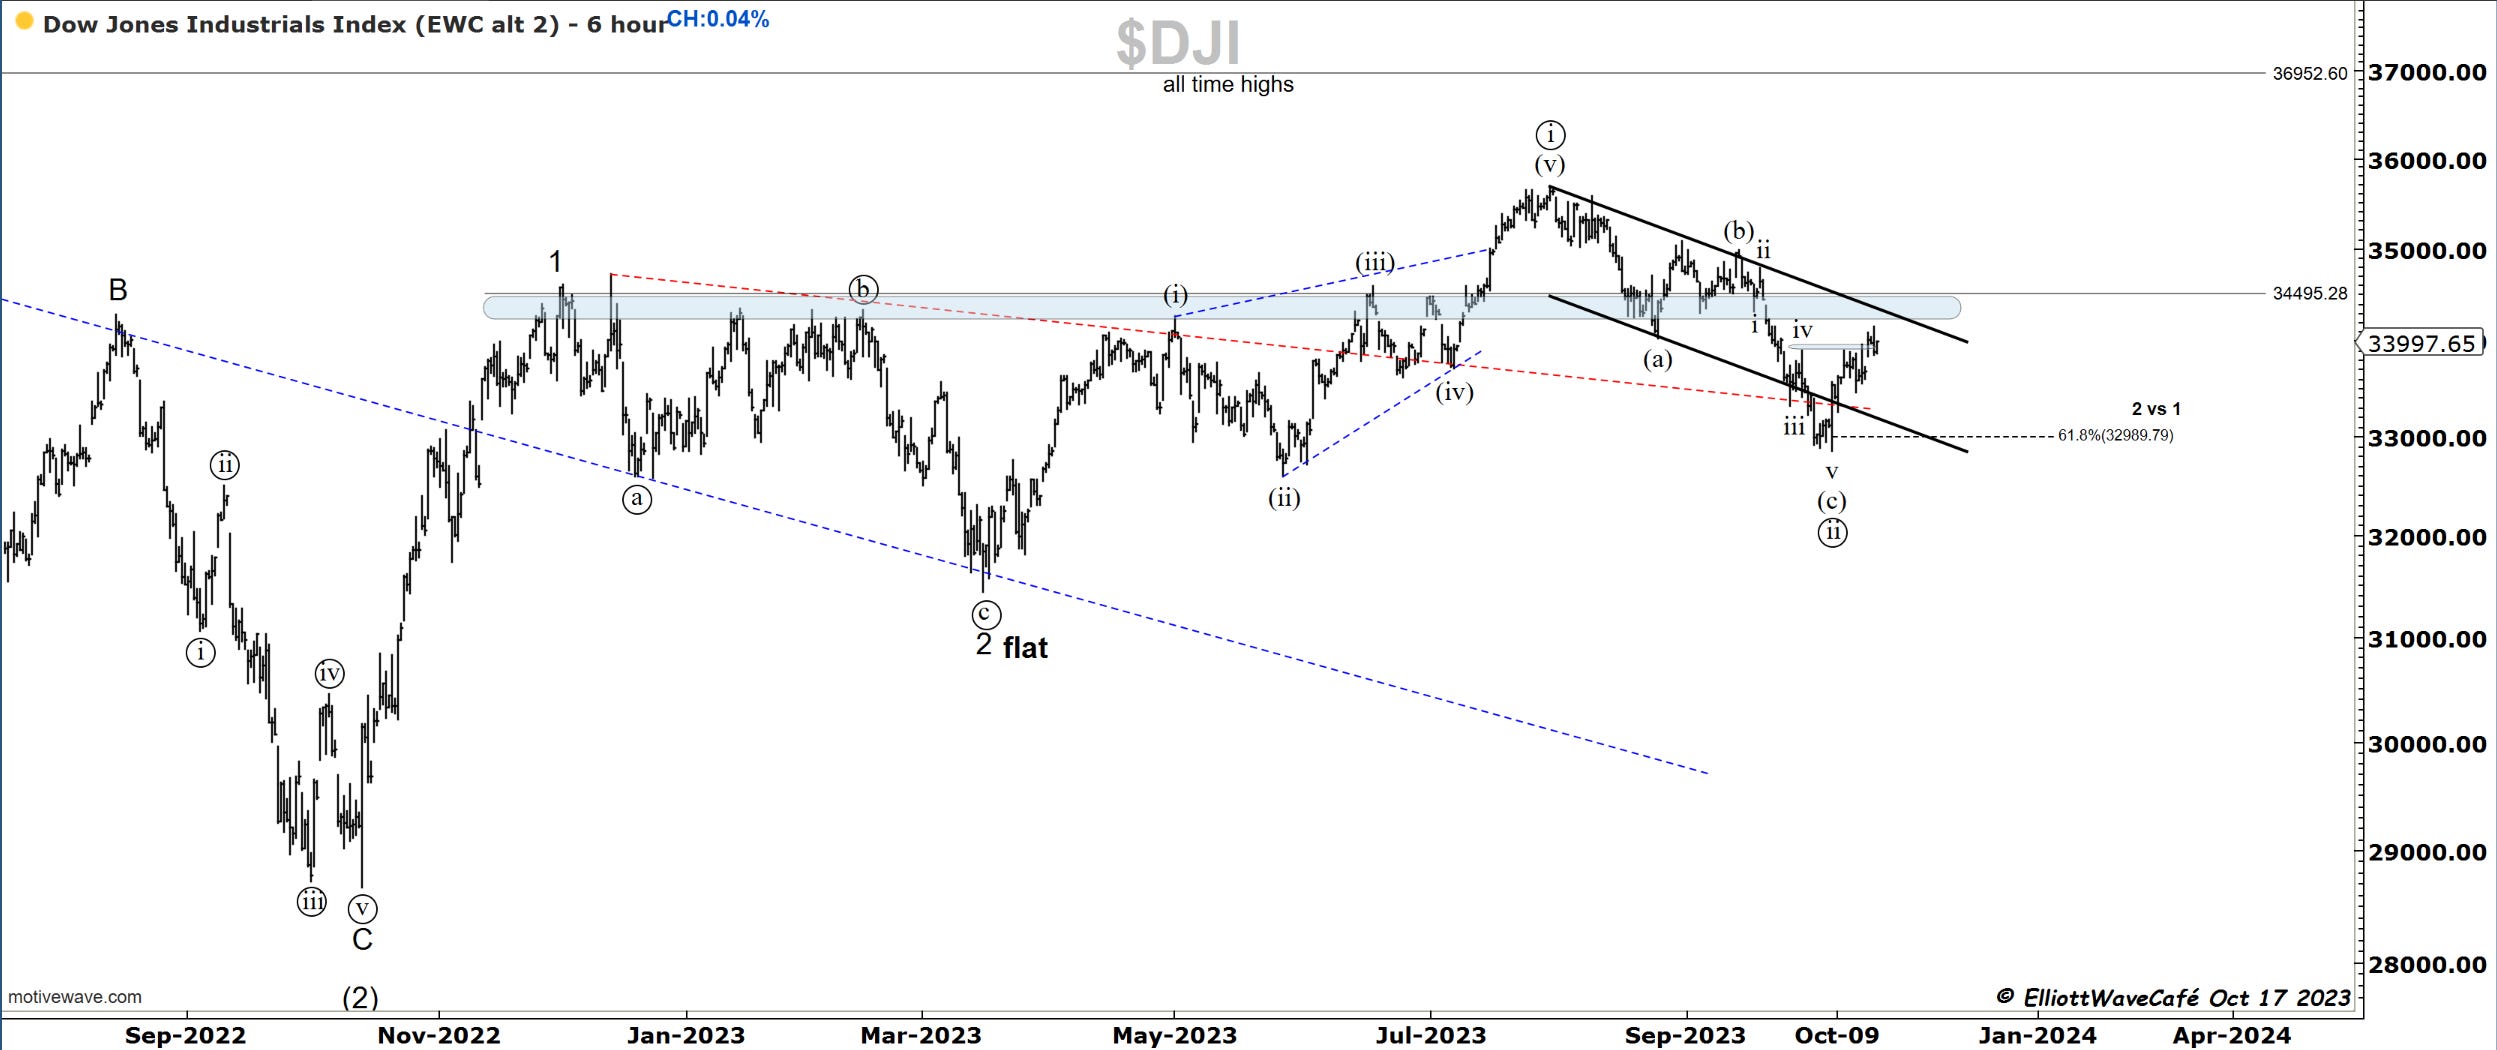
Dow held its value a bit better today ending up flat as well. The bounce from early October and overlapping with the wave (a) low continue to suggest that the odds of the selloff being corrective are high. As previously mentioned, I would like to see a crack above the strong zone of 34,500 to get the train moving in an upward direction.
US Dollar
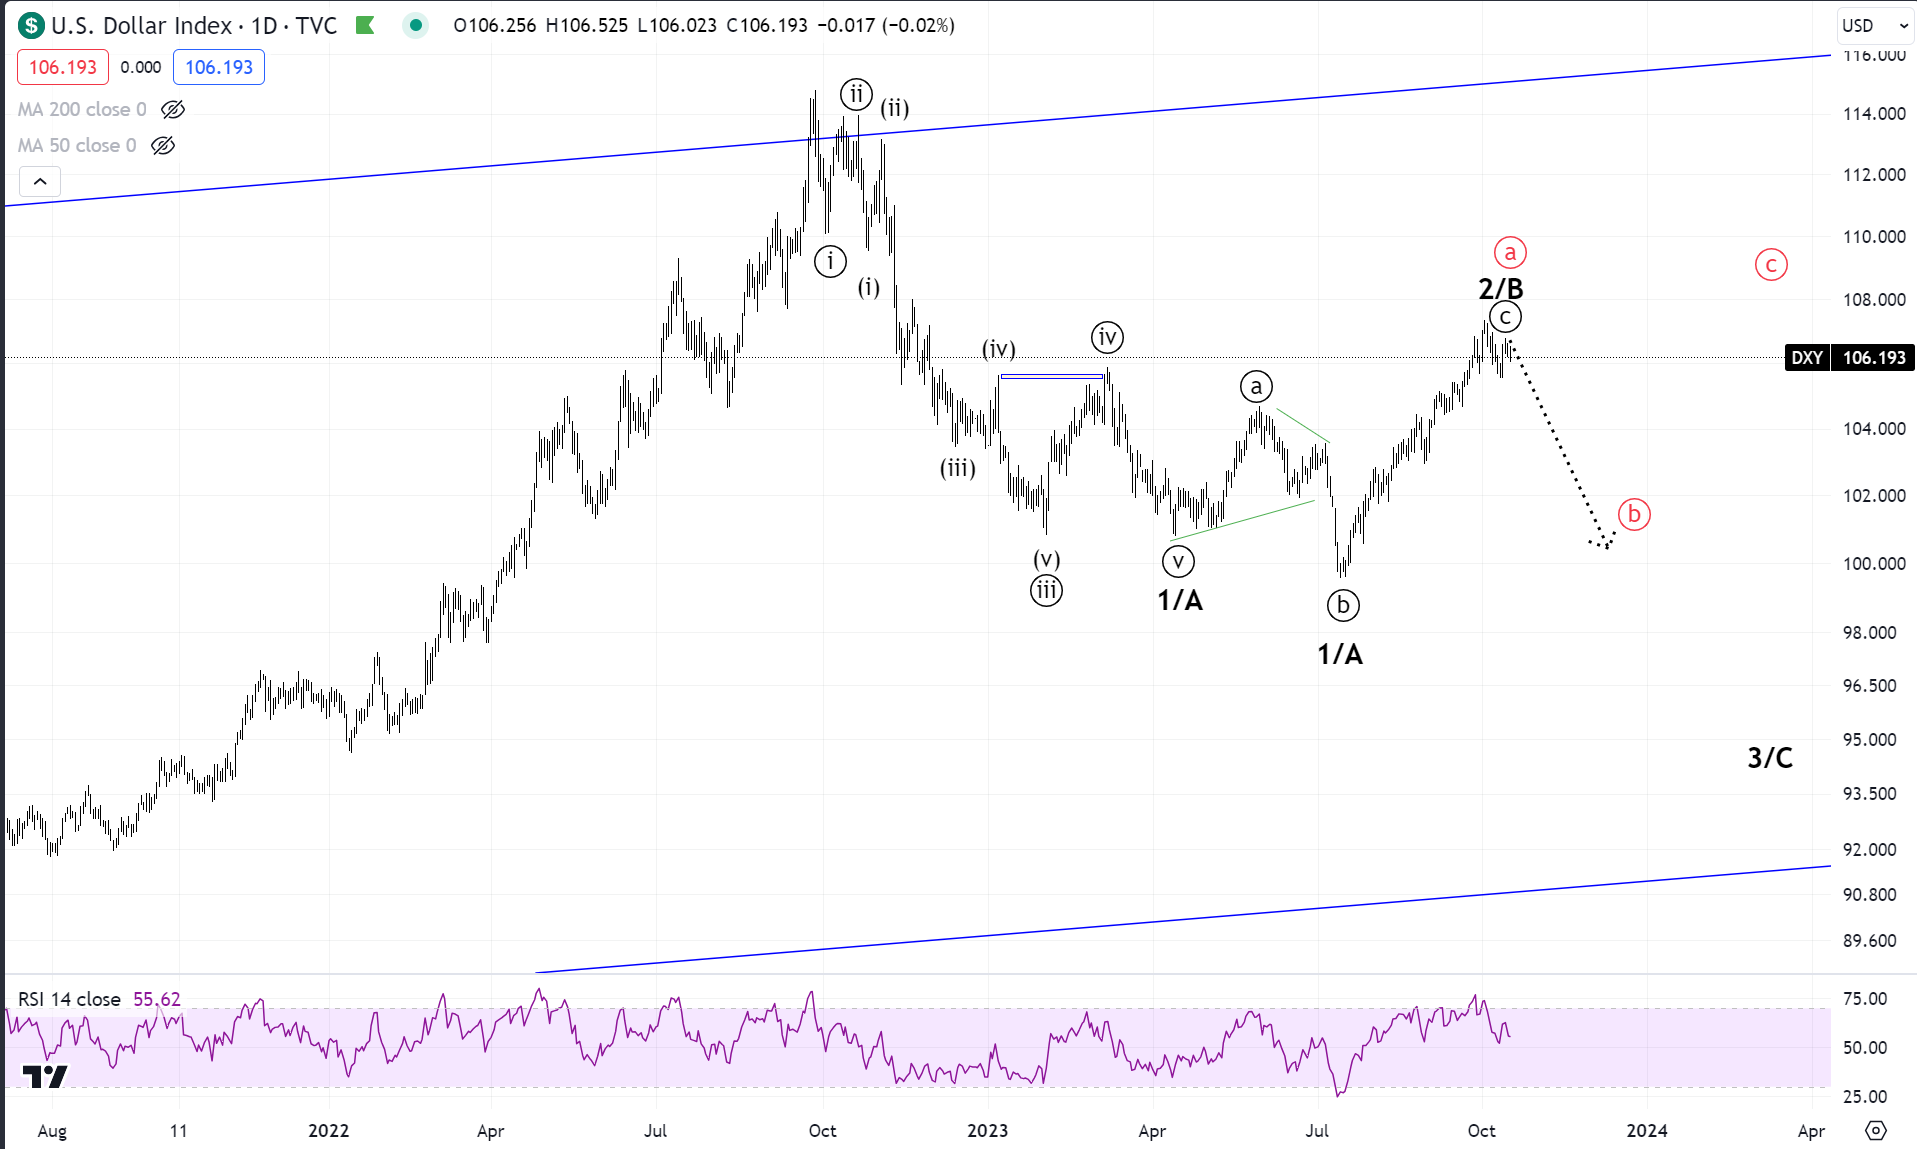
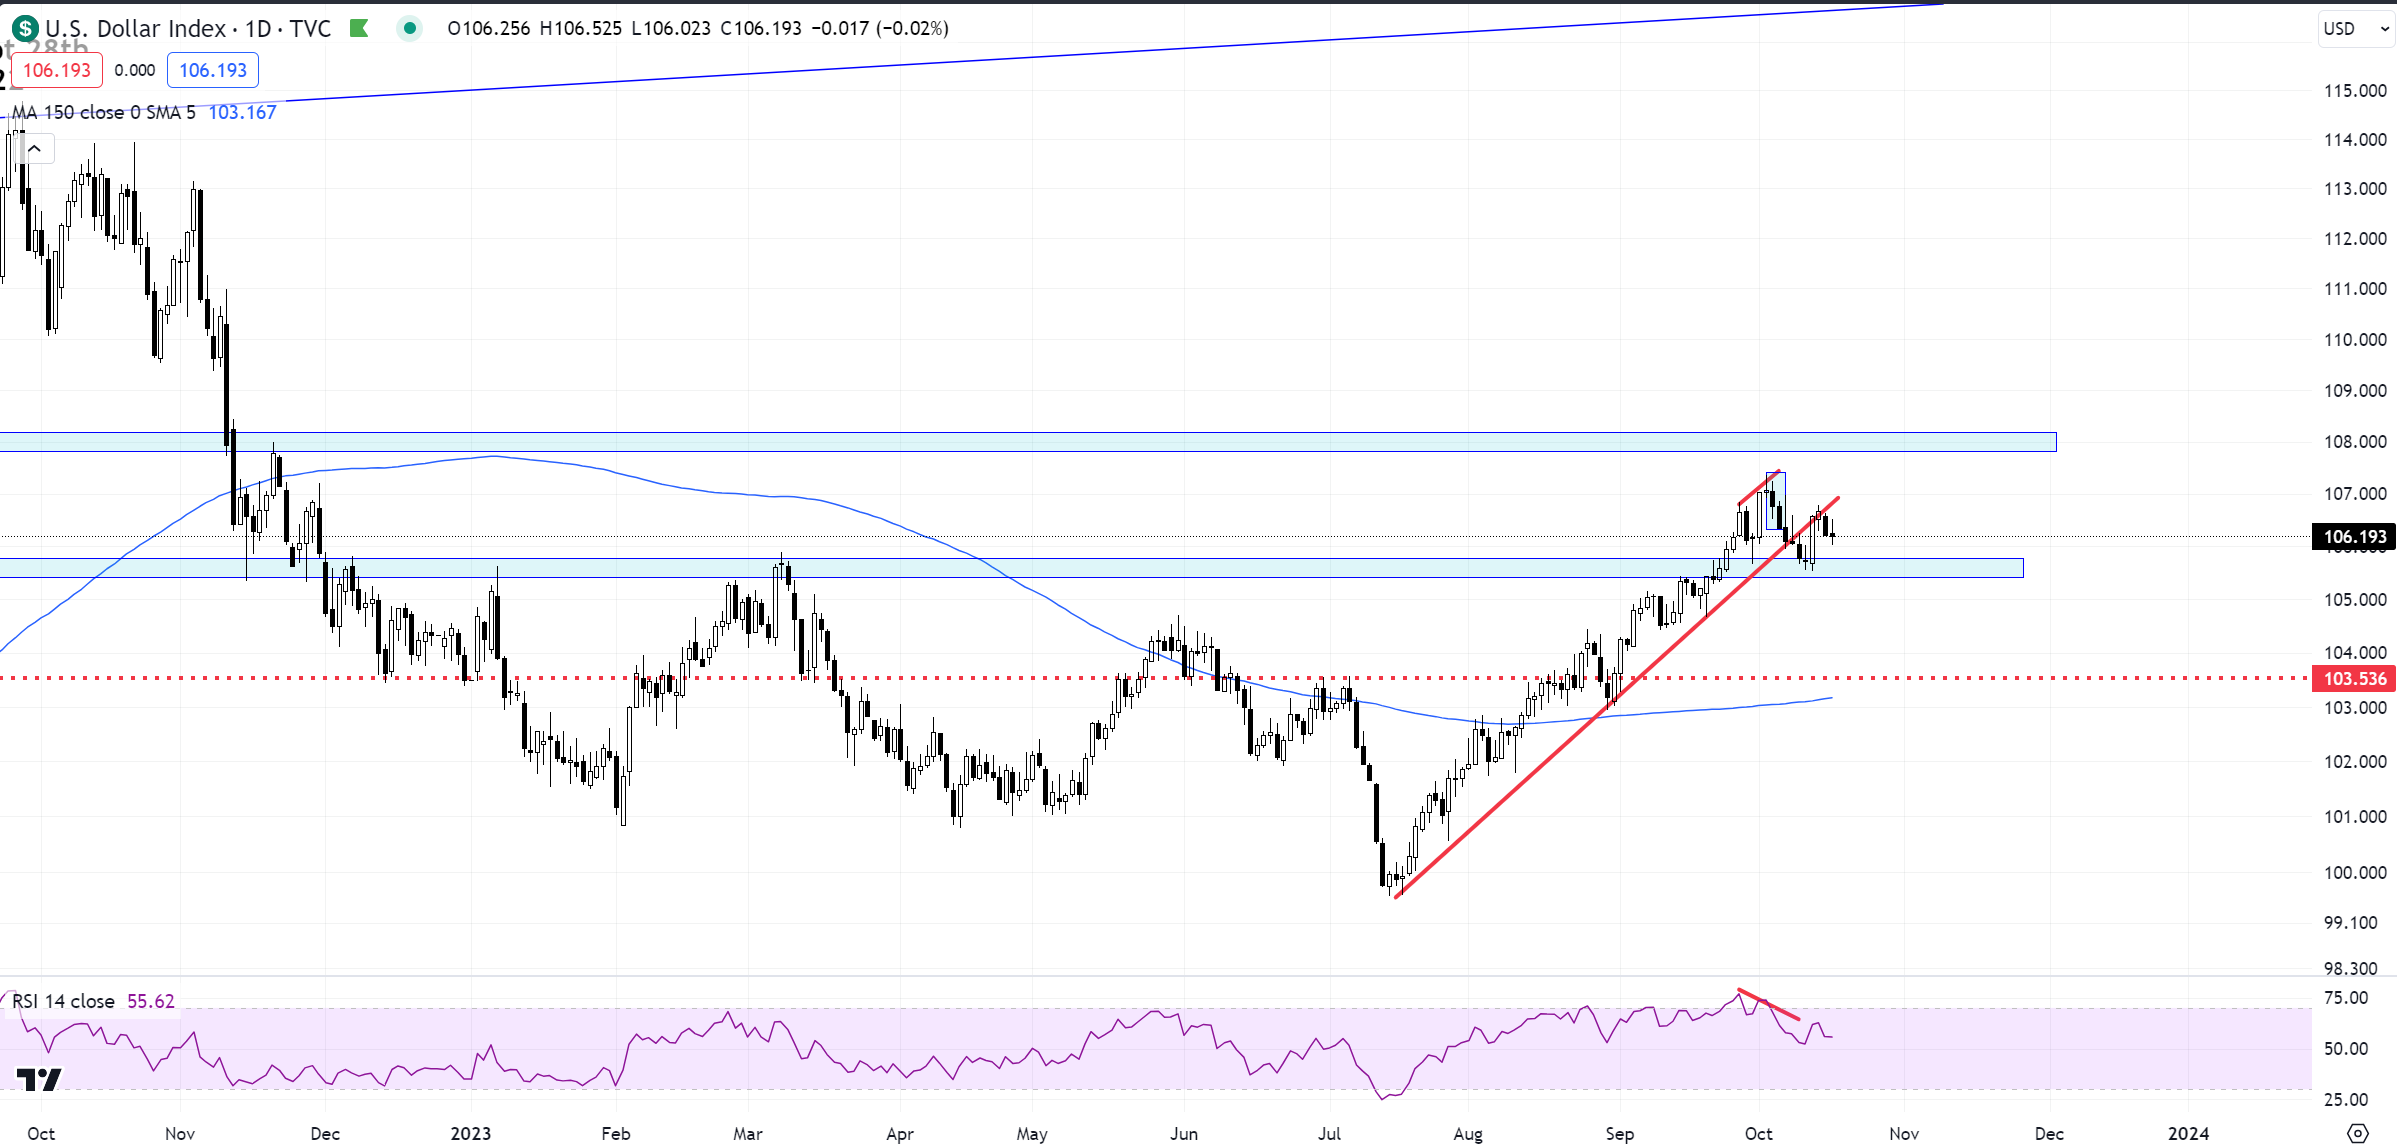
The yields have made another attempt at the highs, but the dollar was muted. There is a small break in correlations here even with the equities. Someone is not following along, and it’s a quiet whisper for now. We need to pay attention. Prior comments stand.
The dollar tried to rally but was rejected just as it was trying to get back above the broken trendline. Usually that means a retest and the move lower will resume. There is a small head and shoulders as well on the price structure. If we can get below 105.50, the selling will accelerate and provide a boost to risk on assets. ( stocks, crypto, emerging markets).
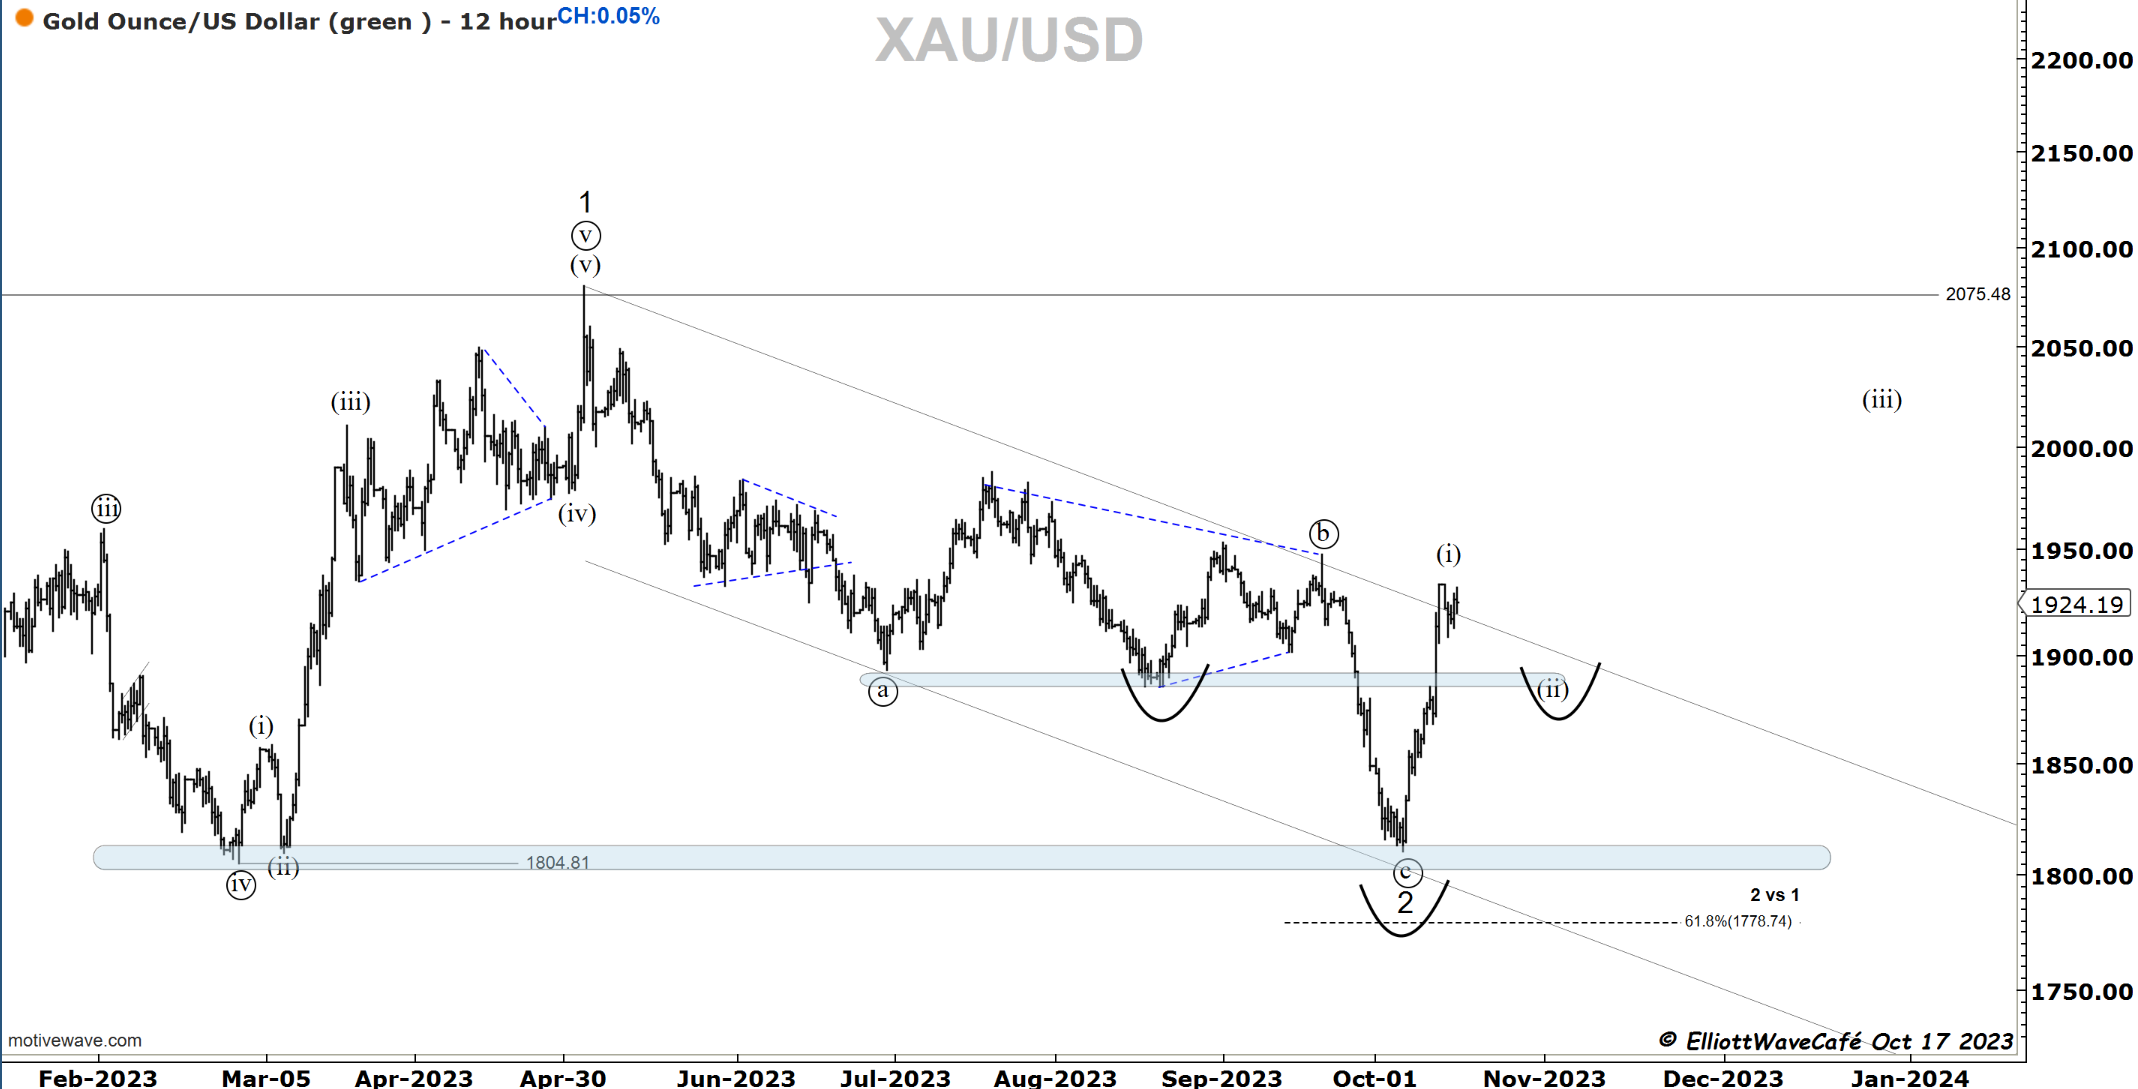
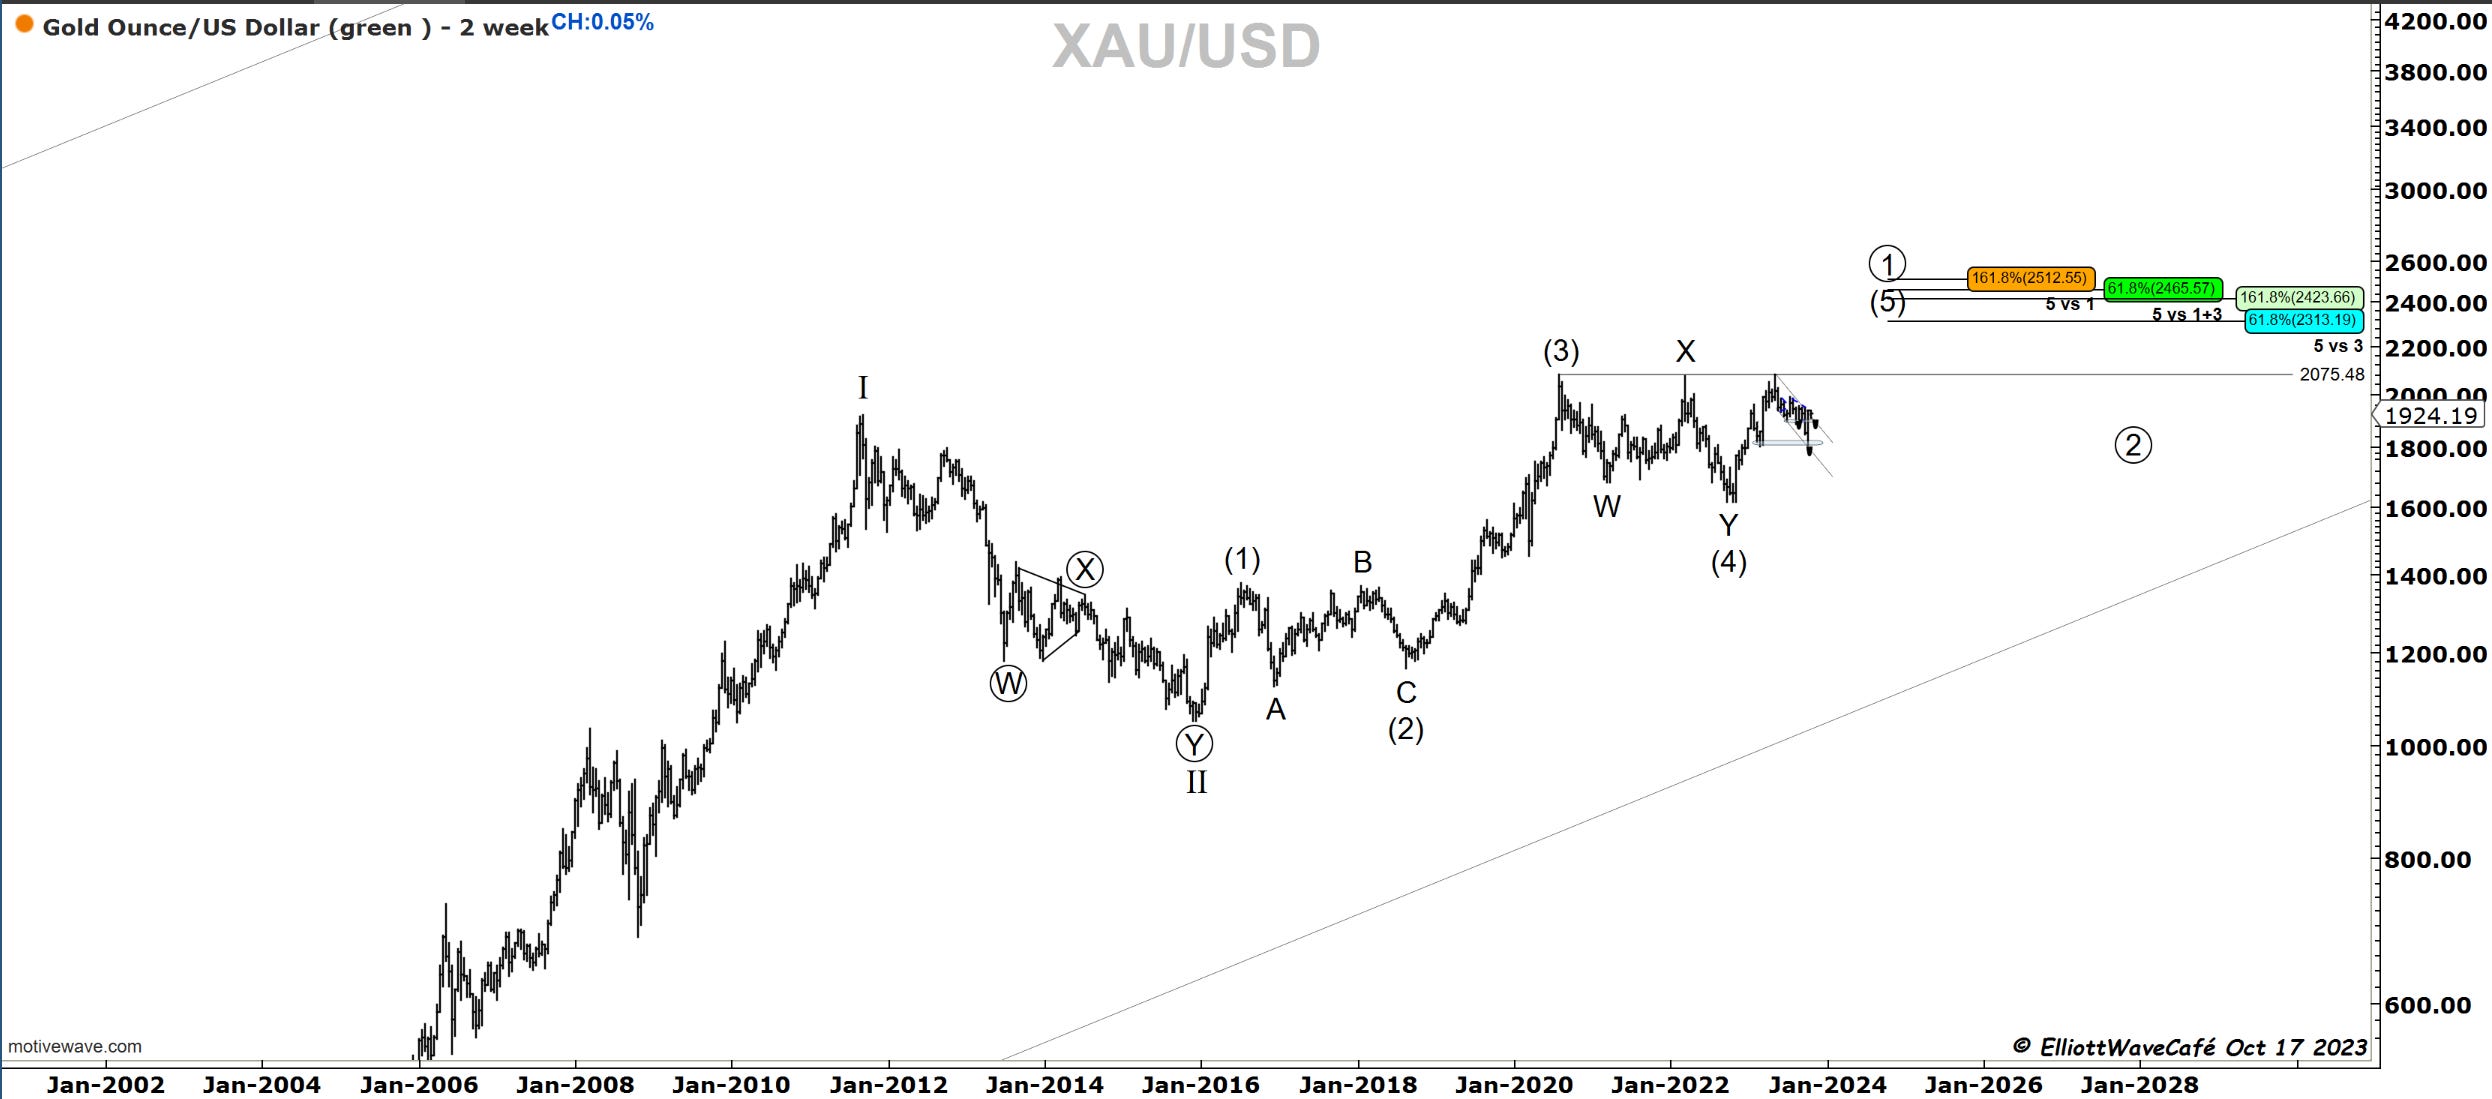
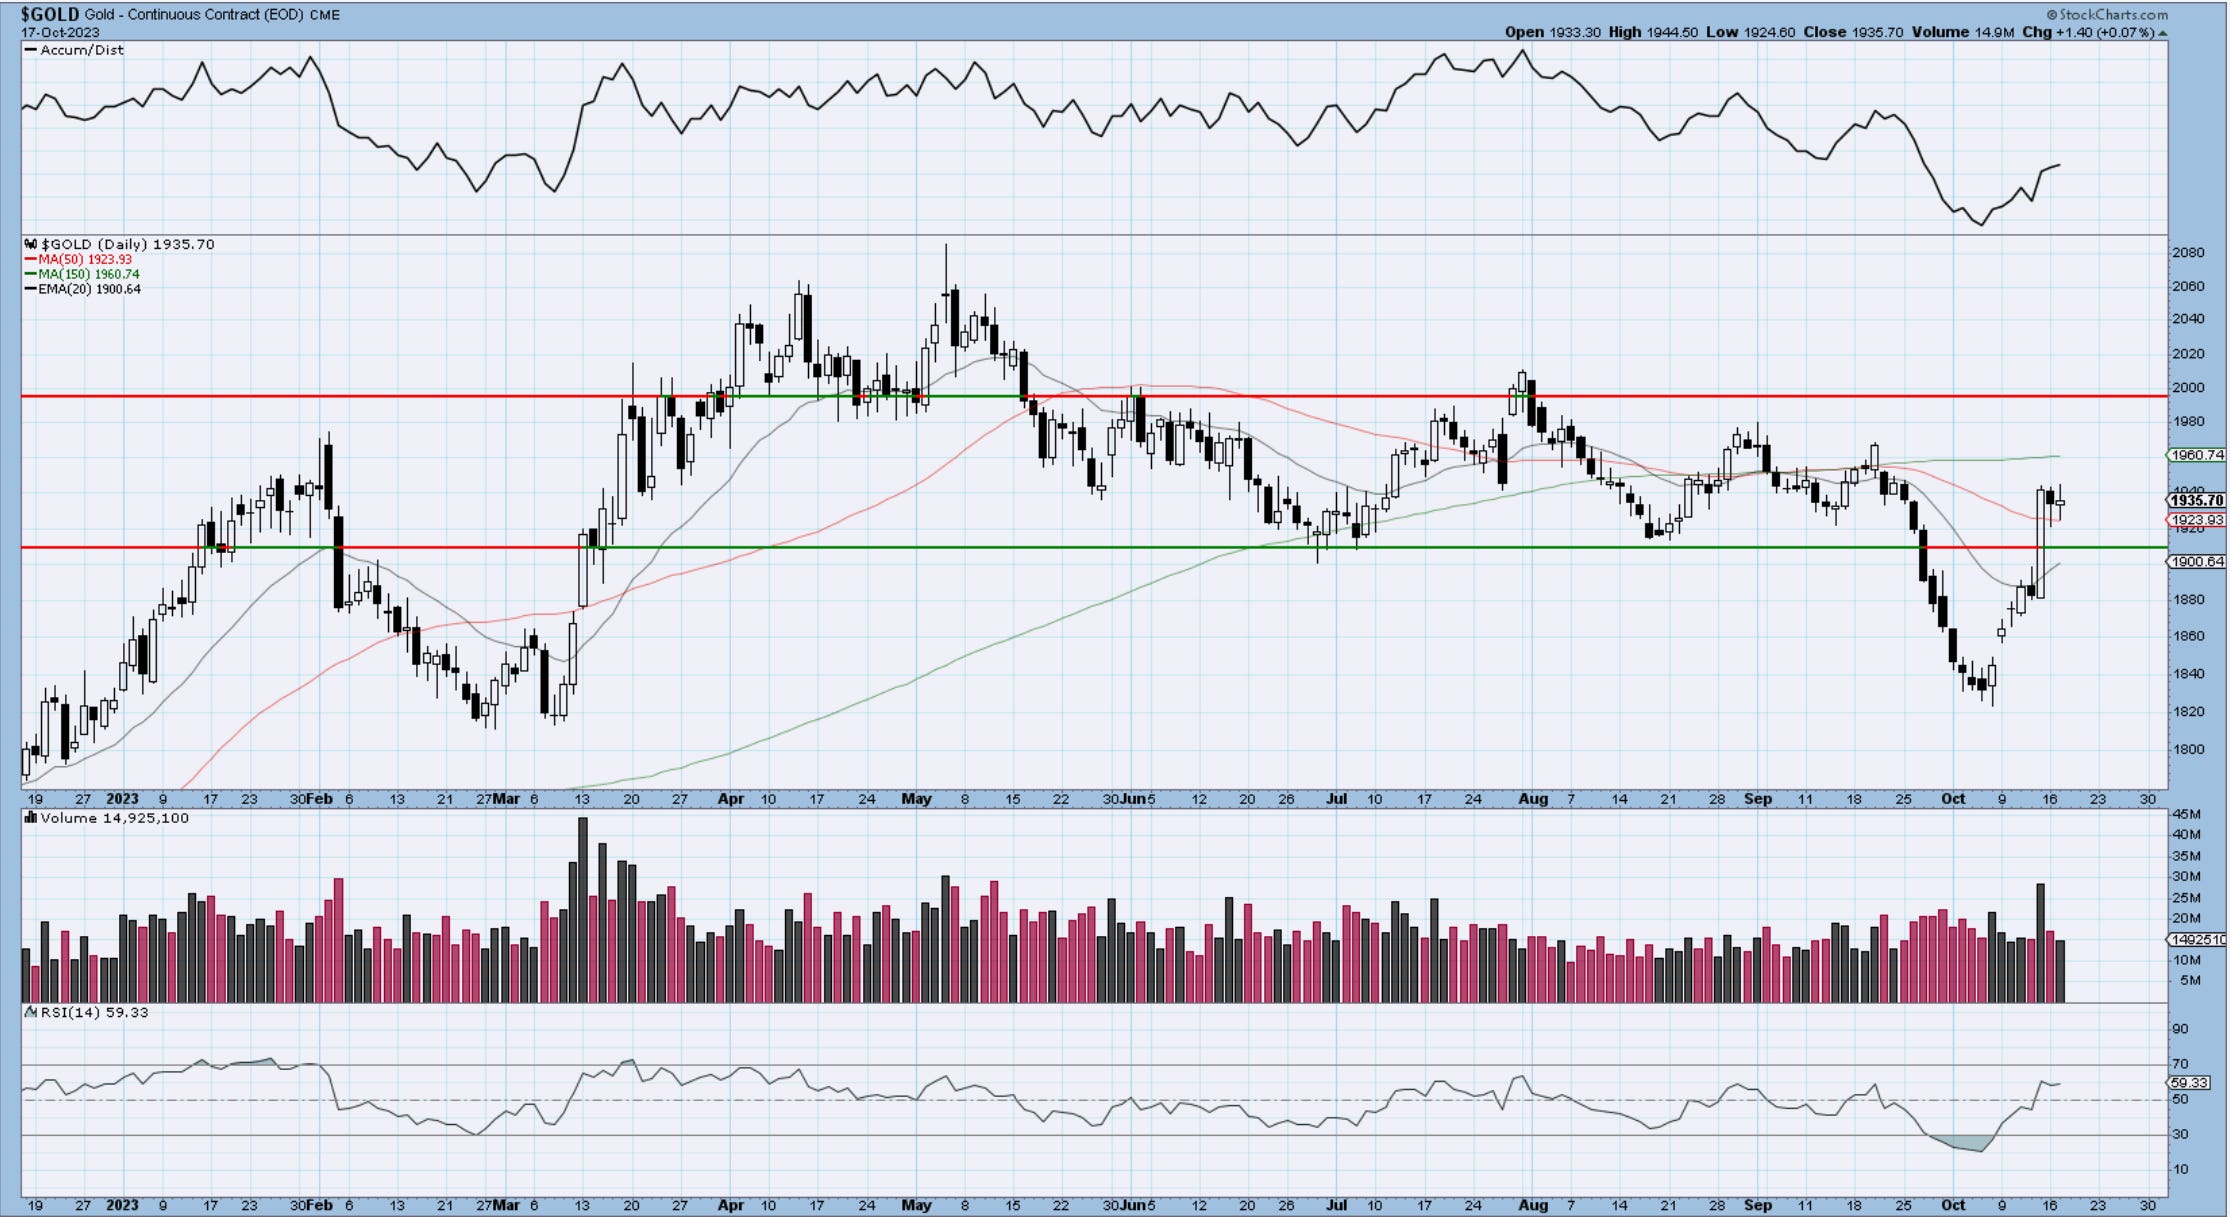
Gold
Gold is stalling up here and the expectation is for a throwback in wave (ii). Ideally would remain above 1885, but 2nd waves usually tag 61.8%. That sits at the 1850 zone. 2nd chart shows the larger proposed count in Gold. Let’s see if 2024 is the year that gold breaks 2000 with conviction. Eyes on dollar, yields and any fed cutting rates up the road.
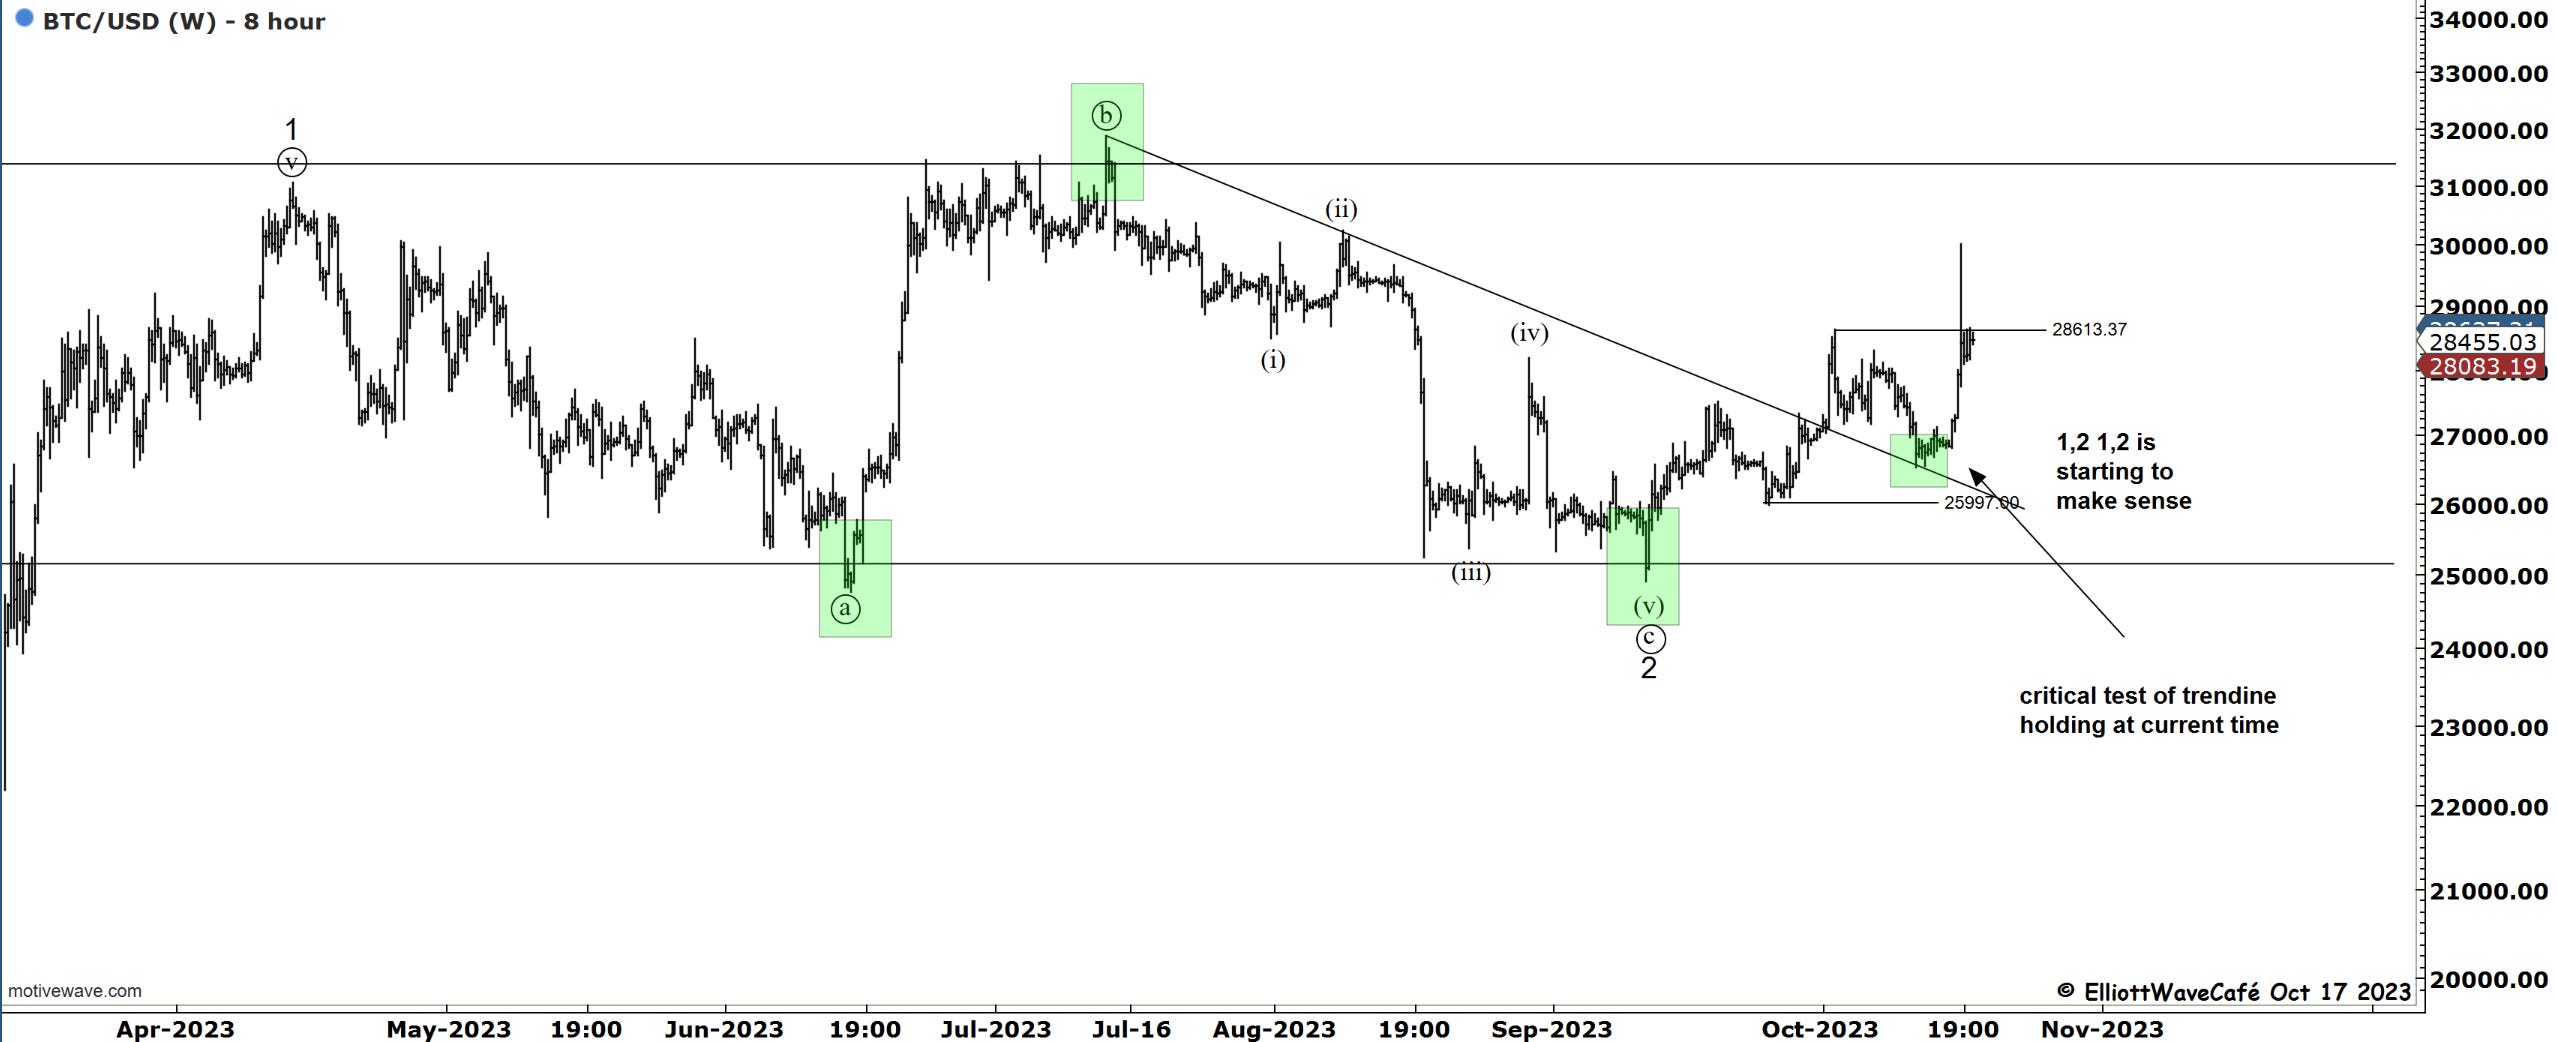
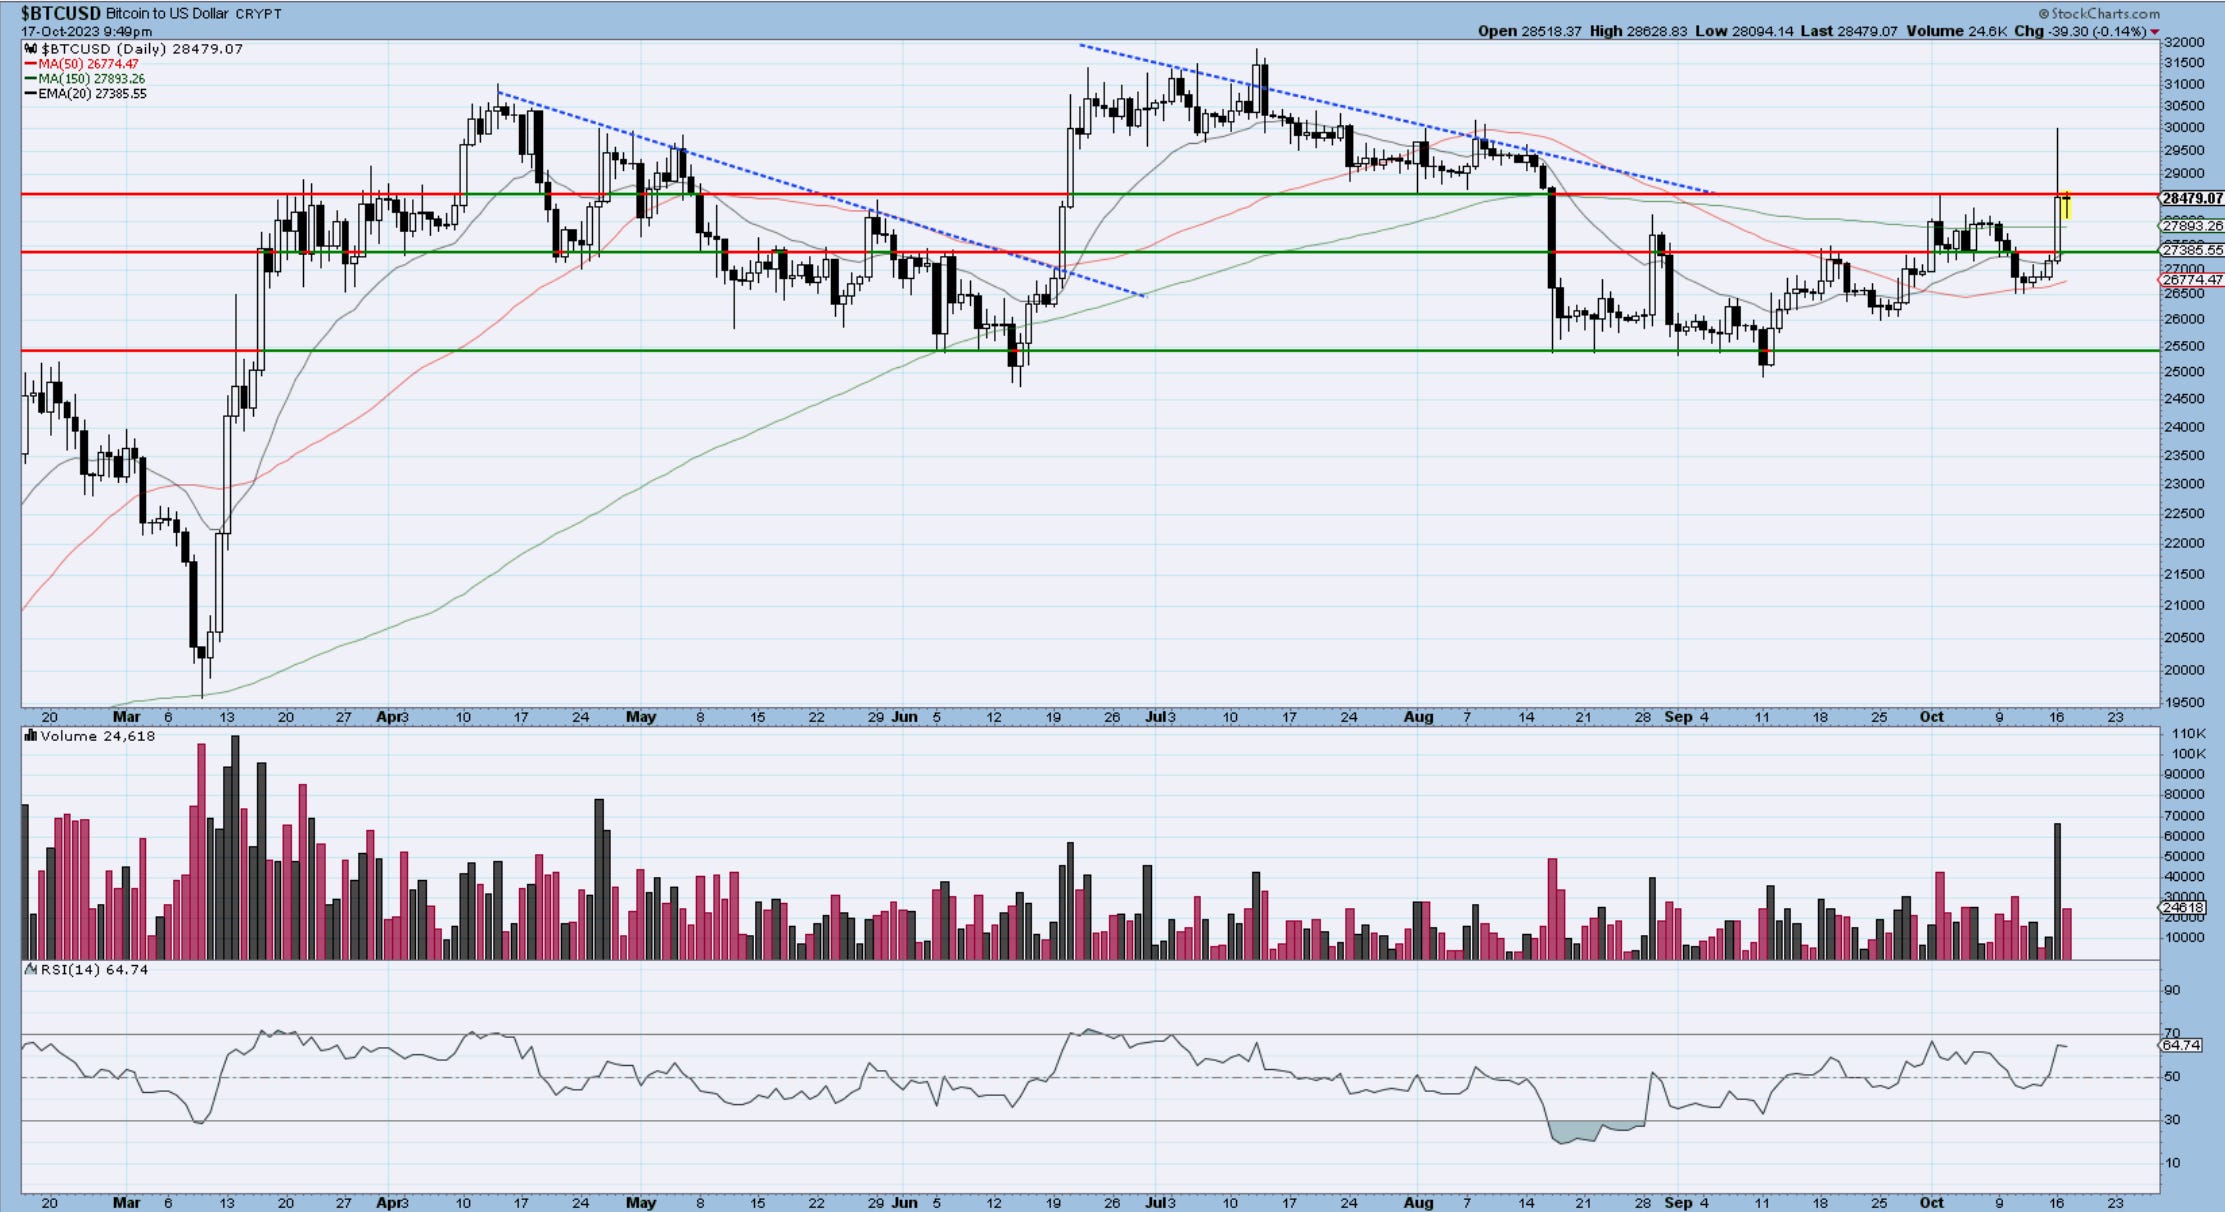
Bitcoin
previous BTC comments stand, no price changes, however holding here it’s a good sign for further continuation. 1,2 1,2 setup requires the market to trend and move. Will see how we behave over the next several days but as time is ticking this market is required to move higher. A couple of daily closes above 28,600 would be ideal.
Bitcoin held well the retest of the broken trendline and eliminated the 3wave risk mentioned in prior updates. The 26k zone was never taken out and instead, we spiked higher towards 30k. It was a news-induced event, but whatever caused it, the reality on the chart remains that we had an explosive move higher characteristic to a 1,2 1,2 setup.
Short of a complete reversal of current price action, which is always a risk, a trader who does not read the news, would expect a continuation higher based on the chart and count setup. I would use 26,500 as defense and not a penny lower. Anything below those levels would indicate a high probability of a completed reversal lower. It is the bulls job now to continue bidding on this and proving that the breakout is real and worth considering. I will be personally waiting and watching how they behave here and even if I join higher, it’s a price I am willing to pay for a bit more assurance.
My latest BTC video update is on you tube and you can check it out here
Daily video coming up next,
See you tomorrow- trade well,
Cris
email: ewcafe@pm.me