
The Daily Drip
Core markets charts updates and commentary
Note: The counts on the right edge are real-time, and they are prone to adjustments as price action develops. Elliott Wave has a fluid approach, is evidence-based, and requires constant monitoring of certain thresholds.
In the counts below, this (( )) = circle on chart
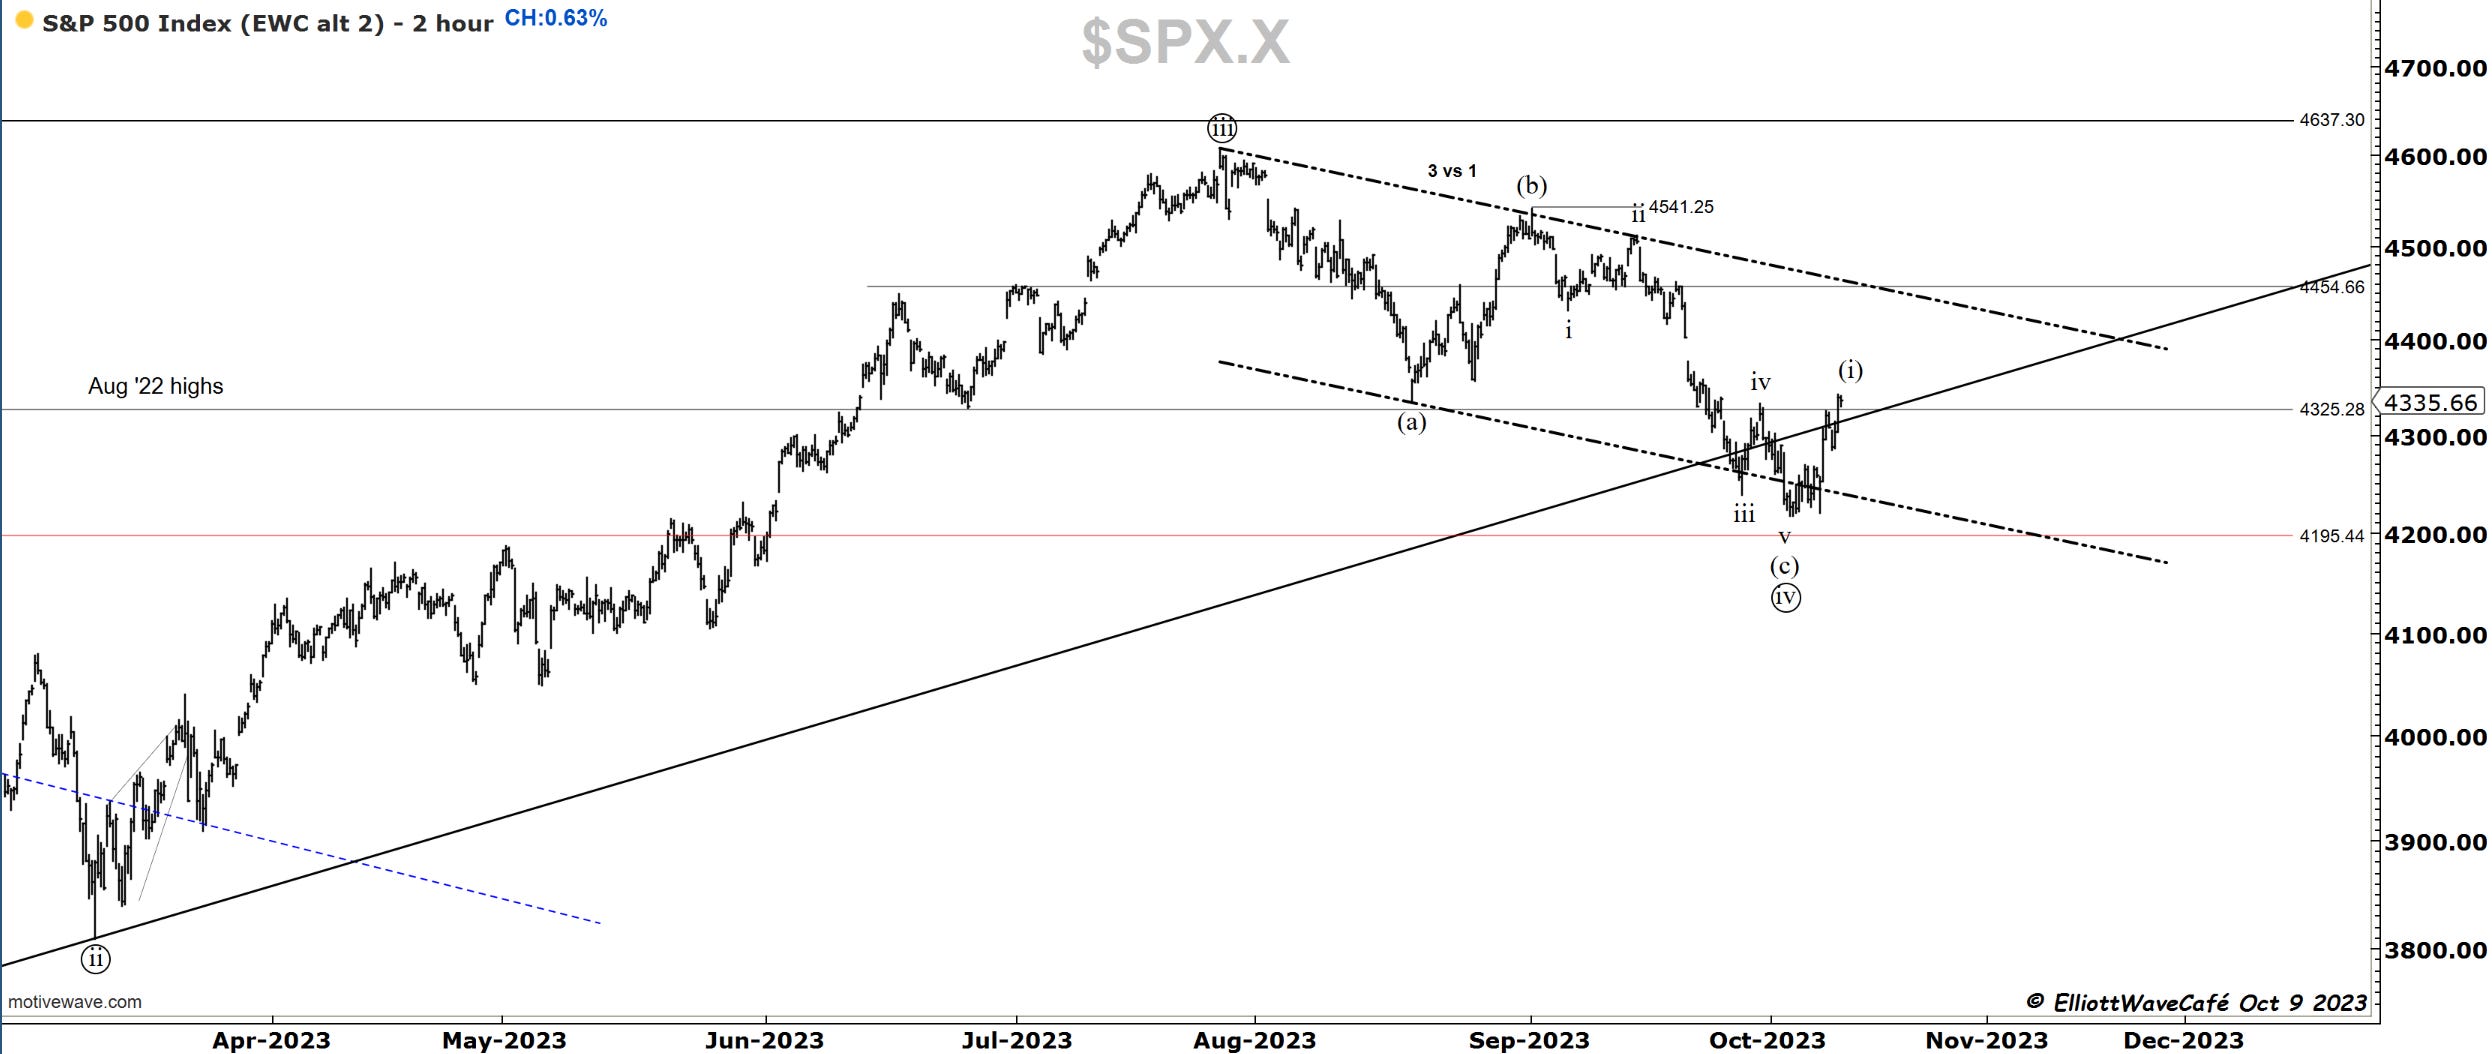
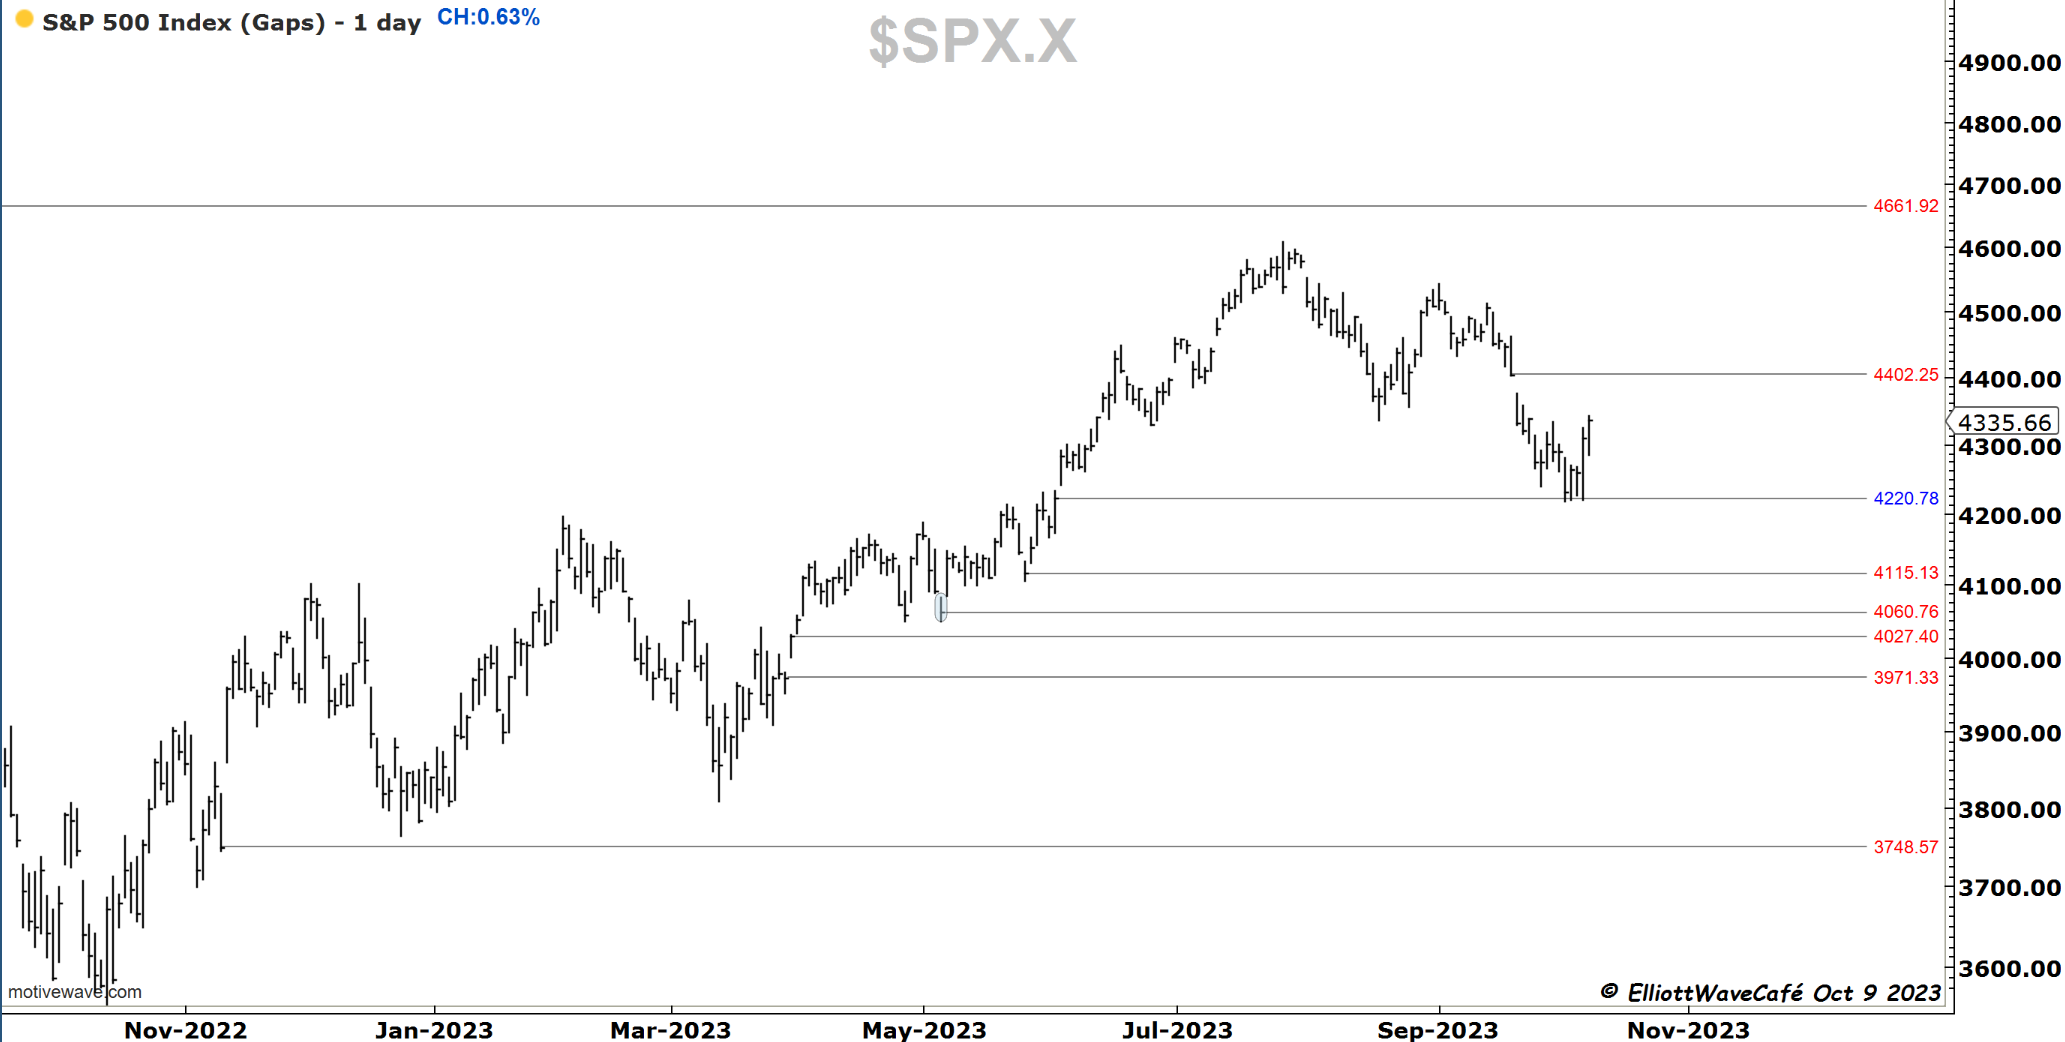
SP500
The market rallied +0.63% today after a gap down following the weekend events. Bids that came in, align with my thinking from last week that lows were nearby and we were due for some strength. The move of the lows is an impulse, and I don’t think is part of a flat in iv but rather the start of the next motive wave higher in wave ((v)). There are obvious resistance levels that need to be surpassed, and of course, it won’t happen in a straight line. But dips should be right to get bought for higher prices. A loss of 4200 for at least a few days opens another can of worms that we will address if and when it happens.
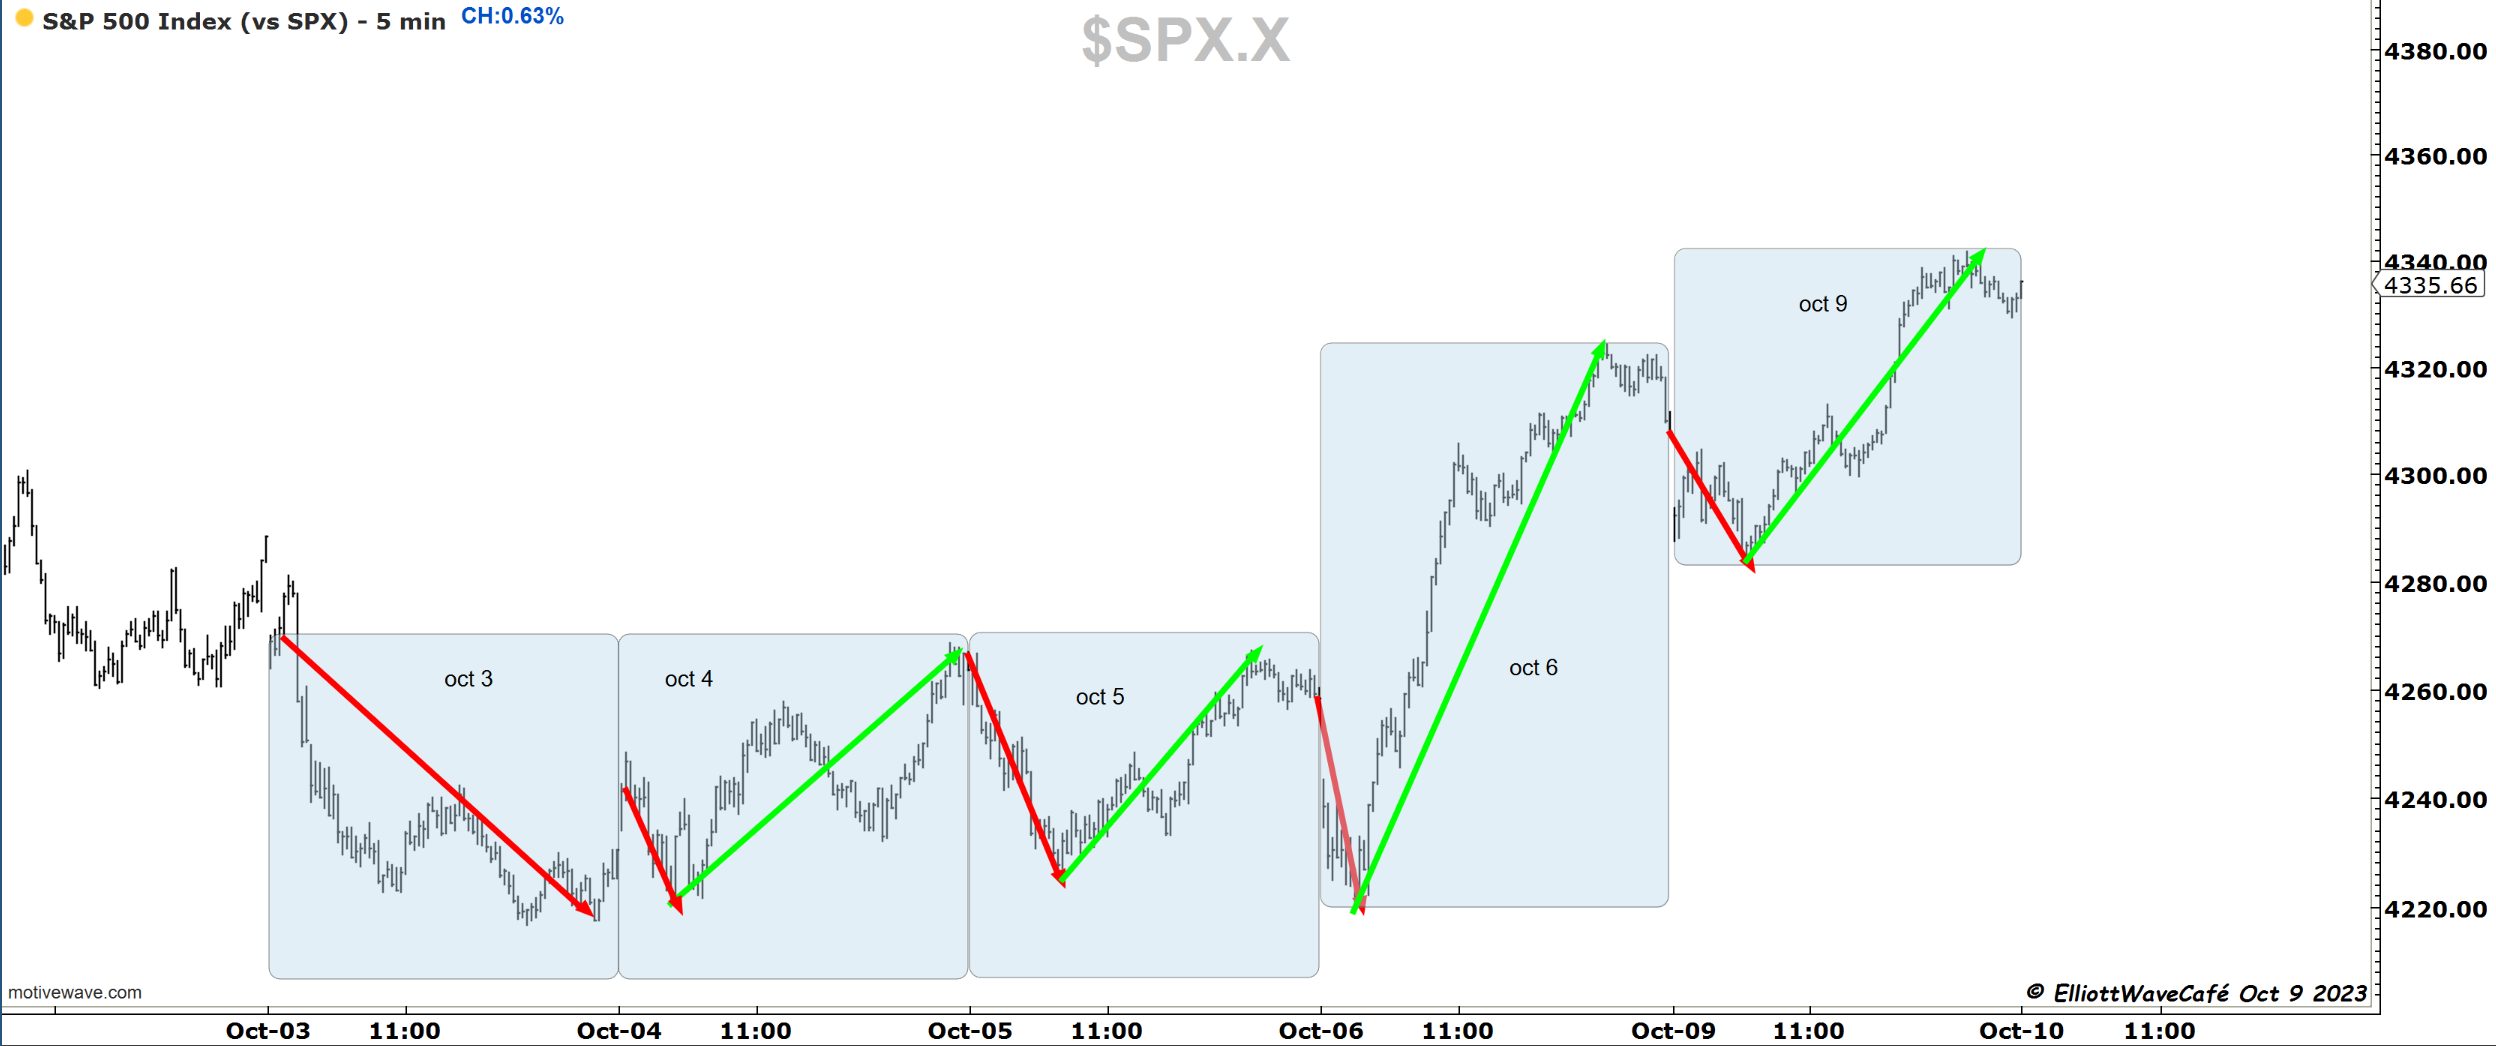
The small trader fear manipulation continues in the early morning, followed by buying for the rest of the day, with profit-taking as we close the sessions.
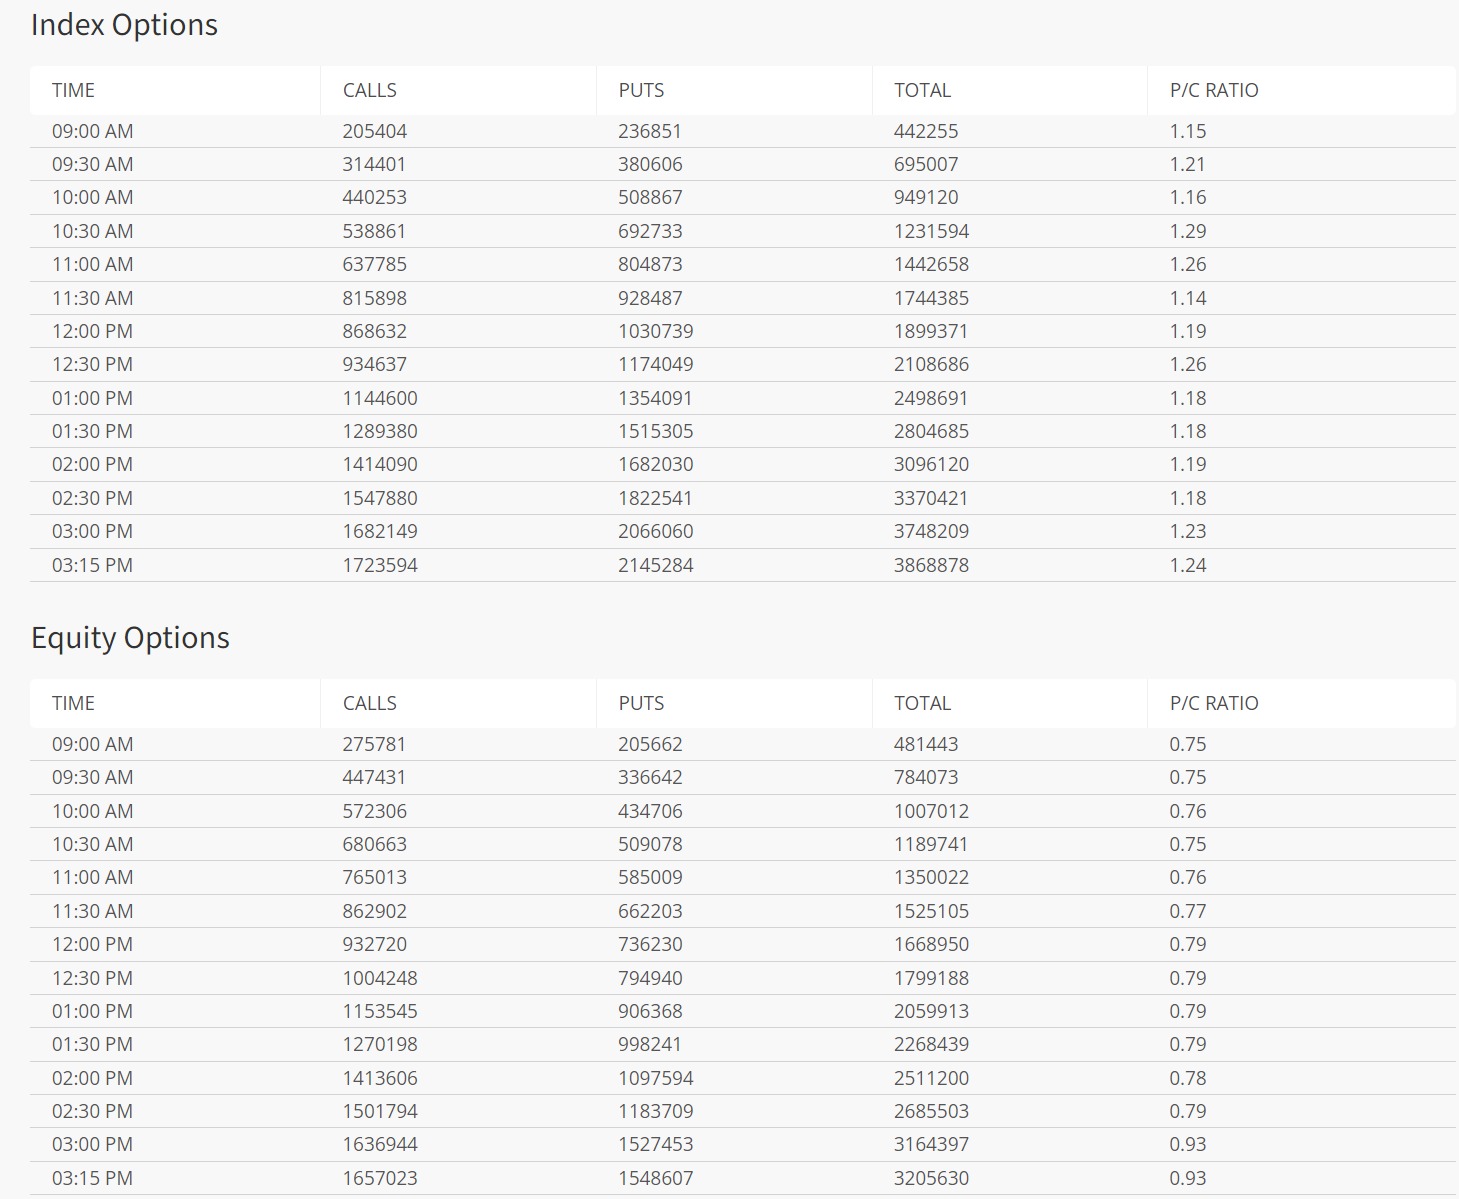
Both Index and Equity option’s P/C ratios continue to show heavy put-buying, pretty much throughout the day, exposing a bearish market positioning. I think this should fuel further upside.
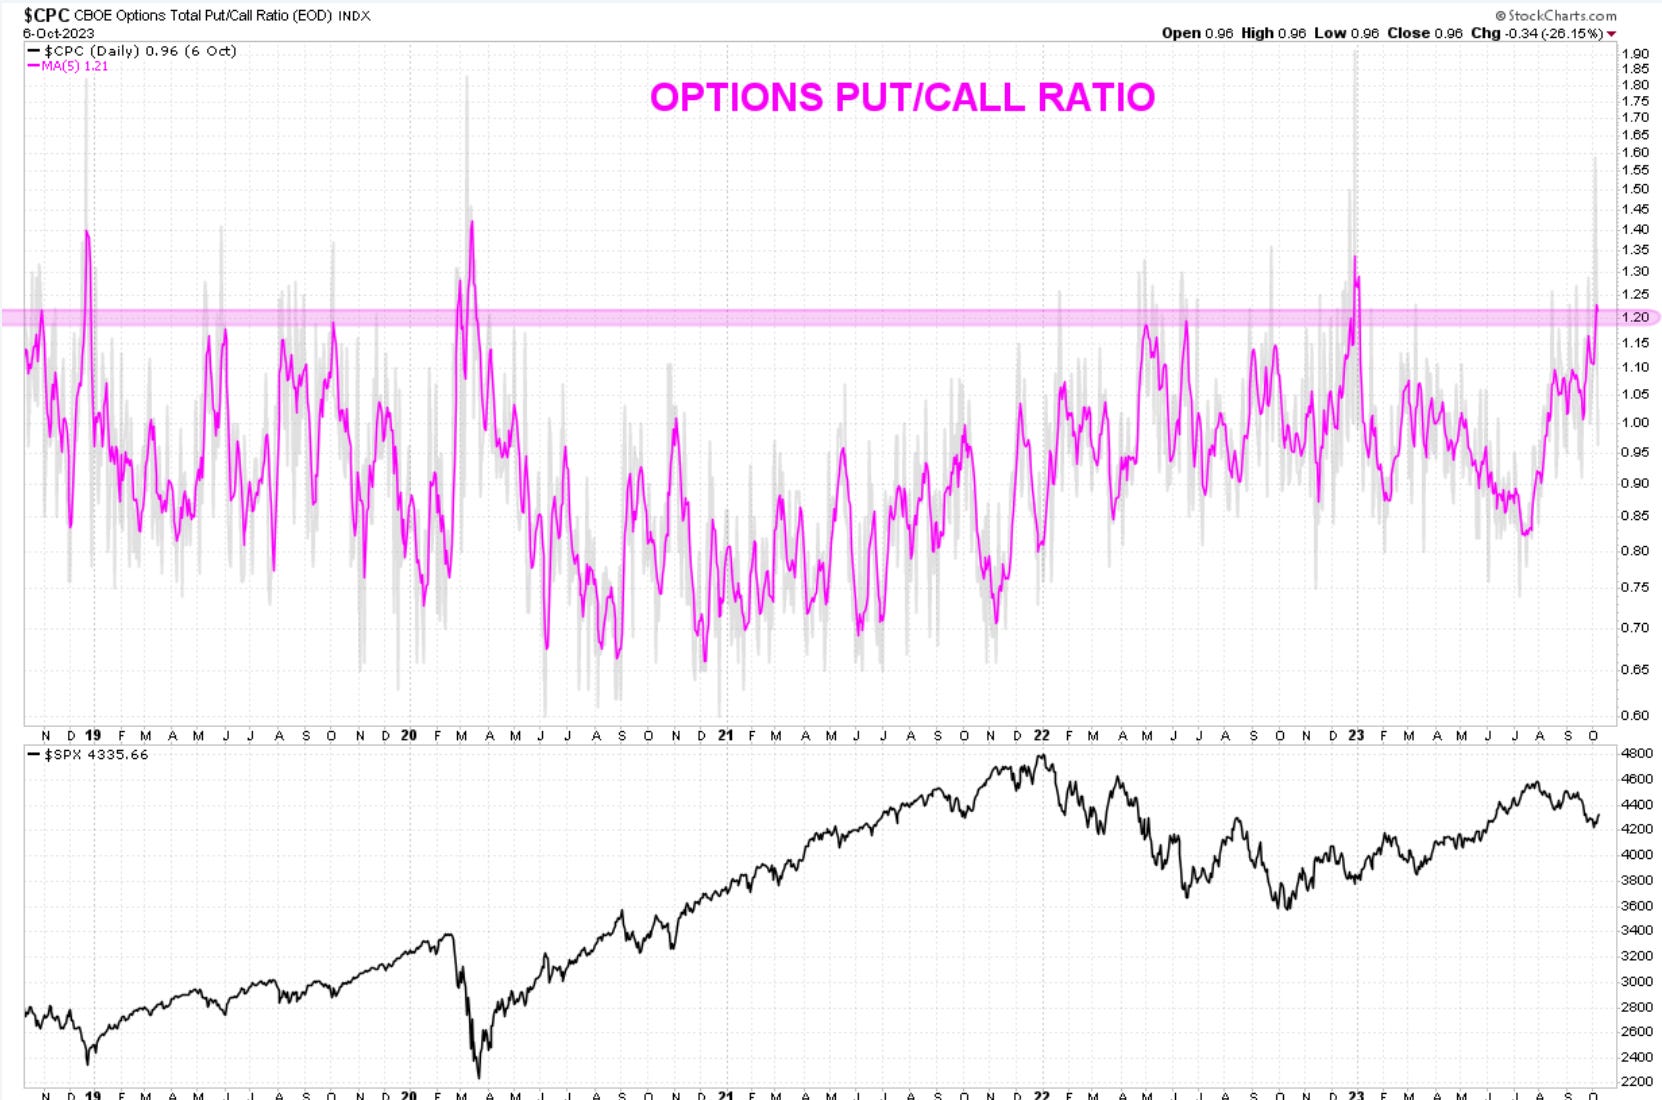
To give overall context to this sentiment reading, take a look at a 5-day MA and the levels it tends to react to. It usually helps markets form a bottom.
Here are the unfilled gaps in SP500 since about Nov 2022. 4402 should be magnet nearterm.
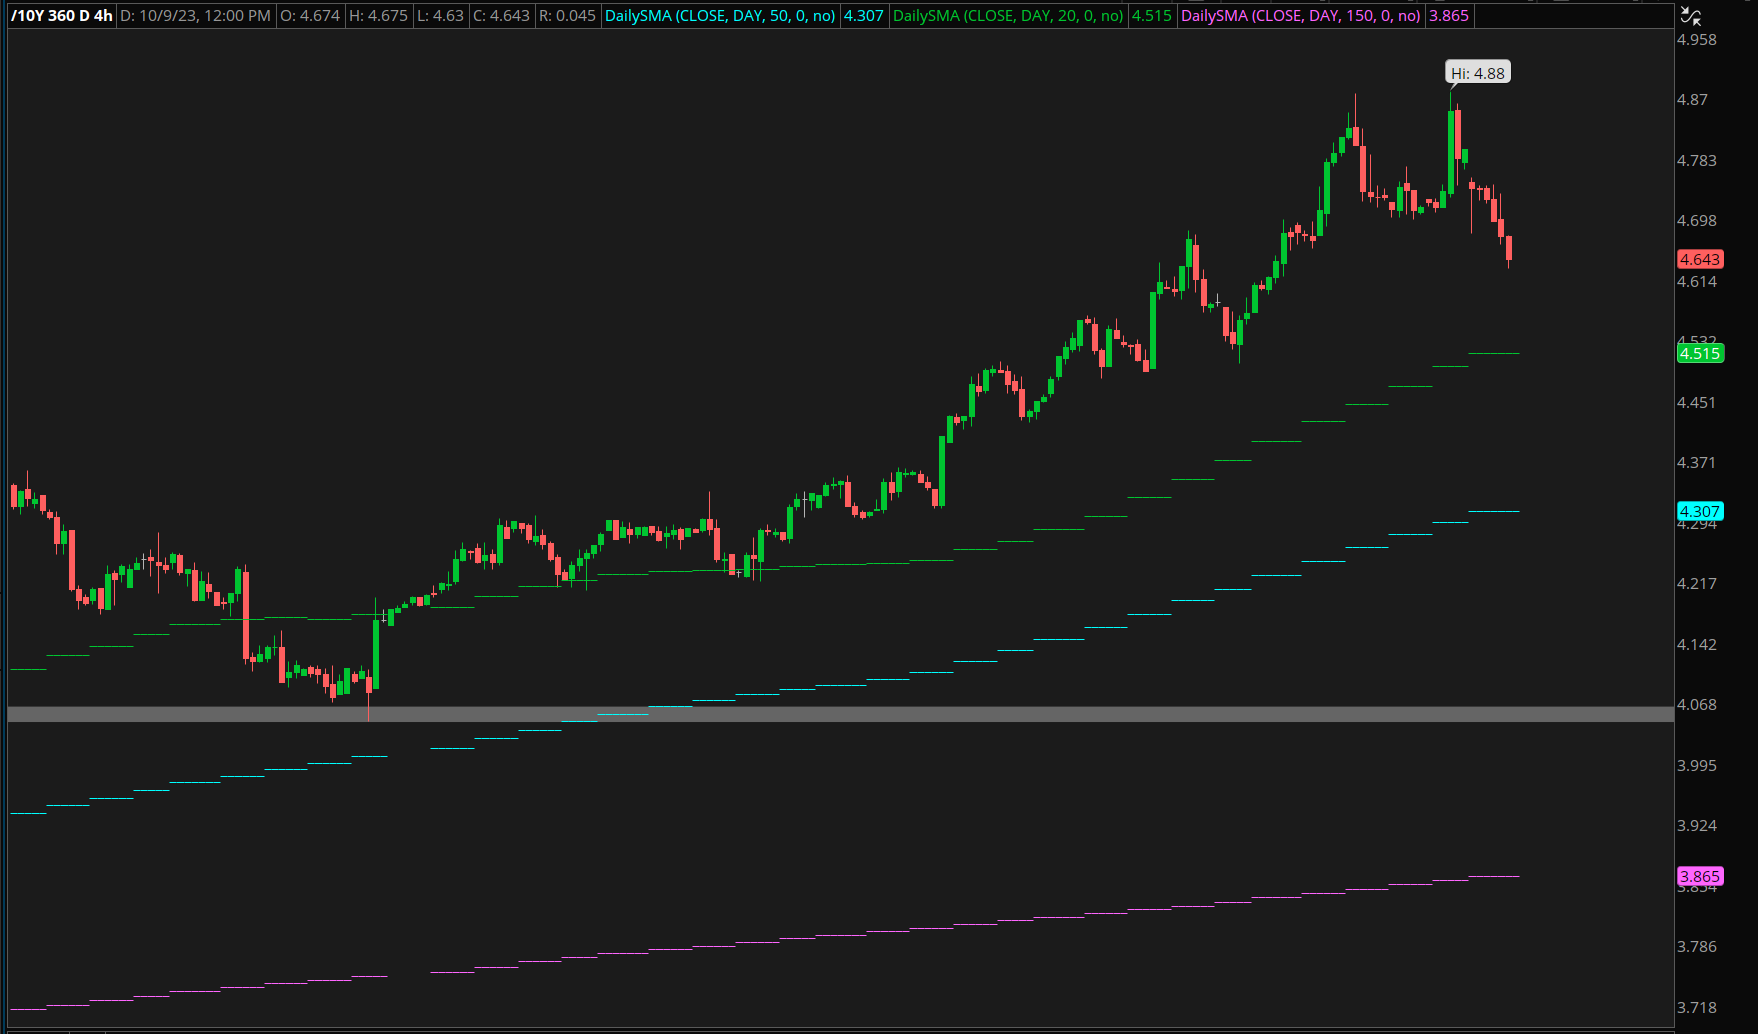
YIELDS
Not many news channels were able to look at this since bond markets were closed, but a quick look at my Futures feed shows a decent drop in yields today. It definitely helped Risk to rally for a bit. I see yields as topping at a larger degree. The contrarian sentiment signals were abundant last week.
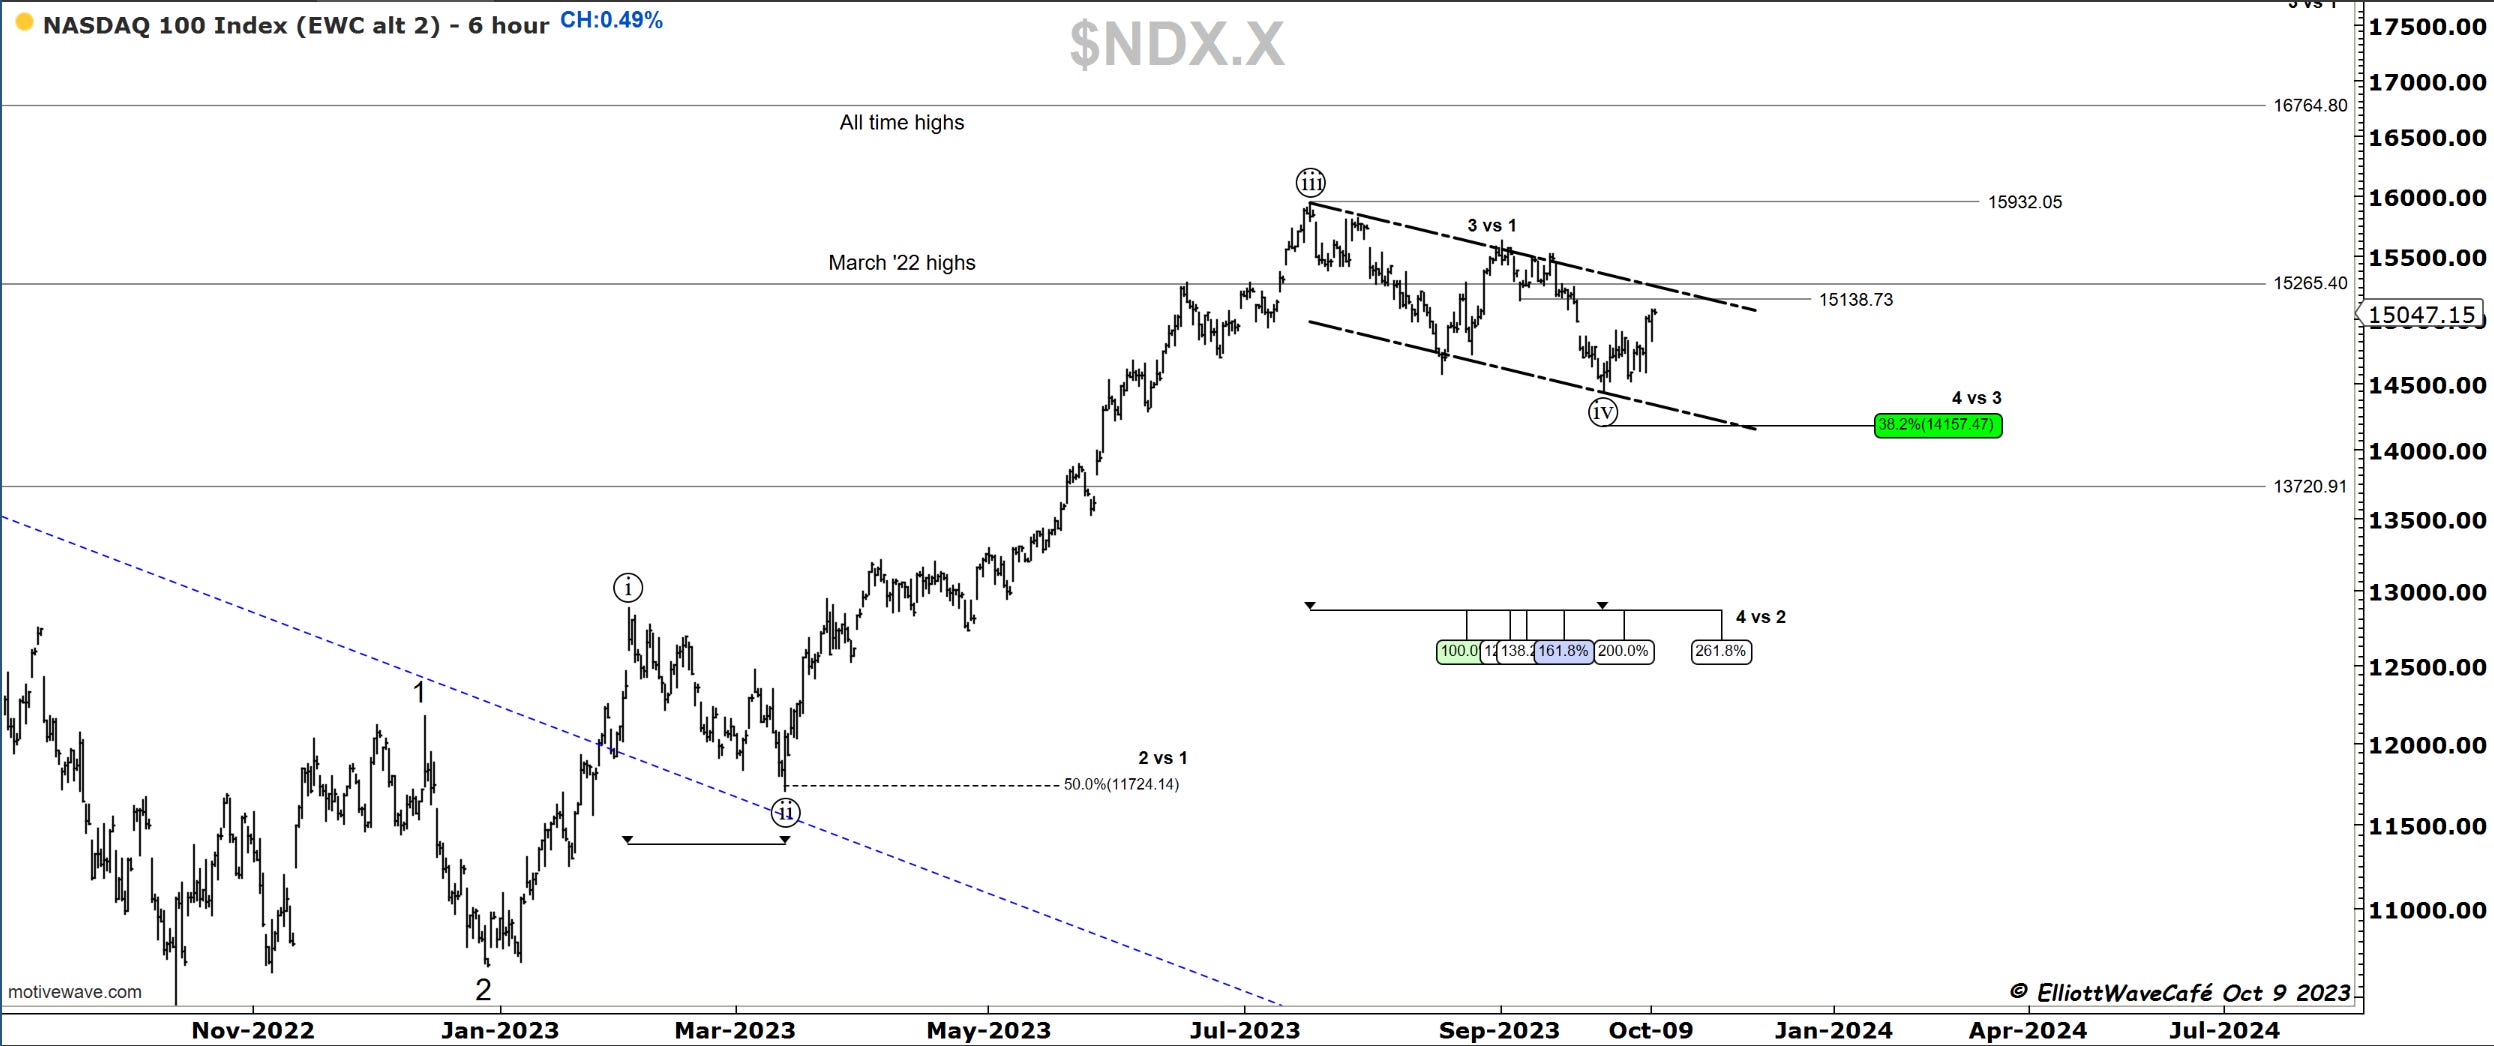
Nasdaq100
I don’t think I’m in the wrong trying to label the end of wave ((iv)) in Nasdaq100. The futures market has already overlapped the bottom of wave 1 from the latest decline ( labeled here at 15,138). If we can get above that and ideally above March ‘22 highs, what appears as a 3wave rally so far, should look a lot more impulsive.
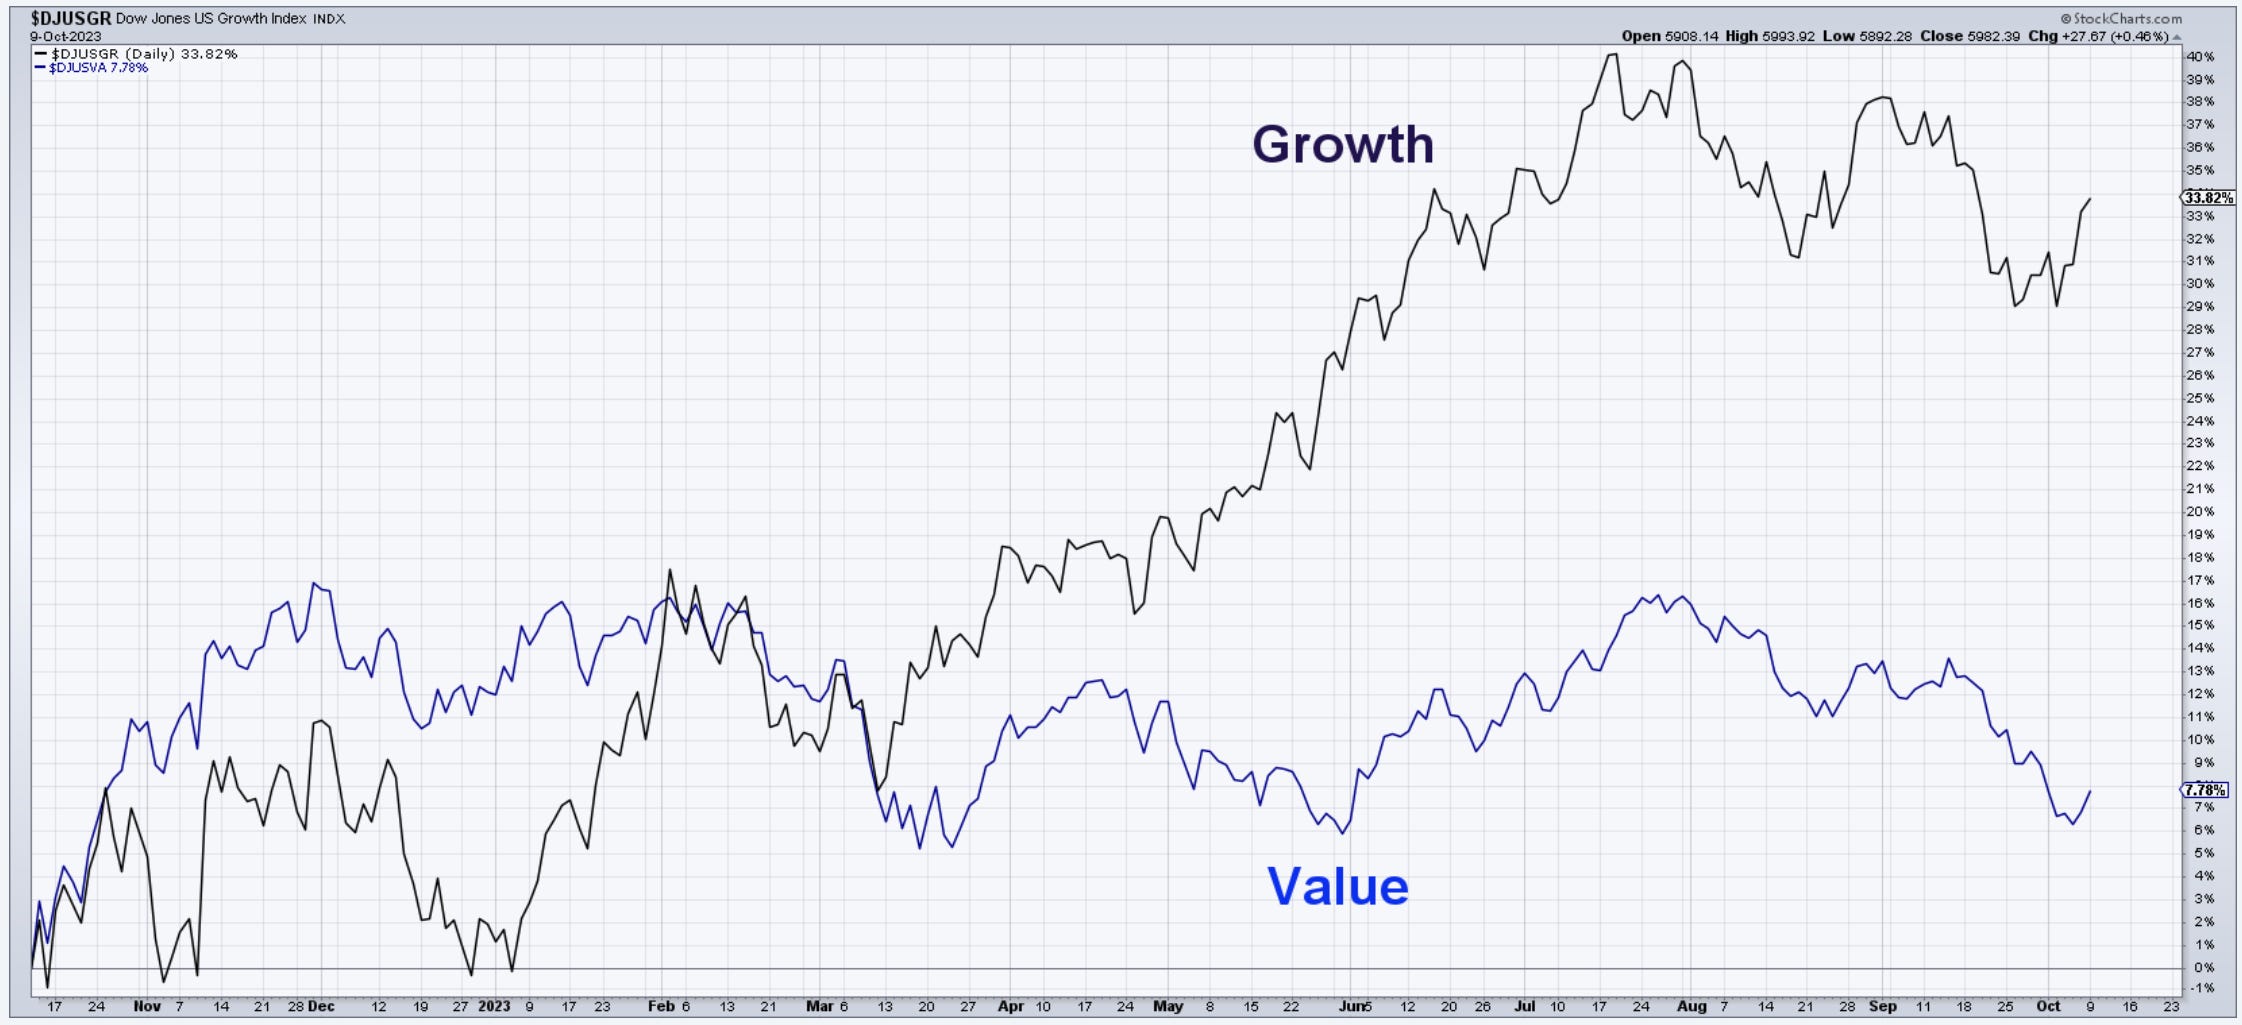
Growth and Tech should continue to be favorites here as we’re entering 4th quarter.
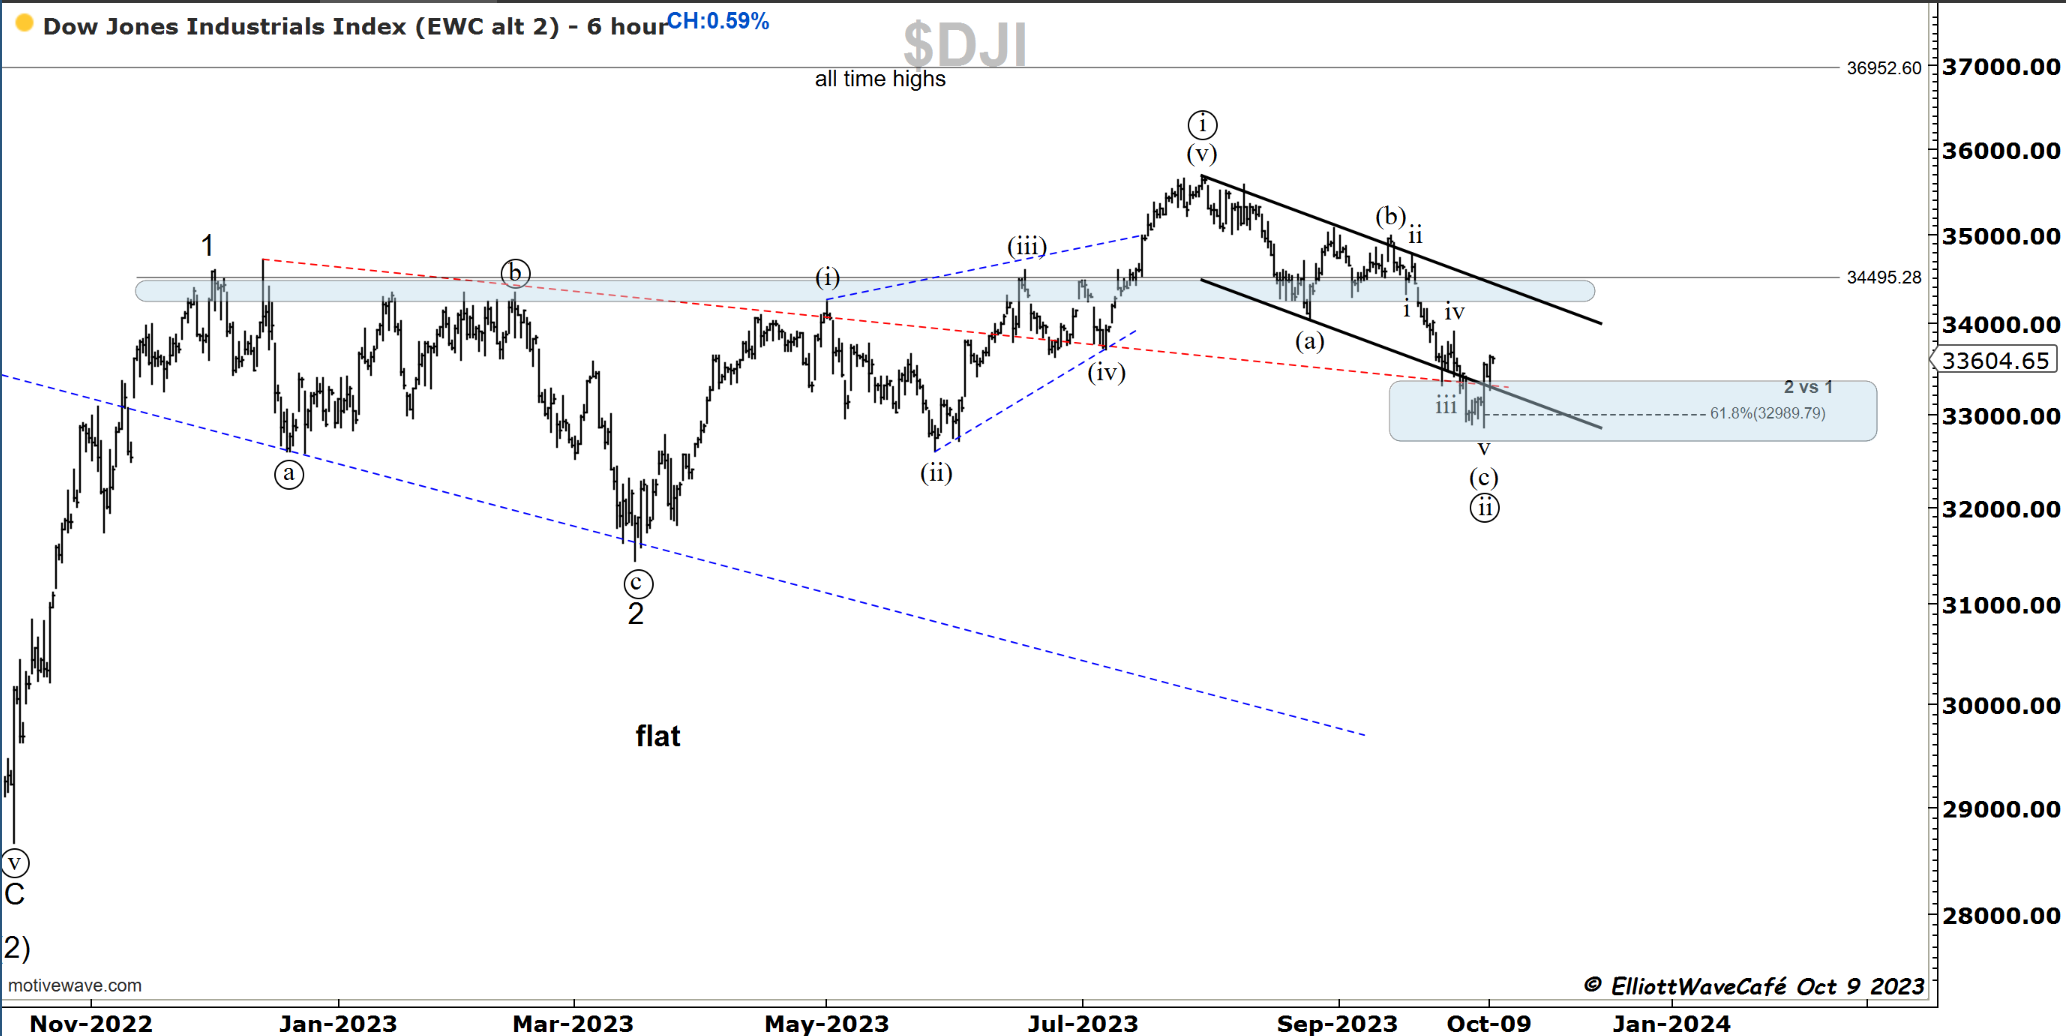
Dow30
Dow has tagged that beautiful golden ratio and bounced. 34,500 will be a big hurdle once again, but if this was the wave ((ii)) low, there is a long bullish road ahead.
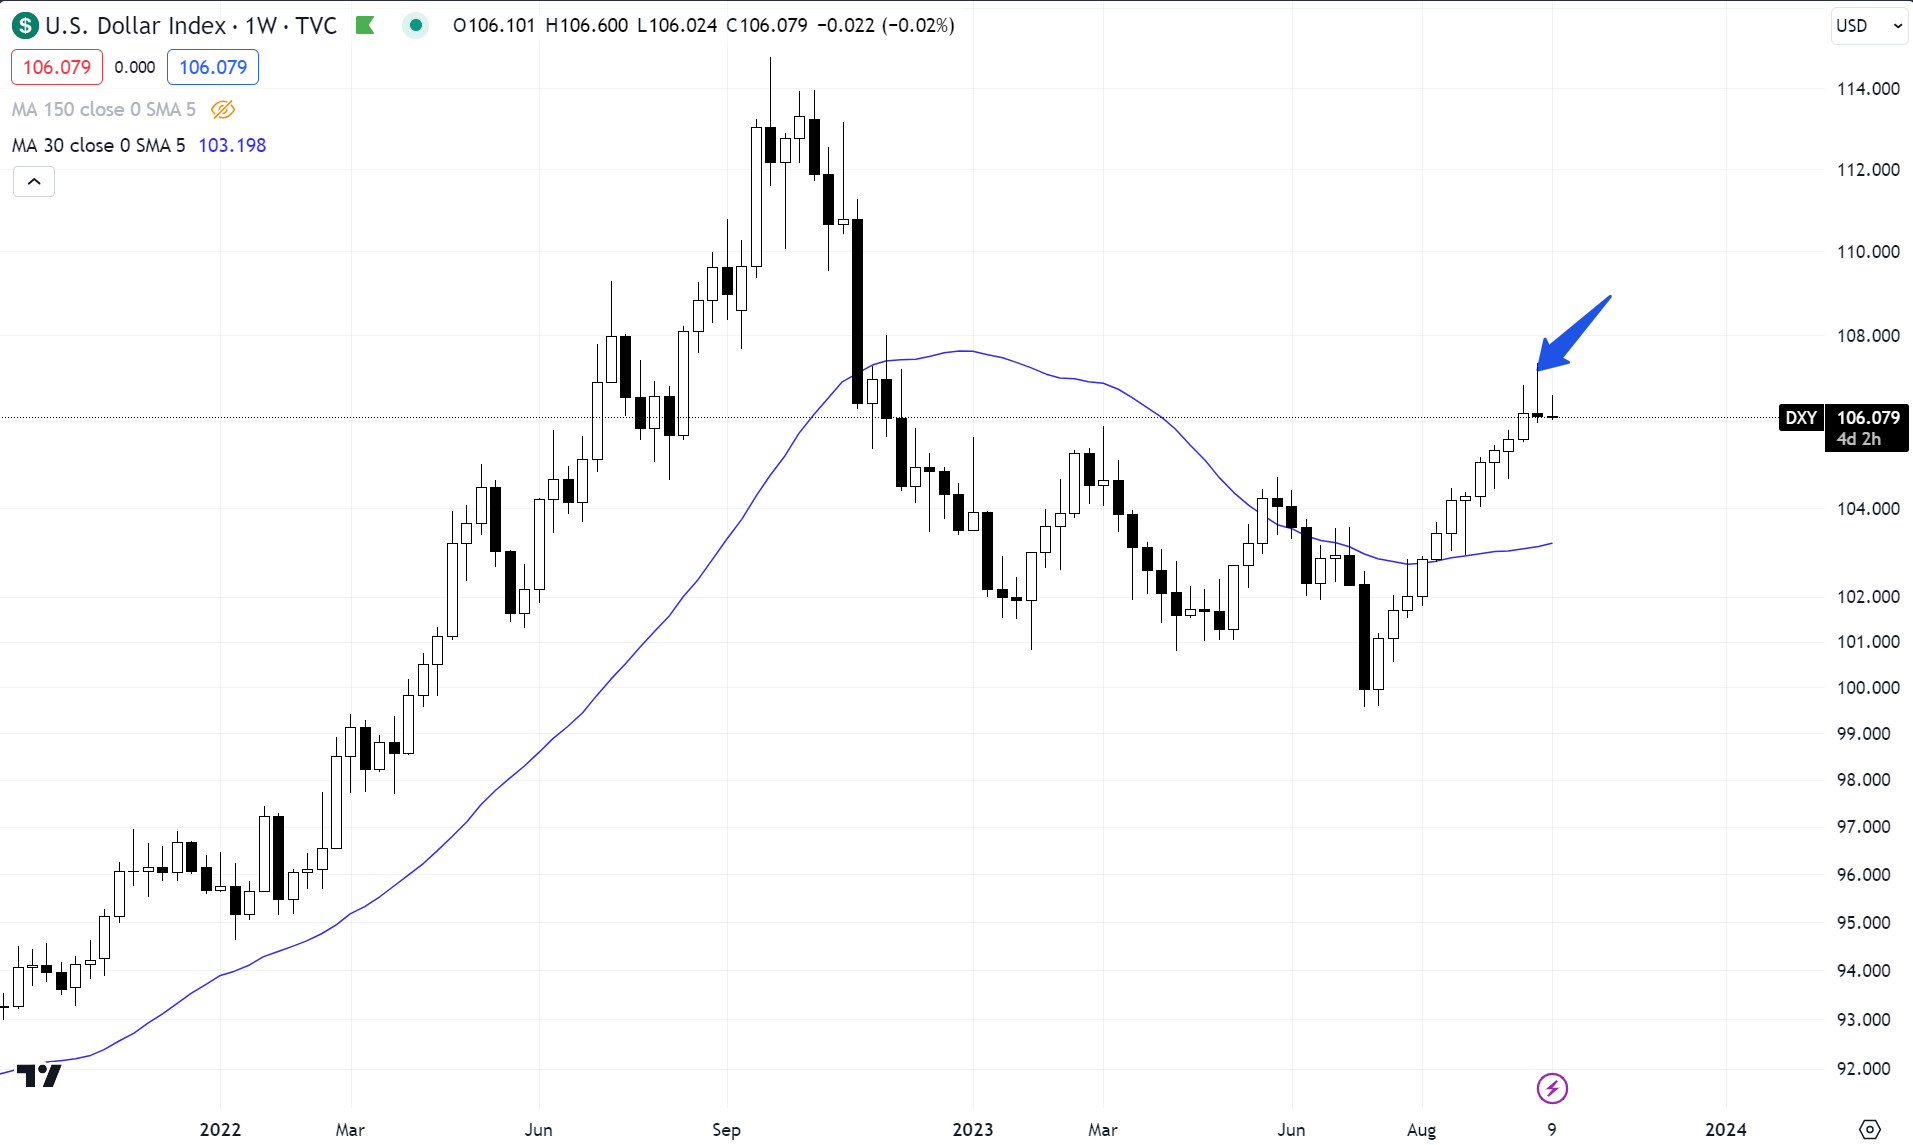
US Dollar
That weekly shooting star in the DXY is a thing of beauty, and when it comes after a strong uptrend, it suggests at least a temporary reversal of the ongoing trend. I see the dollar poised for the 104 area before more serious bids appear once again.
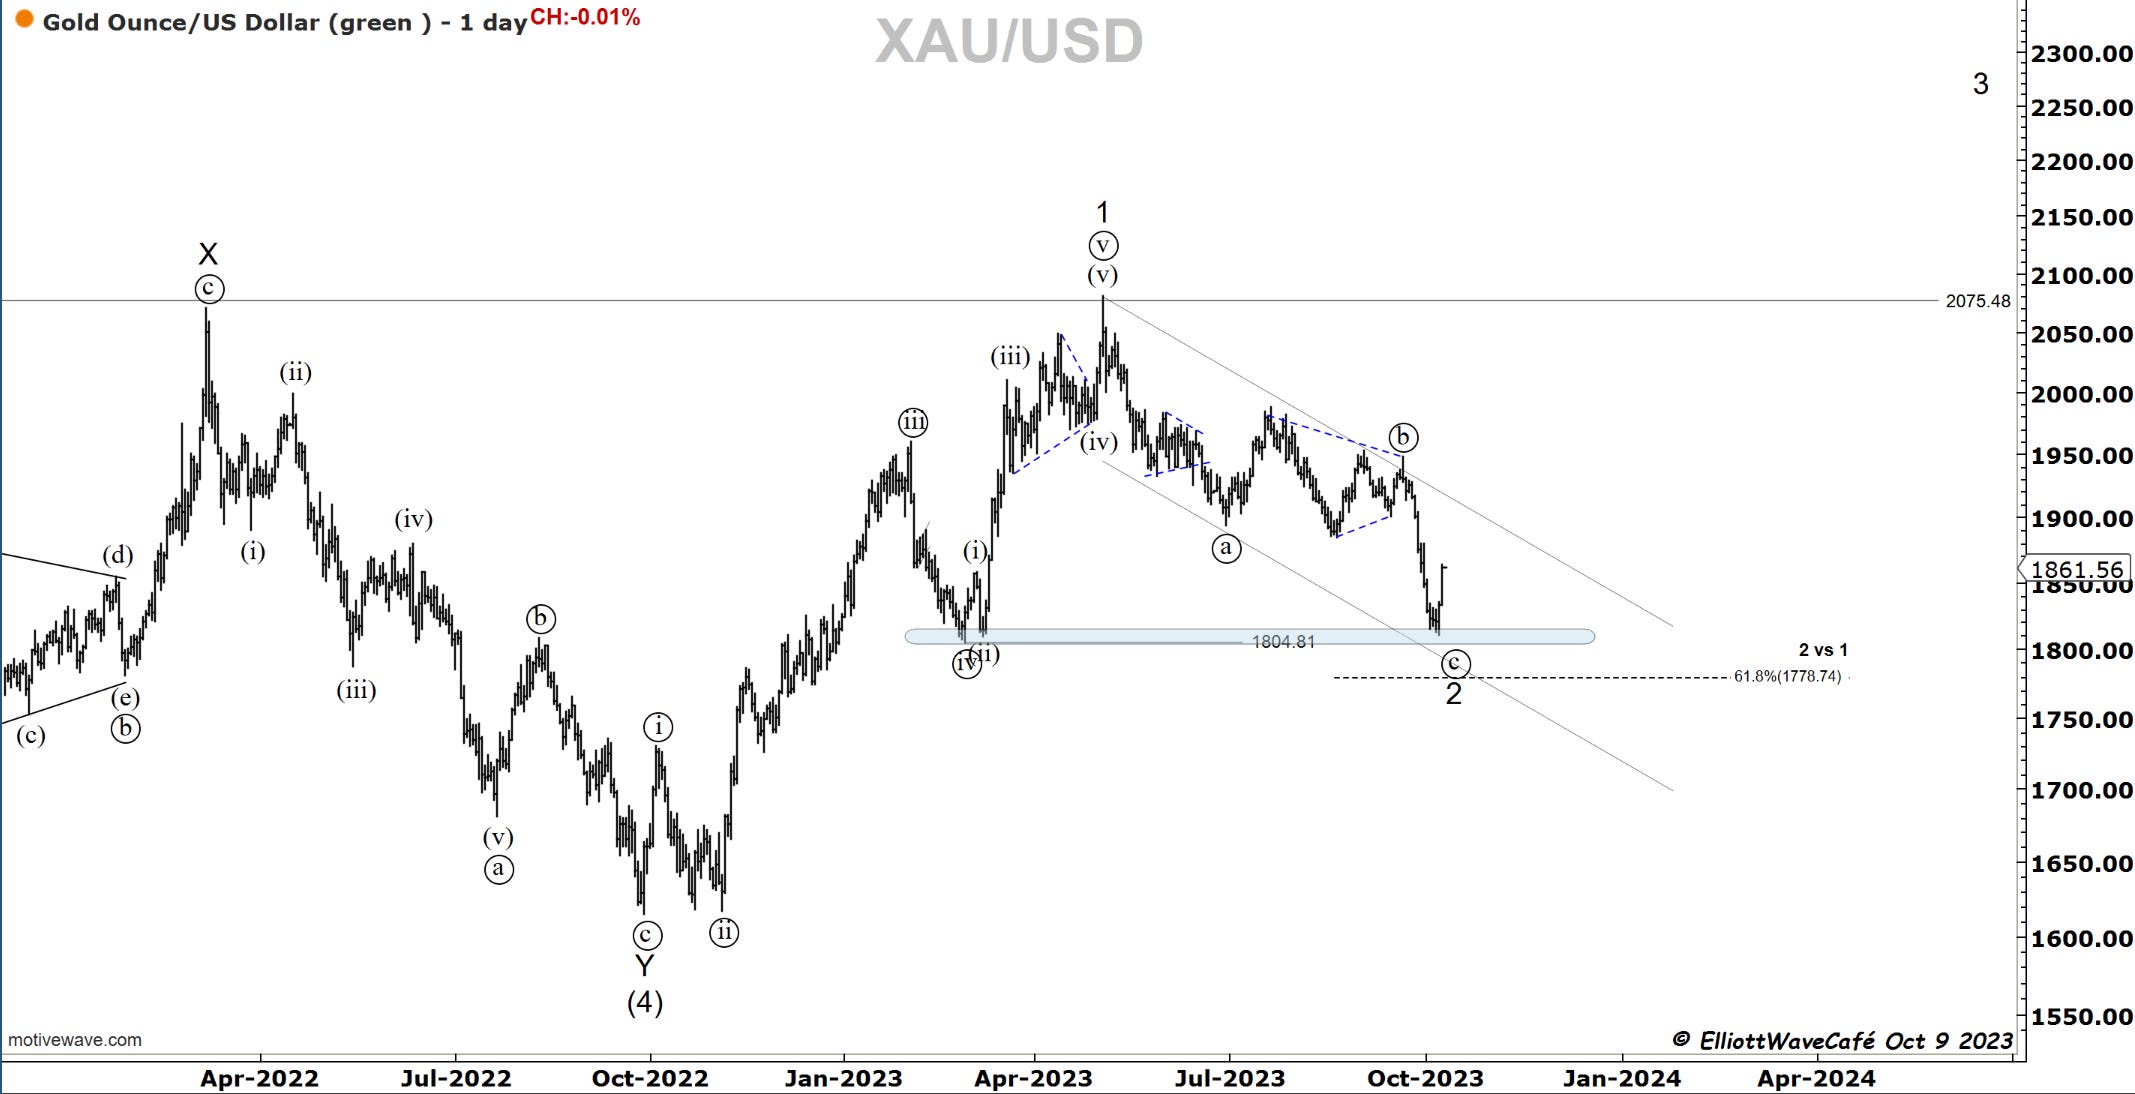
Gold
I’ll let the 2nd chart speak for itself..previous comments stand
Hey now Gold. Was that an a , triangle b and then c? Into the previous 4 and just above 61.8? Nice cocktail here, making upside bets not a bad idea.
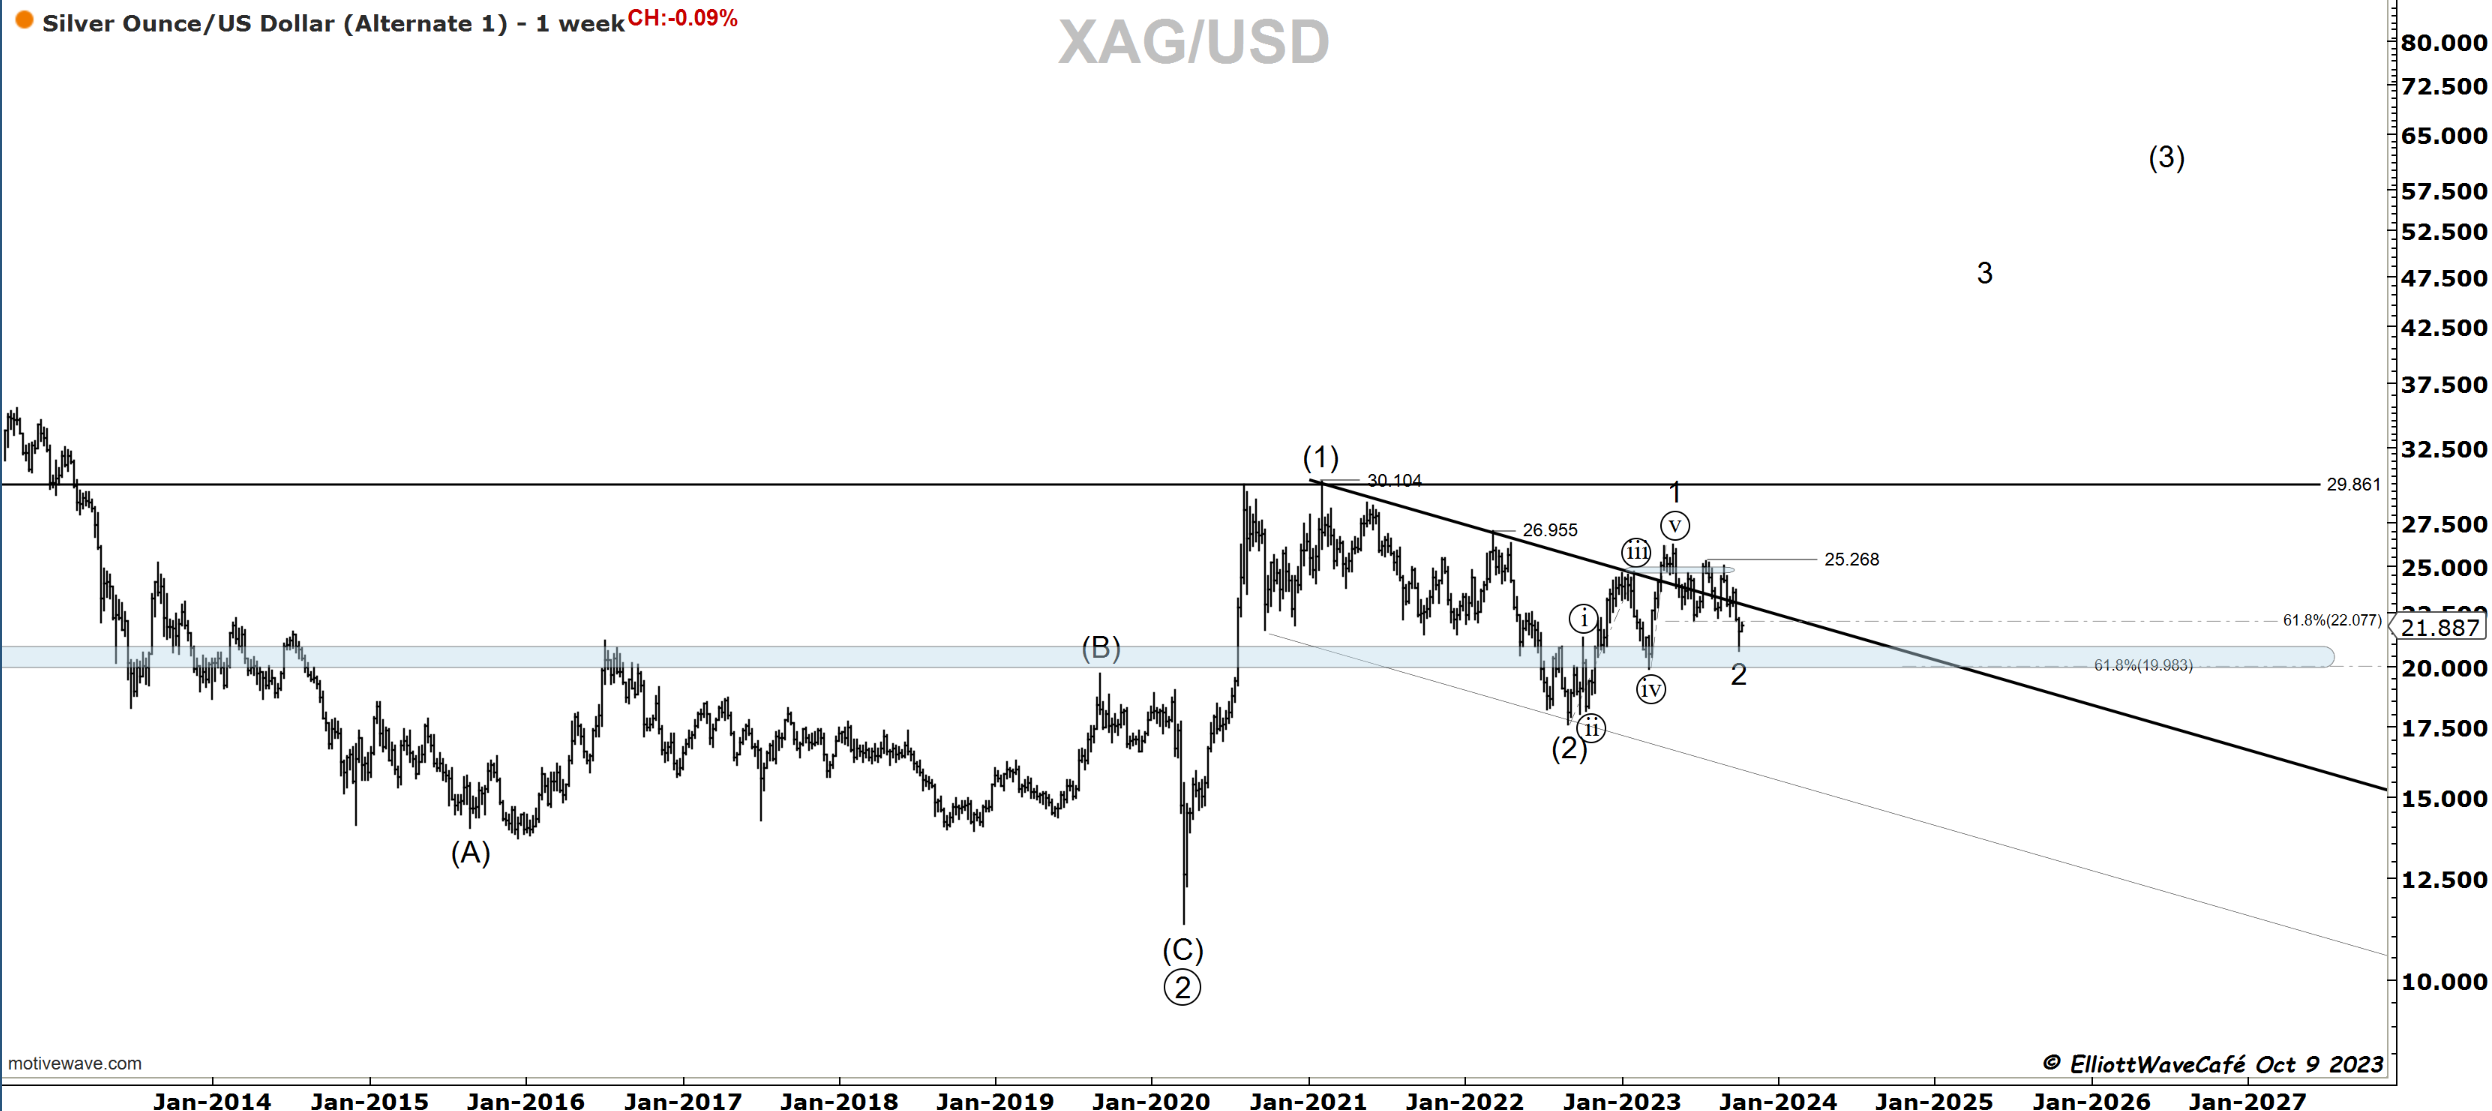
SILVER
How beautiful would be if this worked out? Not sure if it will, but I can tell you that if we break 26.20 we increase the odds tenfold.
Bitcoin
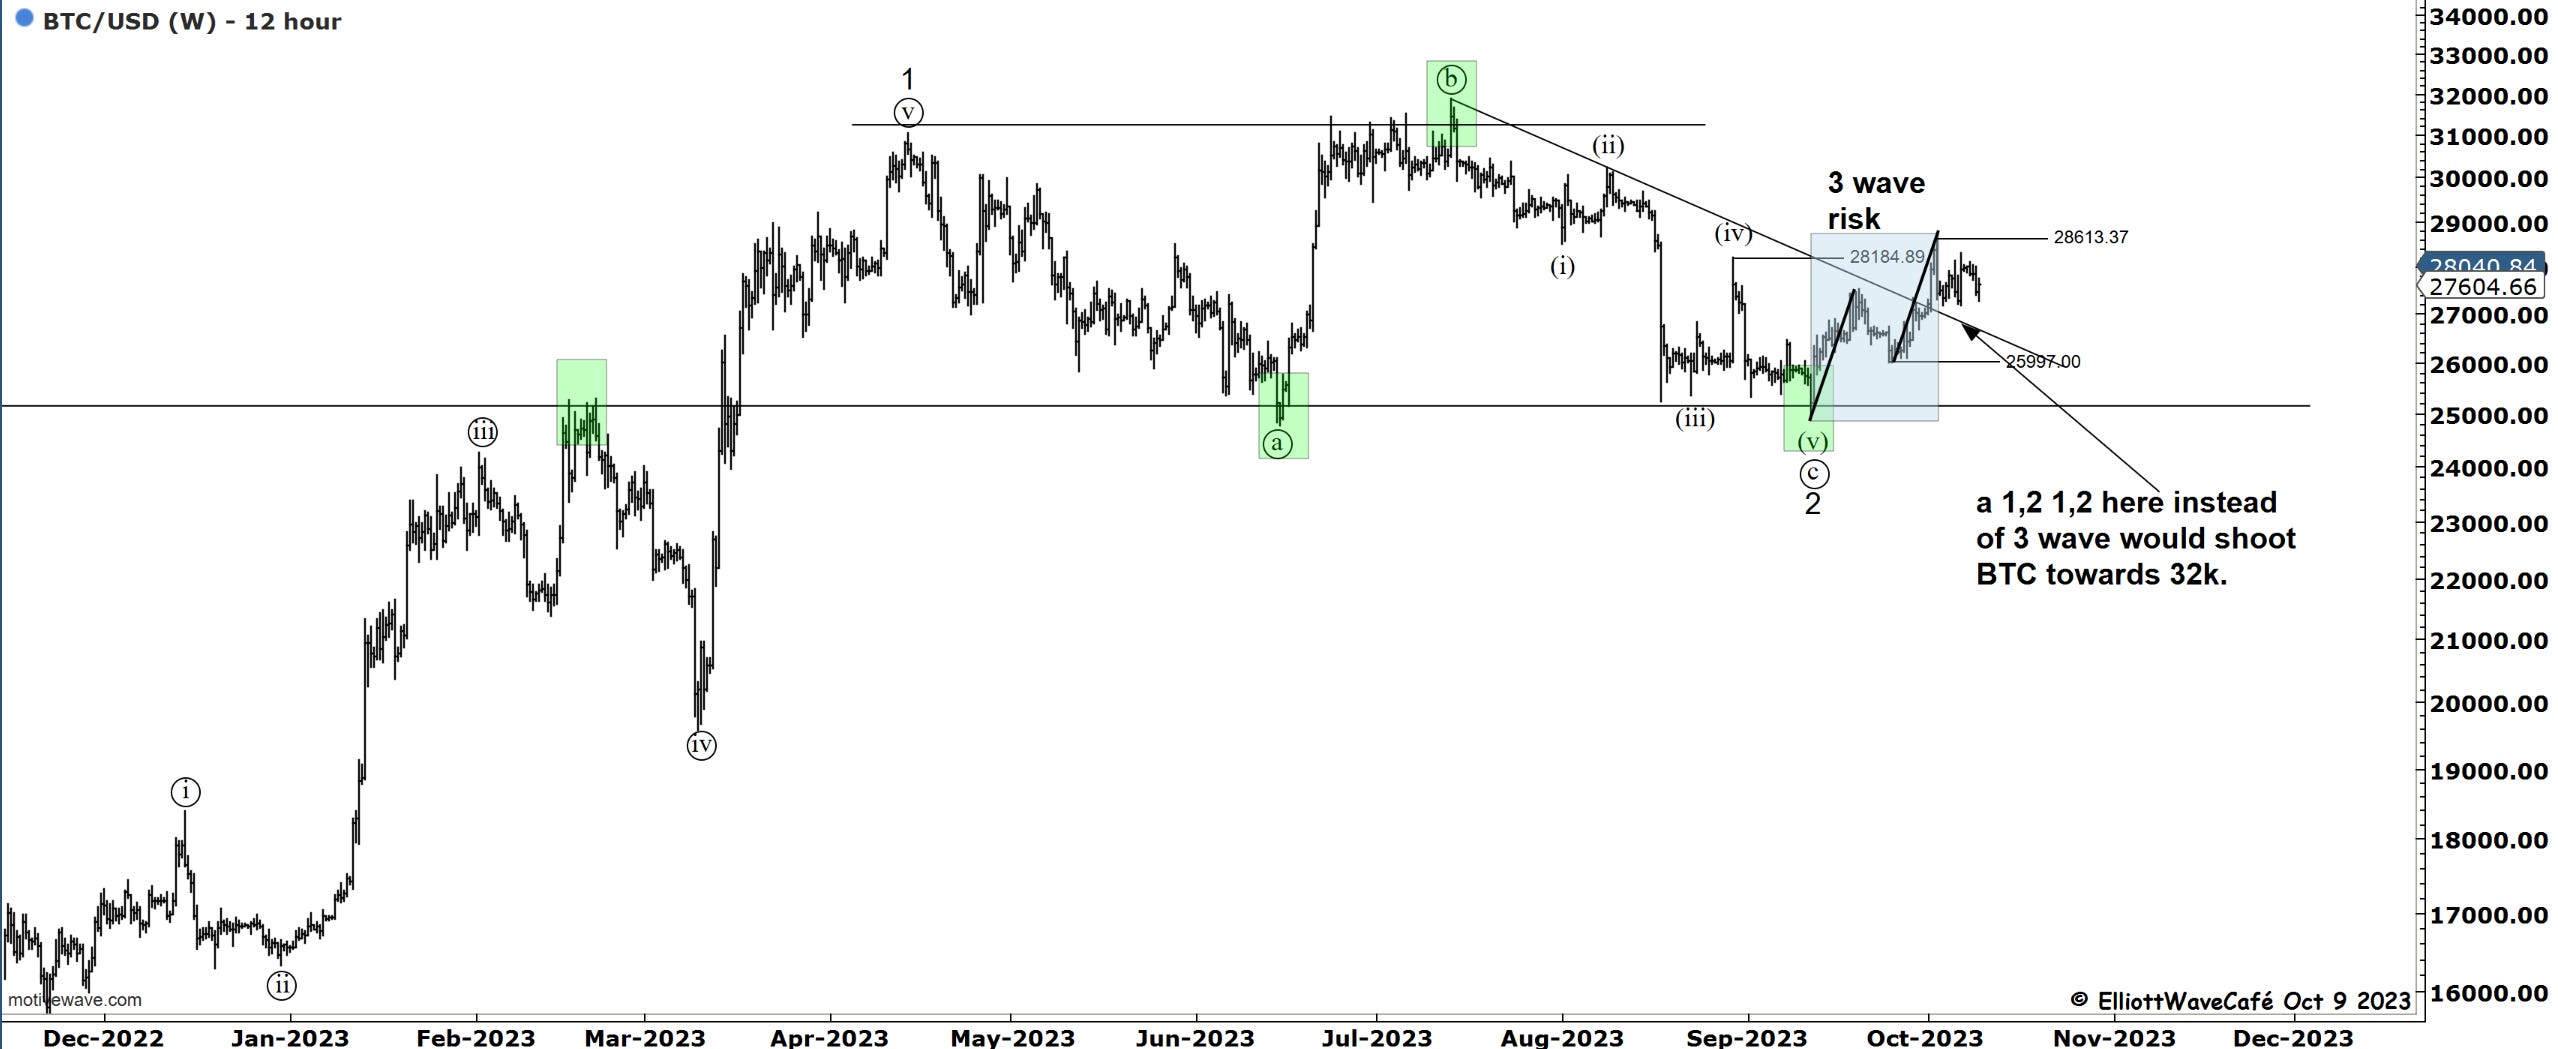
BTC has remained quiet, but the lack of a decline following that 3-wave rally opens the question towards a 1,2 - 1,2 or a leading diagonal. The wave equality shown in black lines makes the former more probable than the latter. If we break 26k, it’s a deleted proposal nonetheless. I have my eyes peeled on 29k to start adding risk.
In conclusion, I see a market that’s recovering on multiple fronts after many seller exhaustion signals for the big part of the last week. Both dollar and yields were quite strong, and yet the markets were unable to break the 4200 support. There is a large risk event this week in the CPI and PPI numbers, and if we cross that hurdle without large surprises, I can see us traveling higher and challenging ATH before the year ends. The earnings season starts Friday with banks. Many charts there give bullish signals but extra digging is required.
Daily video coming up next,
See you tomorrow- trade well,
Cris
email: ewcafe@pm.me