
The Daily Drip
Markets review, strategy and analysis
Note: The EW counts on the right edge are real-time, and they are prone to adjustments as price action develops. Elliott Wave has a fluid approach, is evidence-based, and requires constant monitoring of certain thresholds.
In the counts below, this (( )) = circle on chart
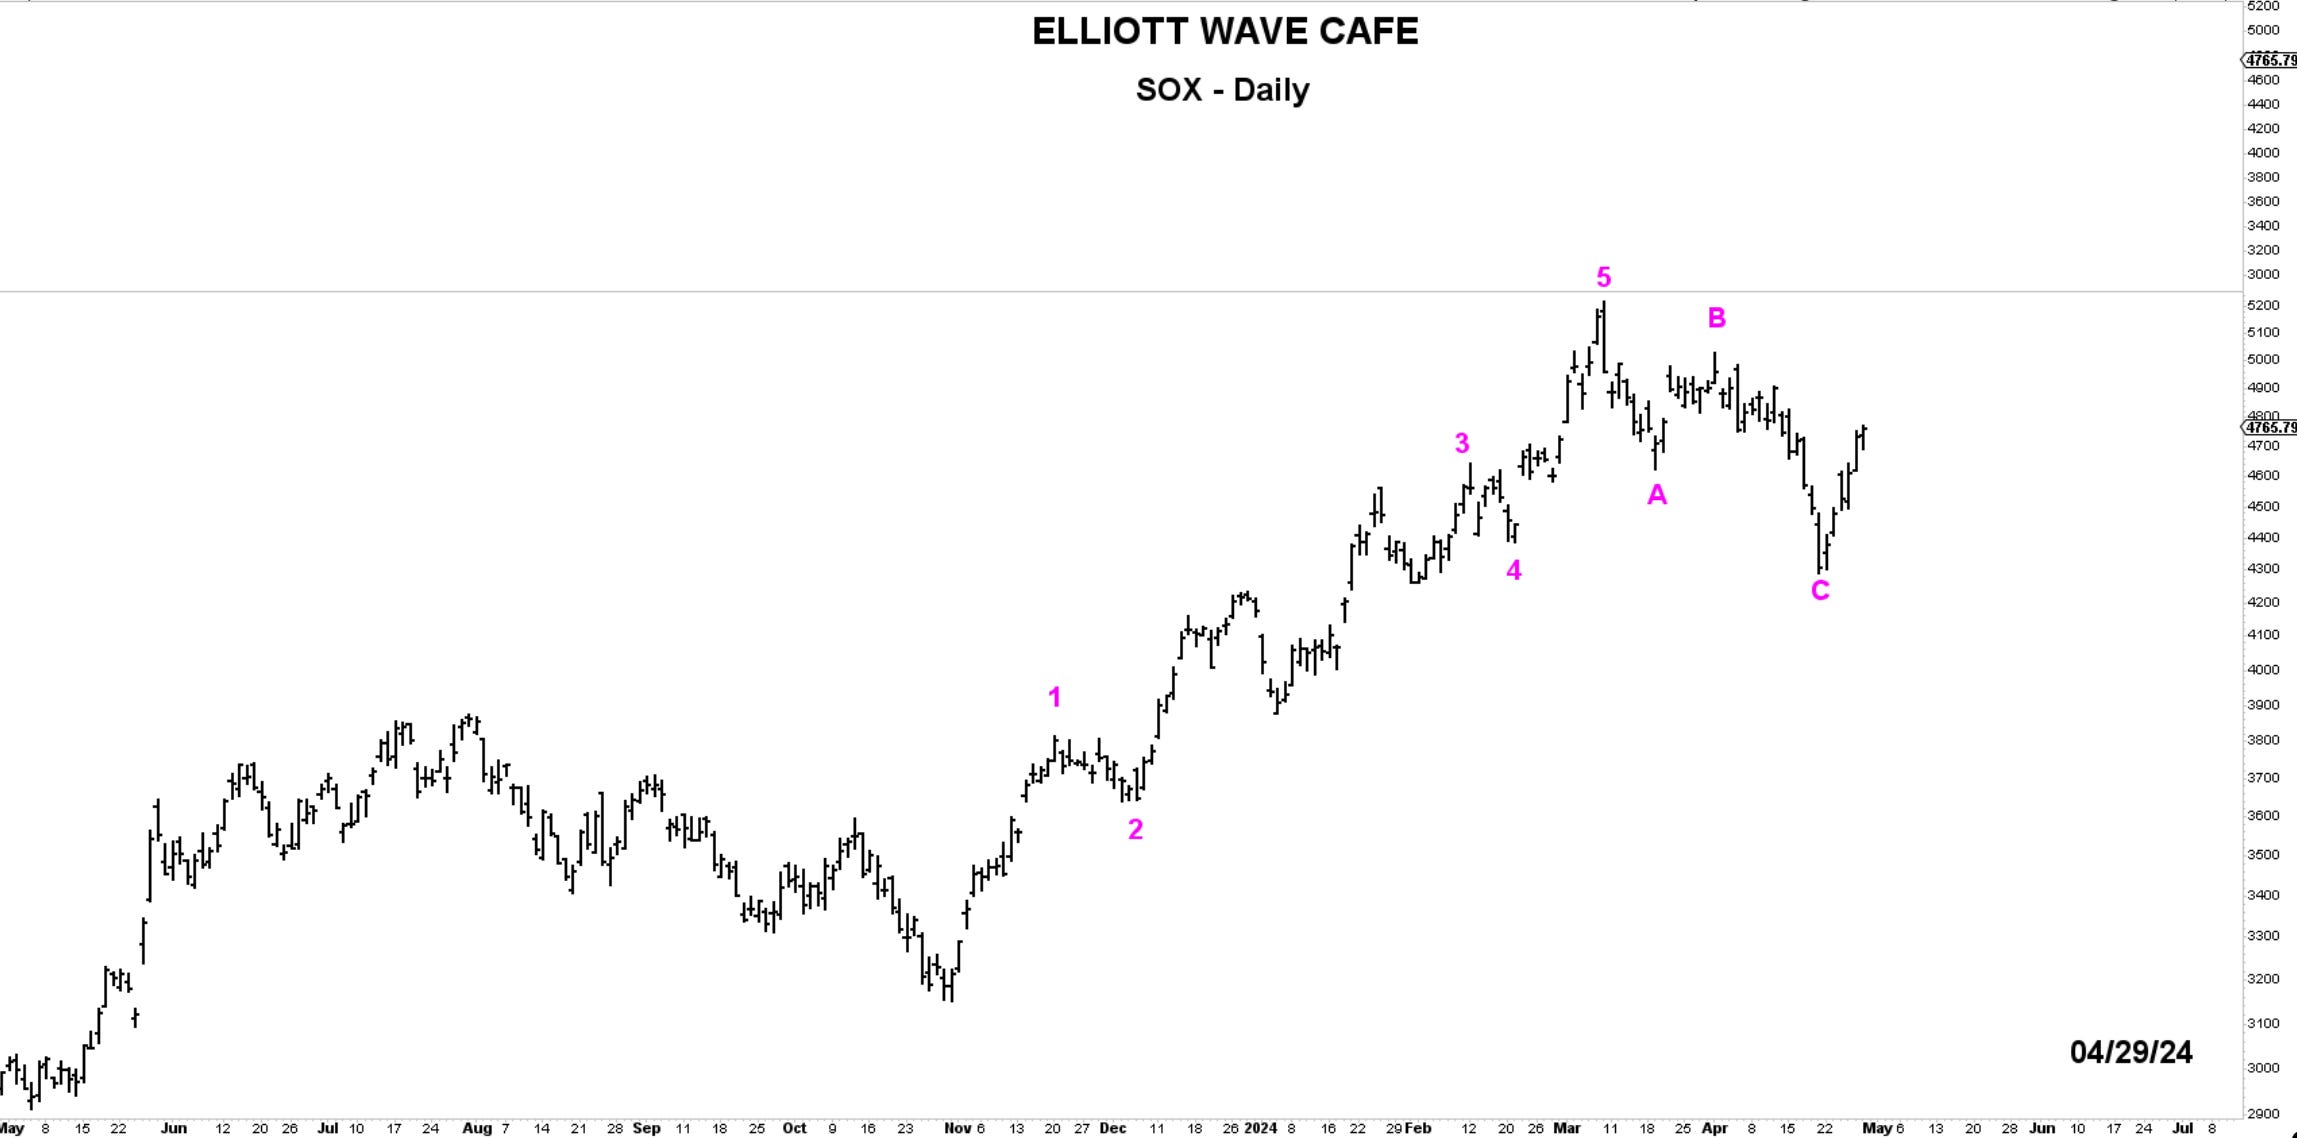
Chart of the Day—$SOX—The daily chart of the Semiconductor index displays a three-wave correction against a five-wave impulse. It suggests the path of prices should be higher with a clearer confirmation once the B wave swing high gets taken out.
Bottom Line: Friday’s strong bullish move dissipated some of the worries regarding a prolonged corrective market selloff. It came on the hills of decent earnings results from MSFT and GOOGL, and after a brief spike in bearish sentiment following METAs guidance. Today, we continued in those footsteps and briefly cleared a short-term declining trendline. While there is more convincing work to be done, slightly increasing bullish exposure is warranted. Any move below last Thursday’s closing high will raise upside failure concerns and point toward safety once again.
If you’ve missed the Weekly Report you can find it here
Also, my latest YouTube video discusses buying after ABC corrections.
Let’s now dive into charts and further analysis below… then the Double Shot daily video.
