
The Daily Drip
Core markets charts updates and commentary
Note: The counts on the right edge are real-time, and they are prone to adjustments as price action develops. Elliott Wave has a fluid approach, is evidence-based, and requires constant monitoring of certain thresholds.
In the counts below, this (( )) = circle on chart
SP500
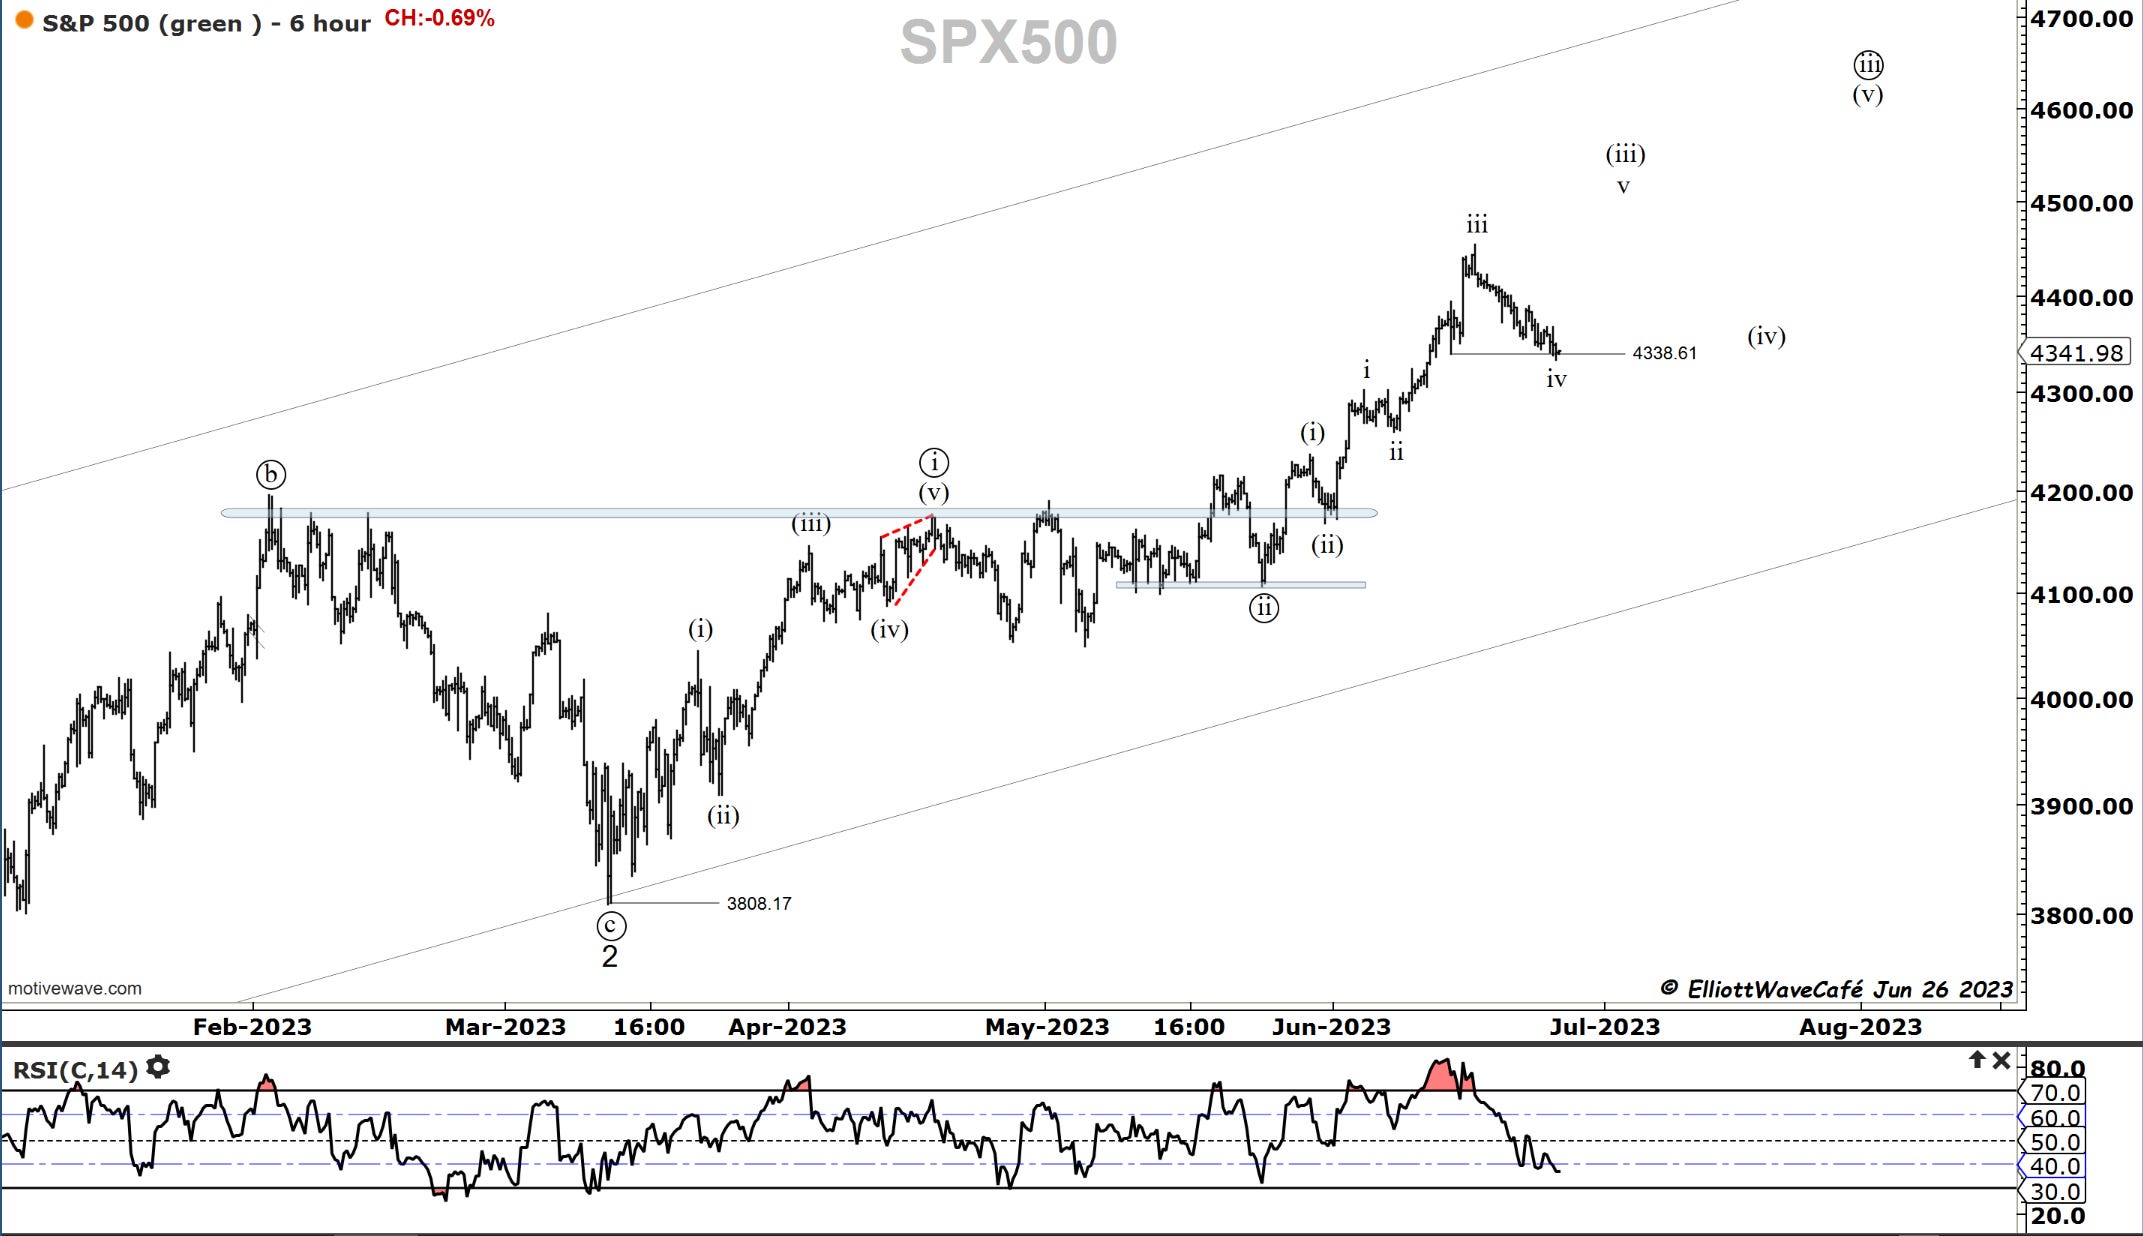
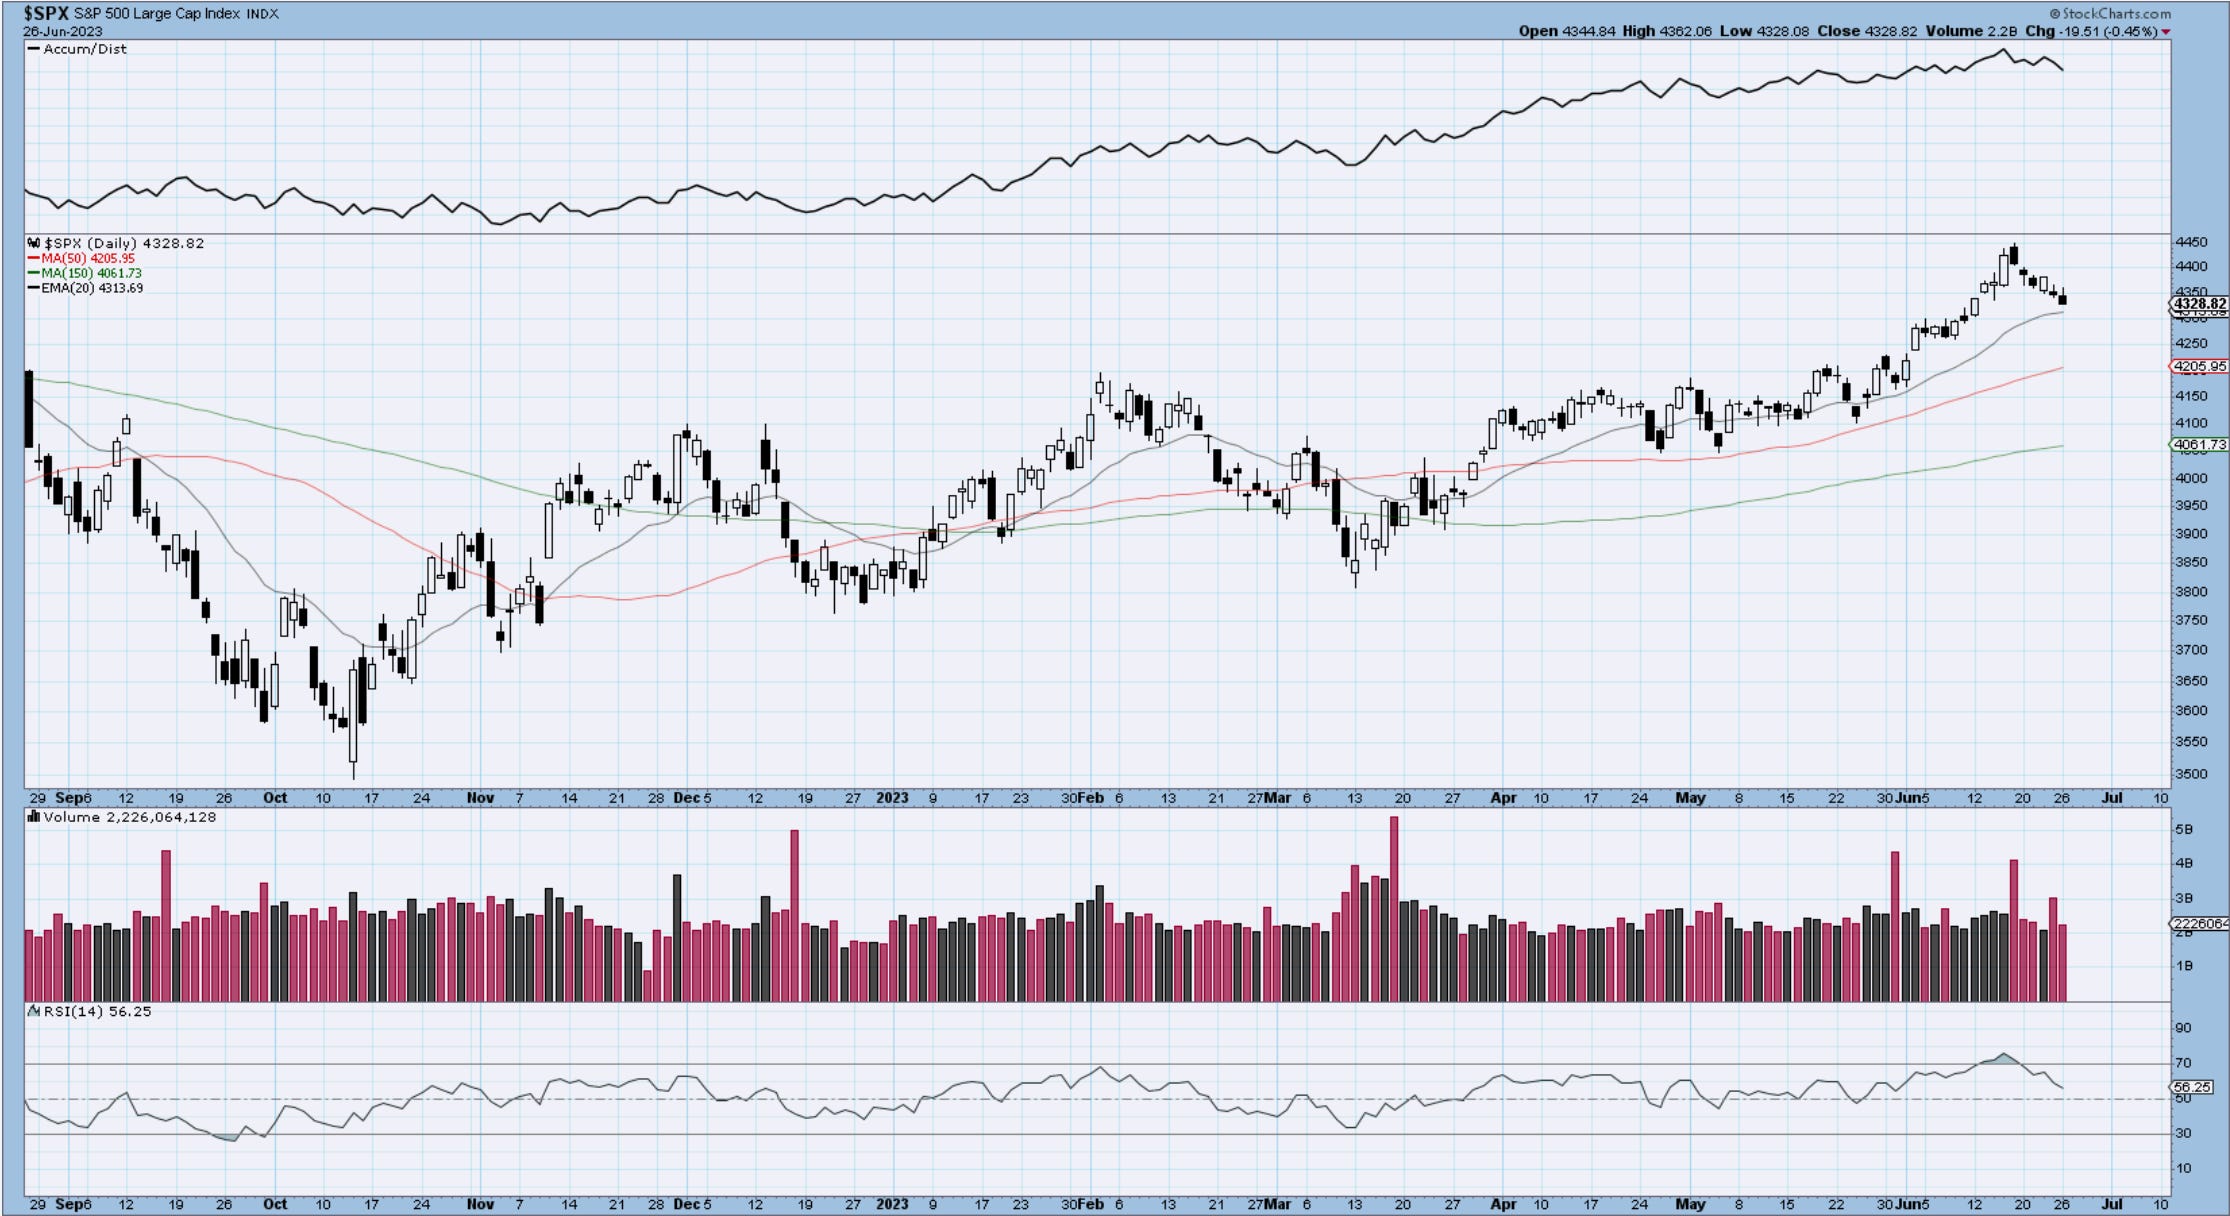
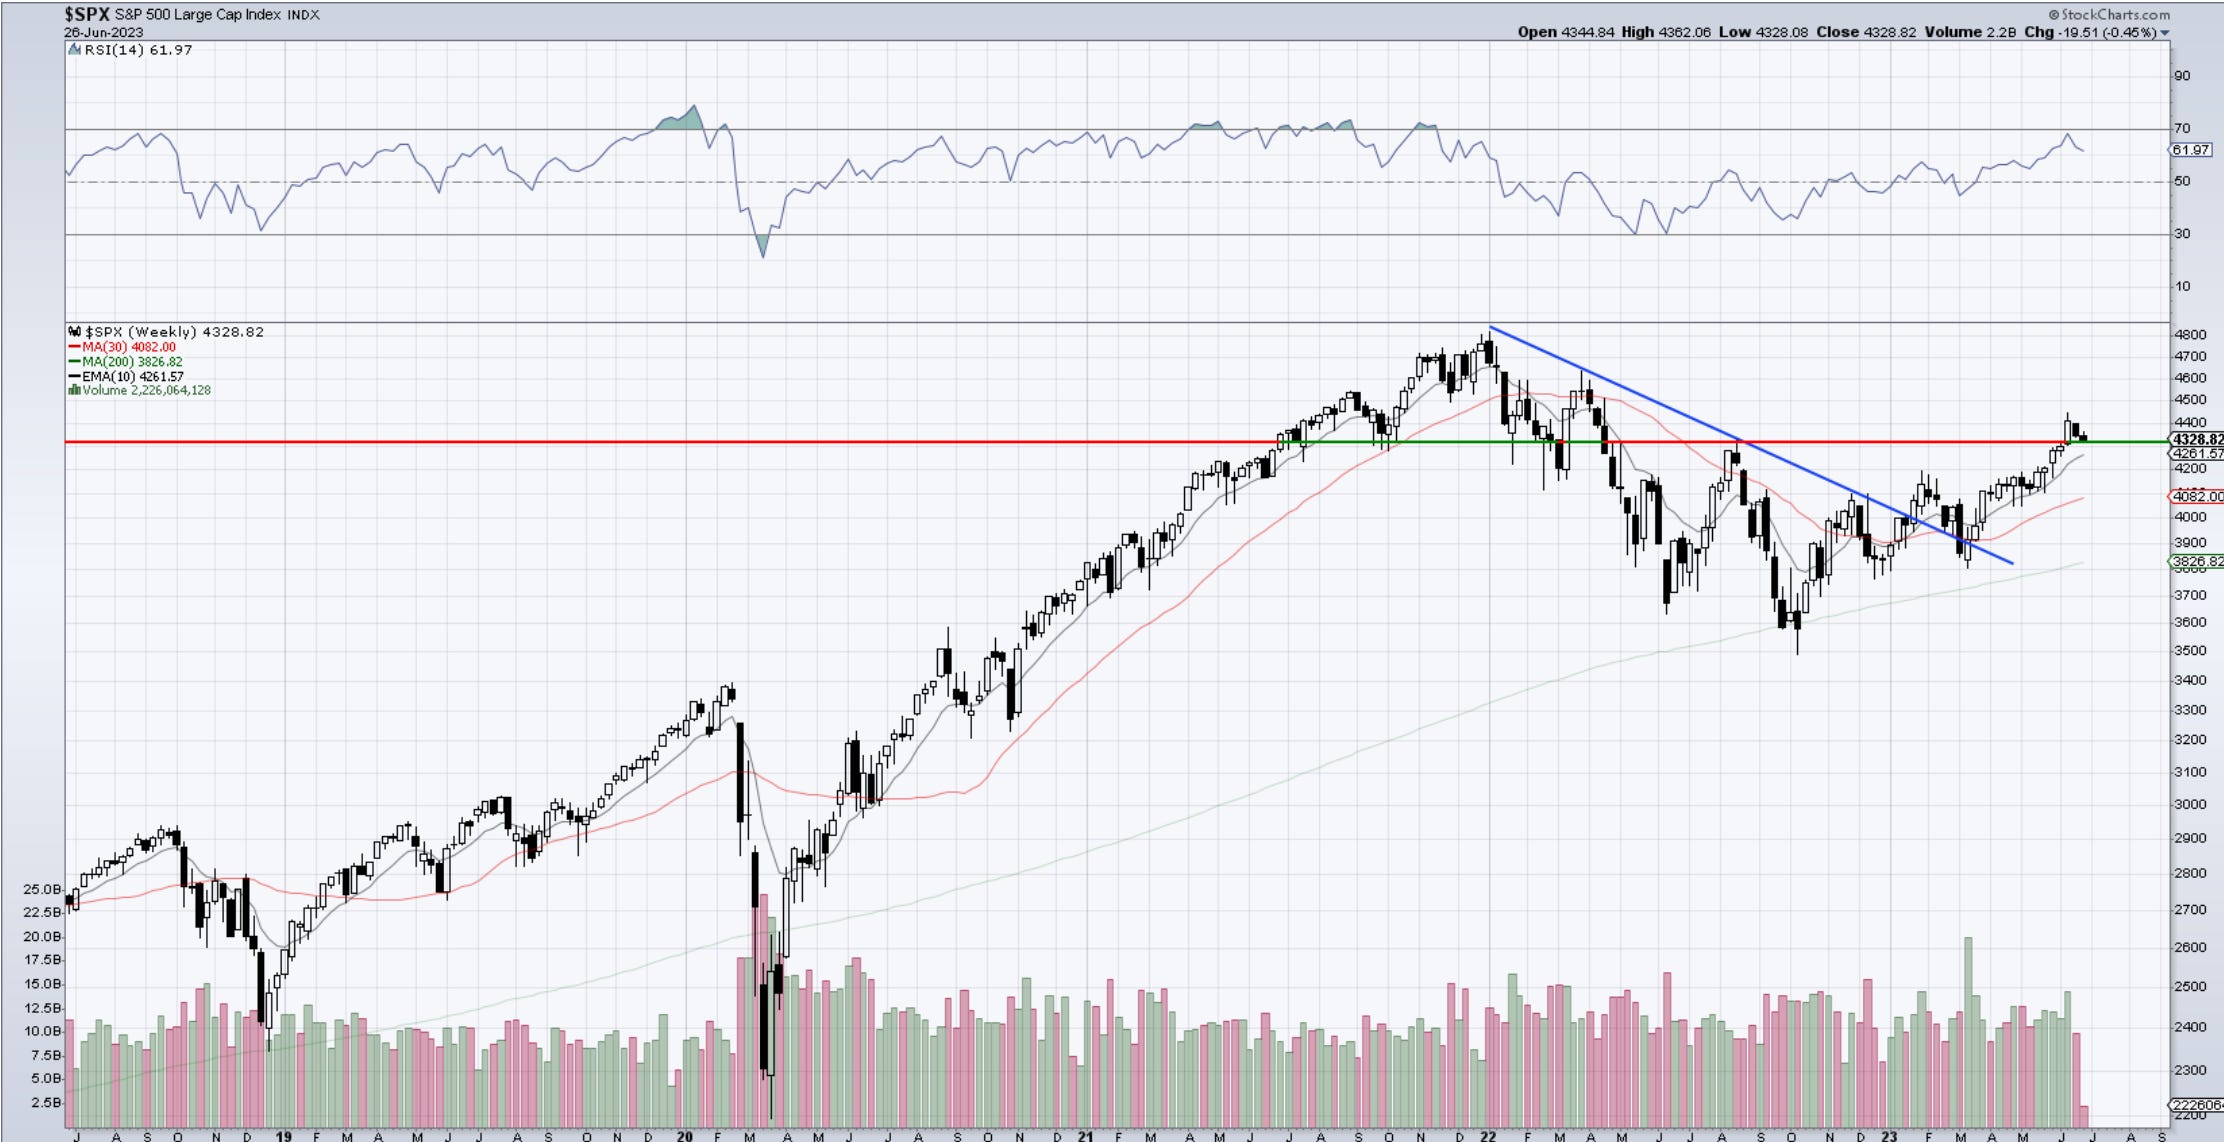
The Index continues to correct the prior strong advance. Wave iv remains valid, although I am a bit worried about its overall size. The trend is up as seen below by a series of HH and HL, and it’s having a close test of a rising 20-day MA. Bids should continue coming in as we approach 4300. With daily RSI approaching 50 levels in uptrends, we’re going to start getting interest from trend-following systems. Weekly is retesting breakout levels and price hugging the rising MA. RSI is in bullish territory. 4200 is the next massive support. The type of levels where “load the boat” expression takes hold.
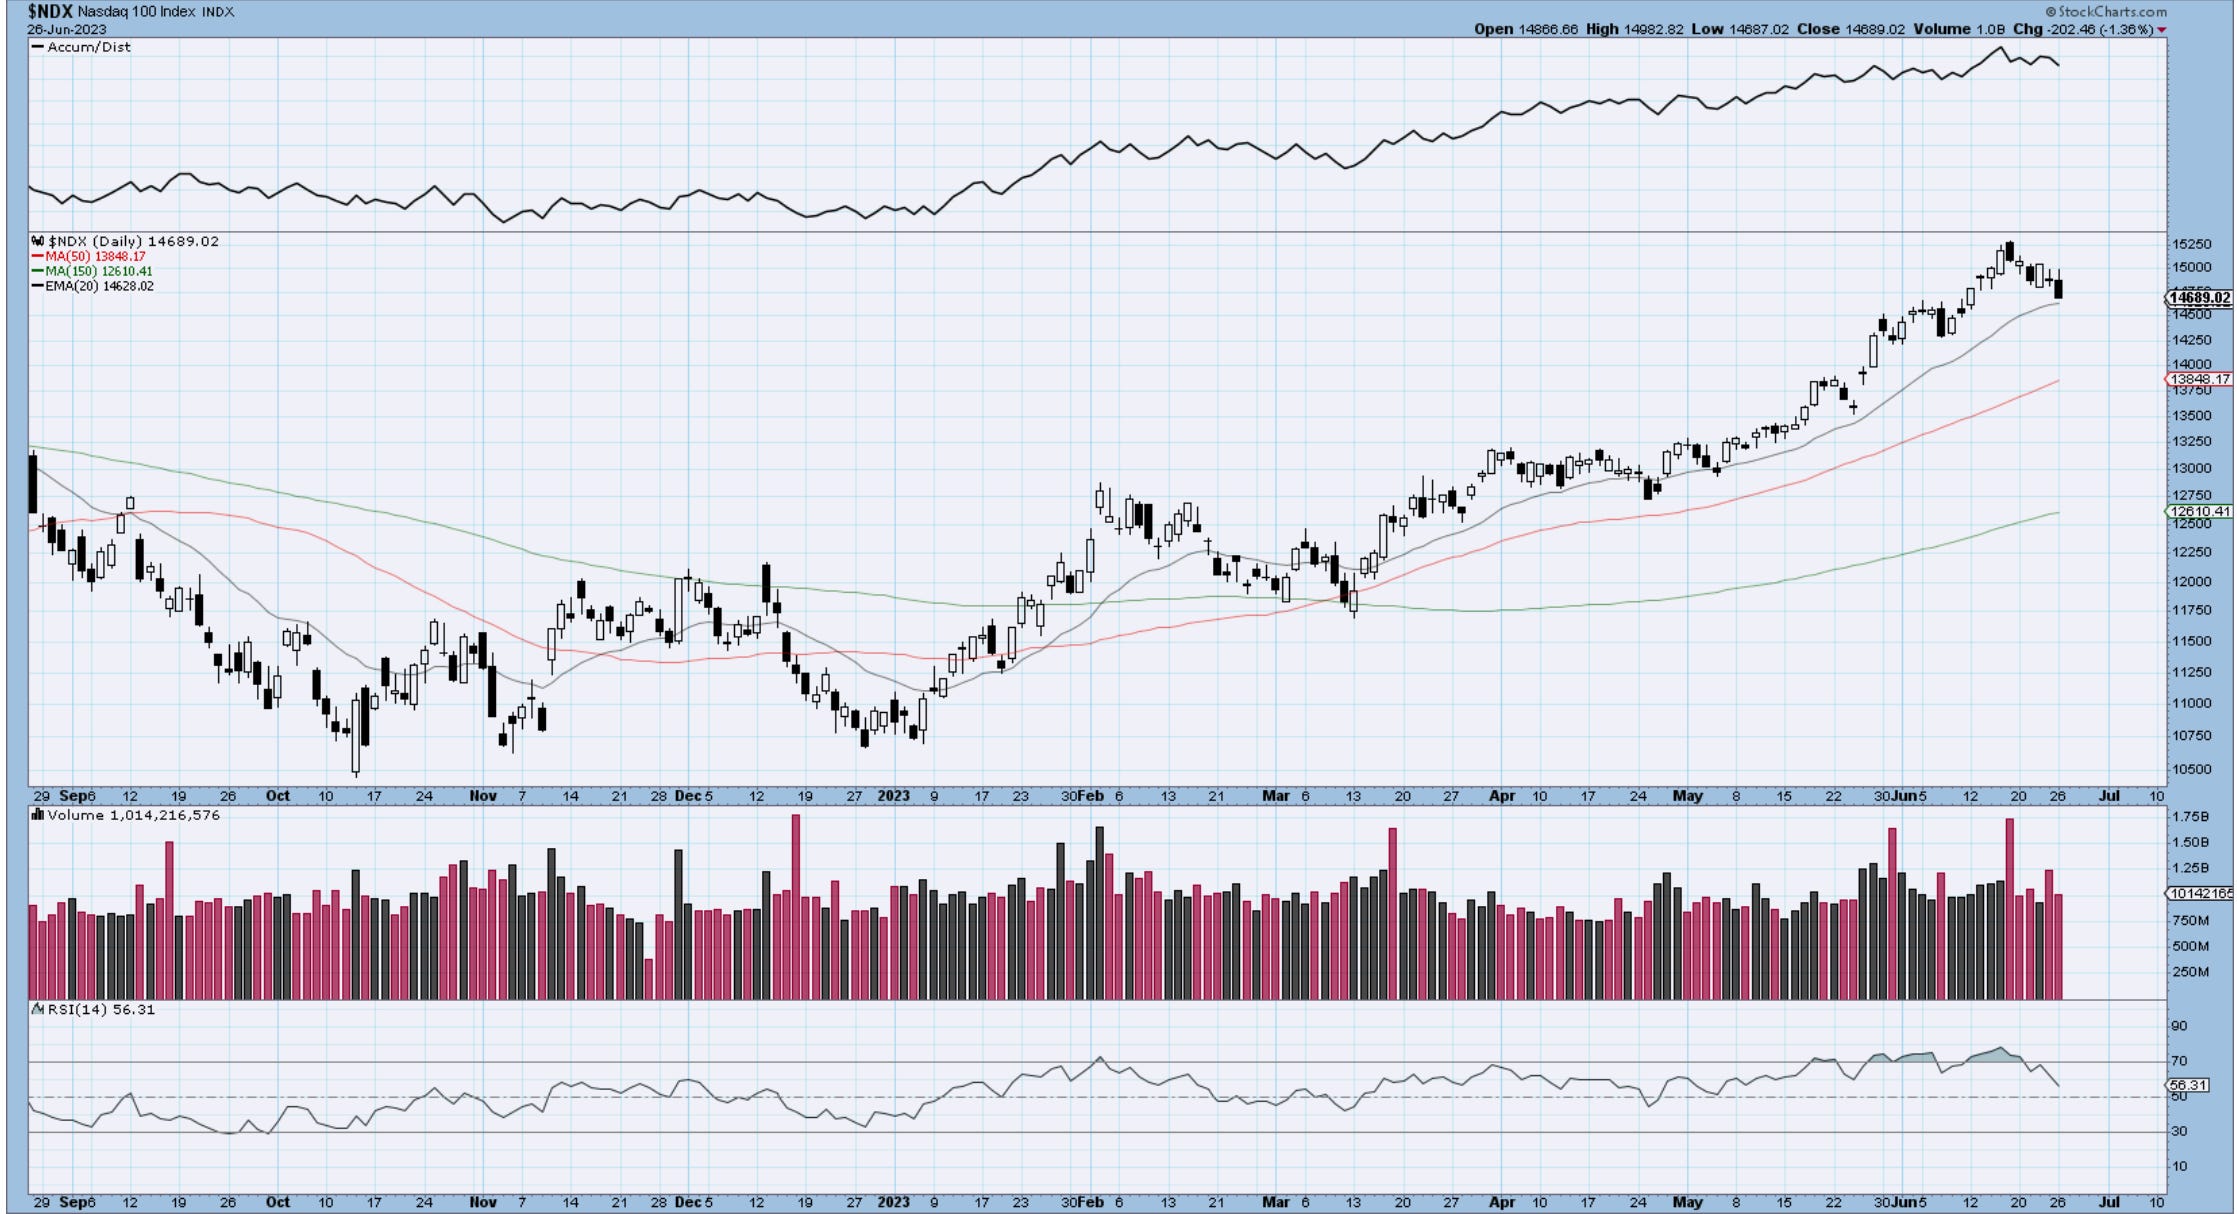
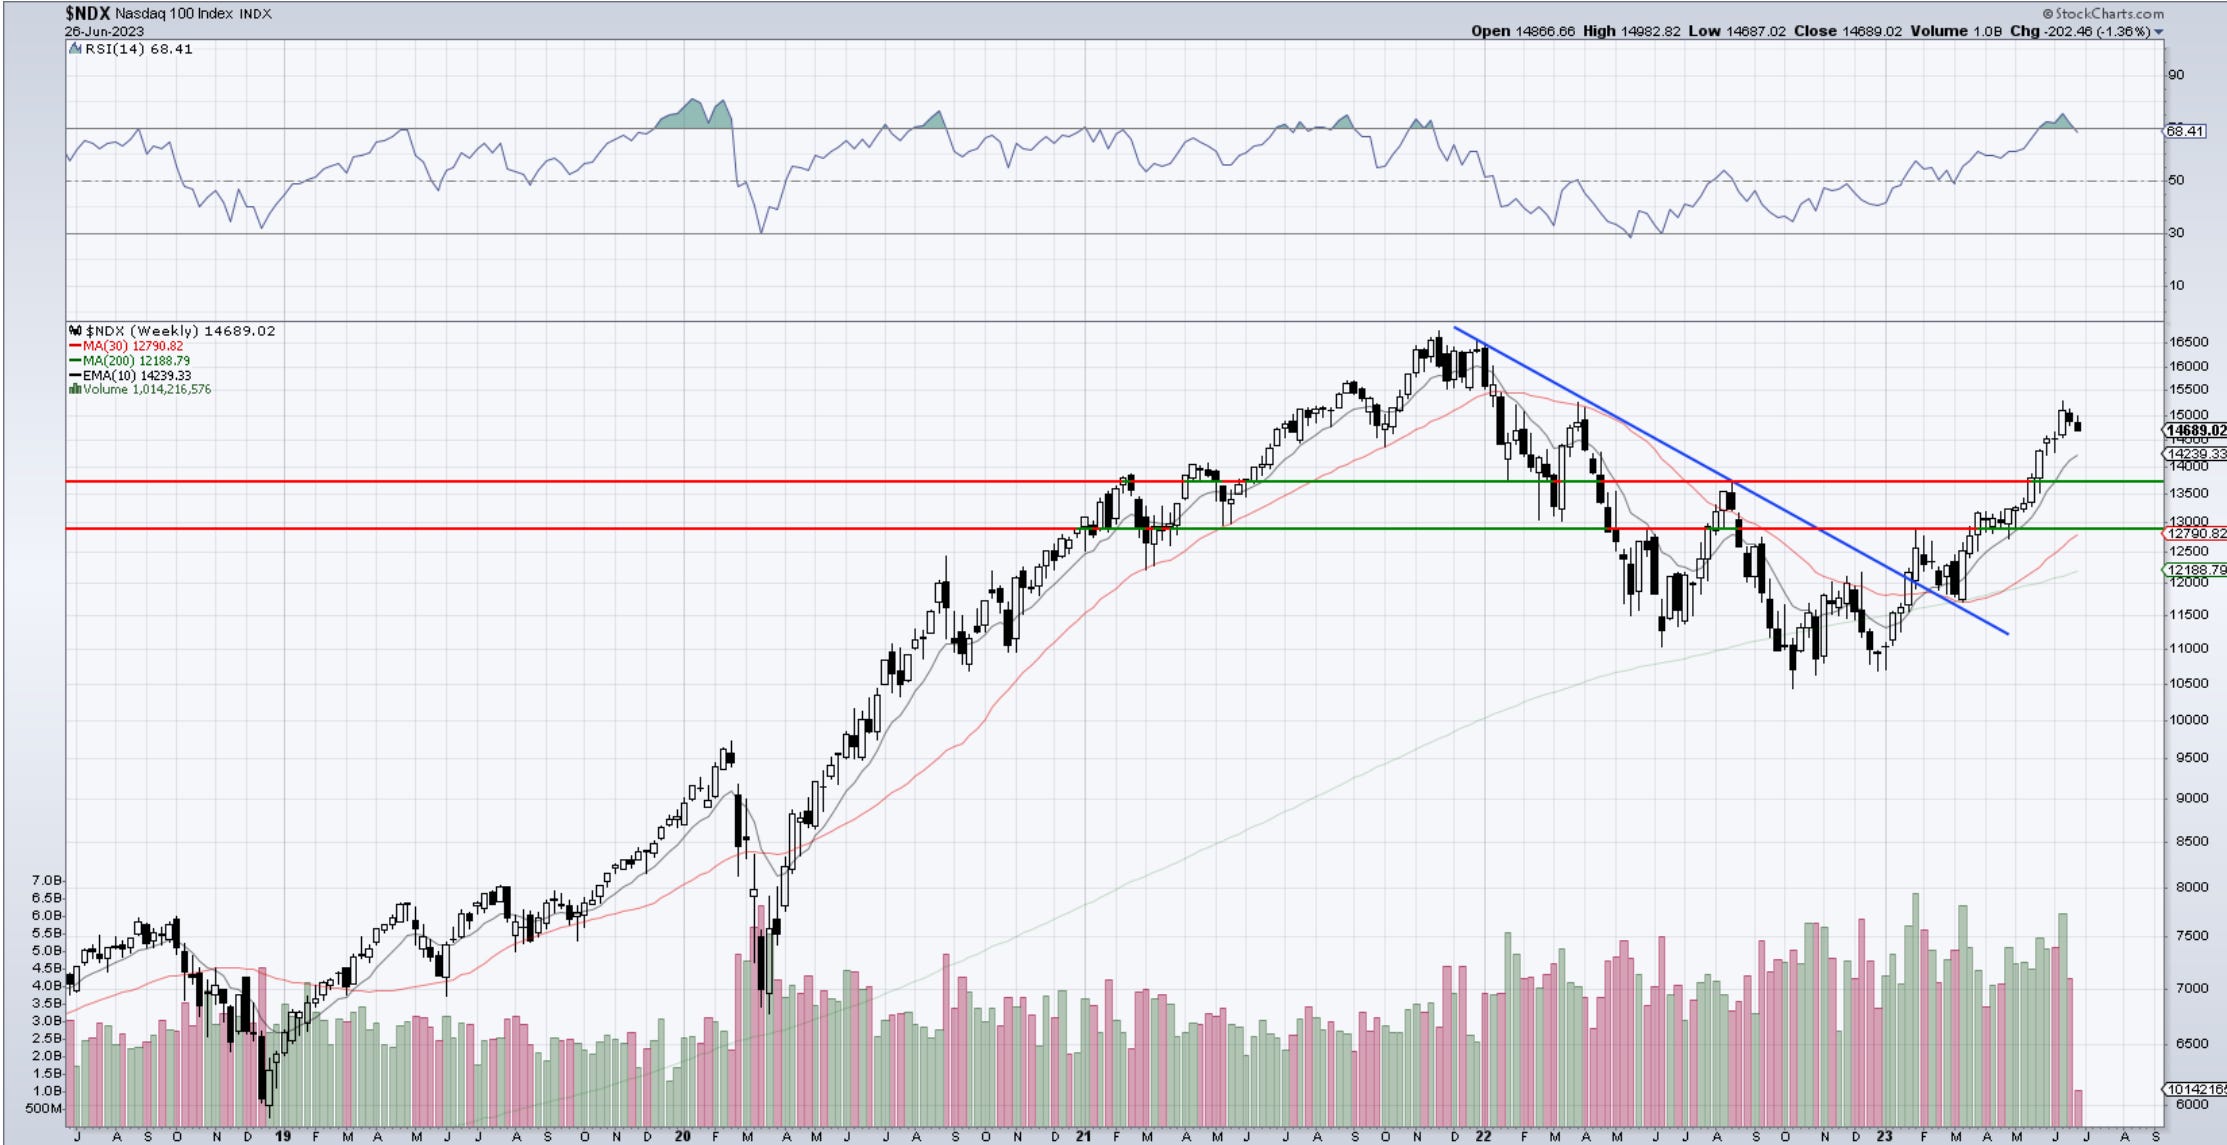
Nasdaq100
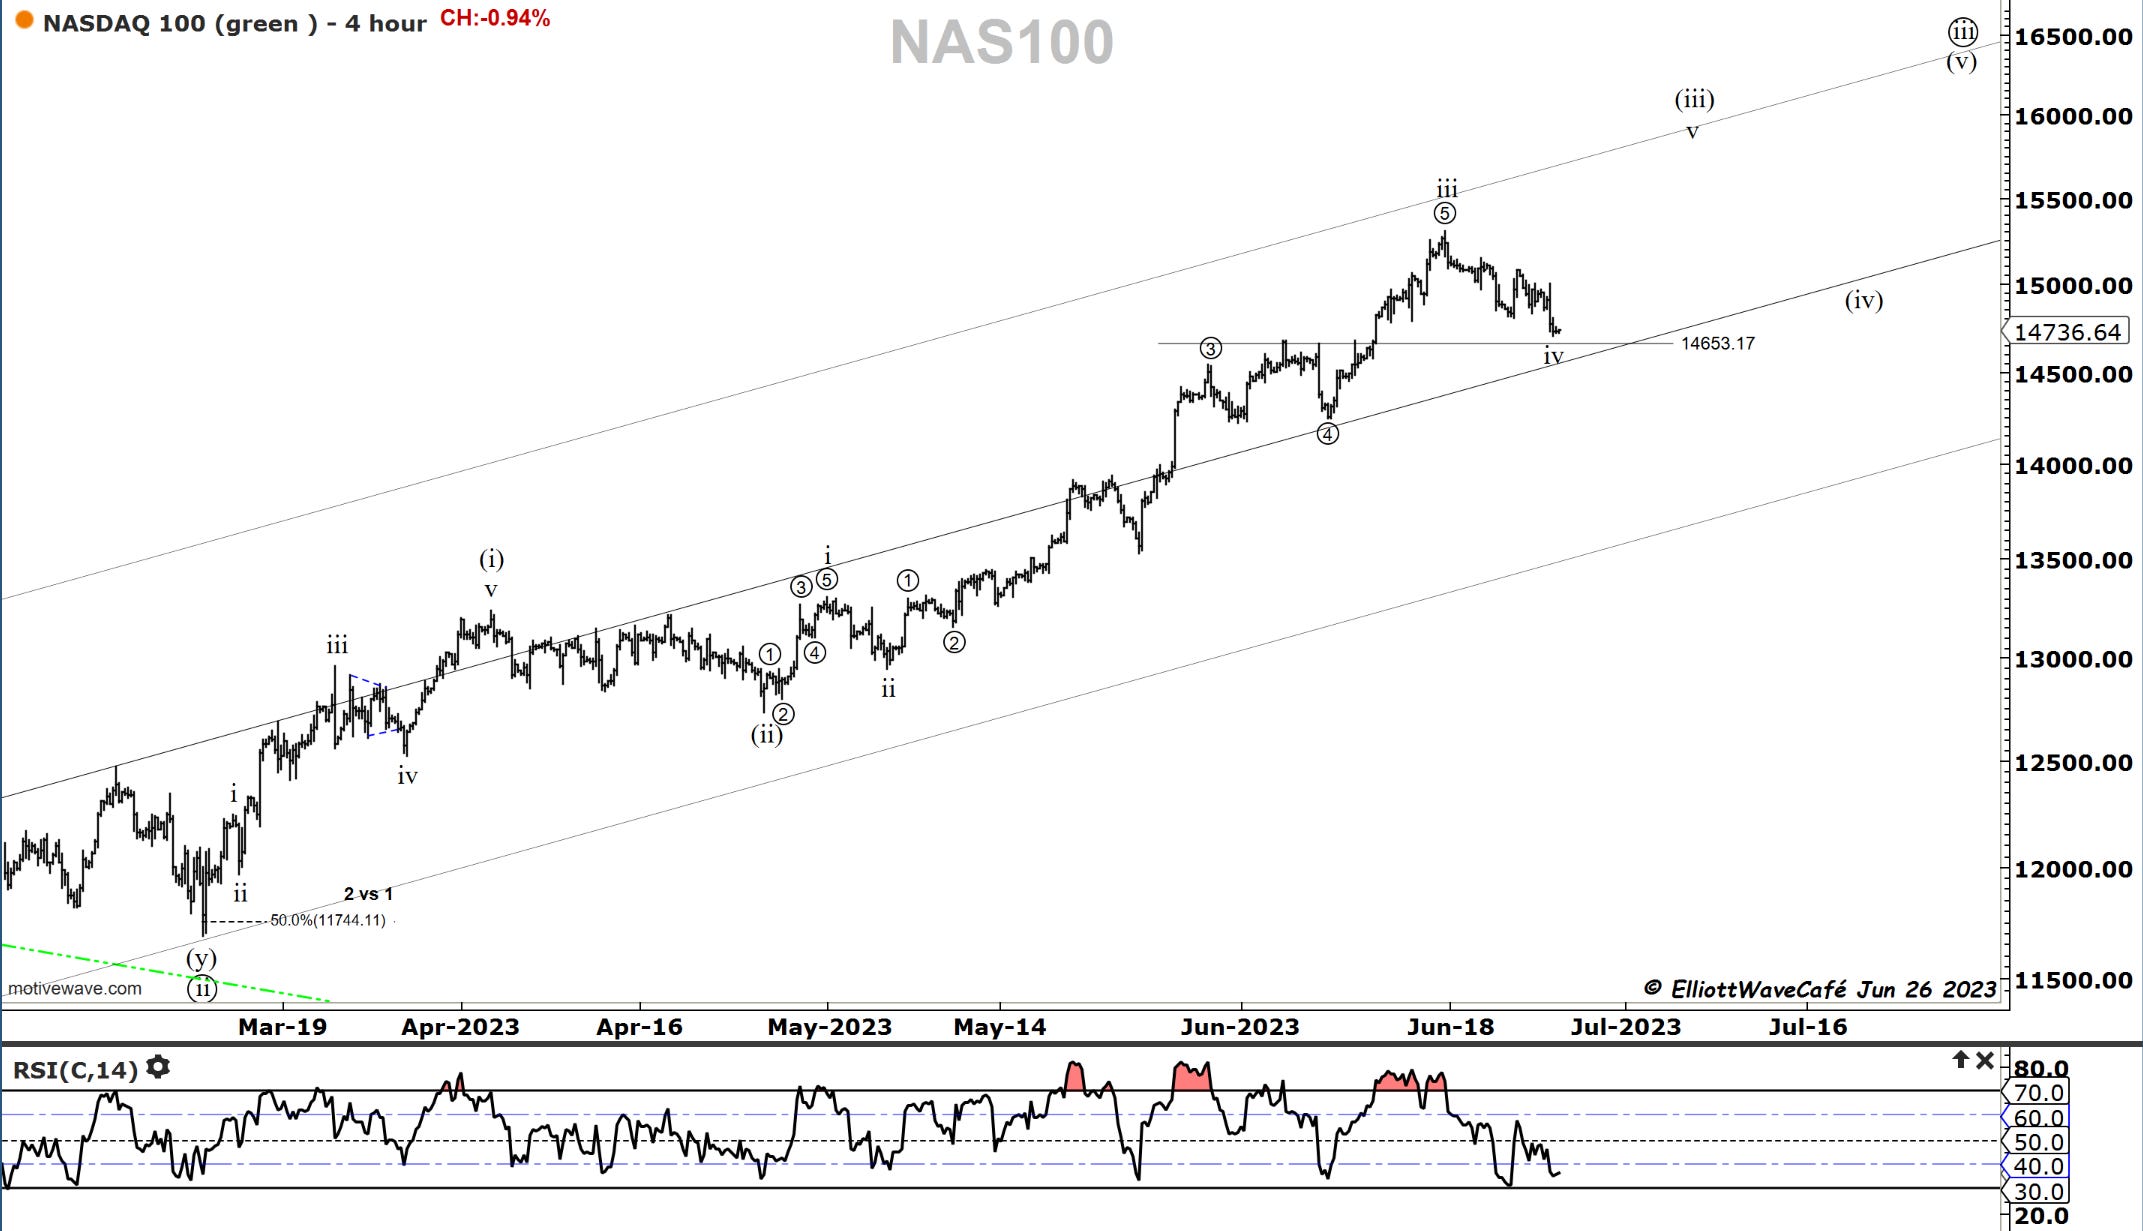
Nasdaq is sitting just on top of the prior swing highs. There is a lesson on horizontal levels on the site. I think there is a high chance that we hold here and we bounce. How high we will see, but we continue to follow the count. Daily is also tapping 20day. We’re on a clear 3rd wave impulse on weeklies. Tomorrow we will likely add TQQQ to active positions.
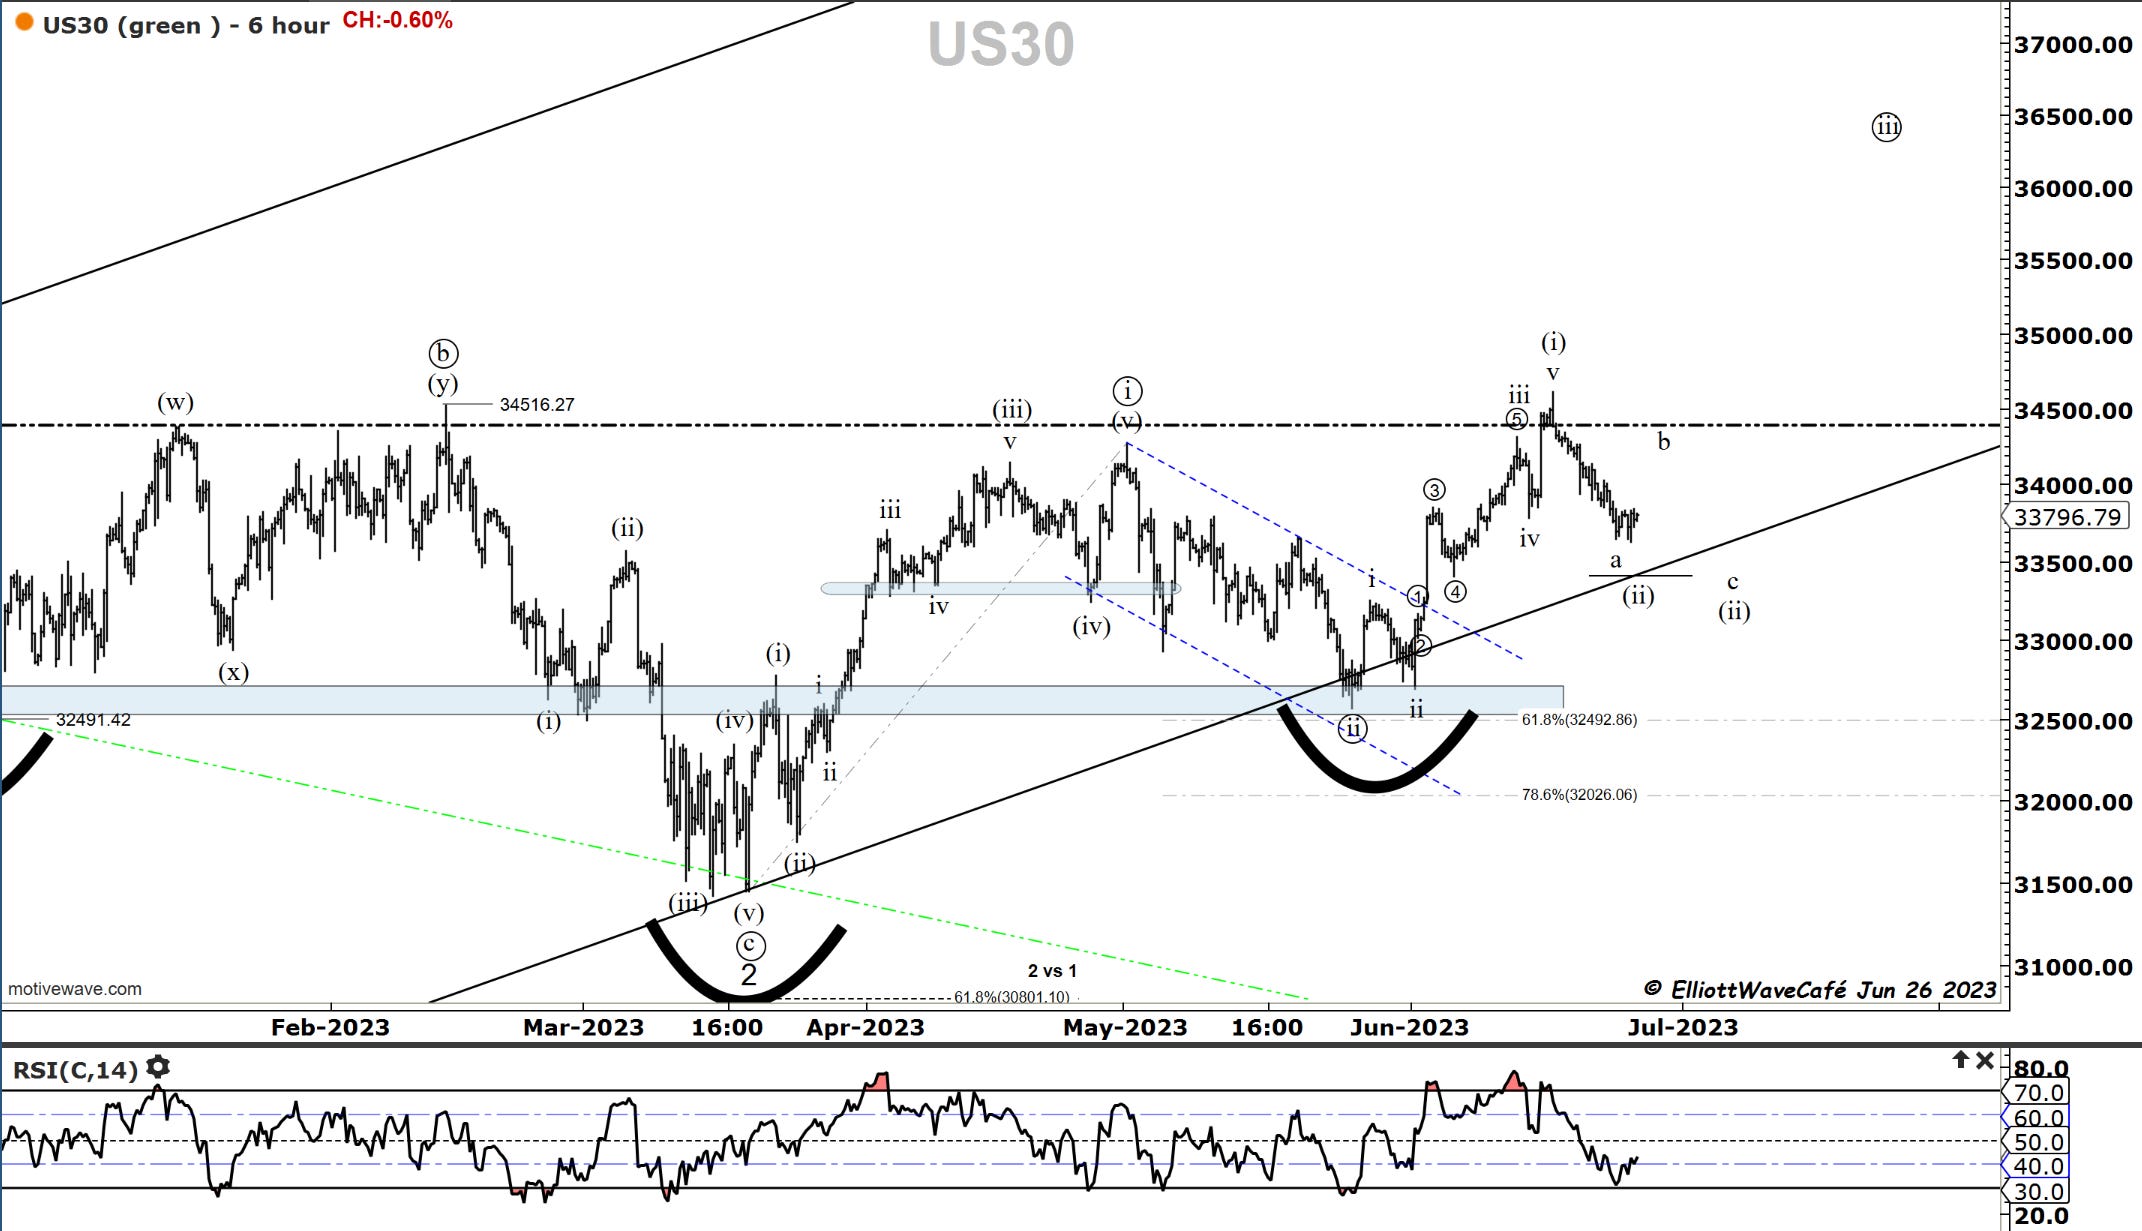
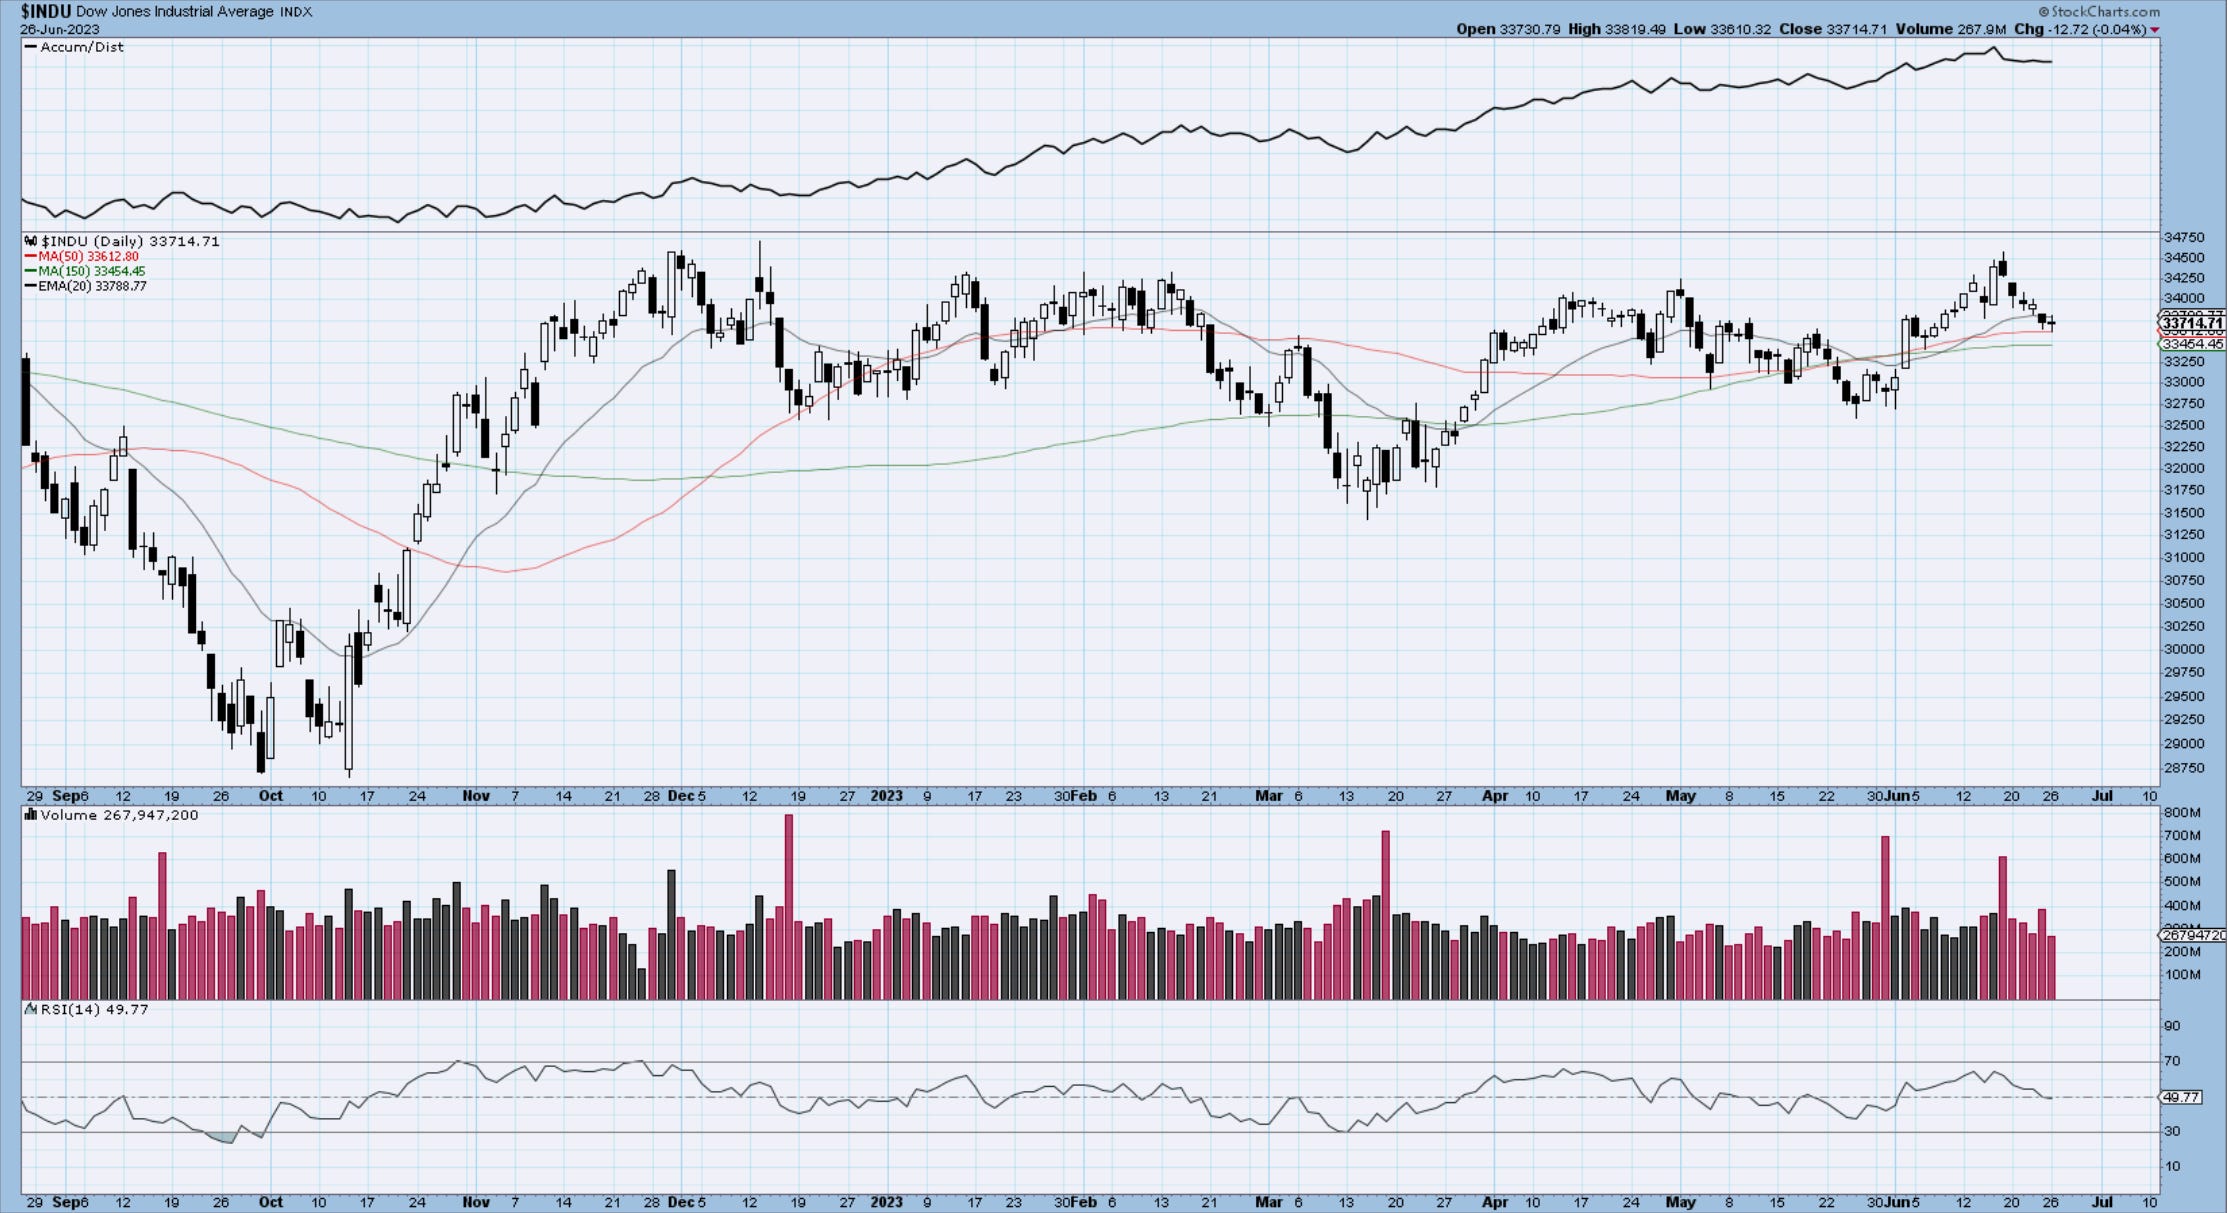
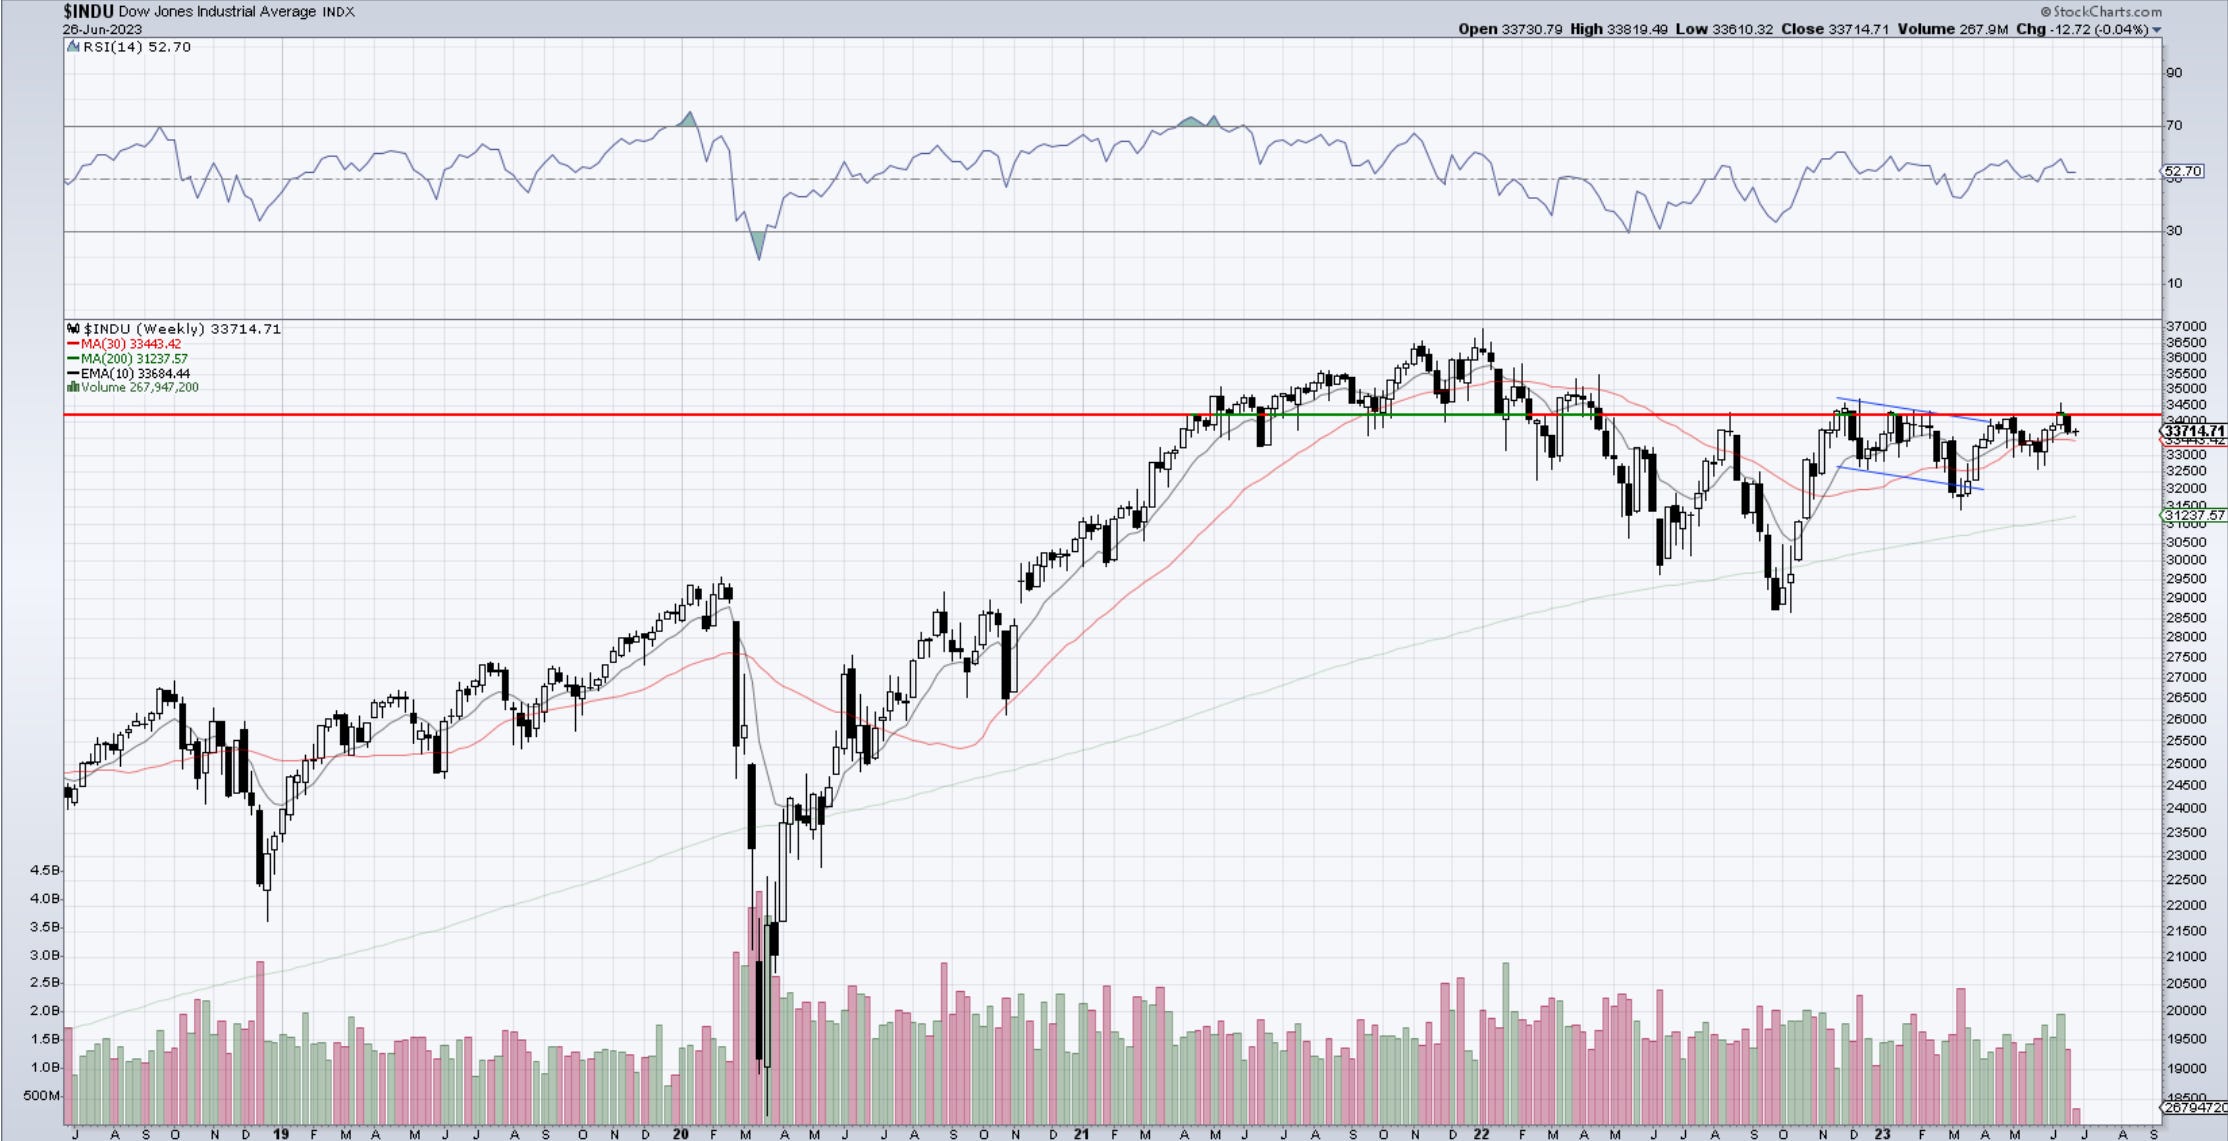
Dow30
Dow tested those lows twice already and held. I would dare say buyers are showing up and supporting this thing. I want to be amongst them. Once we clear 34,500 for good the move will gain acceleration. I do not want to miss that leg of the move. It’s been a sideways beast and underperformed the spiders, but it’s time is coming.
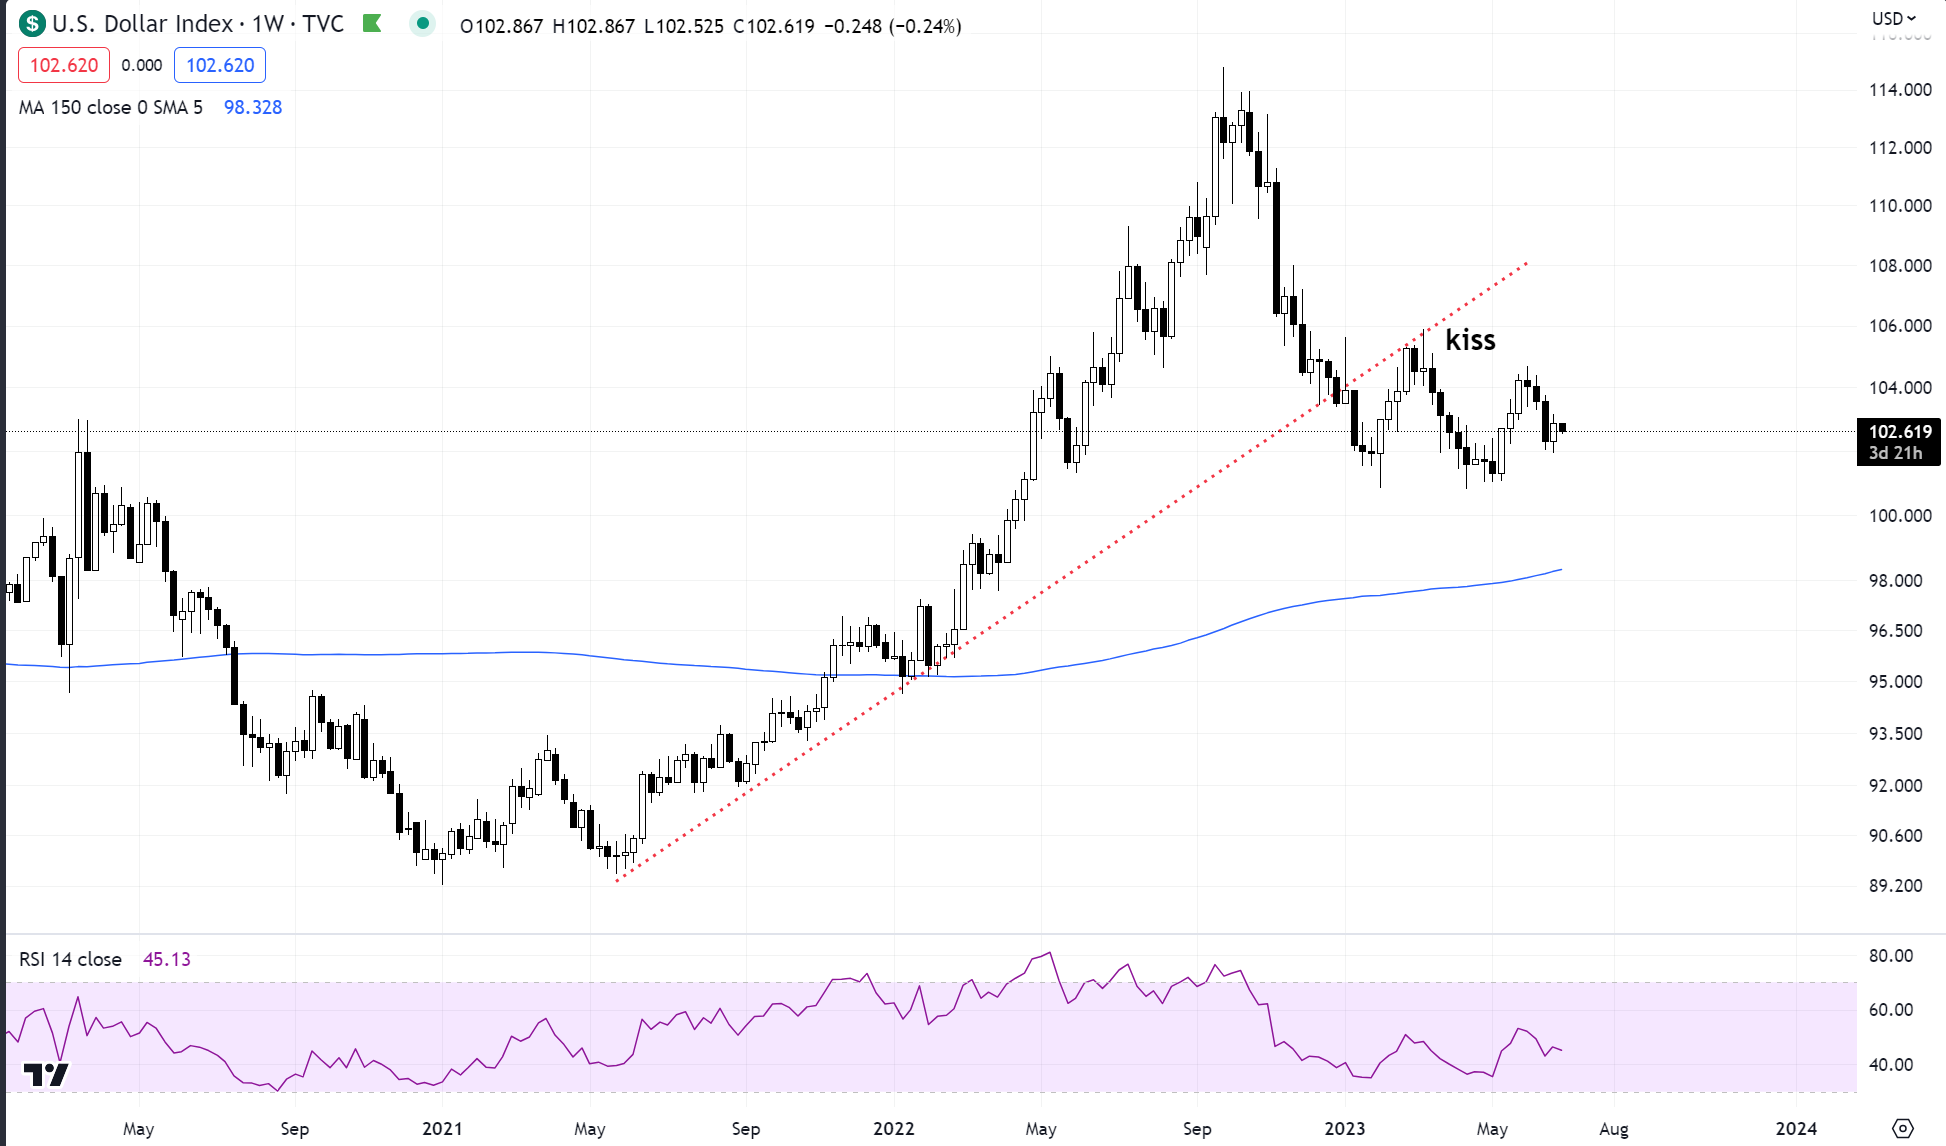
US Dollar
Nothing major to report on the Dollar, other than the fact that it remains weak. It has not staged anything worth noting and the structure it builds suggests more downside. They’re defending 100 by placing bids ahead of that level. It’s held several times, but each bounce is also weaker. This equilibrium will be destabilized in the not-too-distant future.
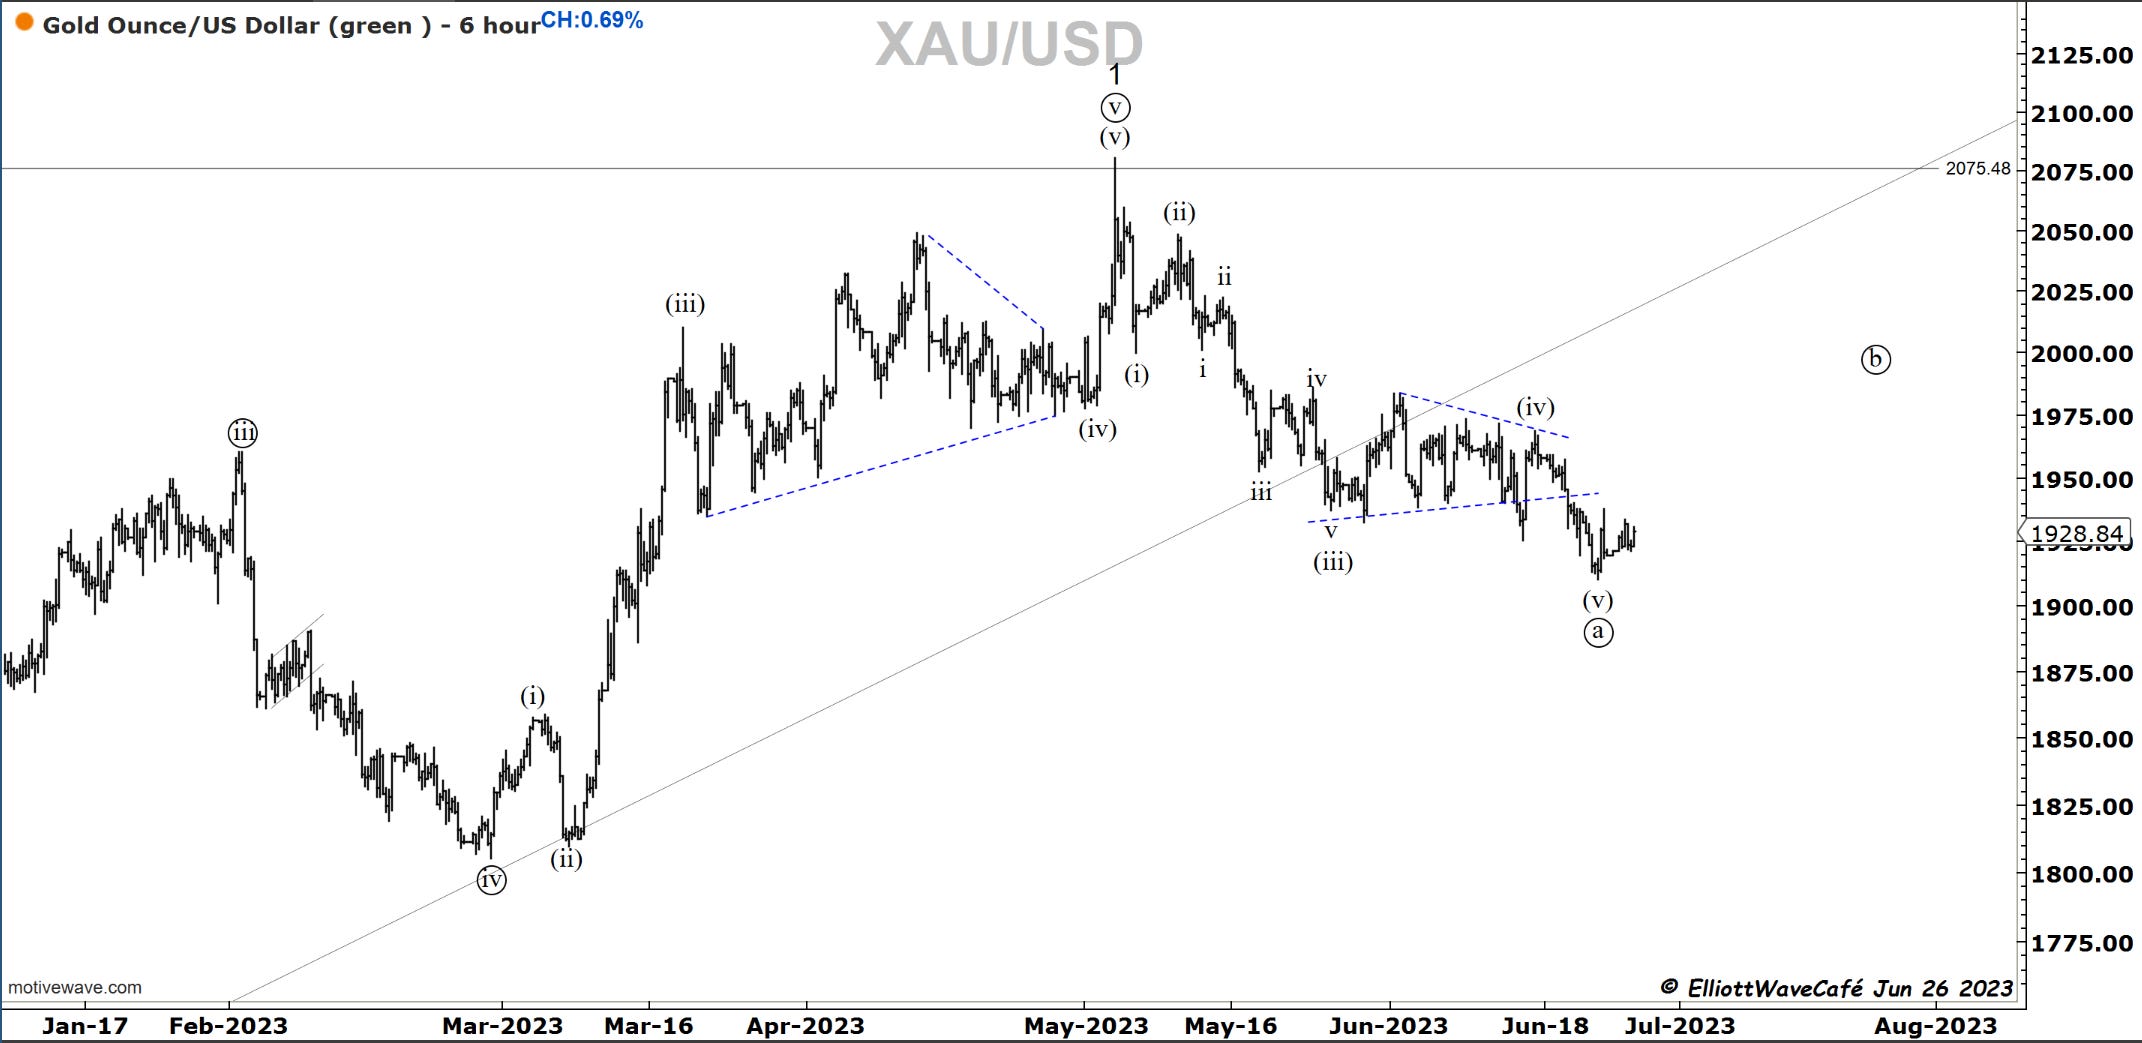
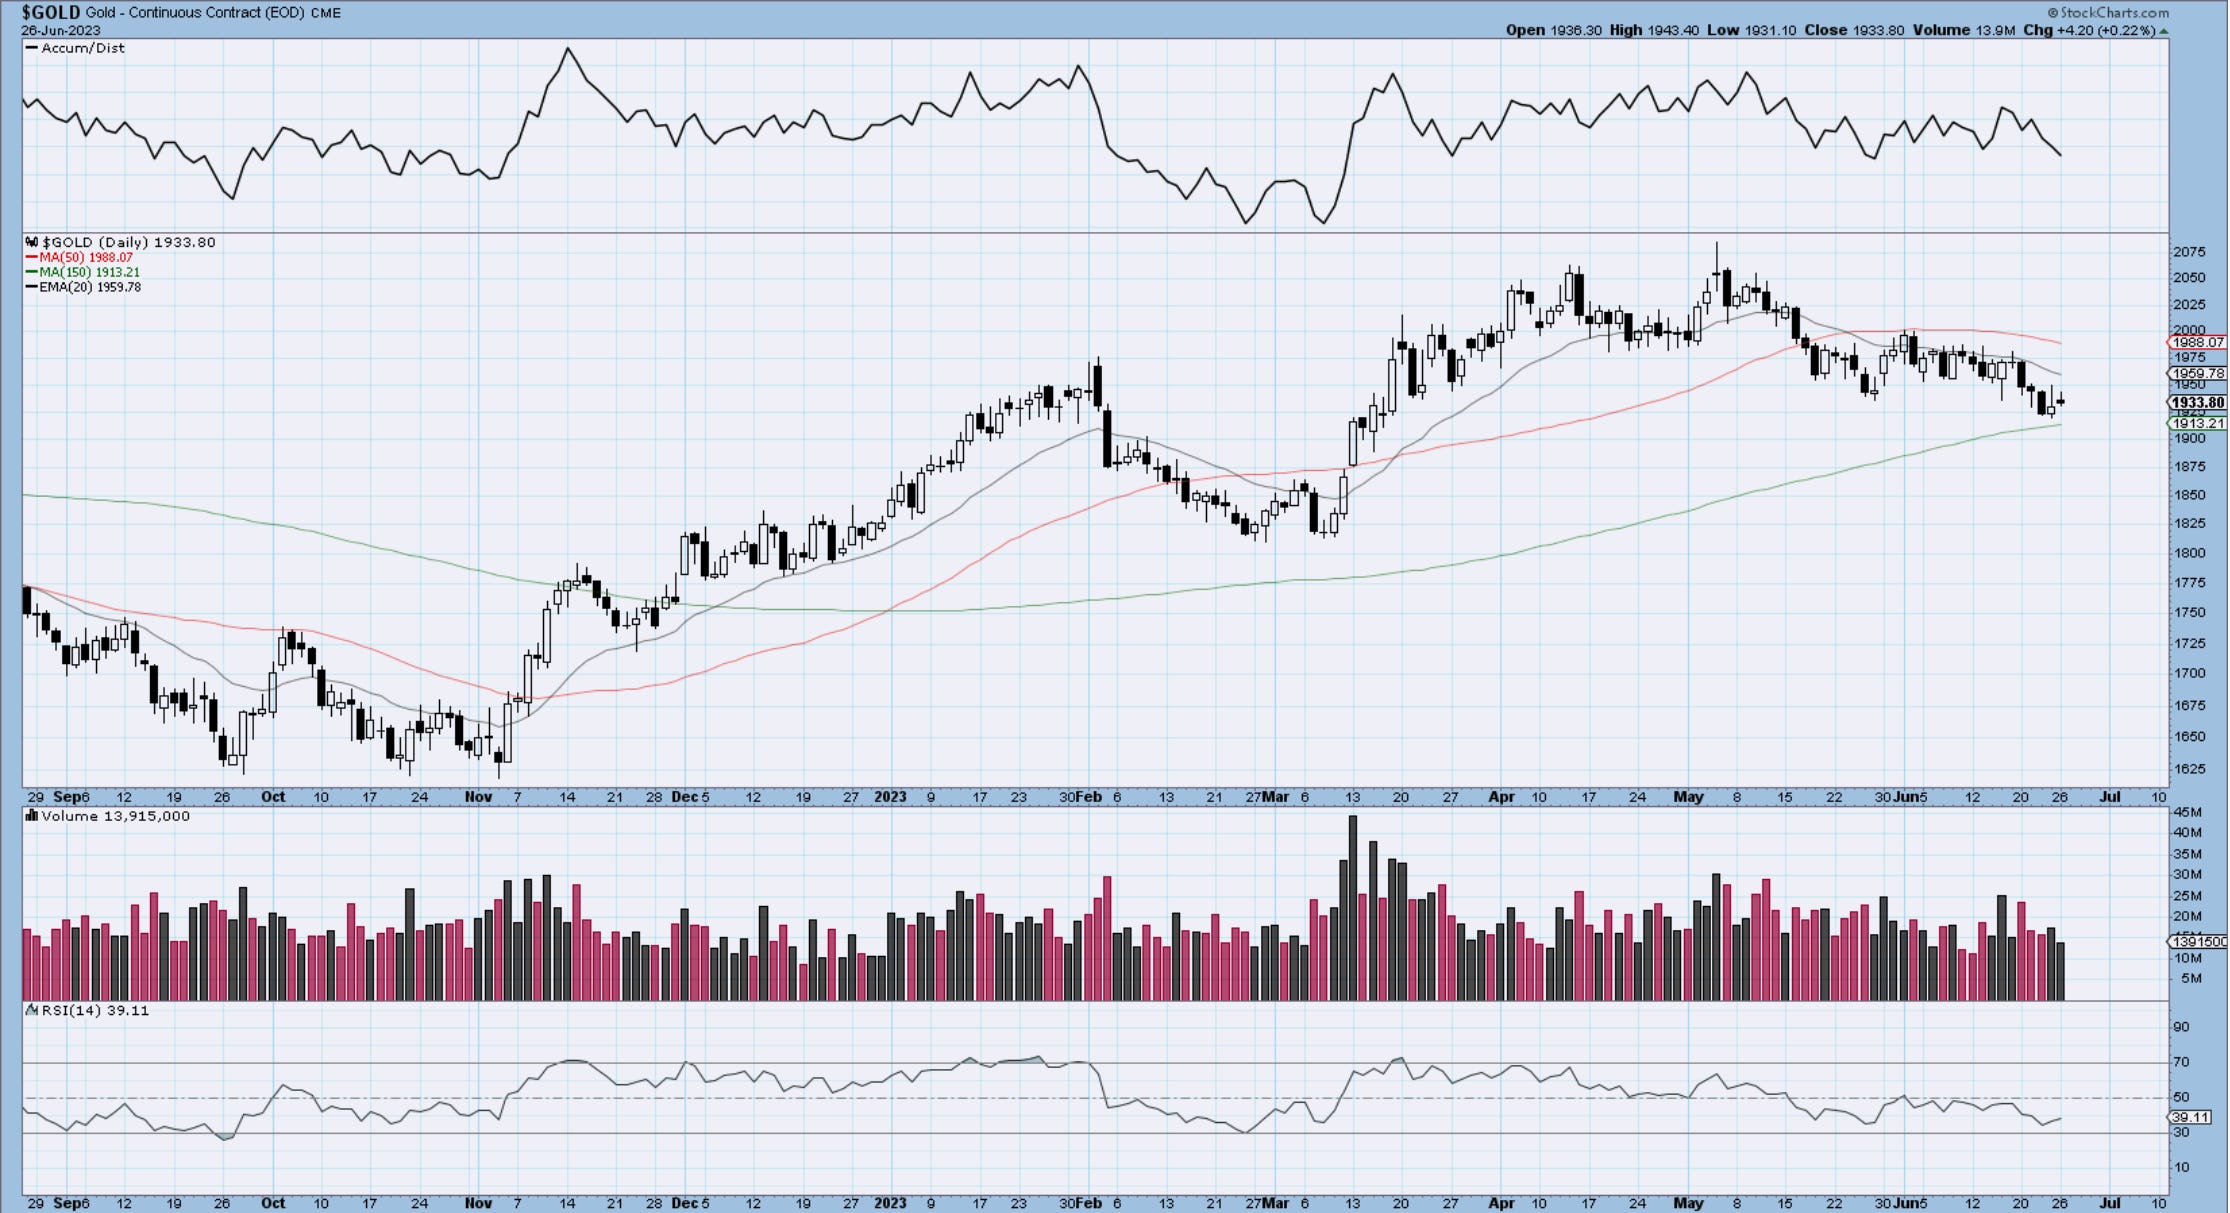
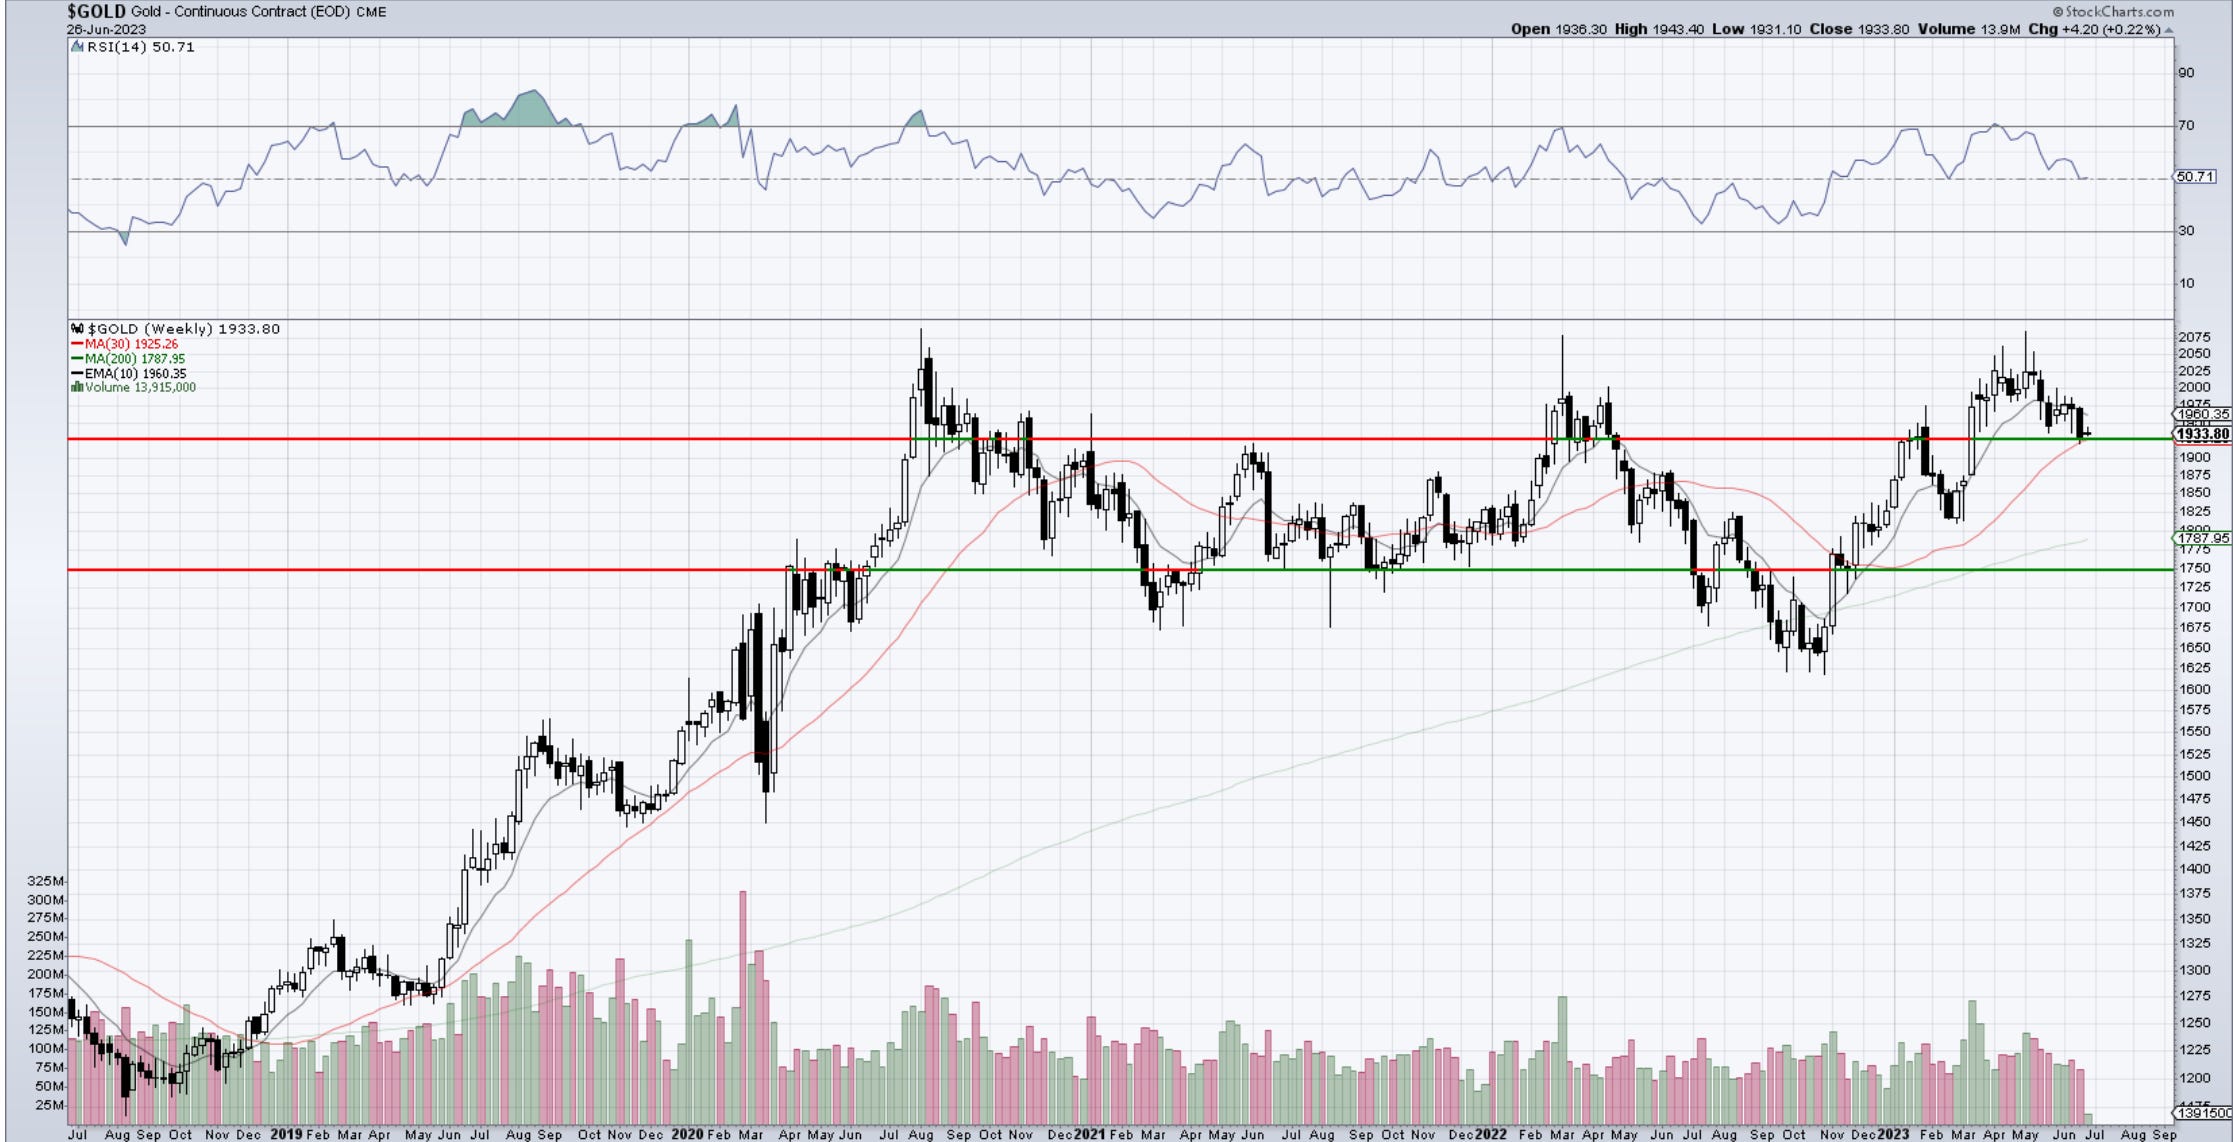
Gold
The count, the horizontal levels, and the trendlines are suggesting gold should have some bids coming in. It’s hard to be too ambitious on the upside with several resistance levels lurking, but it looks like we could be getting some traction. I put GLD in the ETFs portfolio for this exact reason.
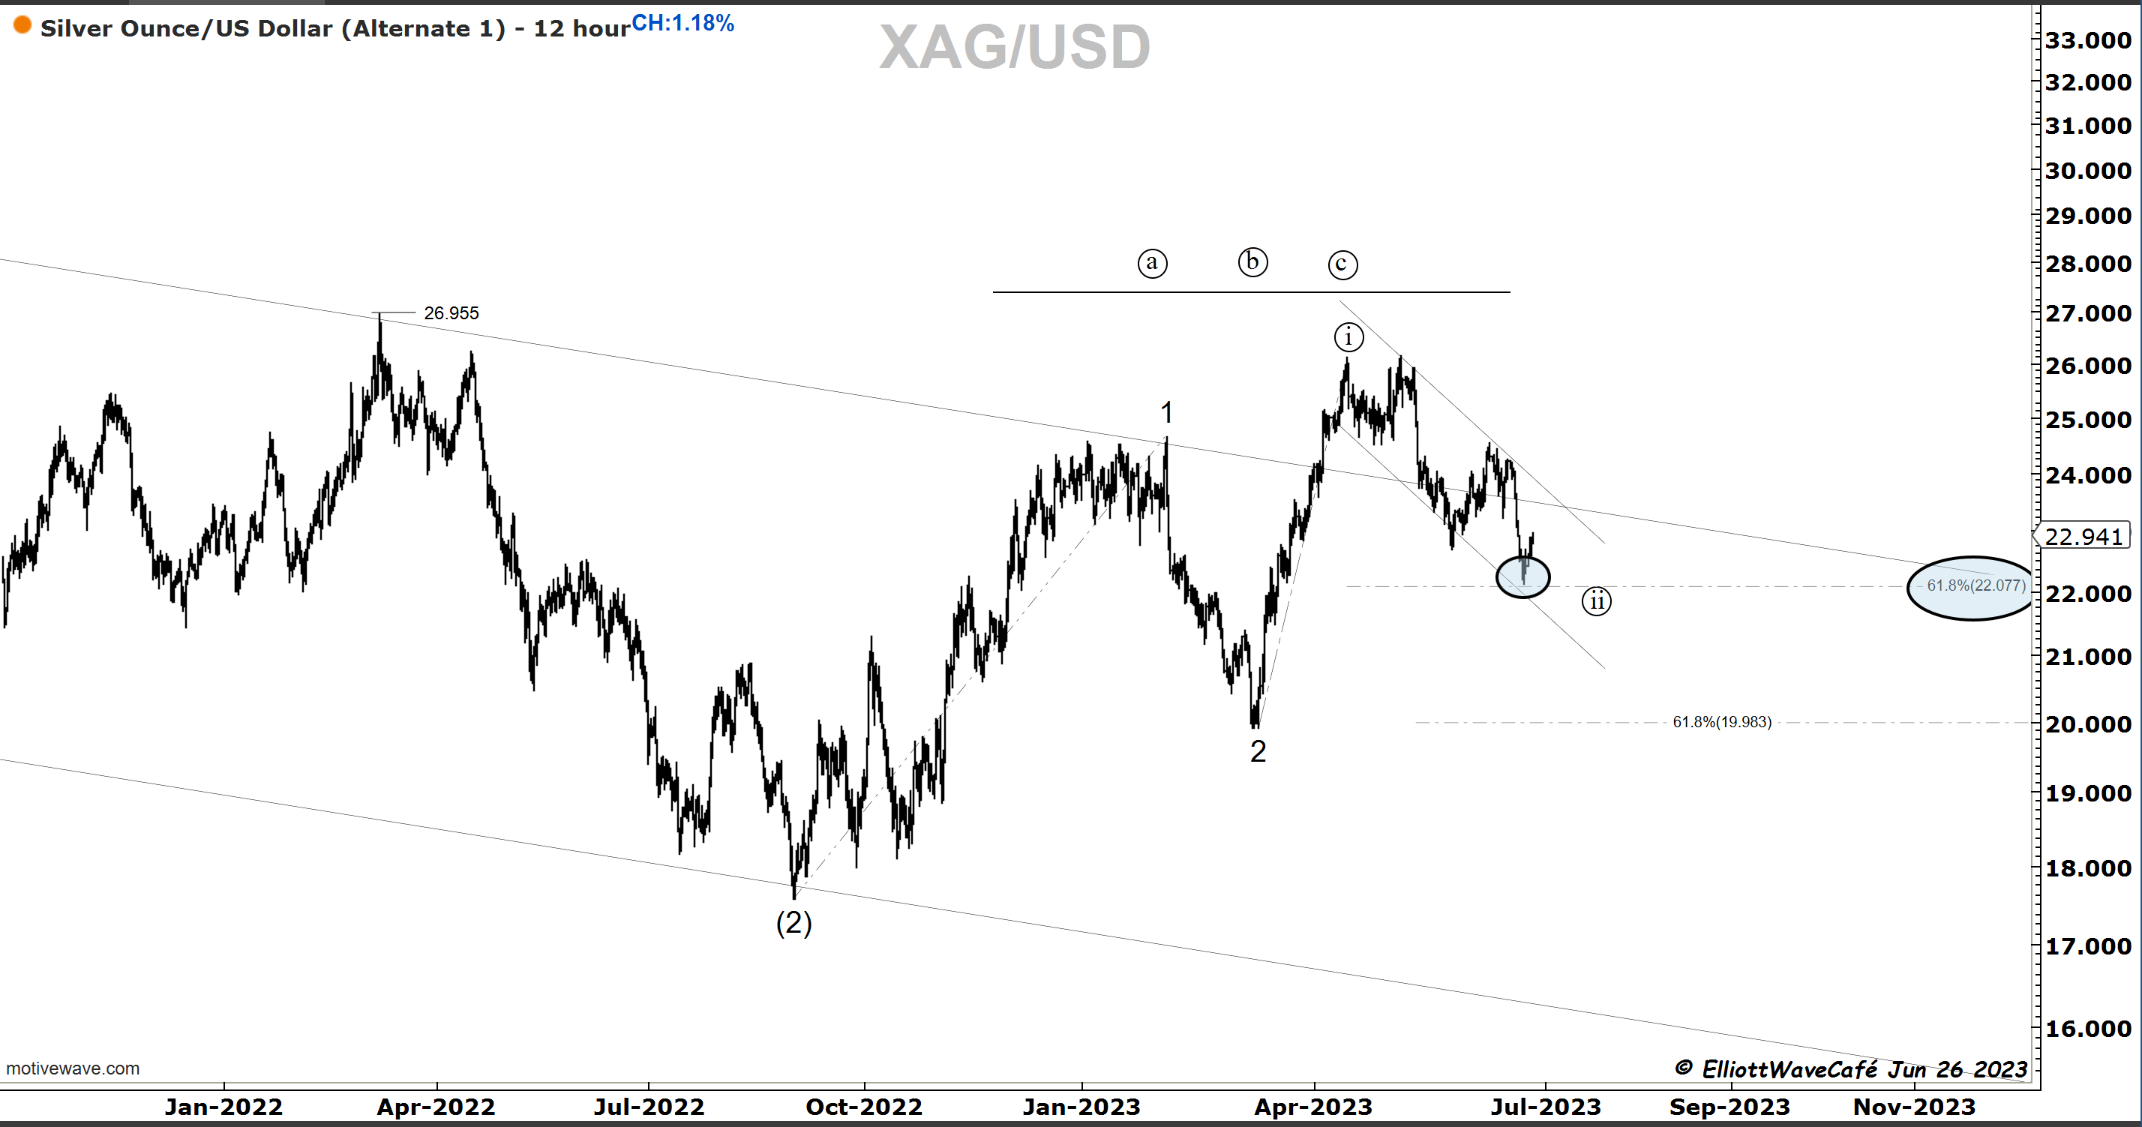
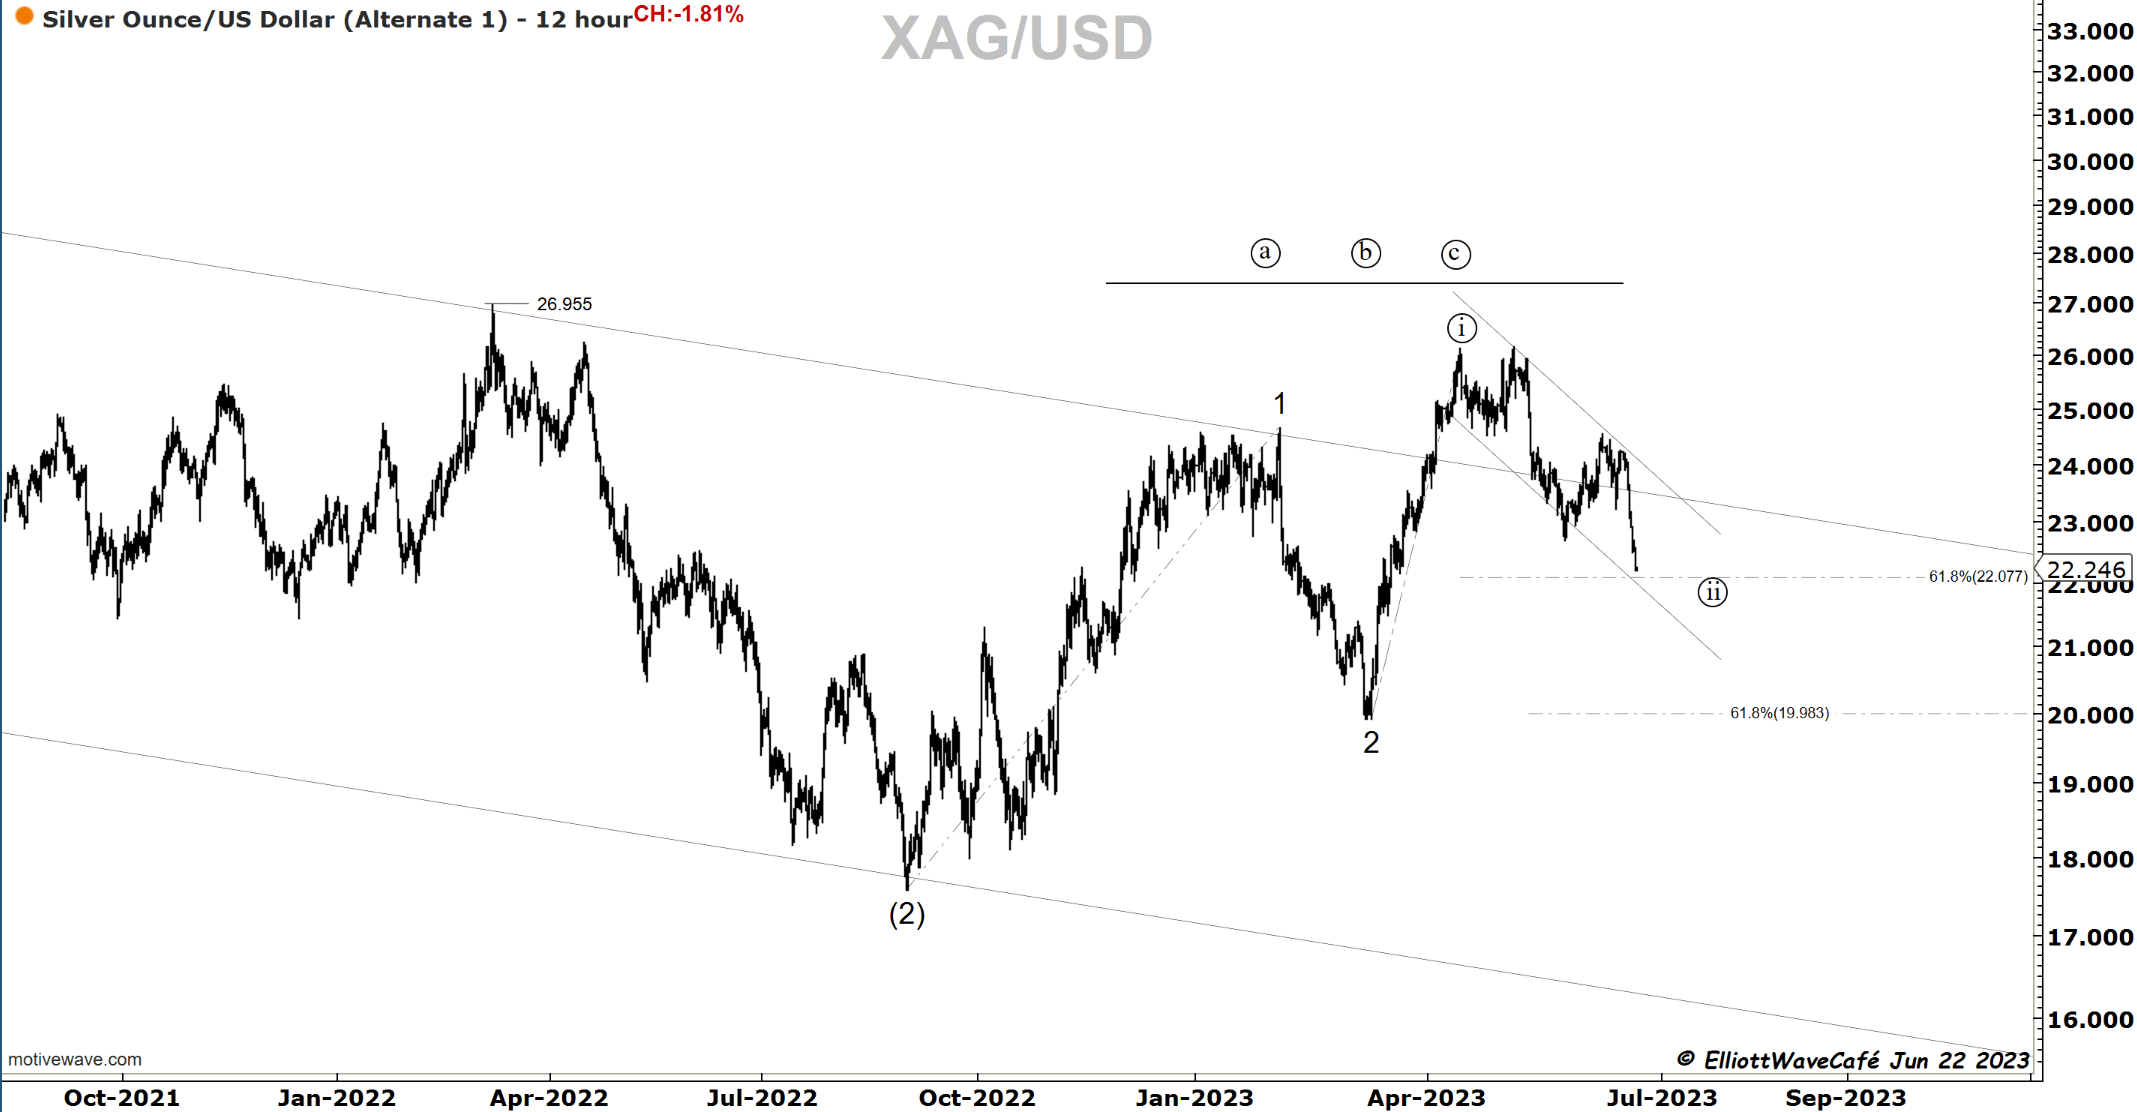
Silver
Are fibs beautiful or what? June 22nd chart below. Not sure what to make of it, plenty of overhead supply. Maybe get more excited if it breaks 24.30. There is a channel in there as well.
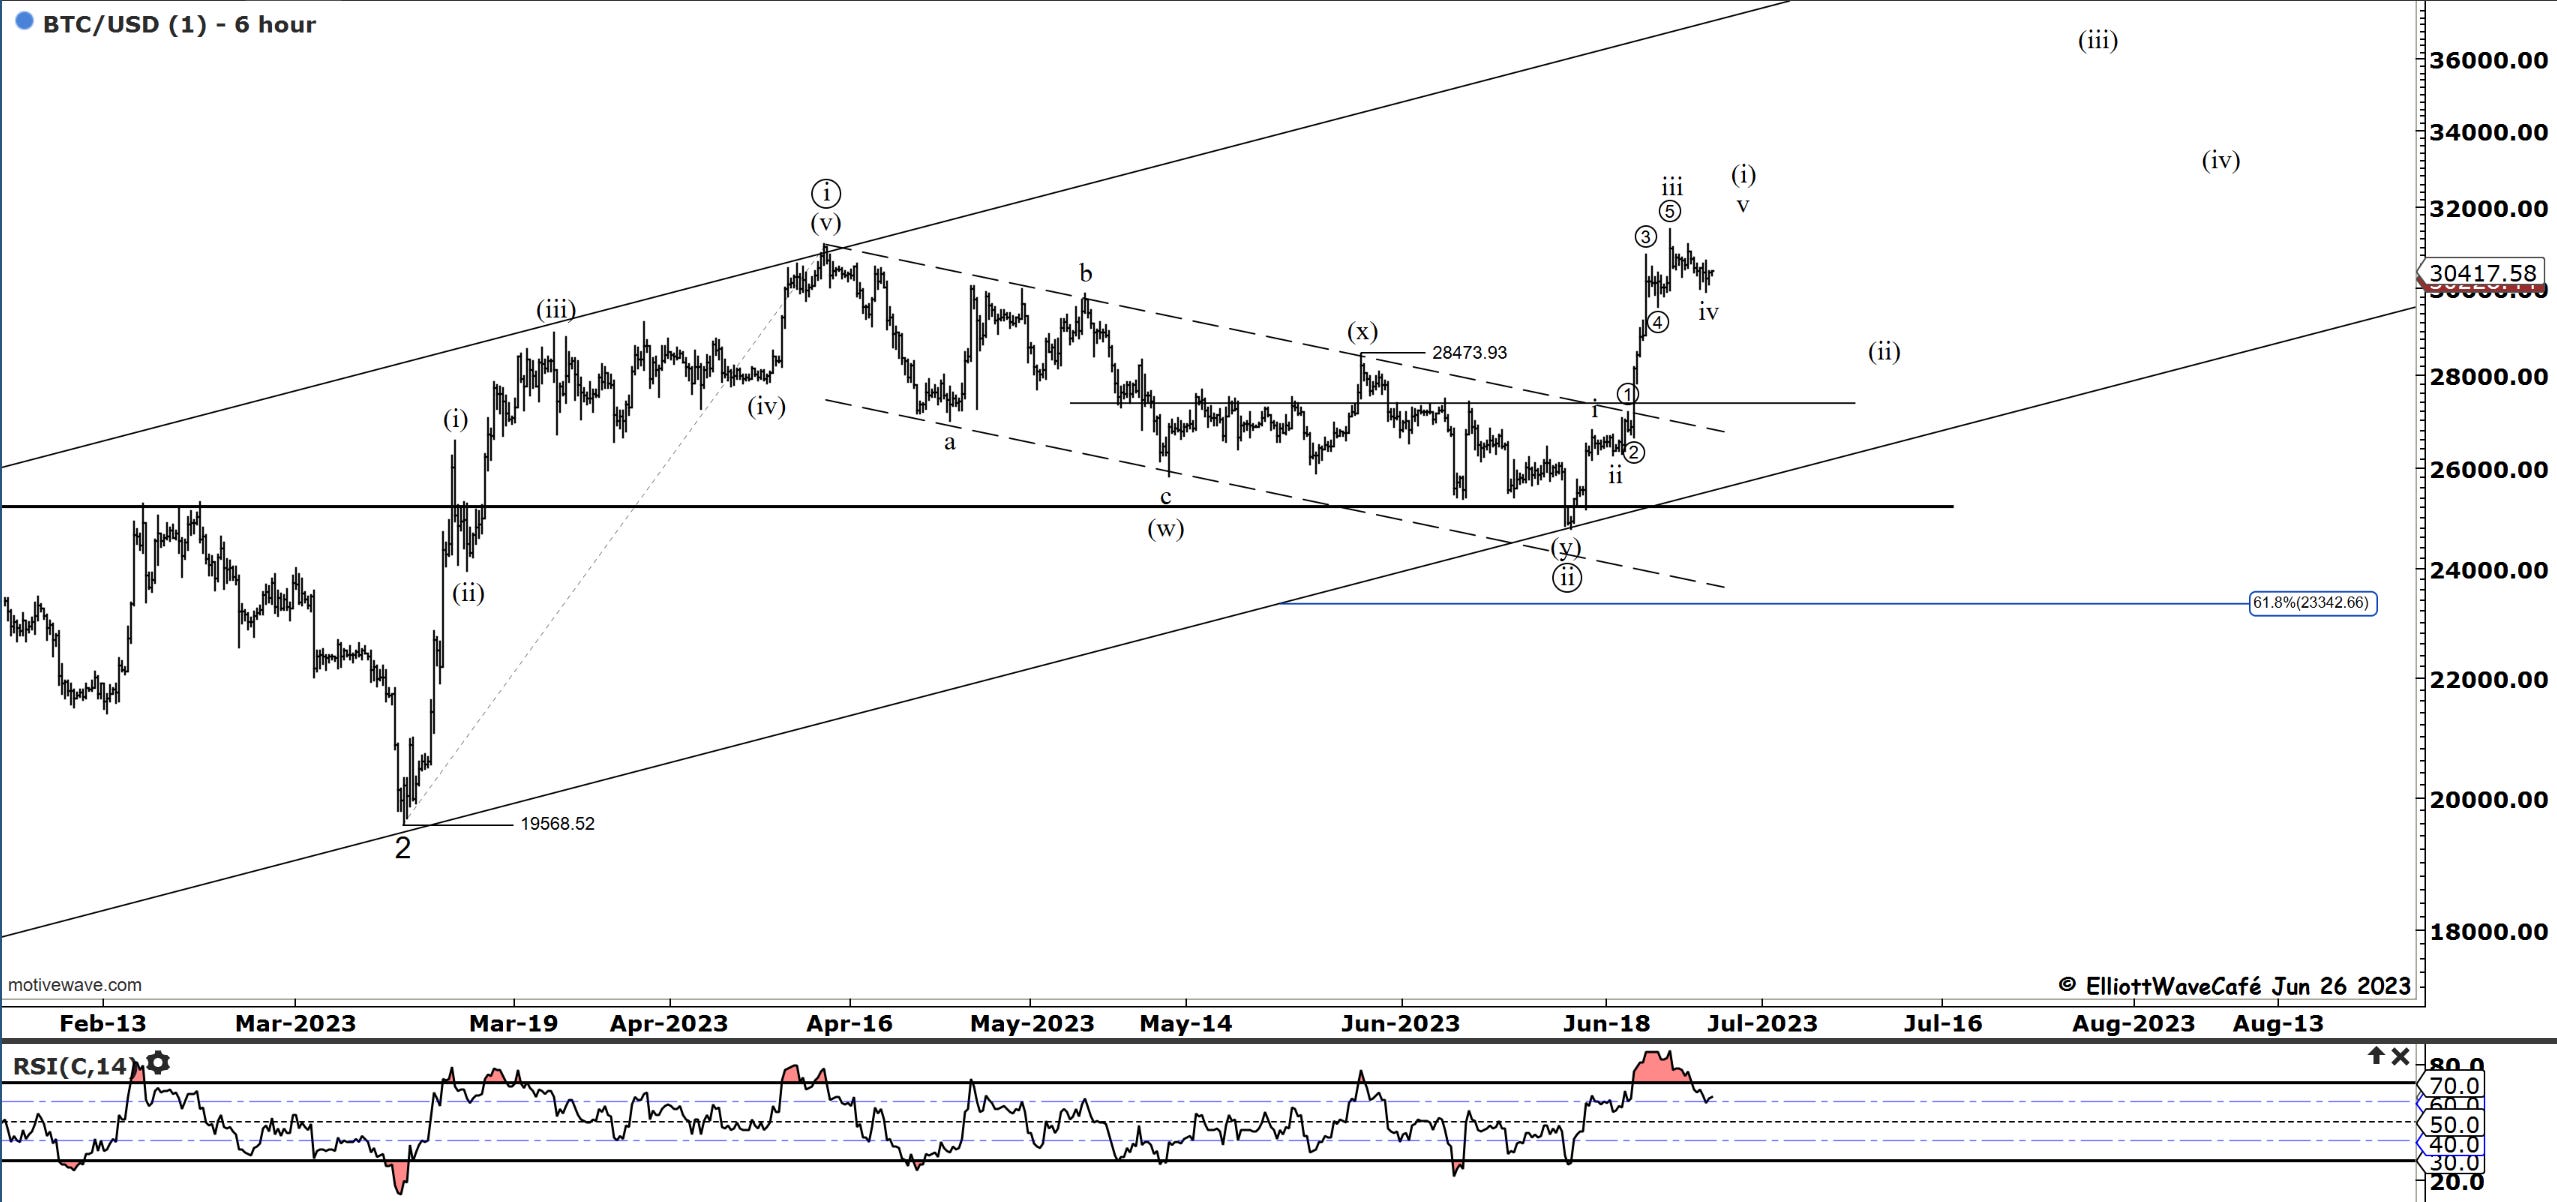
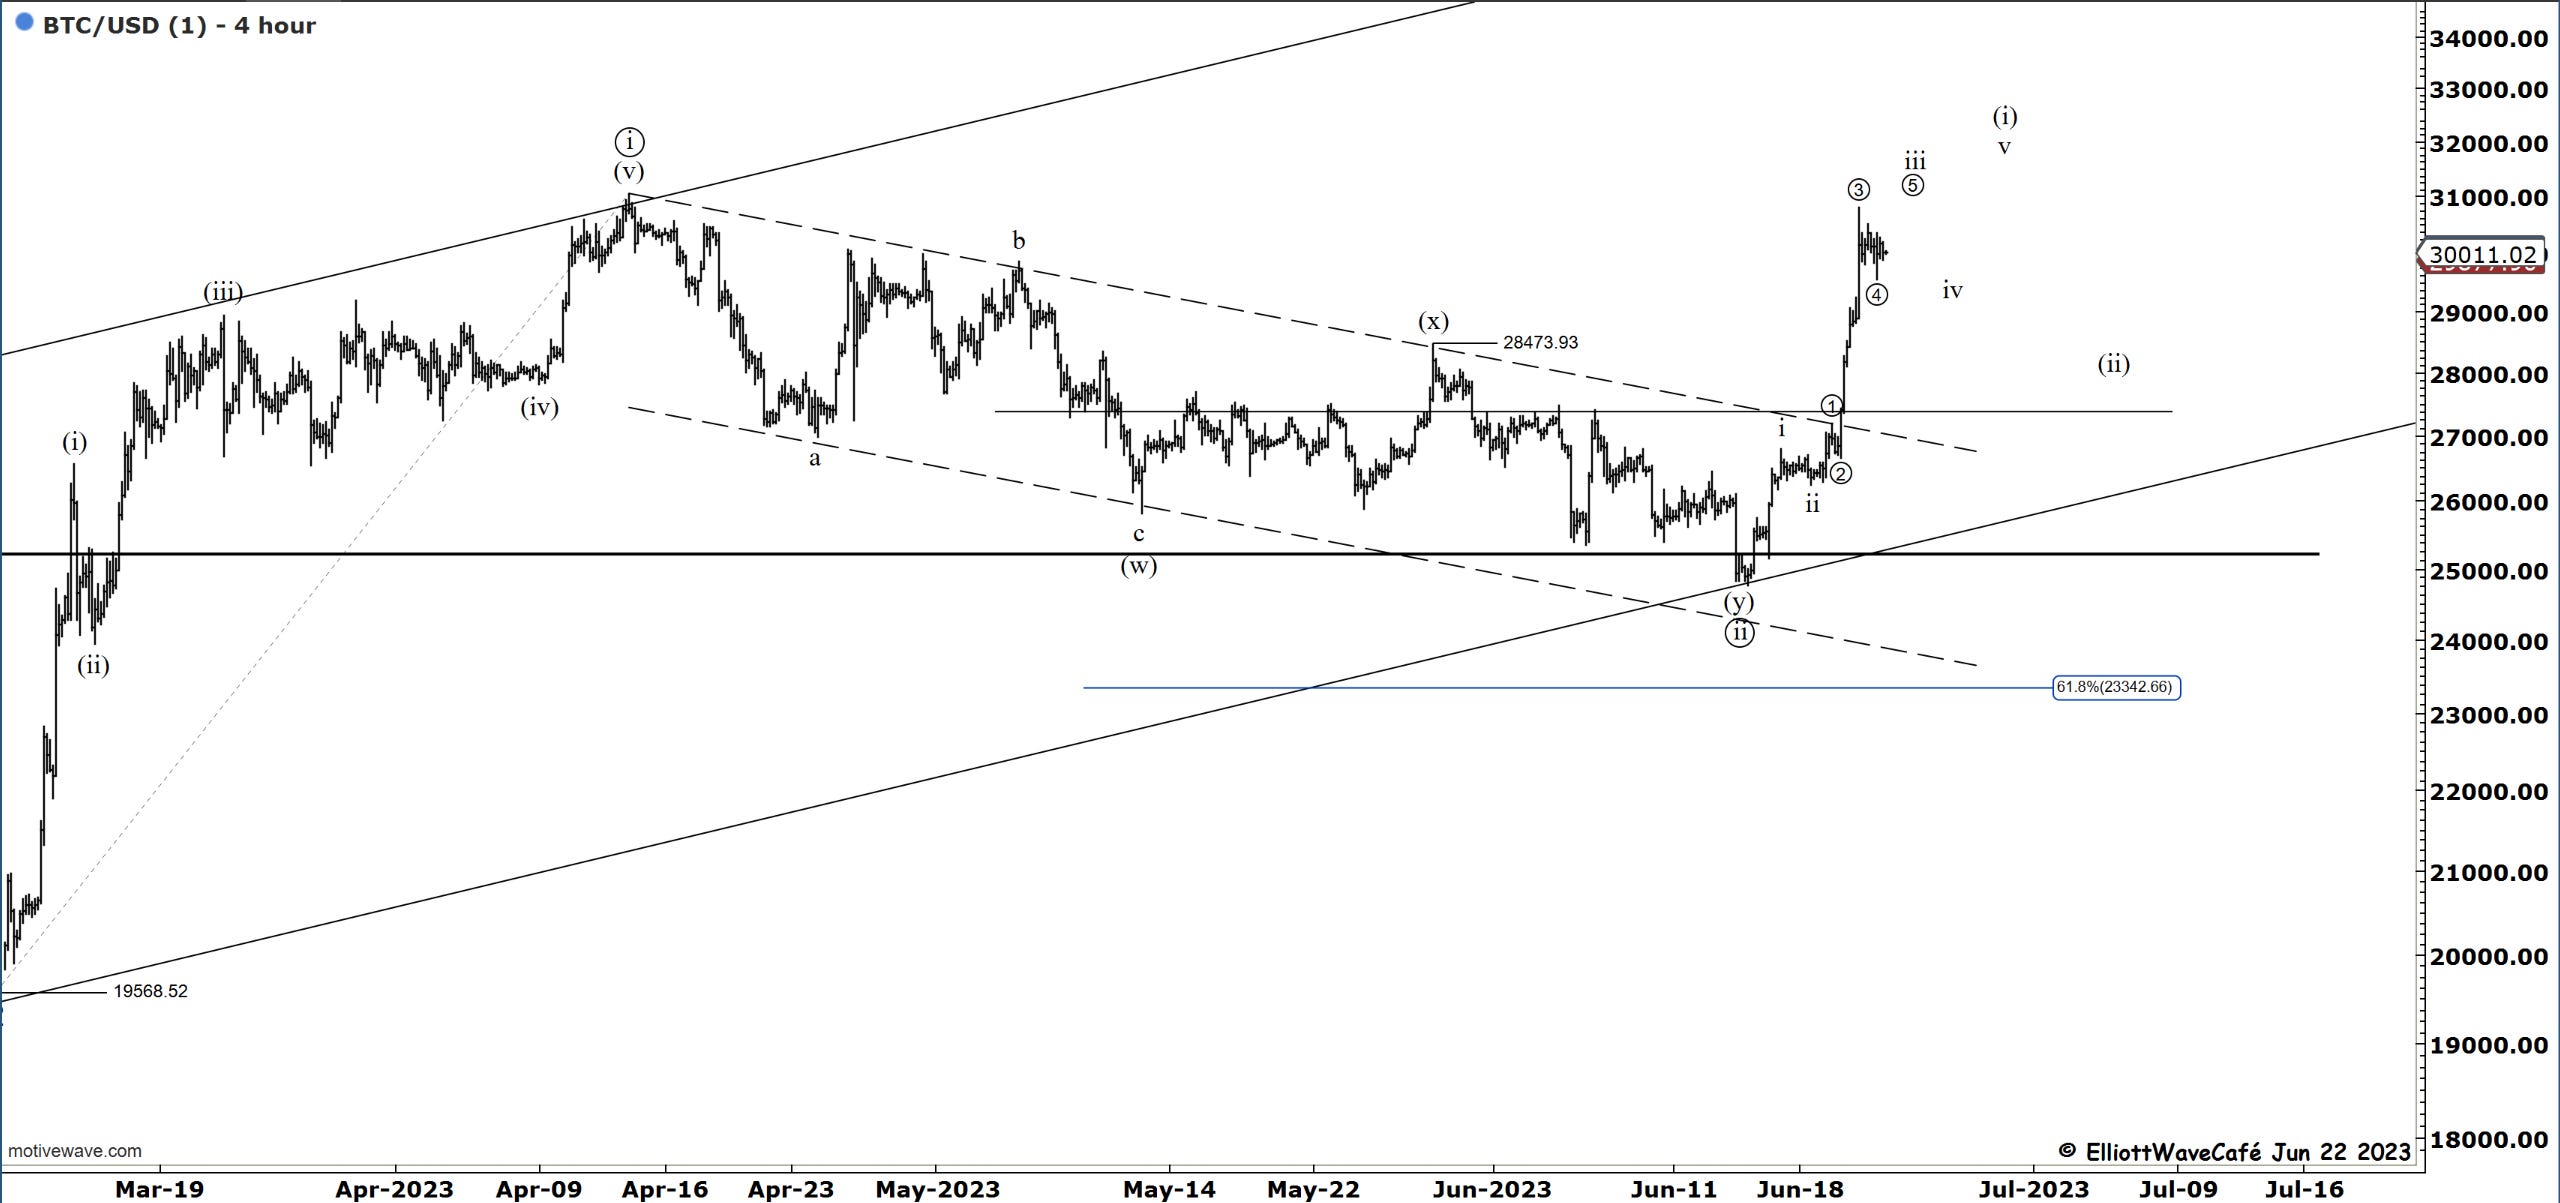
Bitcoin
The script was not that hard on these latest few waves as you can see from the June 22nd chart below. We were missing a 4th and 5th which we completed, and we might still be missing another 4th and 5th. We would then expect a bit of a larger wave (ii), but there are no guarantees as to its size or depth. I will be starting to build a position for the next wave (iii) higher once wave (ii) unfolds.
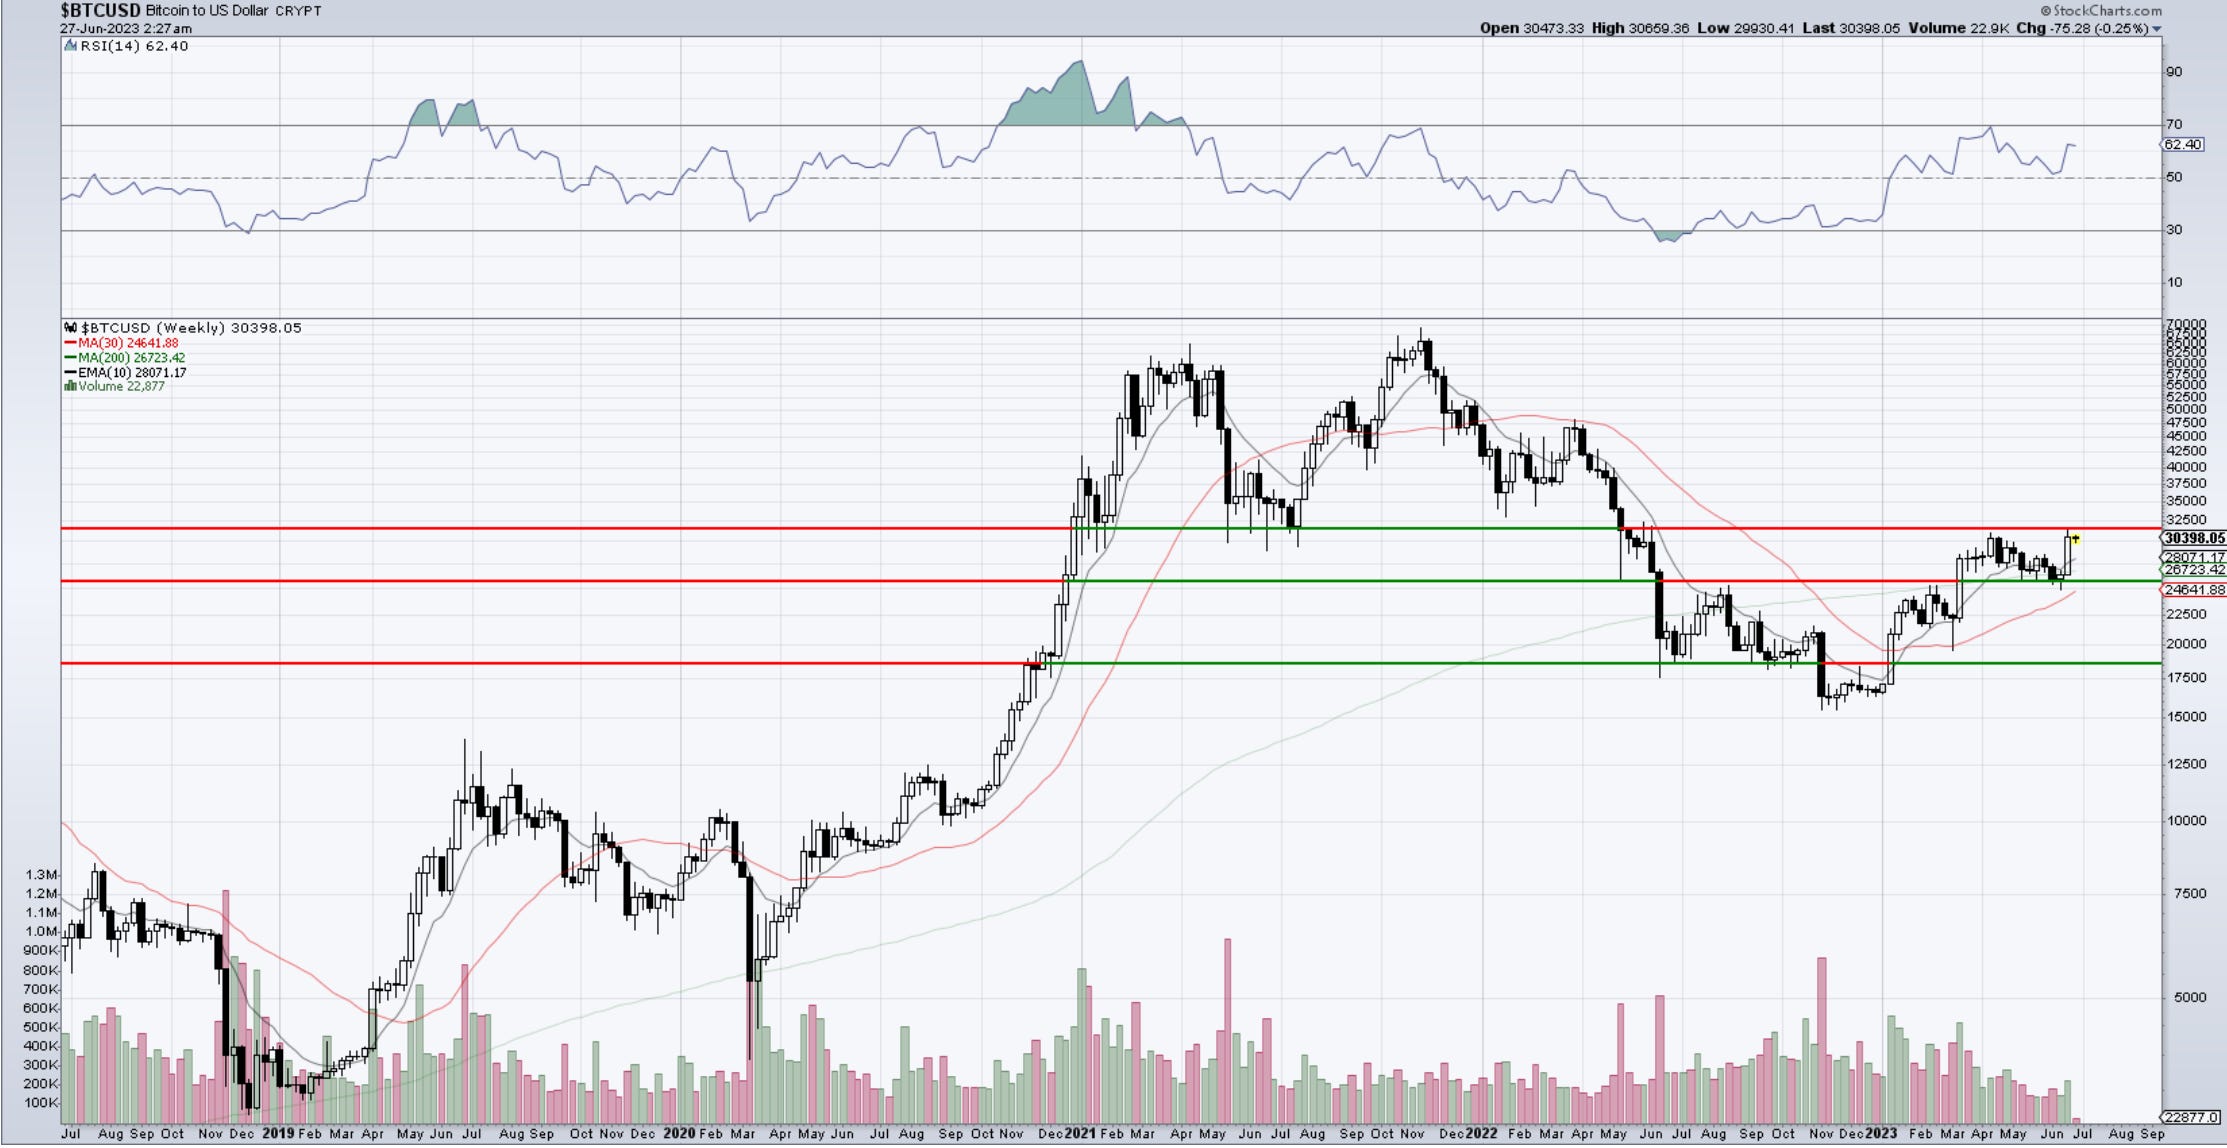
See the weekly chart below, above 31,800 there is not much holding this thing back until we hit 38,500.
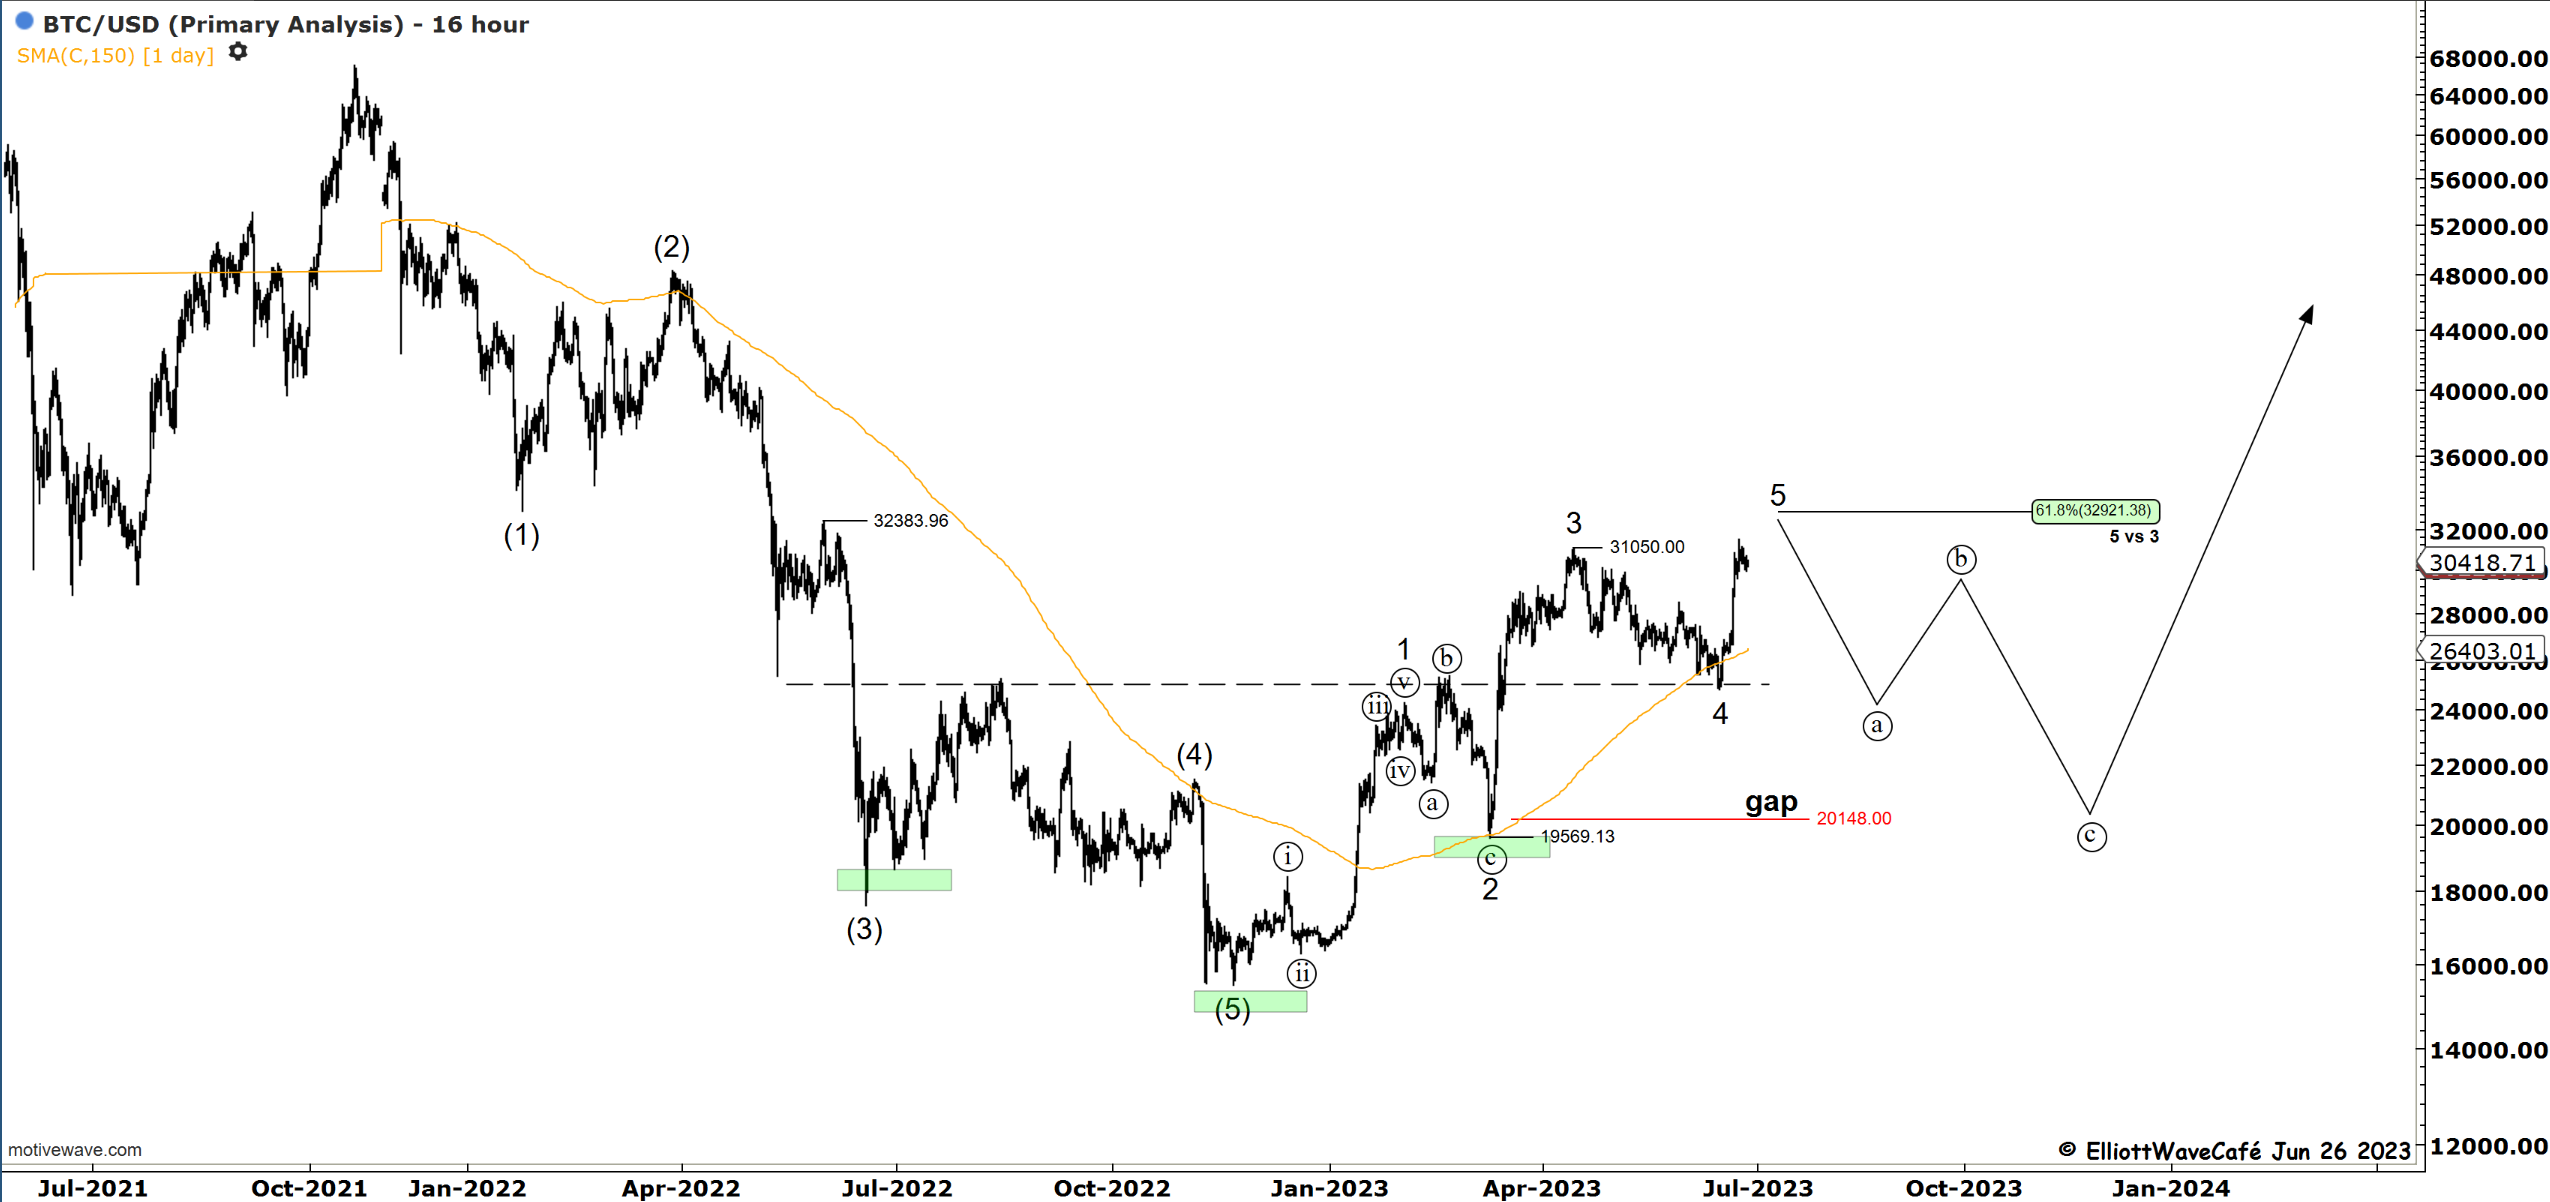
The 4th chart is the “OMG I can’t believe this is happening” chart. Just a thought. We discussed it before. If I put that on Twitter I bet I get heavy engagement :).
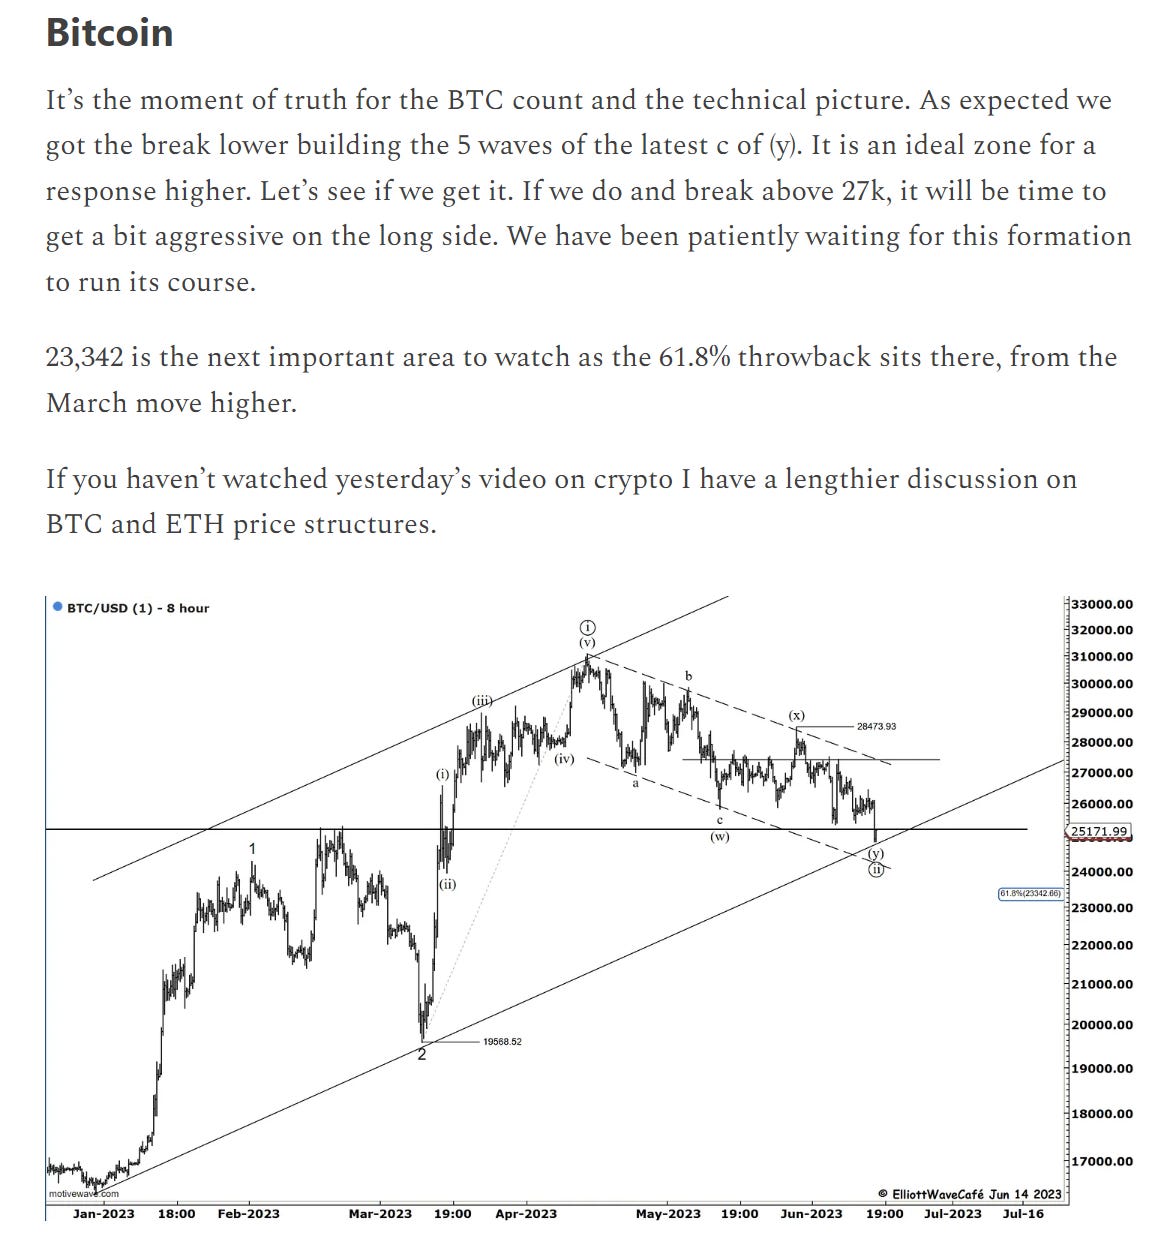
Here is the piece below from June 14th daily drip.
See you tomorrow - trade well!
Cris
email: ewcafe@pm.me