
The Daily Drip
Core markets charts updates and commentary
Note: The counts on the right edge are real-time, and they are prone to adjustments as price action develops. Elliott Wave has a fluid approach, is evidence-based, and requires constant monitoring of certain thresholds.
In the counts below, this (( )) = circle on chart
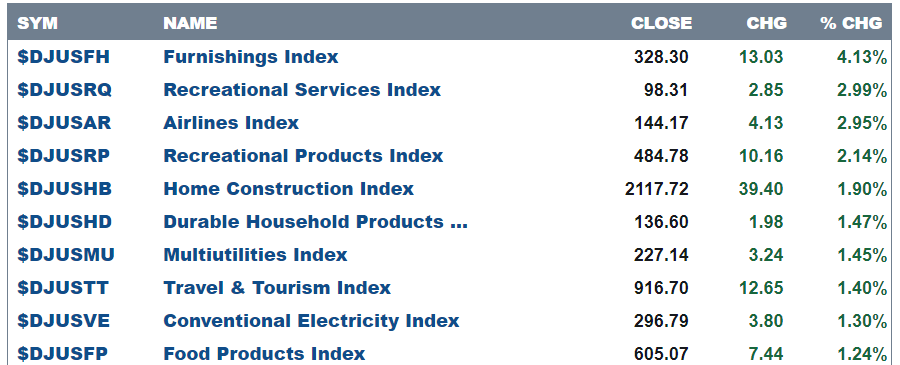
Here are today’s top 10 best performers out of 104 industries.
47 positive closes and 57 negative.
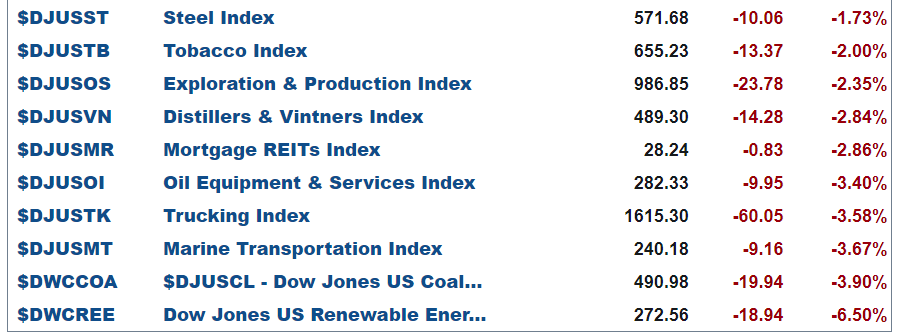
and bottom 10 …
SP500
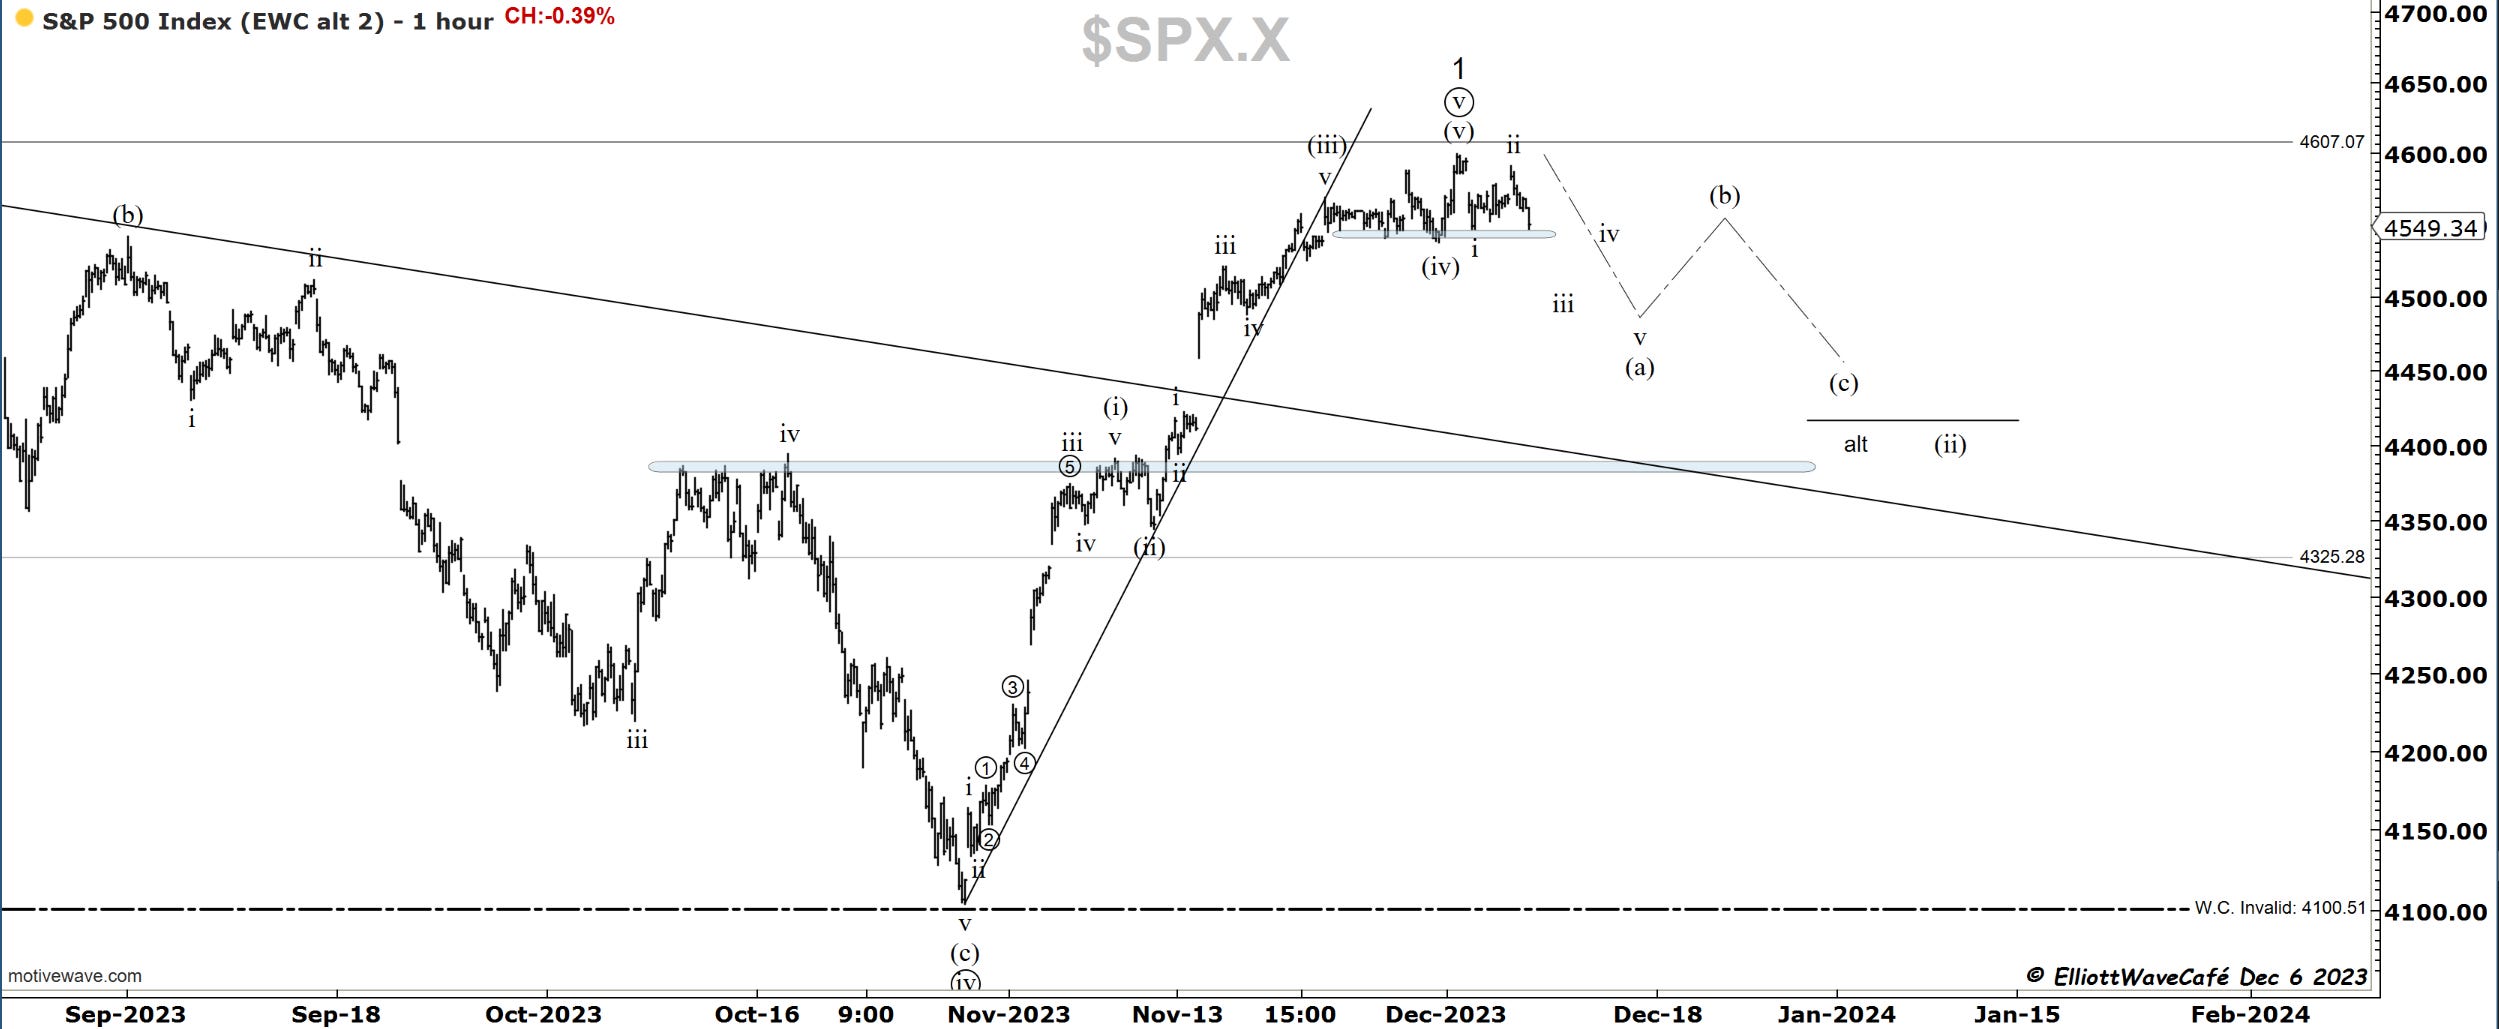
A gap higher to begin the session followed by continued selling throughout the day. Not something that bulls want to see. A look at the 5-minute chart, although visible clearly on daily as well, shows how today’s price action completely engulfed yesterday. Based on this, I would expect further selling to take place in the days ahead.
The count is unchanged, and it won’t get much traction until we actually start breaking below that blue horizontal support zone. I would expect the correction to take the shape of a zigzag with a 5-wave decline first. Wave iii will be clearly visible once it unfolds. Waves i and ii are decent. The risk is that this whole formation is still wave (iv) followed by one more push above 4600. The tape certainly does not behave that way. Yesterday, I went into detail about the reasons why I think a period of weakness is likely.
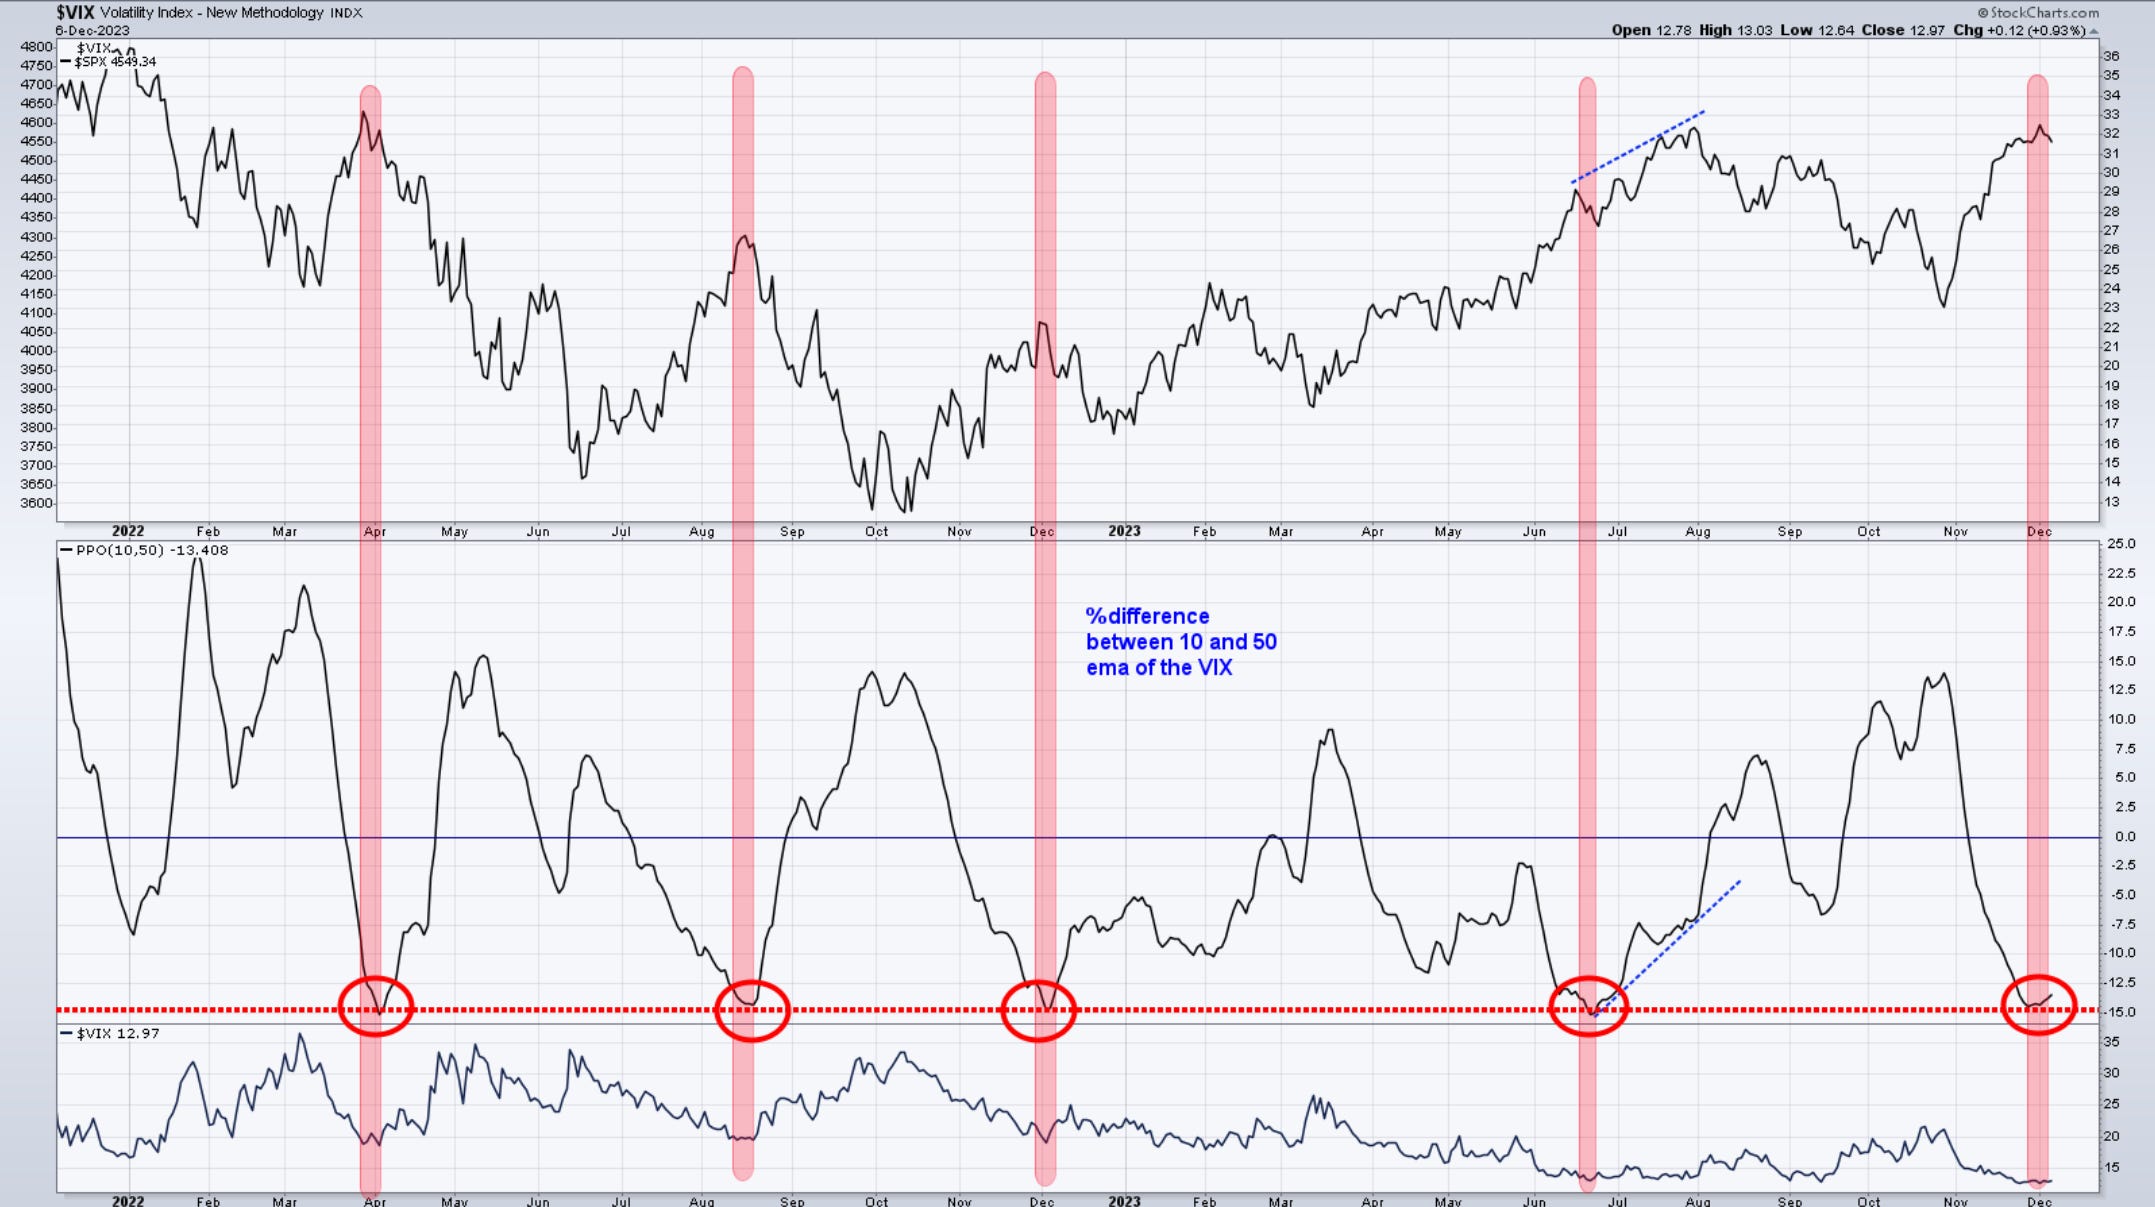
Here is a look at the VIX by creating a % difference between the 10 and the 50 day EMA. Most of the time, when it approaches the -15% mark, there is an increased chance of a rise in volatility.
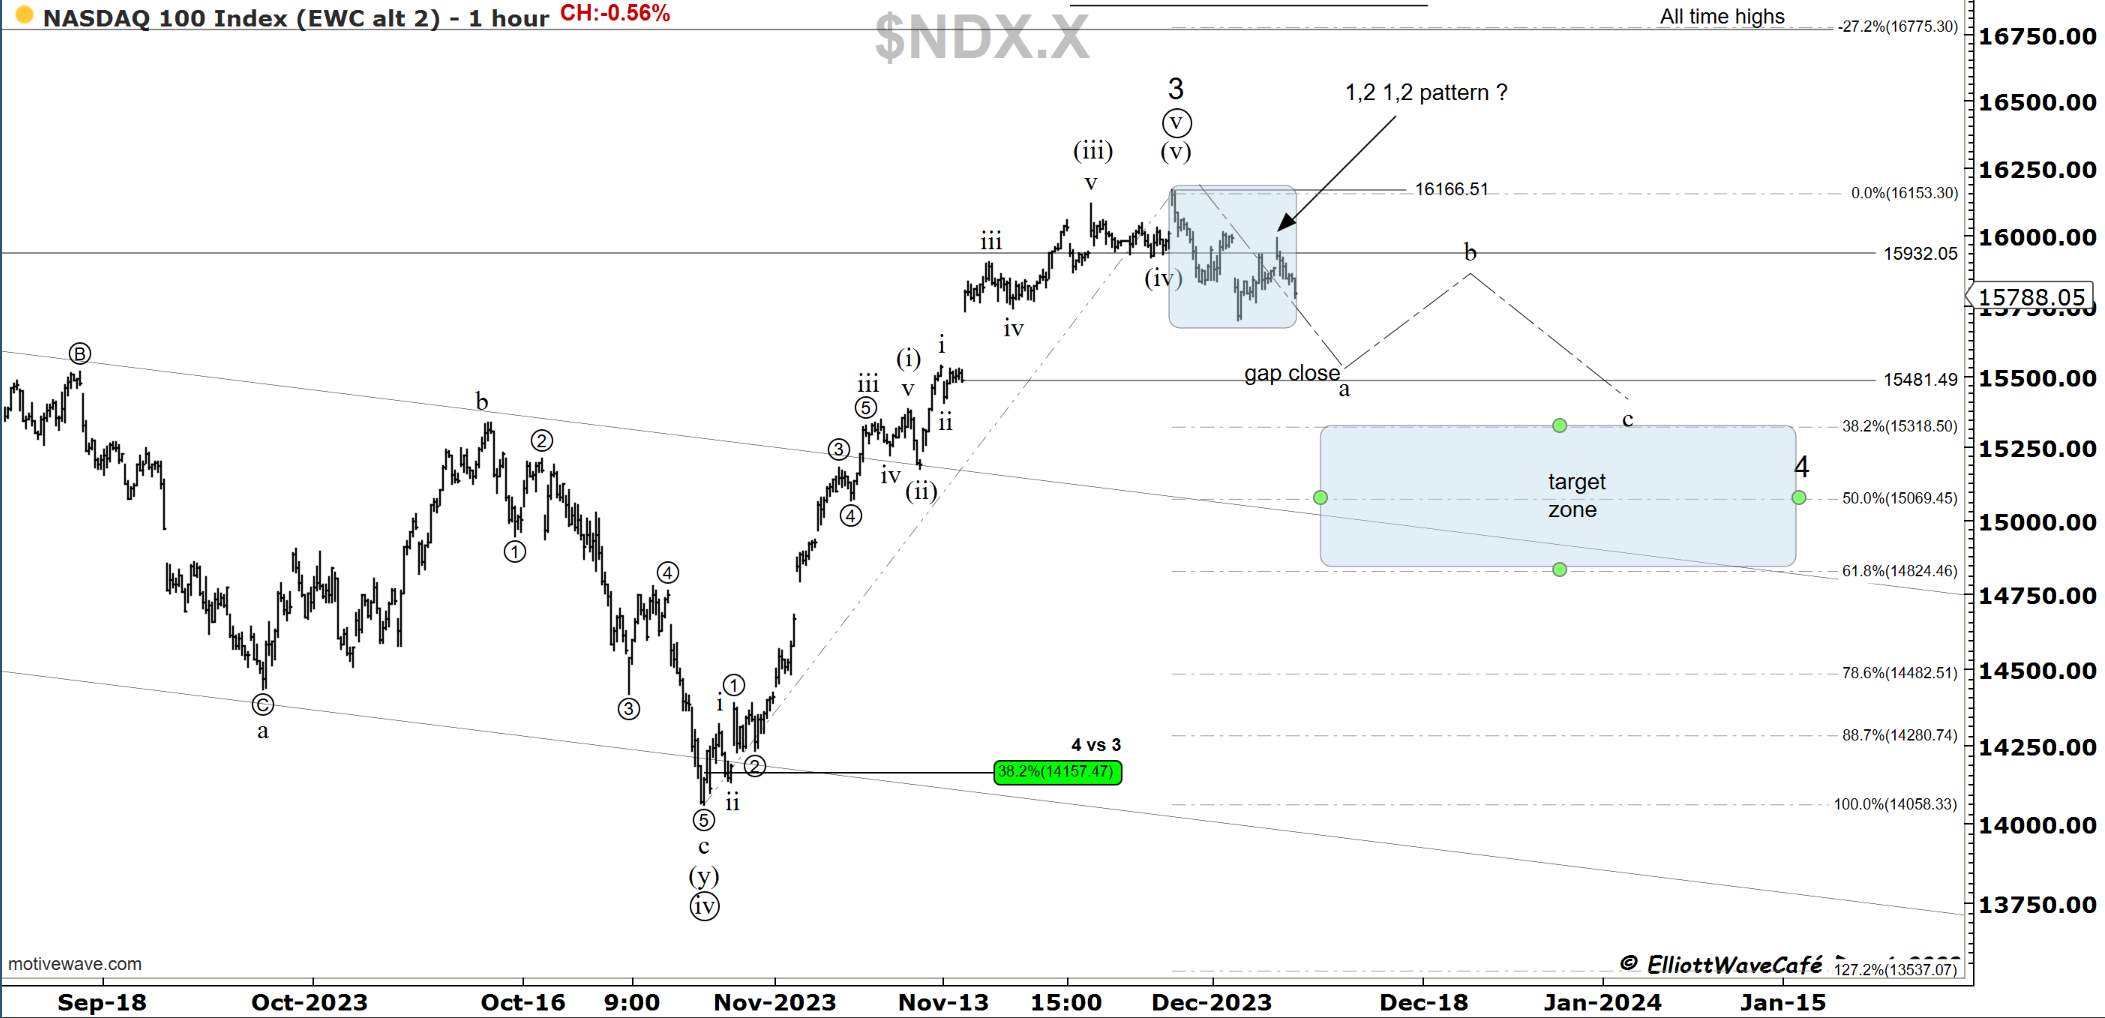
Nasdaq100
We lost -0.56 % today after an initial attempt higher. This failure and pattern structure overlap sends me thinking about a possible 1,2 1,2 scenario. If that’s the case then the next move we expect is a heavy selloff that should break 15,500. If that does not take place, that’s information we need to use to reanalyze the pattern. The target zone is seen in the blue square below between 38.2% - 61.8% of the Novembe rally.
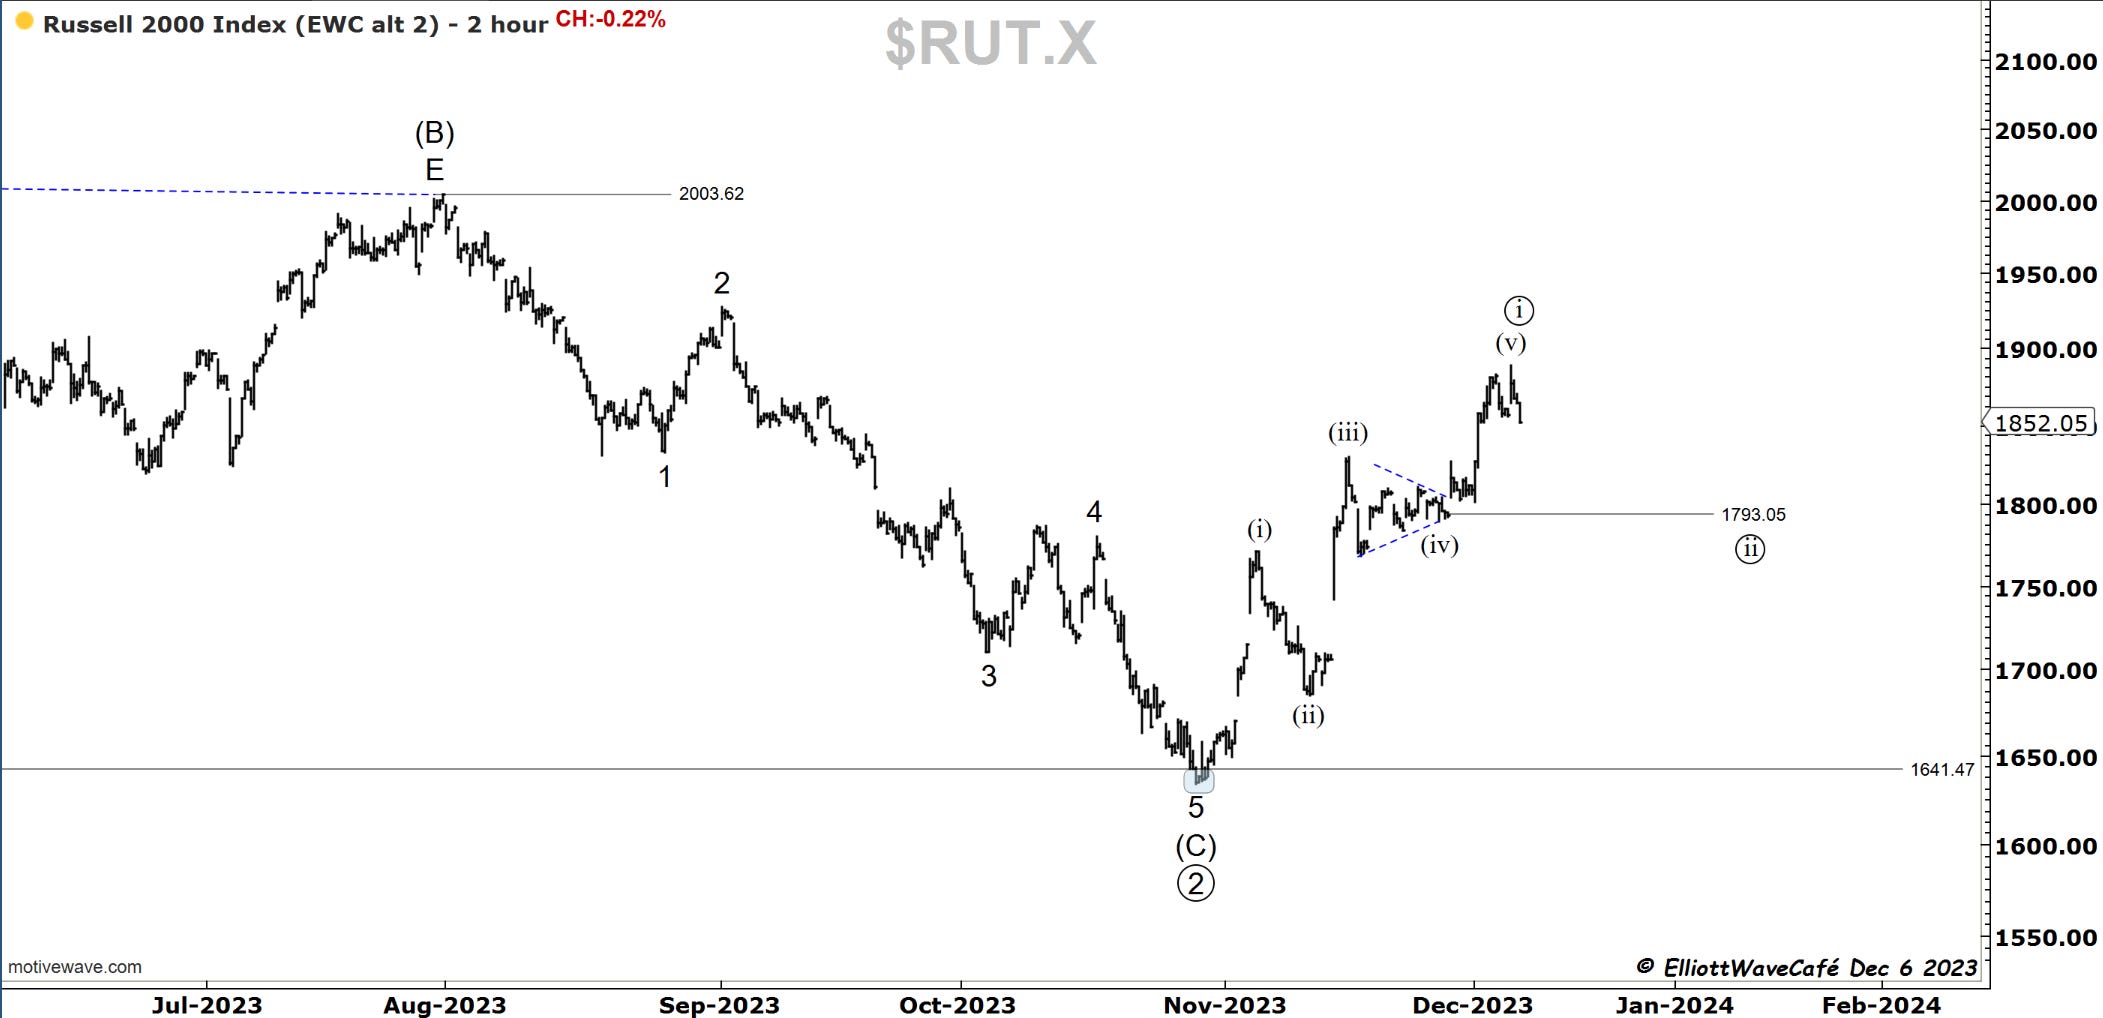
RUSSELL 2000
Today’s move higher in Russell was made to complete a 5th wave (v). Based on that, we would now need to see a throwback towards the triangle apex at 1793. We will revise the count once and if we get there.

Dow30
Could the little spike today be a short 5th wave? It’s a bit hard to swallow but I’ll play along. The red labels are alternate views for more proportion. It does suggest the final stages of this rally; however, the decline would be slightly delayed.
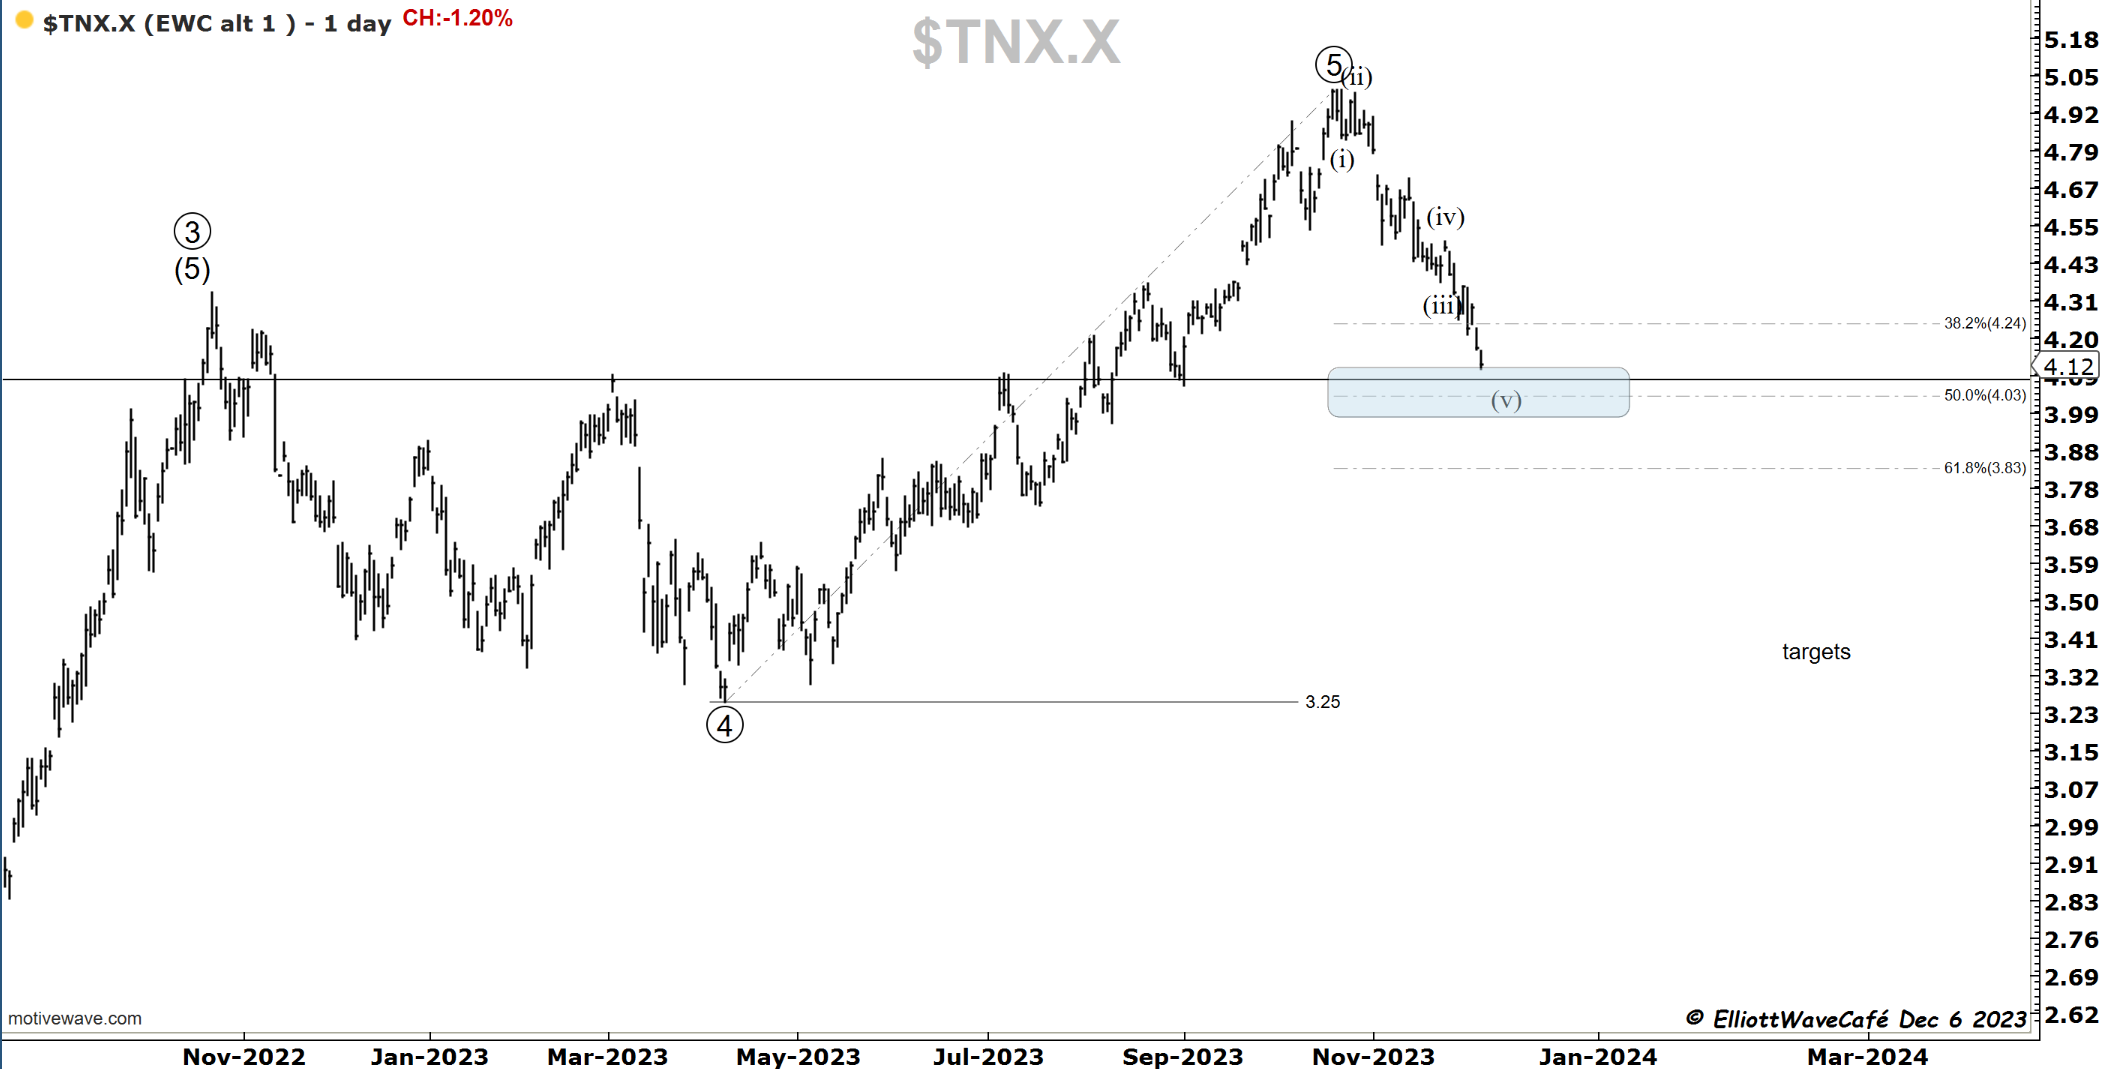
US Dollar and Yields
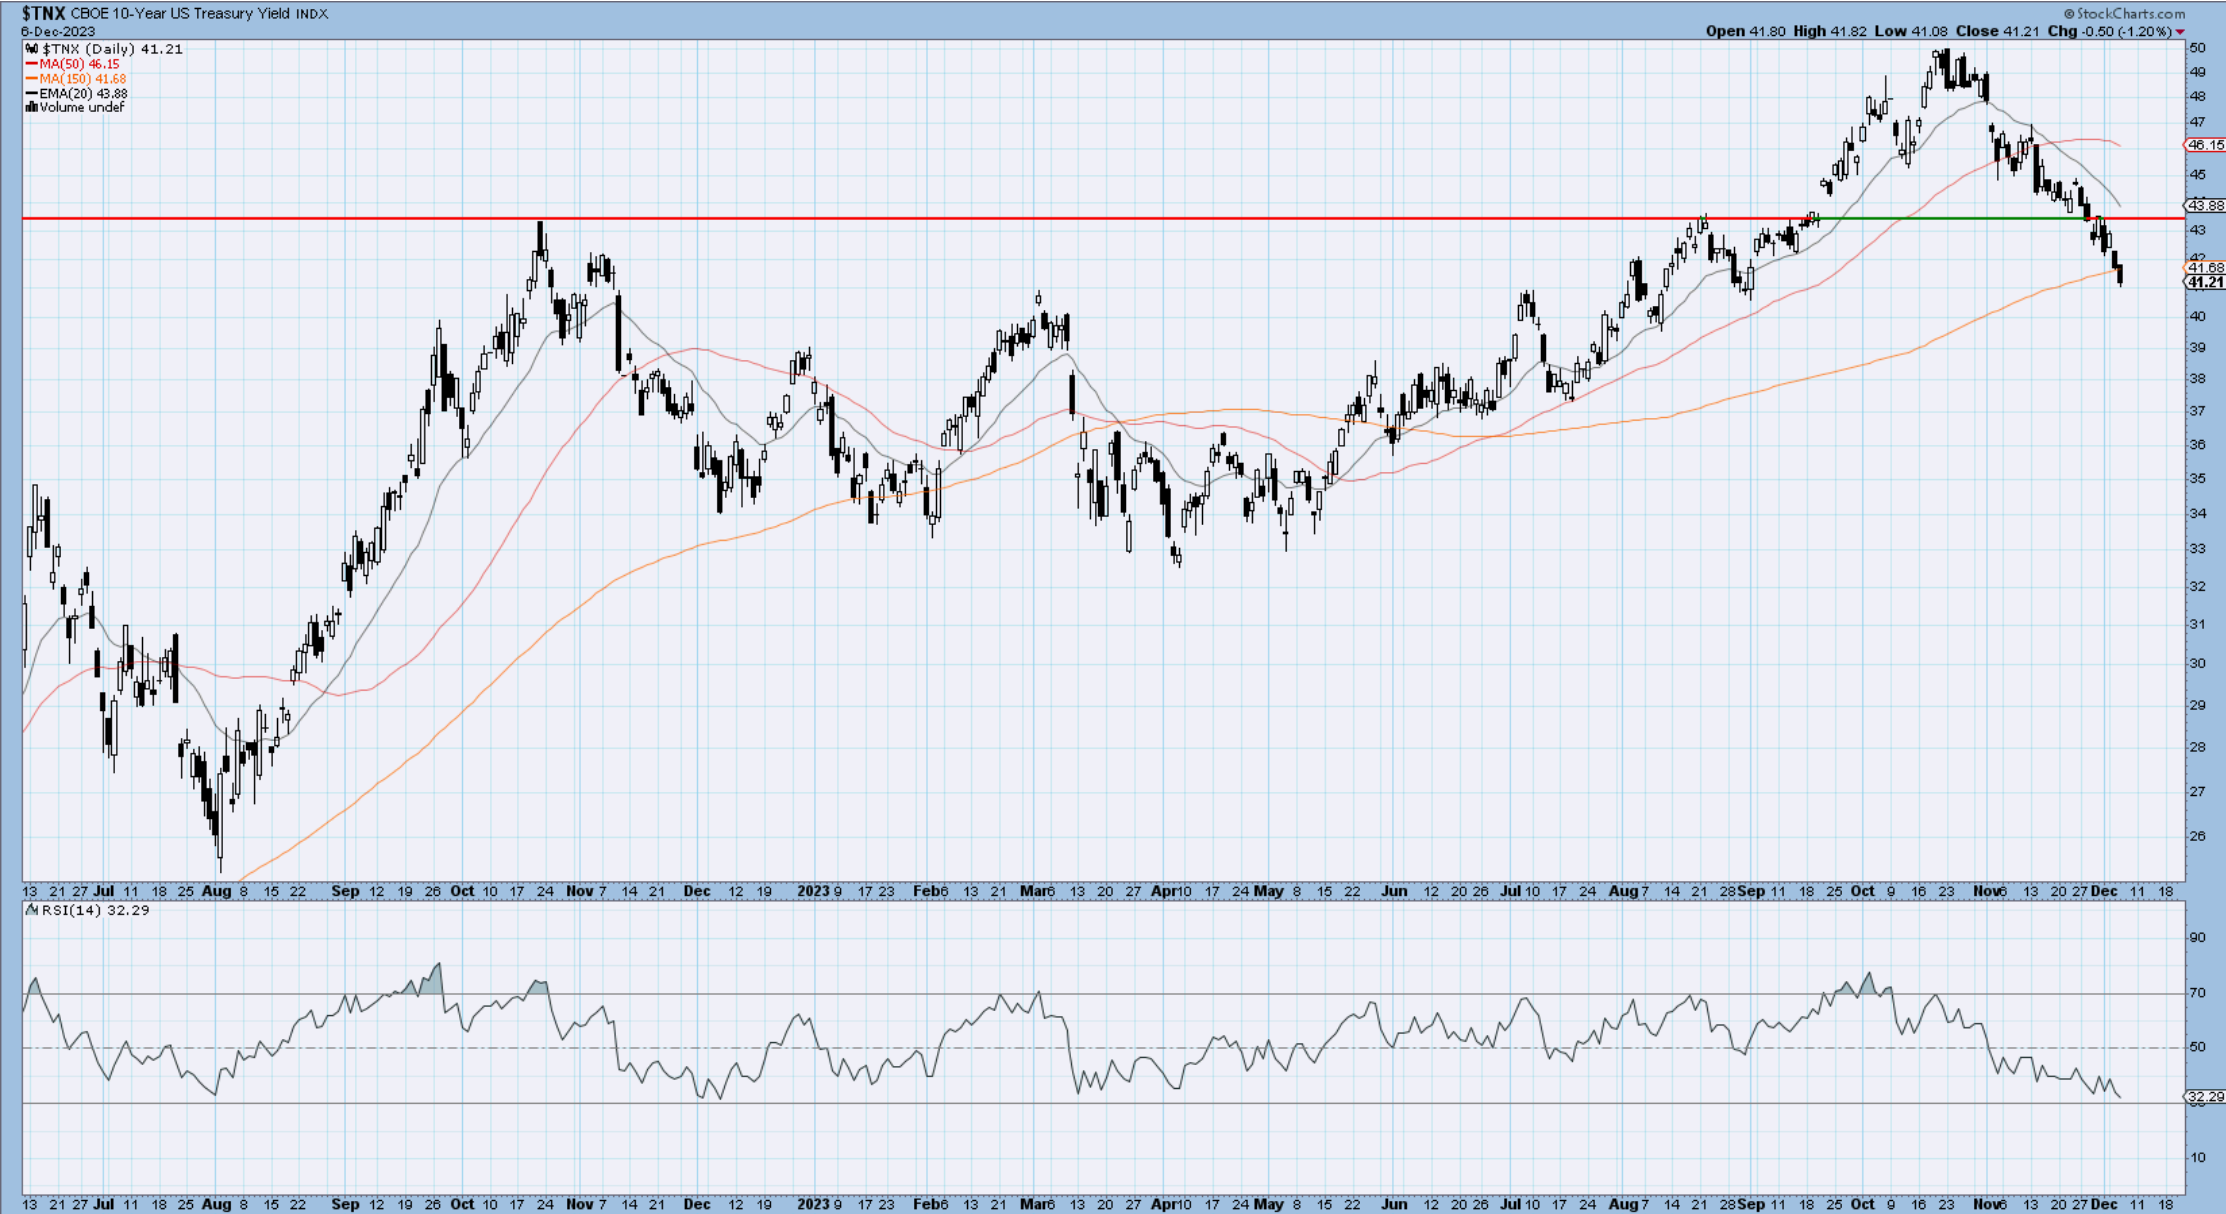
There is more strength from the greenback today. Just above that red dotted line, we have a resistance zone. I would expect some fighting there.
Dollar up, yields down is not a healthy posture. The alligator's jaws are opened wide. The market seems to be smelling economic risks increasing, a flight to the greenback's safety while pricing in fed cuts and anticipating a market rout. This picture is muddy, but something is cooking the way these markets are behaving.
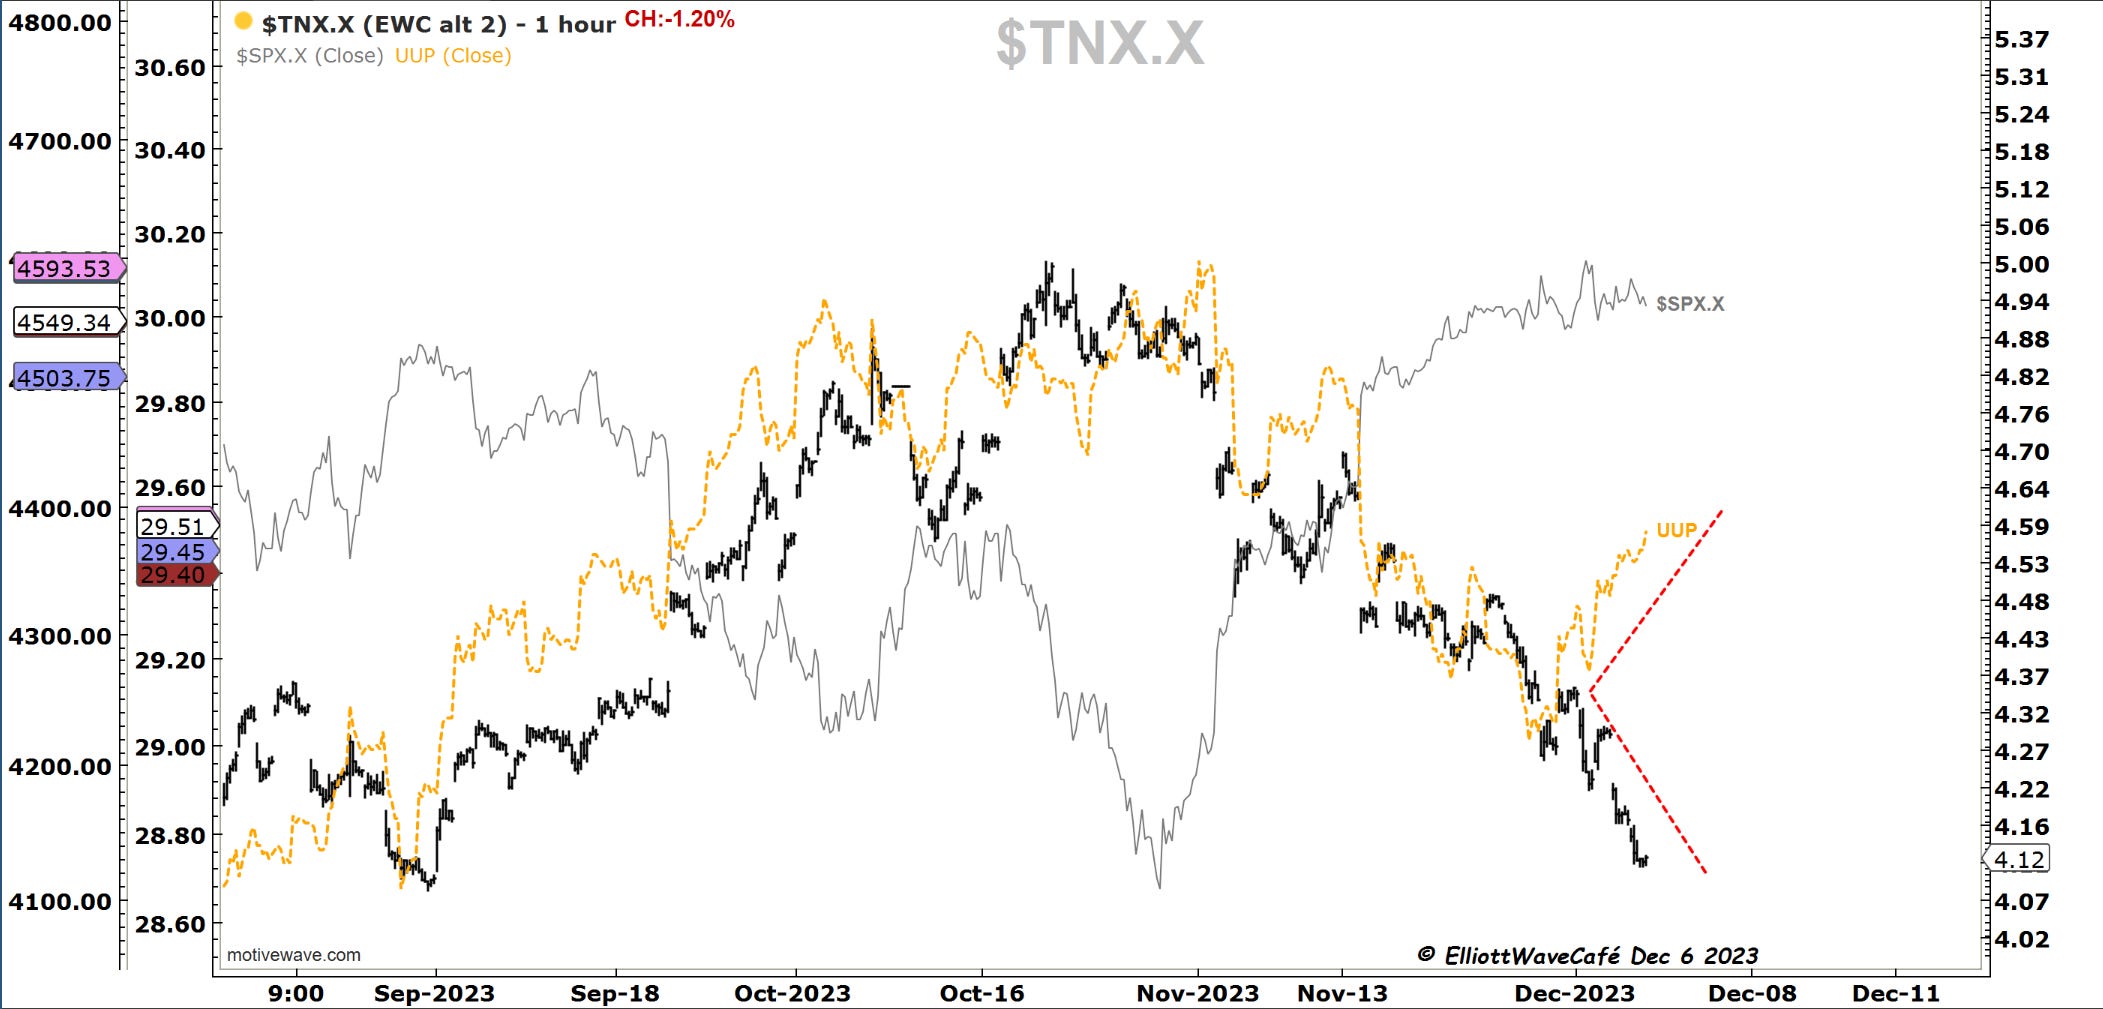
Let’s see what happens with yields approaching the 4% mark into a Fed meeting. We broke thru several levels of support. I think the upside move in yields is imminent. See the upsloping 150-day below. That thing does not usually give up that easily.
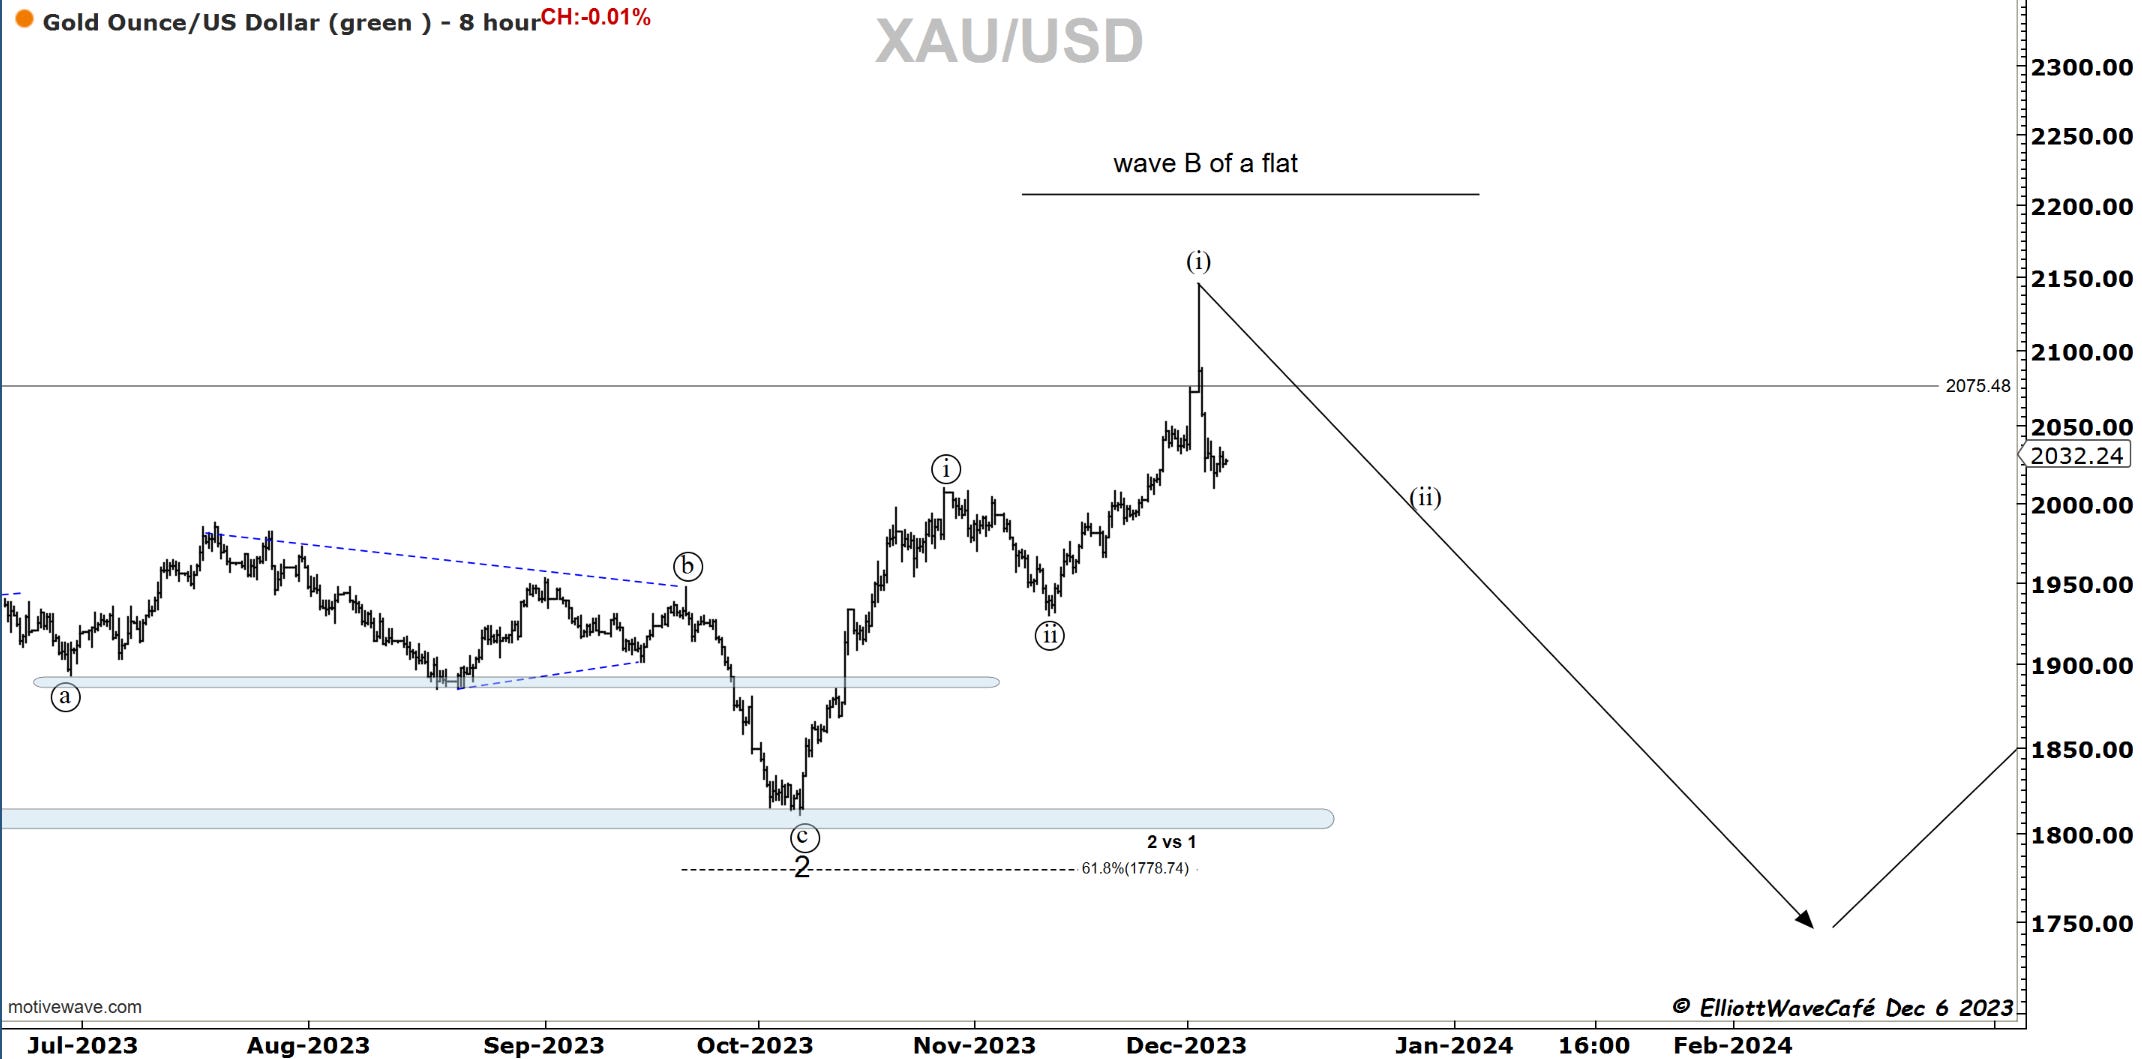
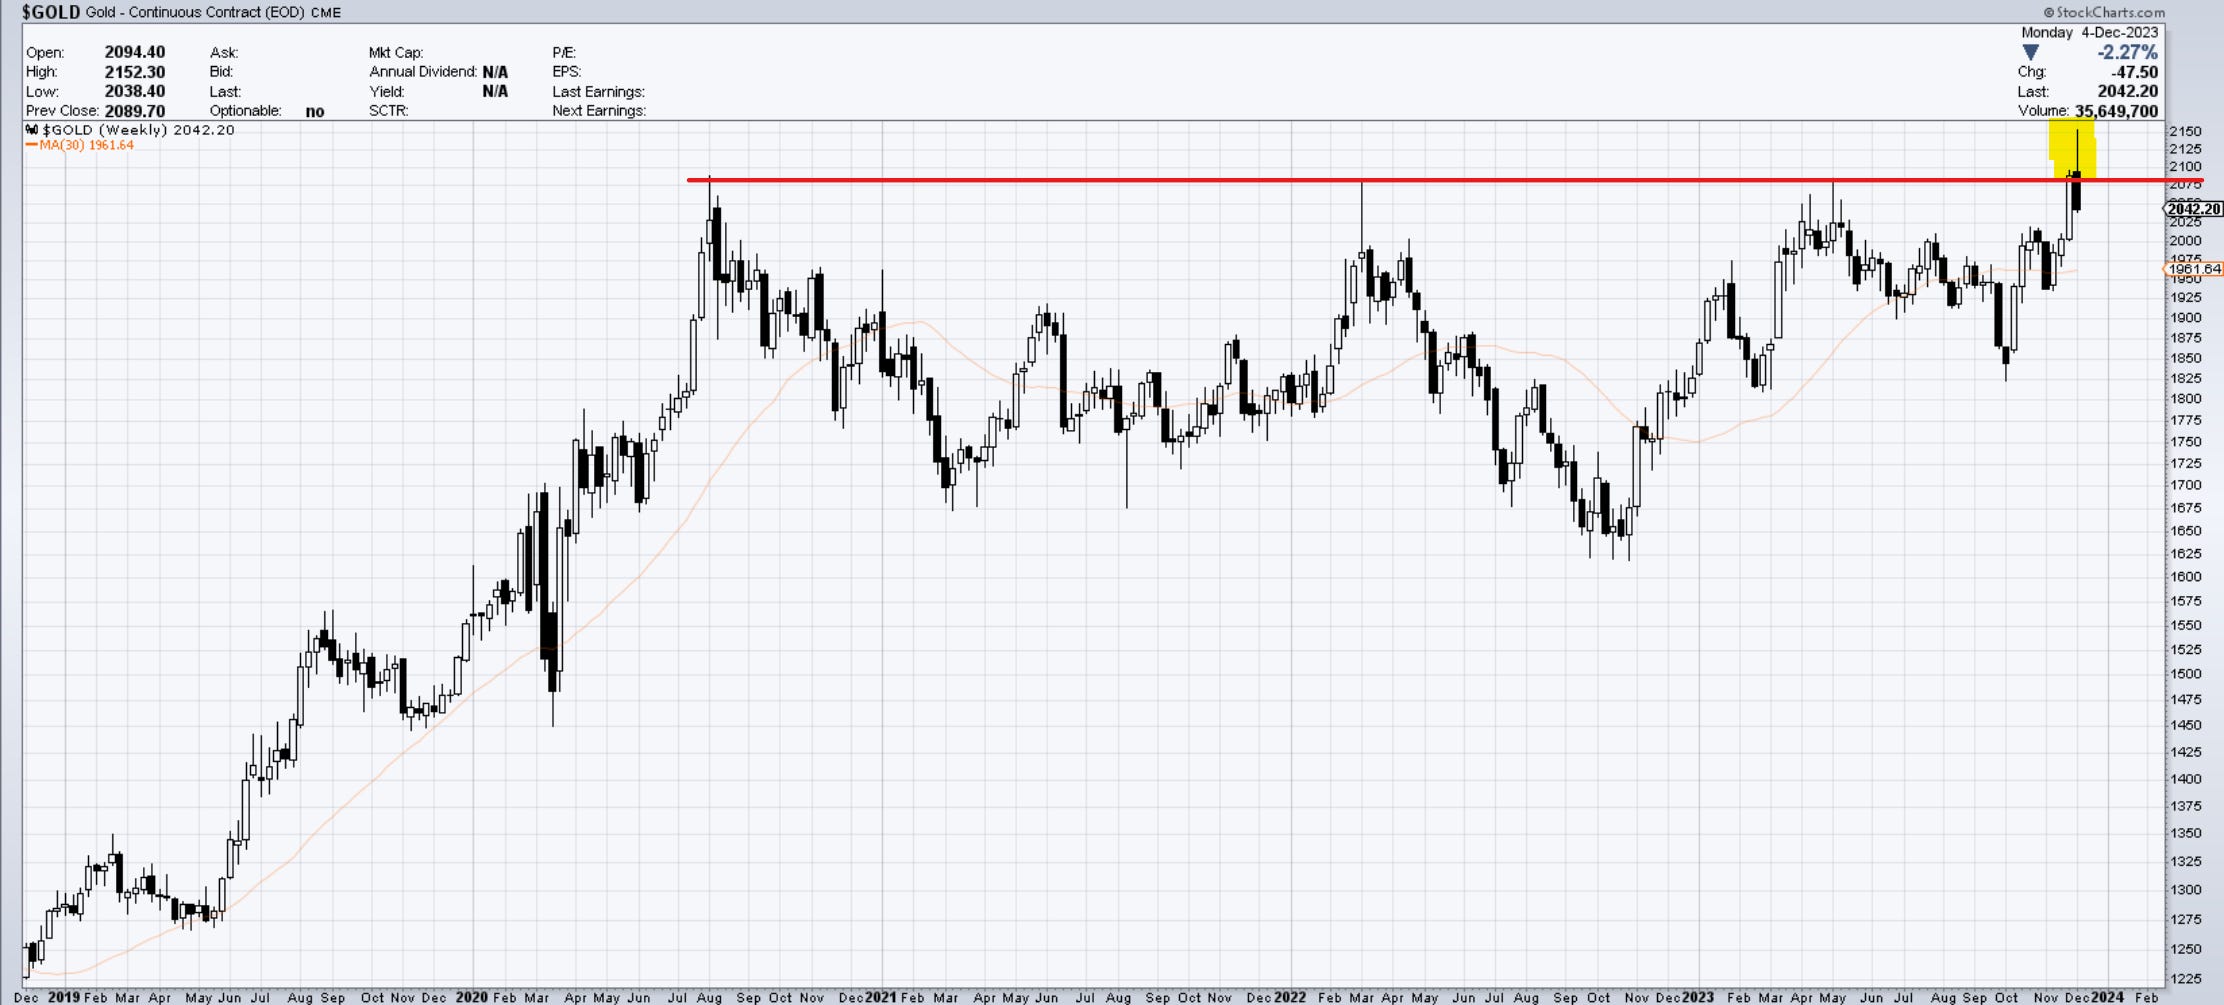
Gold
Gold has suffered quite a bit of technical damage due to its failure at 2150. Many will choose to ignore that behavior due to low liquidity Sunday night futures shenanigans, but I can’t help it in needing more information and repair before I can make any calls on it. My hunch here is to respect the failure and look for lower prices ahead. If it can prove me wrong so be it, but based on what I see, I would not put money to work there.
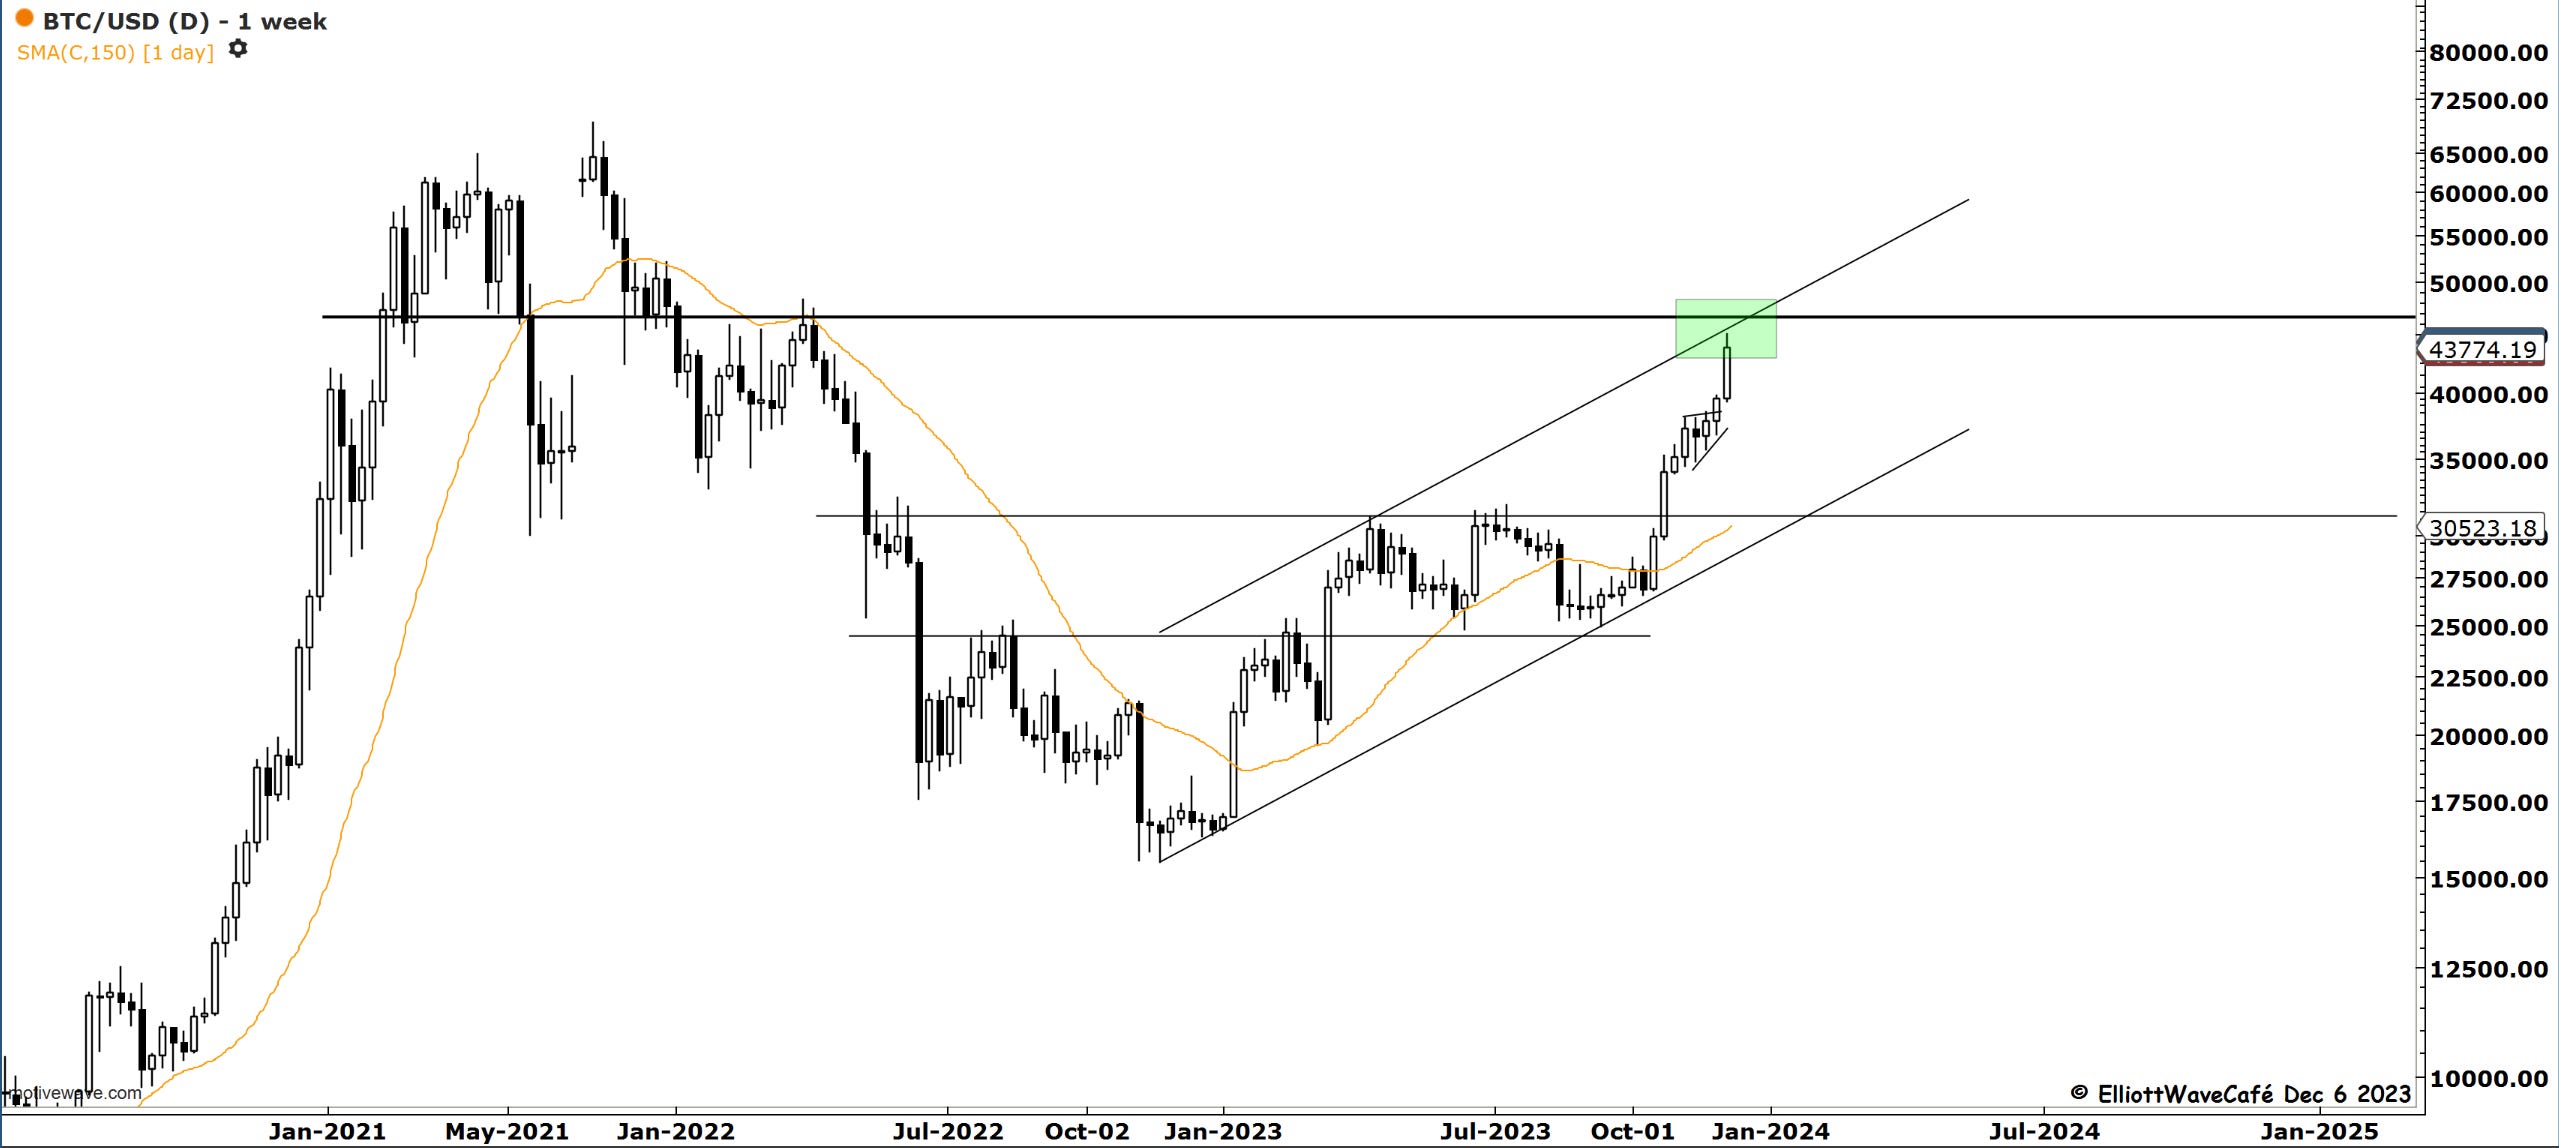
Bitcoin
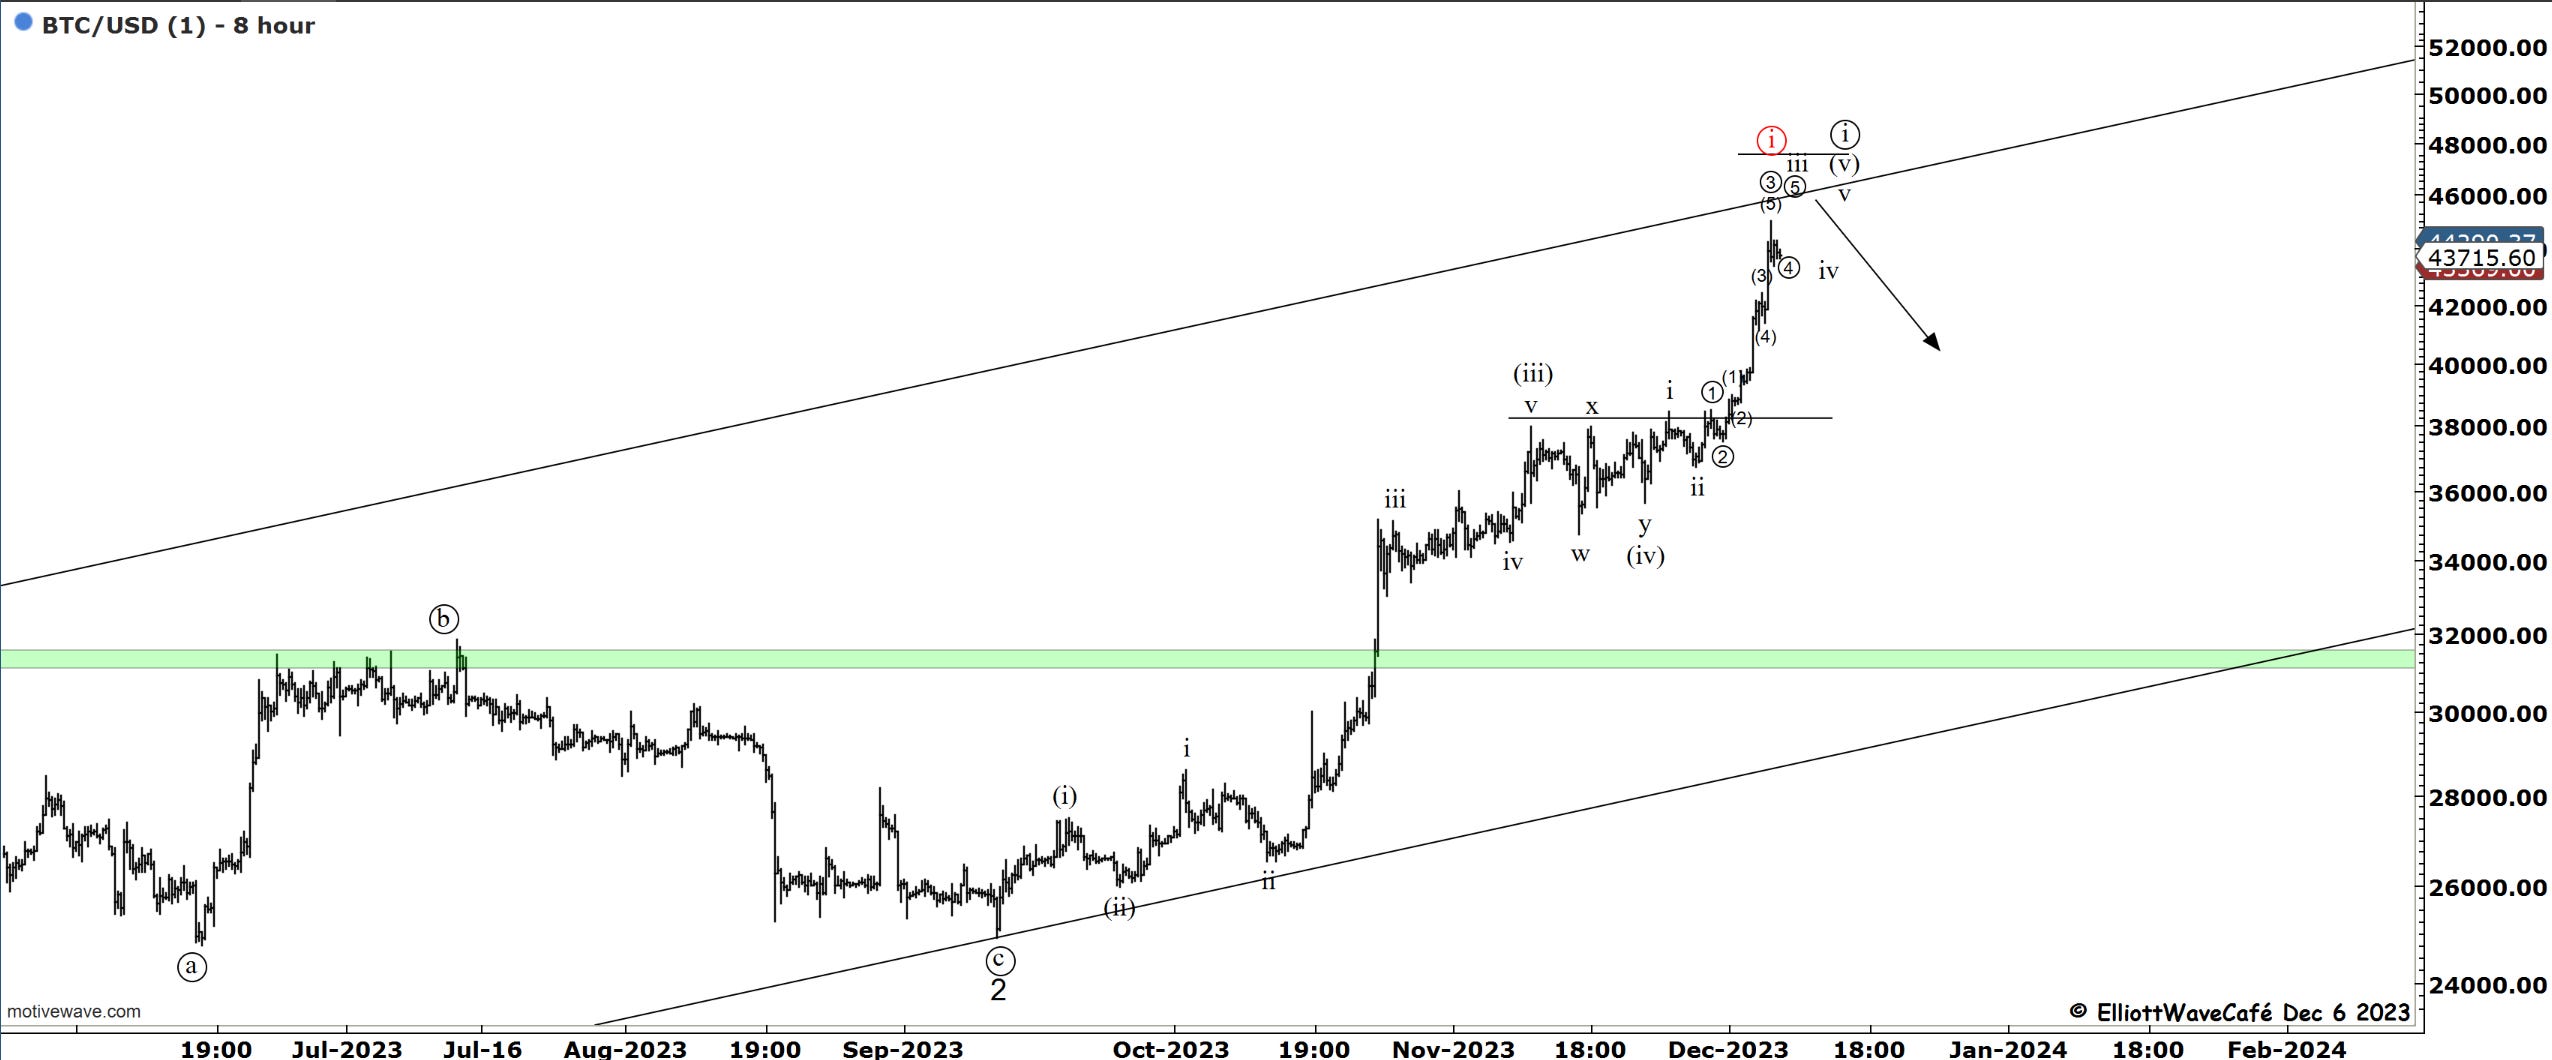
I can’t help it when I look at the chart below to notice the great confluence of horizontal level and upside channel resistance. Add to that the second chart count structure and one has to be prepared for a period of weakness and correction in this asset. I have been surprised plenty of times before by this market, but pressing longs here is not a bet I would want to make. Take profits, trail stops, sell calls are three words that come to mind.
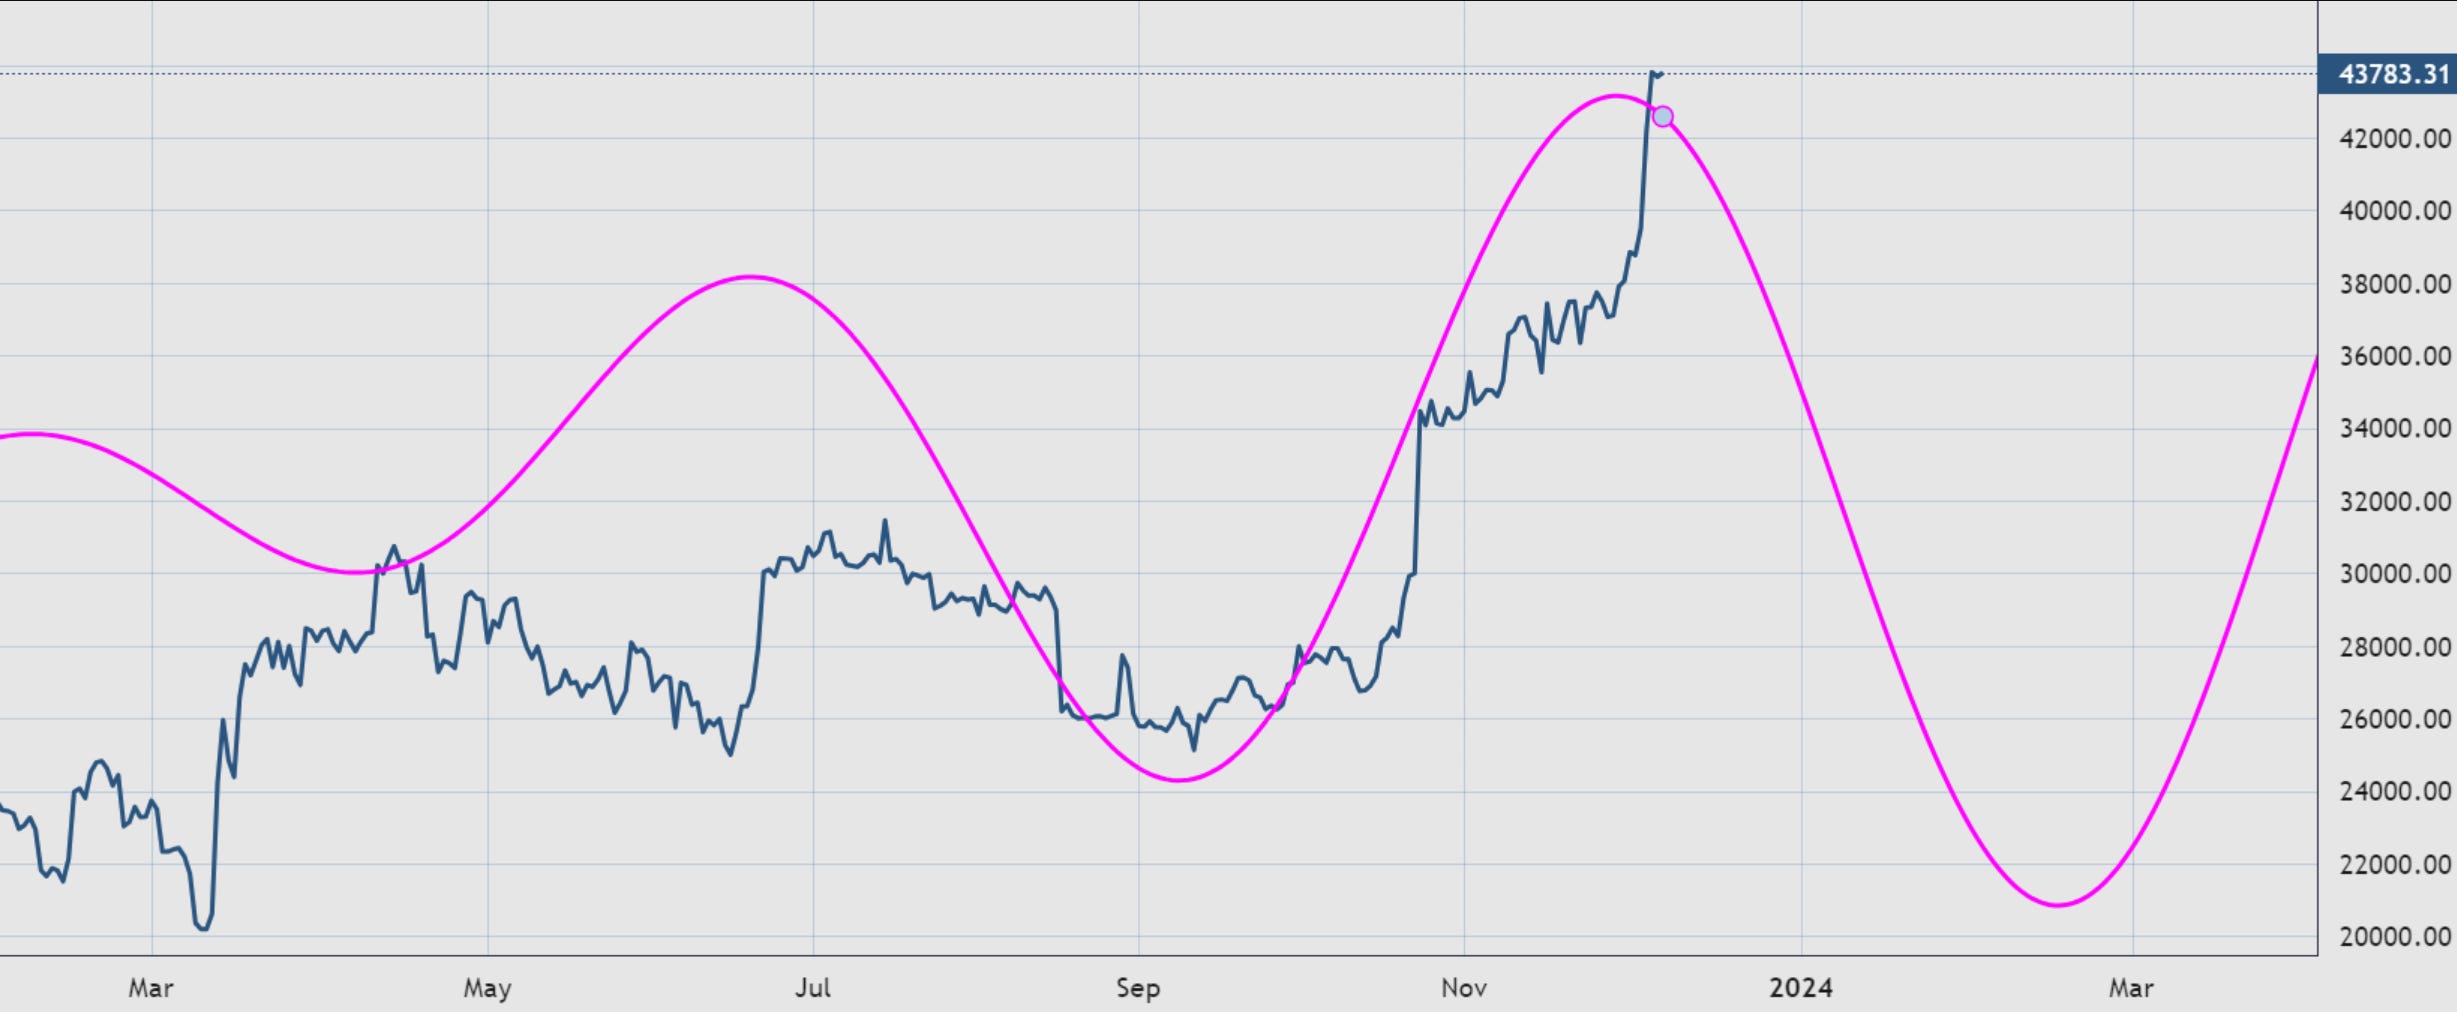
Here is the 150-180 day cycle in BTC suggesting a likely period of weakness upcoming. The depth of the correction is not what we’re looking for here but rather time spent on it.
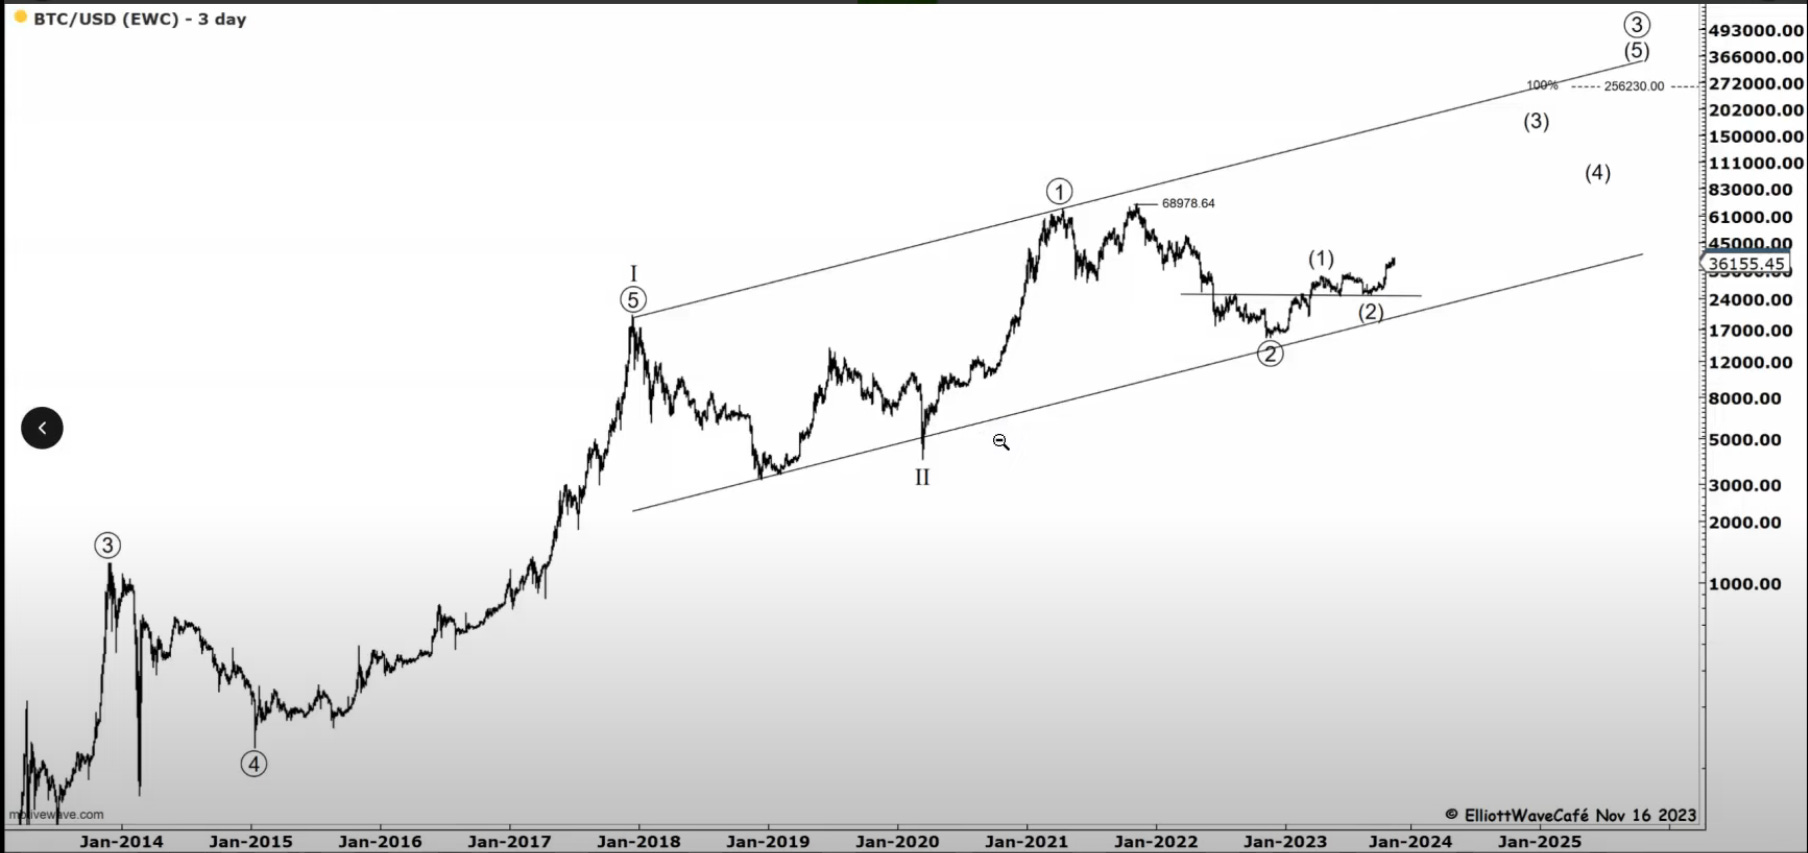
The much larger count can be found here. Presented this on Nov 16th note.
Daily video coming up next,
Have a great day wherever you are! - trade well, and don’t forget to subscribe and drop a like if this letter helps you in any way.
Cris
email: ewcafe@pm.me