
The Daily Drip
Markets review, strategy and analysis
Note: The EW counts on the right edge are real-time, and they are prone to adjustments as price action develops. Elliott Wave has a fluid approach, is evidence-based, and requires constant monitoring of certain thresholds.
In the counts below, this (( )) = circle on chart
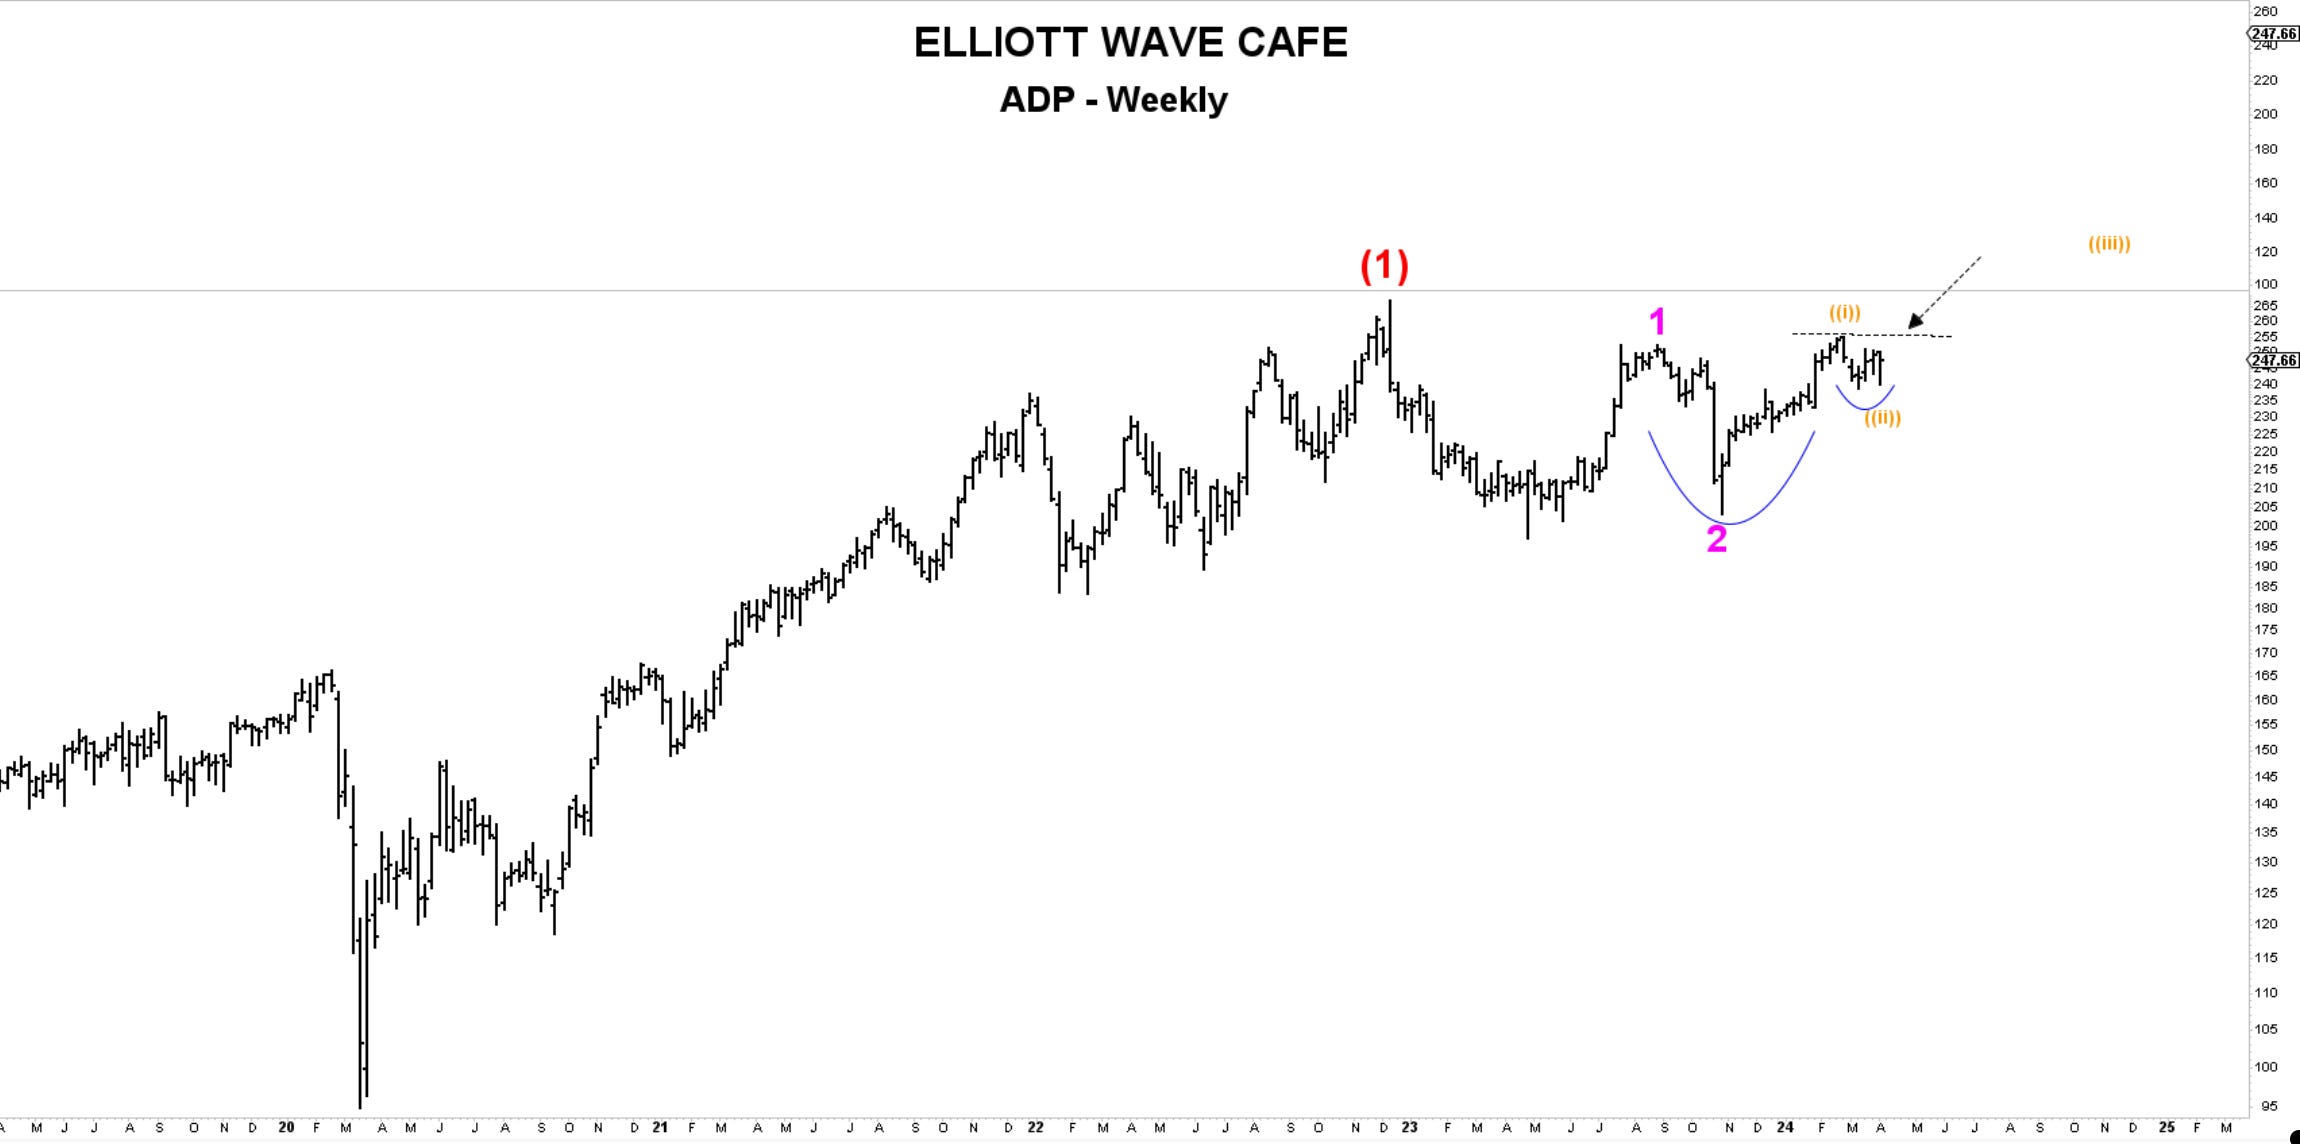
Chart of the Day—ADP— Here is an industrial stock focusing on business support. I like what I see happening near the highs and how it’s trying to prepare for a breakout in a more significant wave 3. The break of the horizontal dashed line would trigger a “buy signal,” while a break of 237 is defensive “get me out.”
This is one of the 24 stocks in the Double Shot daily video last night.
Yesterday, we reviewed the core markets and their technical levels.
Today I will show some opportunities and risk/reward levels in the markets we follow. I am also looking at the BTC count on an hourly chart.
Let's dive into the charts below …
