
The Daily Drip
Core markets charts updates and commentary
Note: The counts on the right edge are real-time, and they are prone to adjustments as price action develops. Elliott Wave has a fluid approach, is evidence-based, and requires constant monitoring of certain thresholds.
In the counts below, this (( )) = circle on chart
Today’s video has been posted on the site. Discussed RIVIAN besides some other issues. Sunday I sent out all stocks and ETFs for this week. The active positions show all our trades. We took partial profits Monday in TQQQ and DUSL.
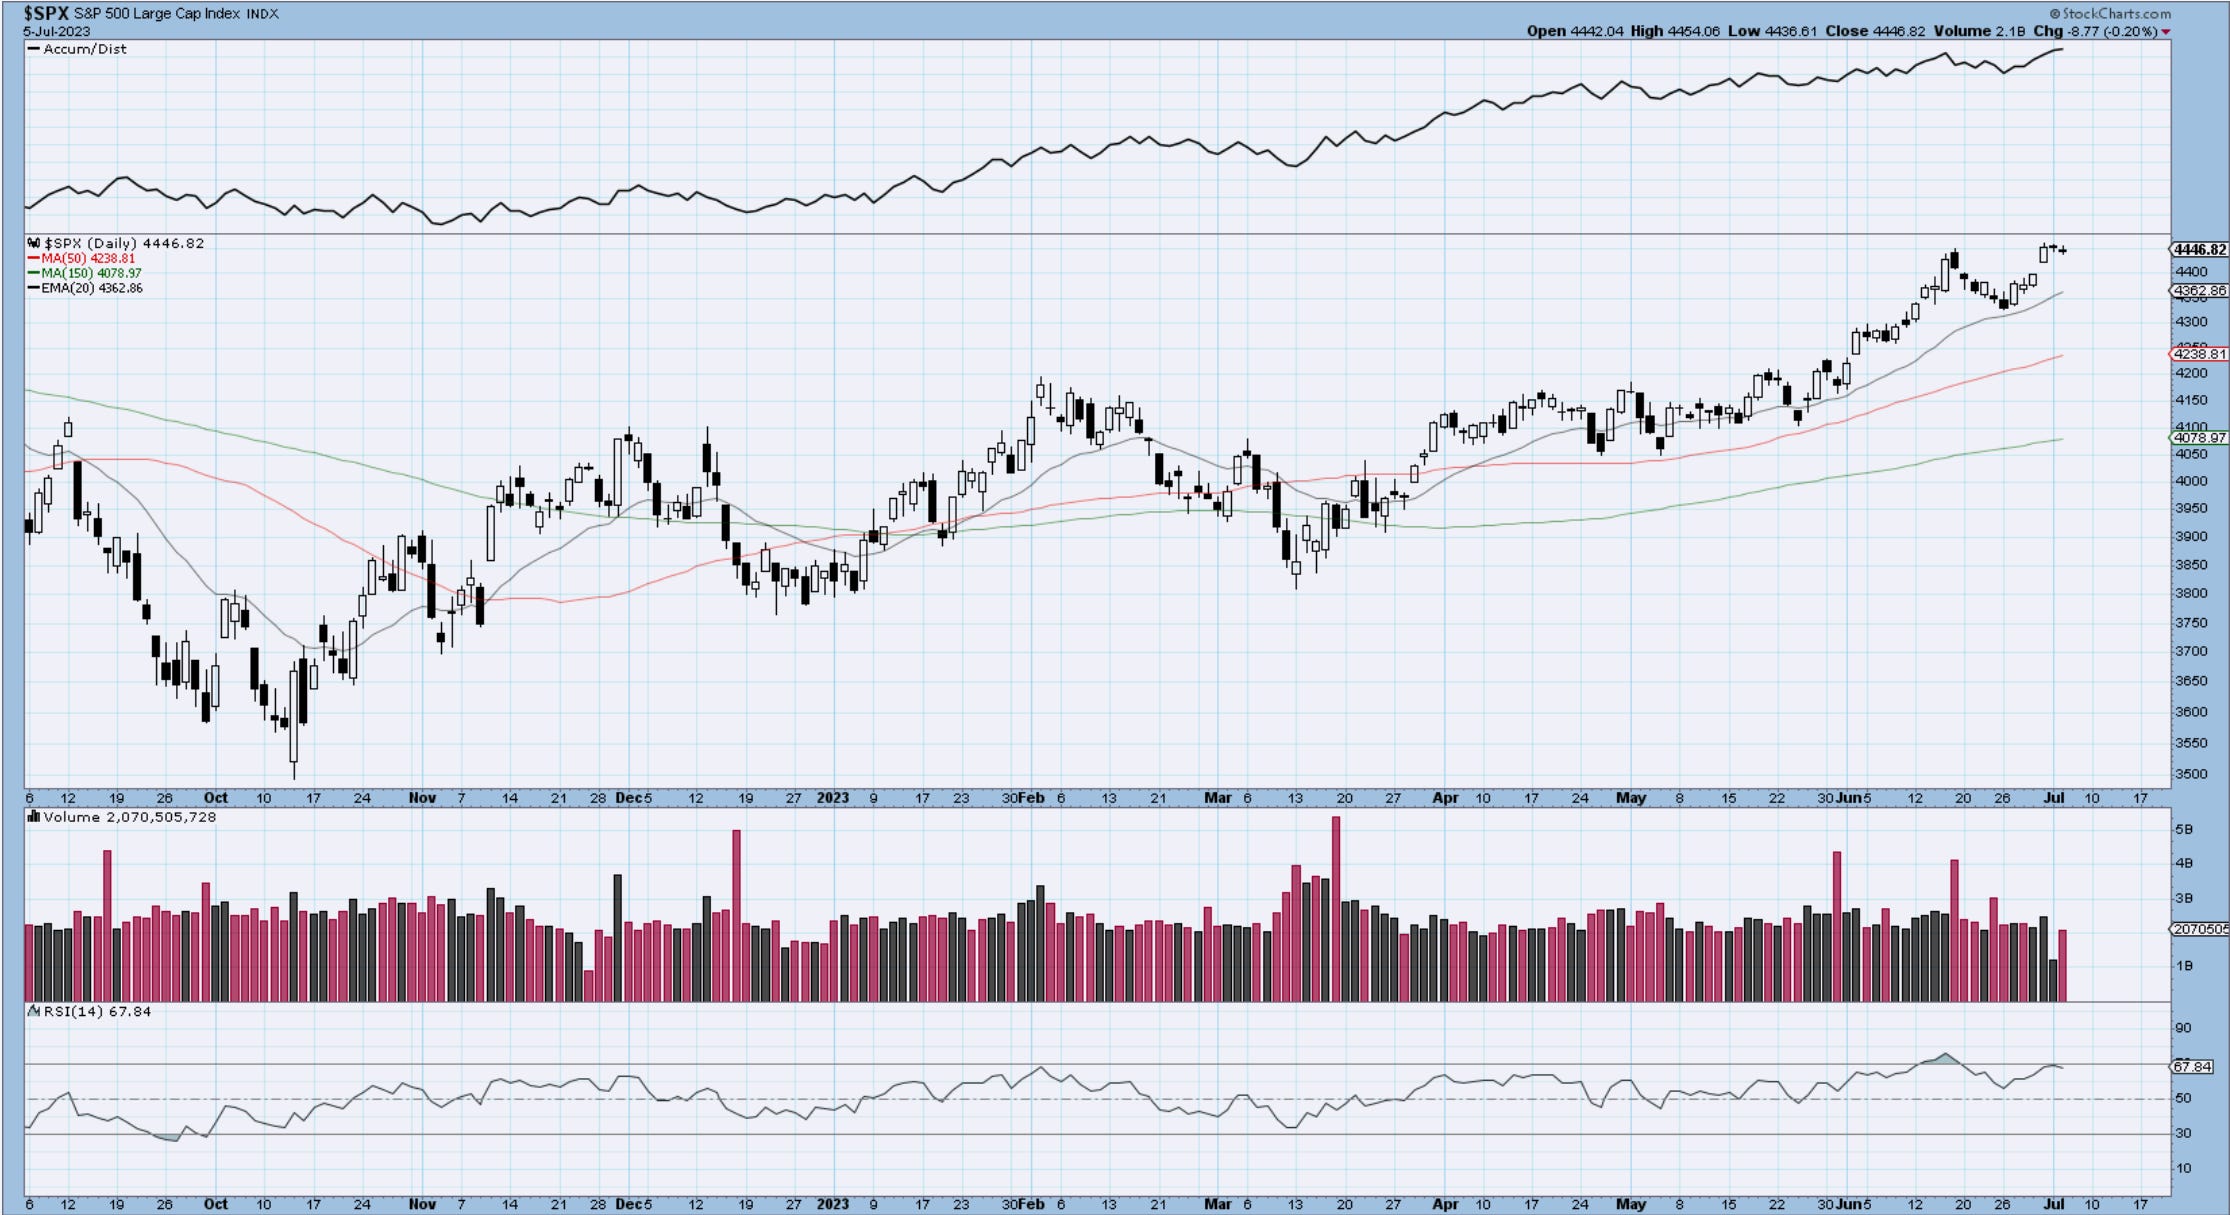
SP500
SP500 remains in an uptrend. Looking at the daily charts, we can see the clear breakout above the Aug ‘22 highs, followed by a retest of that zone. The fact that we held solidifies that level’s importance. Wave ((iii)) seems to be in progress, and it’s relatively short to what the Wave Principle teaches us in regards to its size compared with wave ((i)). For that reason, I think we need to see this travel toward the March ‘22 highs at 4639 before we can start thinking about labeling a possible ending to the move. The moving averages are all sloping now higher, supporting the idea of higher prices. I would say that for at least a couple of months, we should continue the positive market behavior. There will be hard data coming this month, with NFP on Friday, CPI a week from today, and Fed decision on the 26th. Throw in the upcoming earnings season, and things could get interesting. There will be attempt shakeouts by the market which will test the resilience of the bulls and the “dip buying” mentality. There is still quite a bit of negativity and still plenty of “non-believers” in the current trend. As long as that persists, we should have further upside fuel.

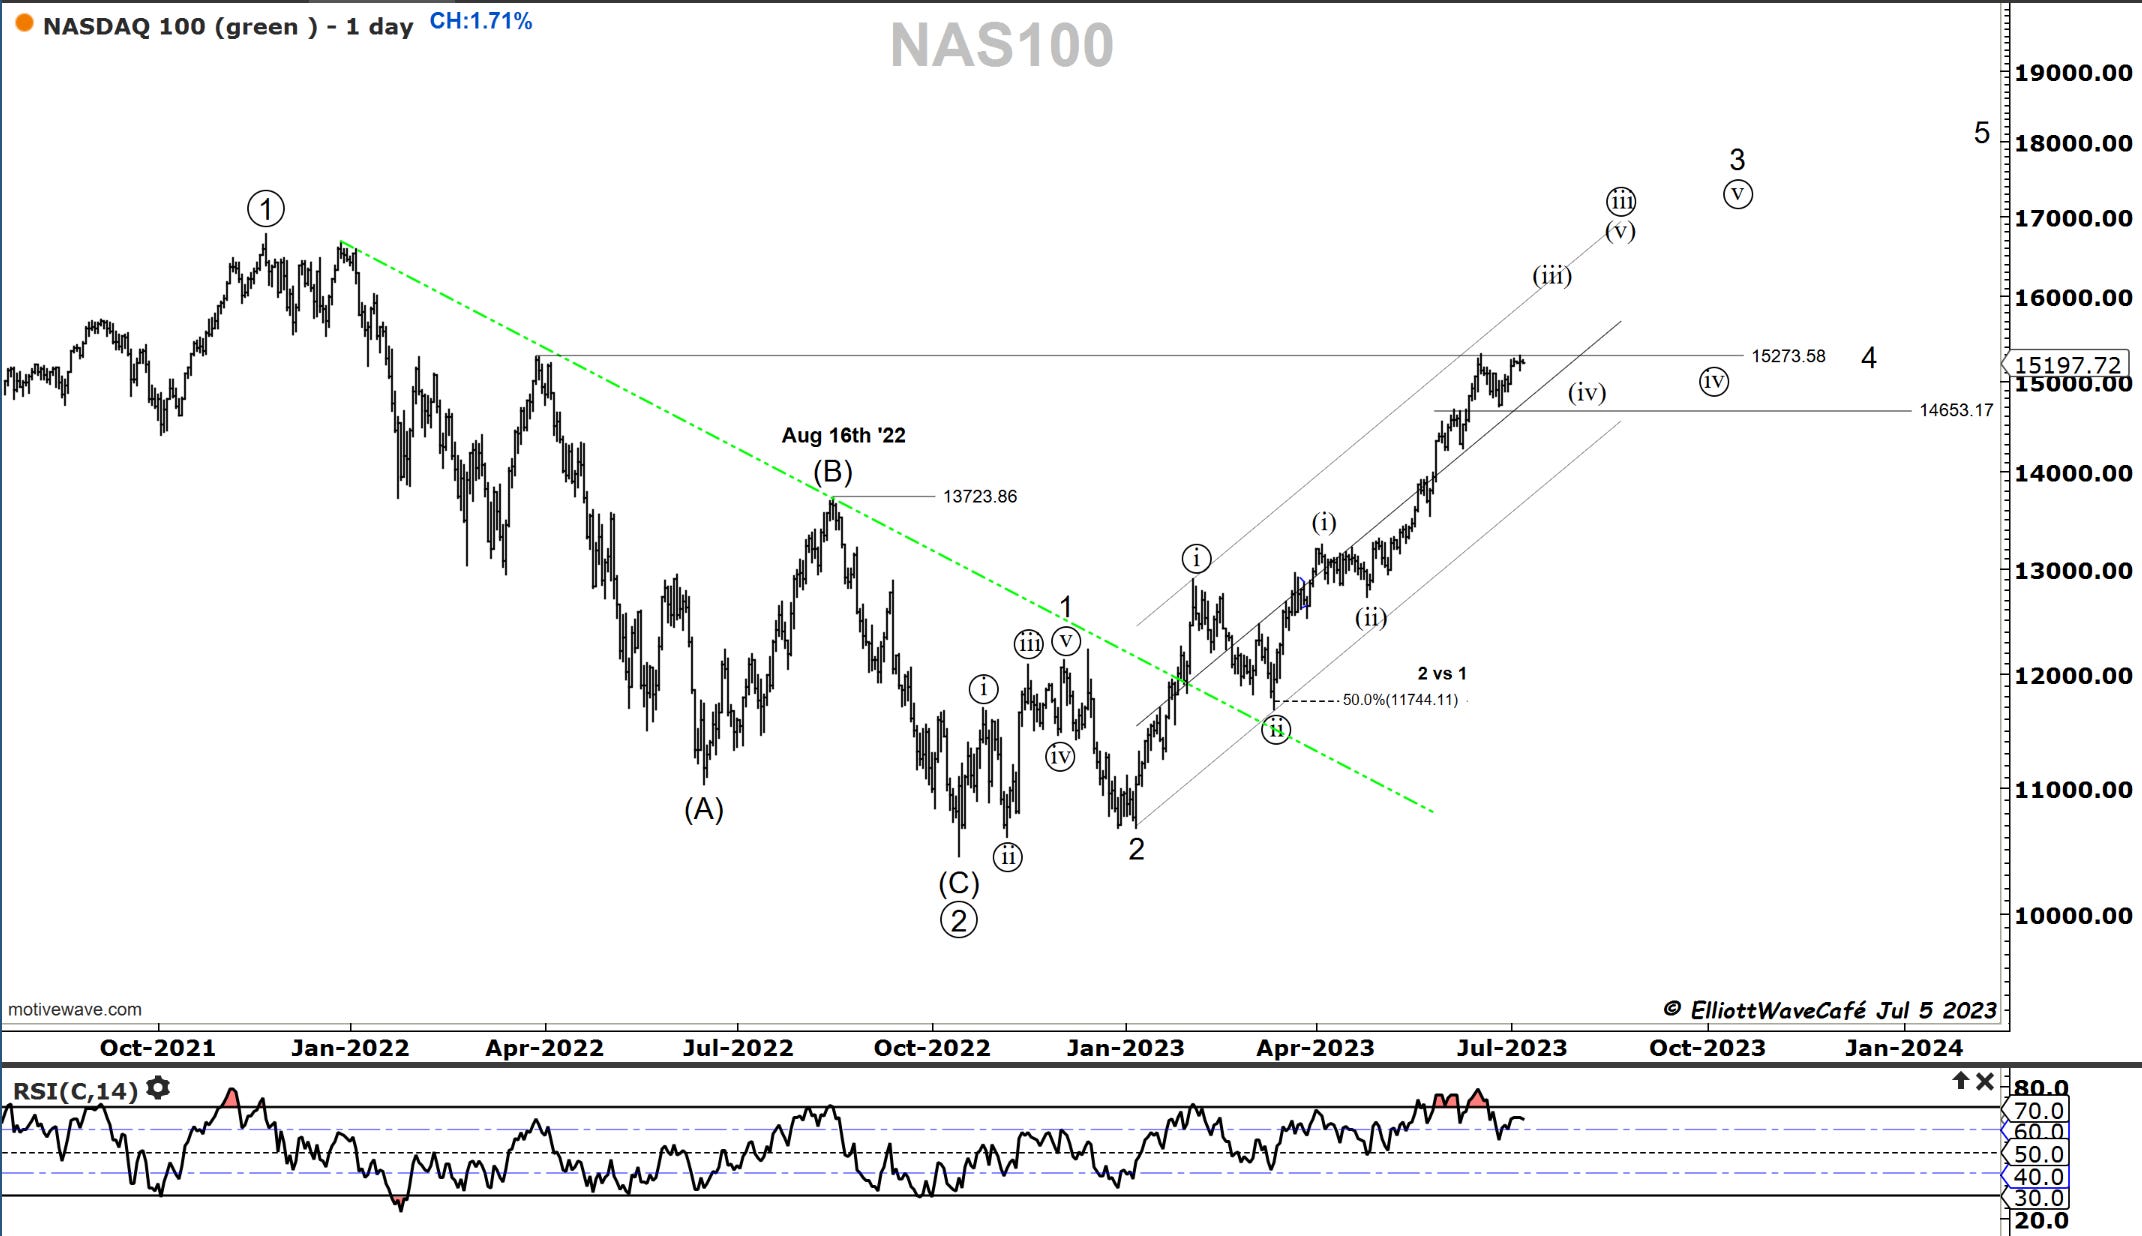
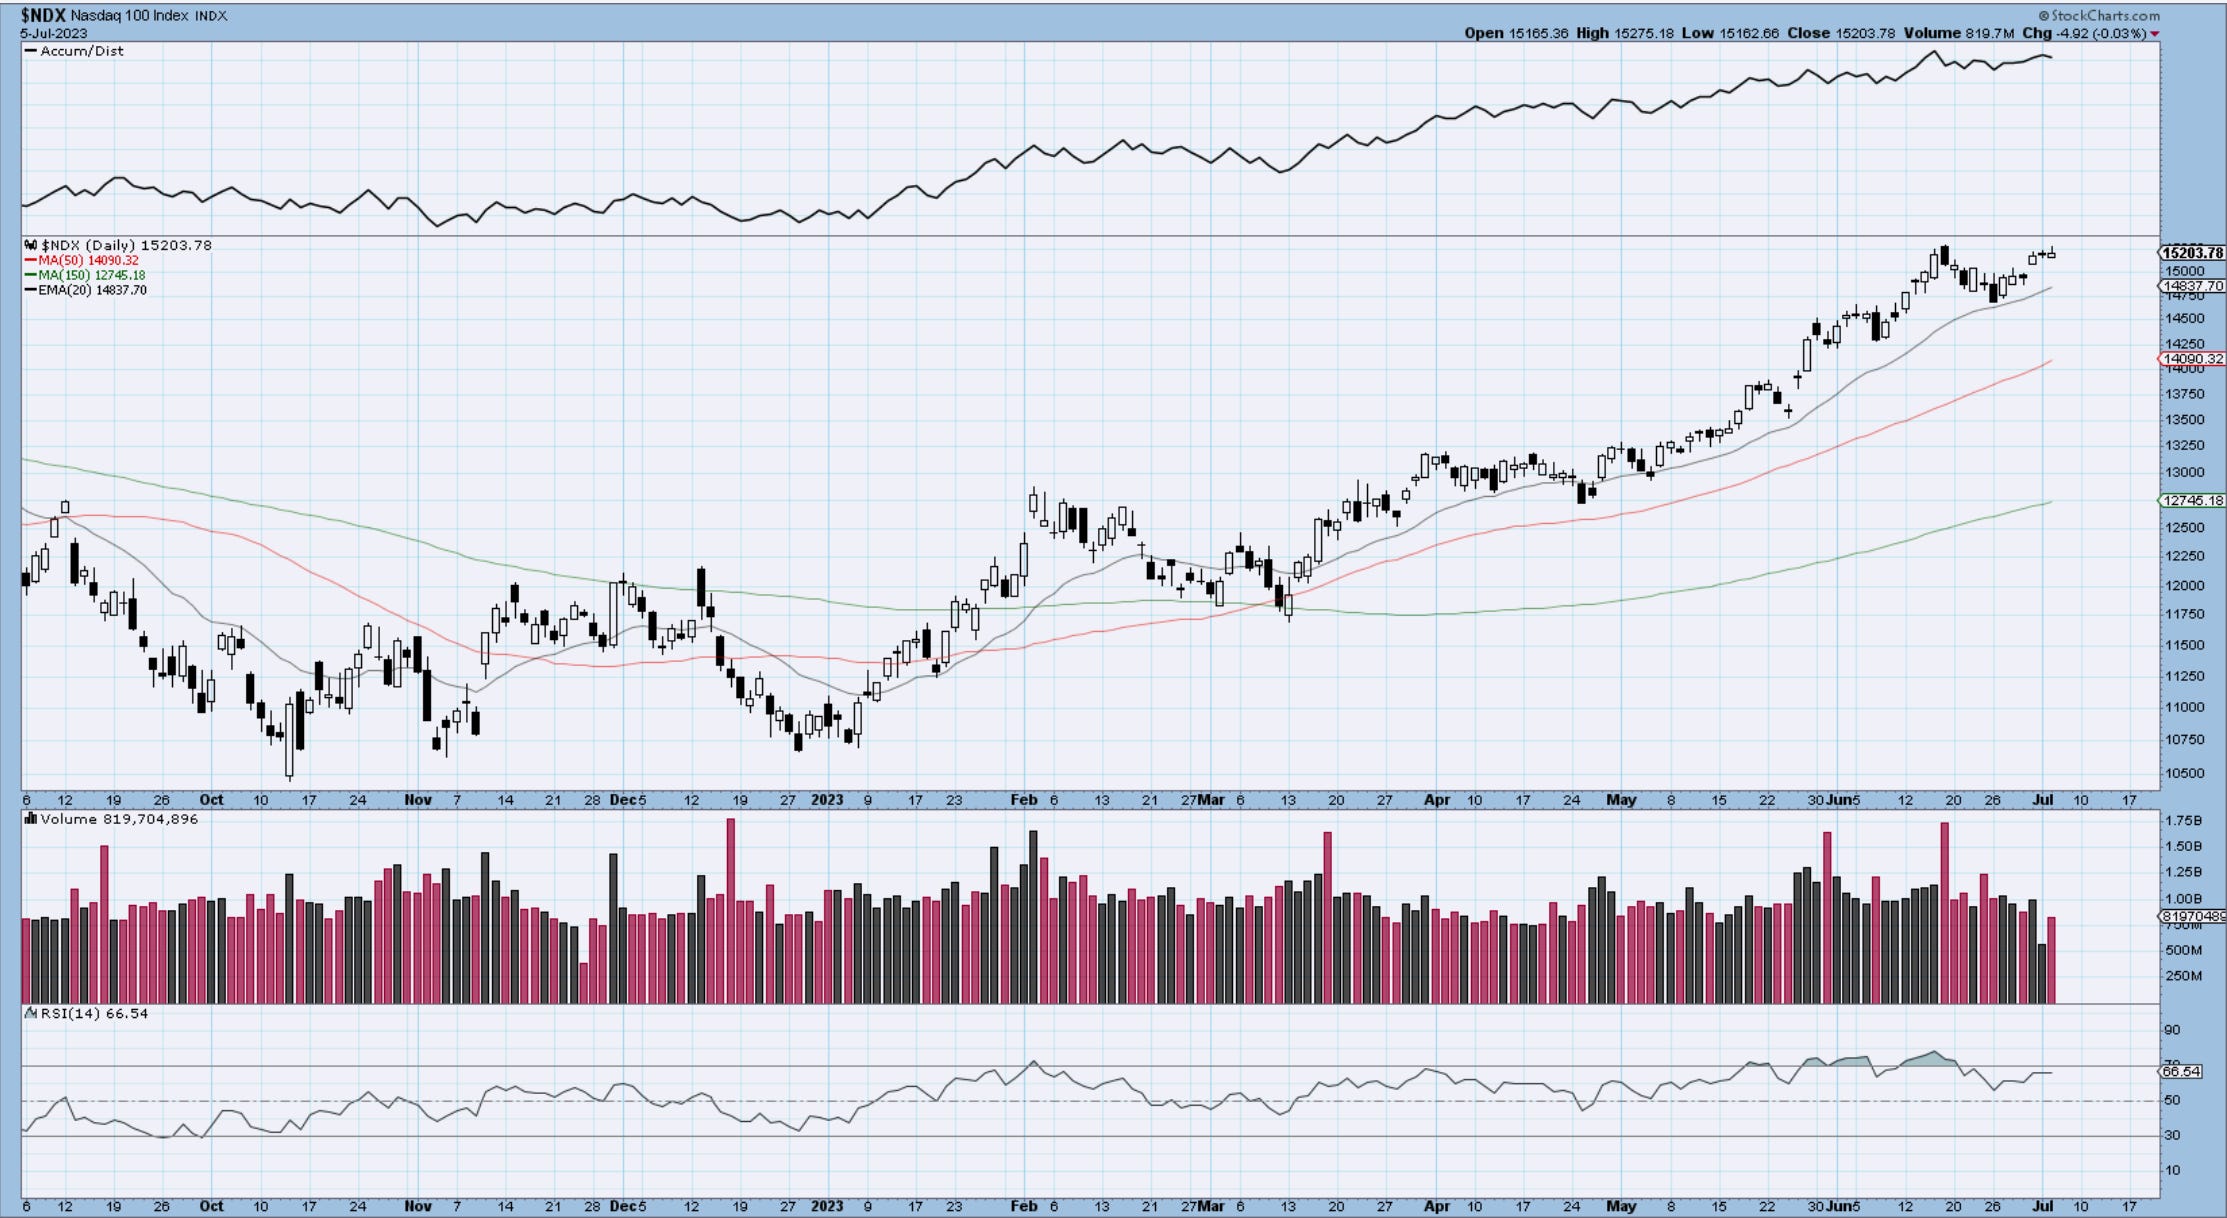
Nasdaq100
We’re stalling in the Nasdaq just below those March ‘22 highs. This looks like a much better-formed wave (iii), and it’s quite close as well to the 161.8% multiple of wave (i). Right around 16k, we can find those levels. Expecting a series of 4th waves at this juncture is not asking a lot, so one has to be prepared for it. Again, this does not mean bearish price action but rather maybe a slower grind higher with somewhat sideways, triangle-type behavior. It remains a strong market and will take quite a bit of back and forth before something comparable with March in terms of size starts to happen. Closing below 20day MA would be one clue to look out for.
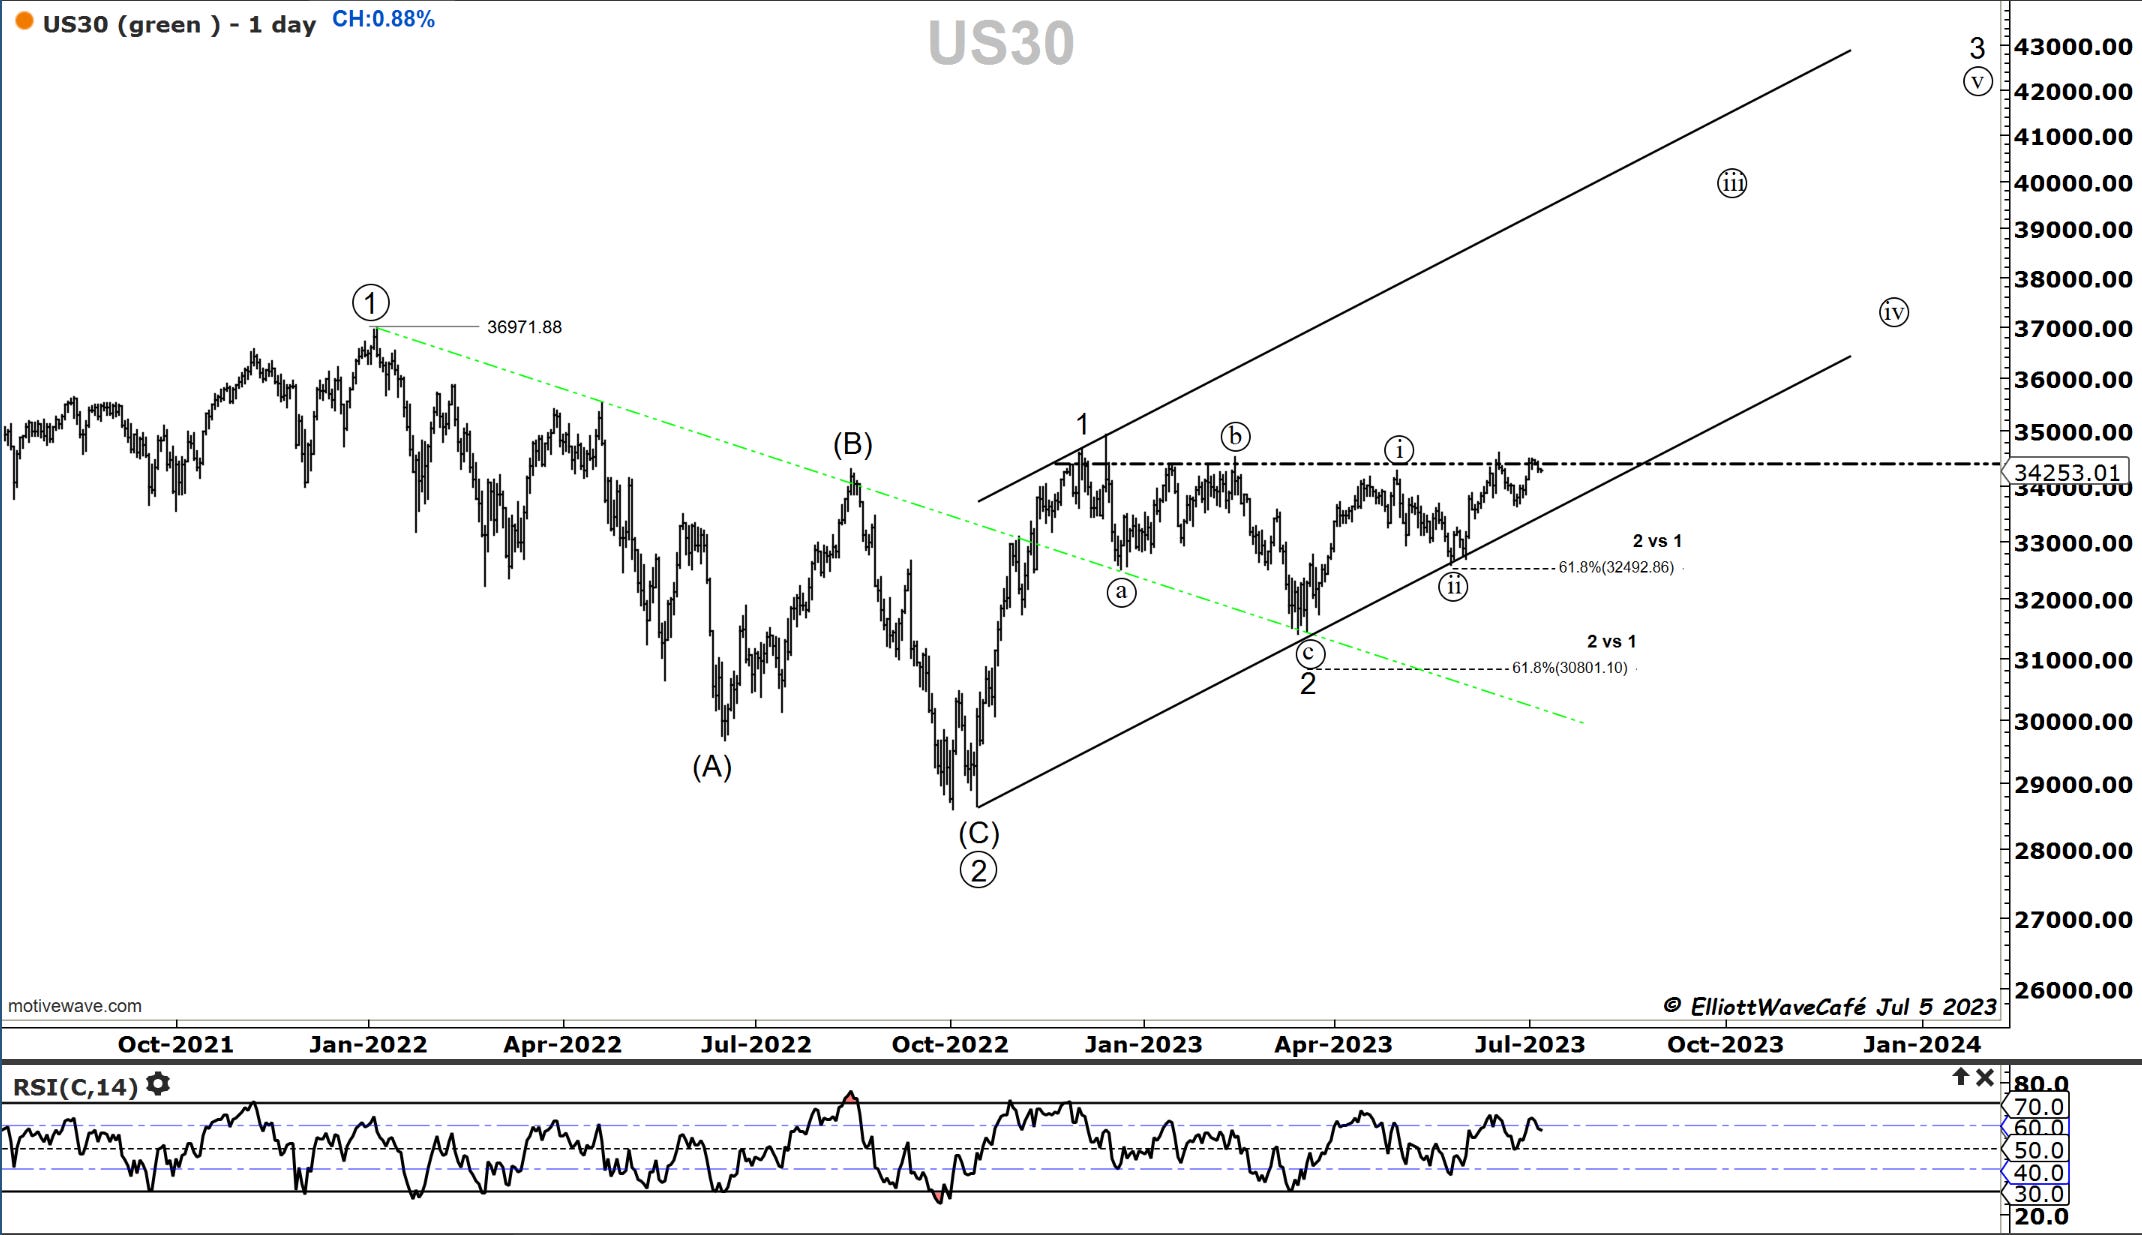
Dow30
Once again looking at the daily charts we see the large resistance near current levels. If you draw a trendline instead of a horizontal line, there are arguments that we cracked above. It’s not an aggressive break by any means but it’s something. The further we can away from it the more significant it becomes. It would unleash the main third wave ((iii)). There are quite a few strong stocks in the Dow and a few others finding support on their selloffs. If the good ones continue and the weak ones hold support and bounce, then Dow should really have some legs underneath it. I guess the downside would be, weak ones get weaker and strong ones find resistance. That’s how bears would look at it. I will stick to the ongoing trend and orientation of the market until we have enough reasons to believe otherwise.
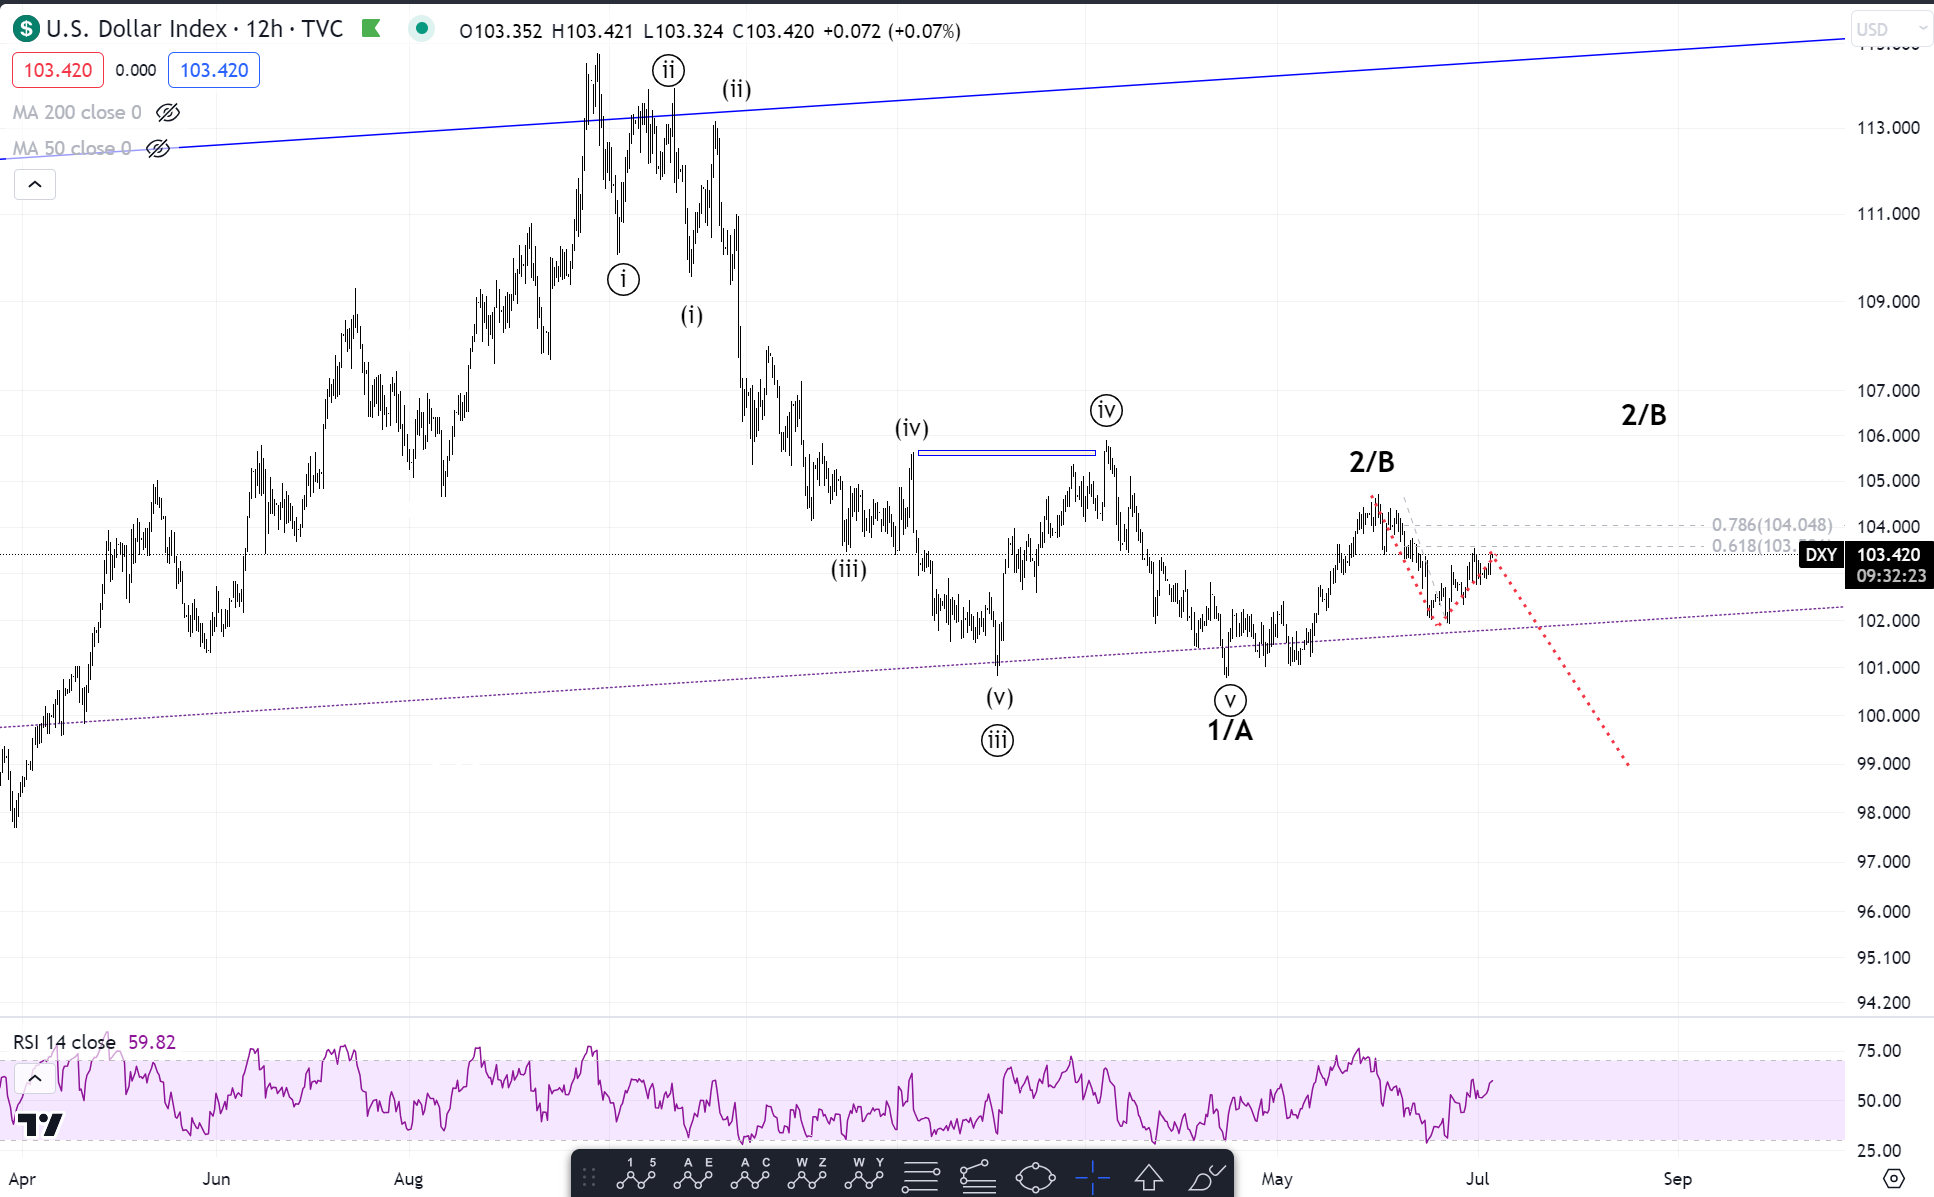
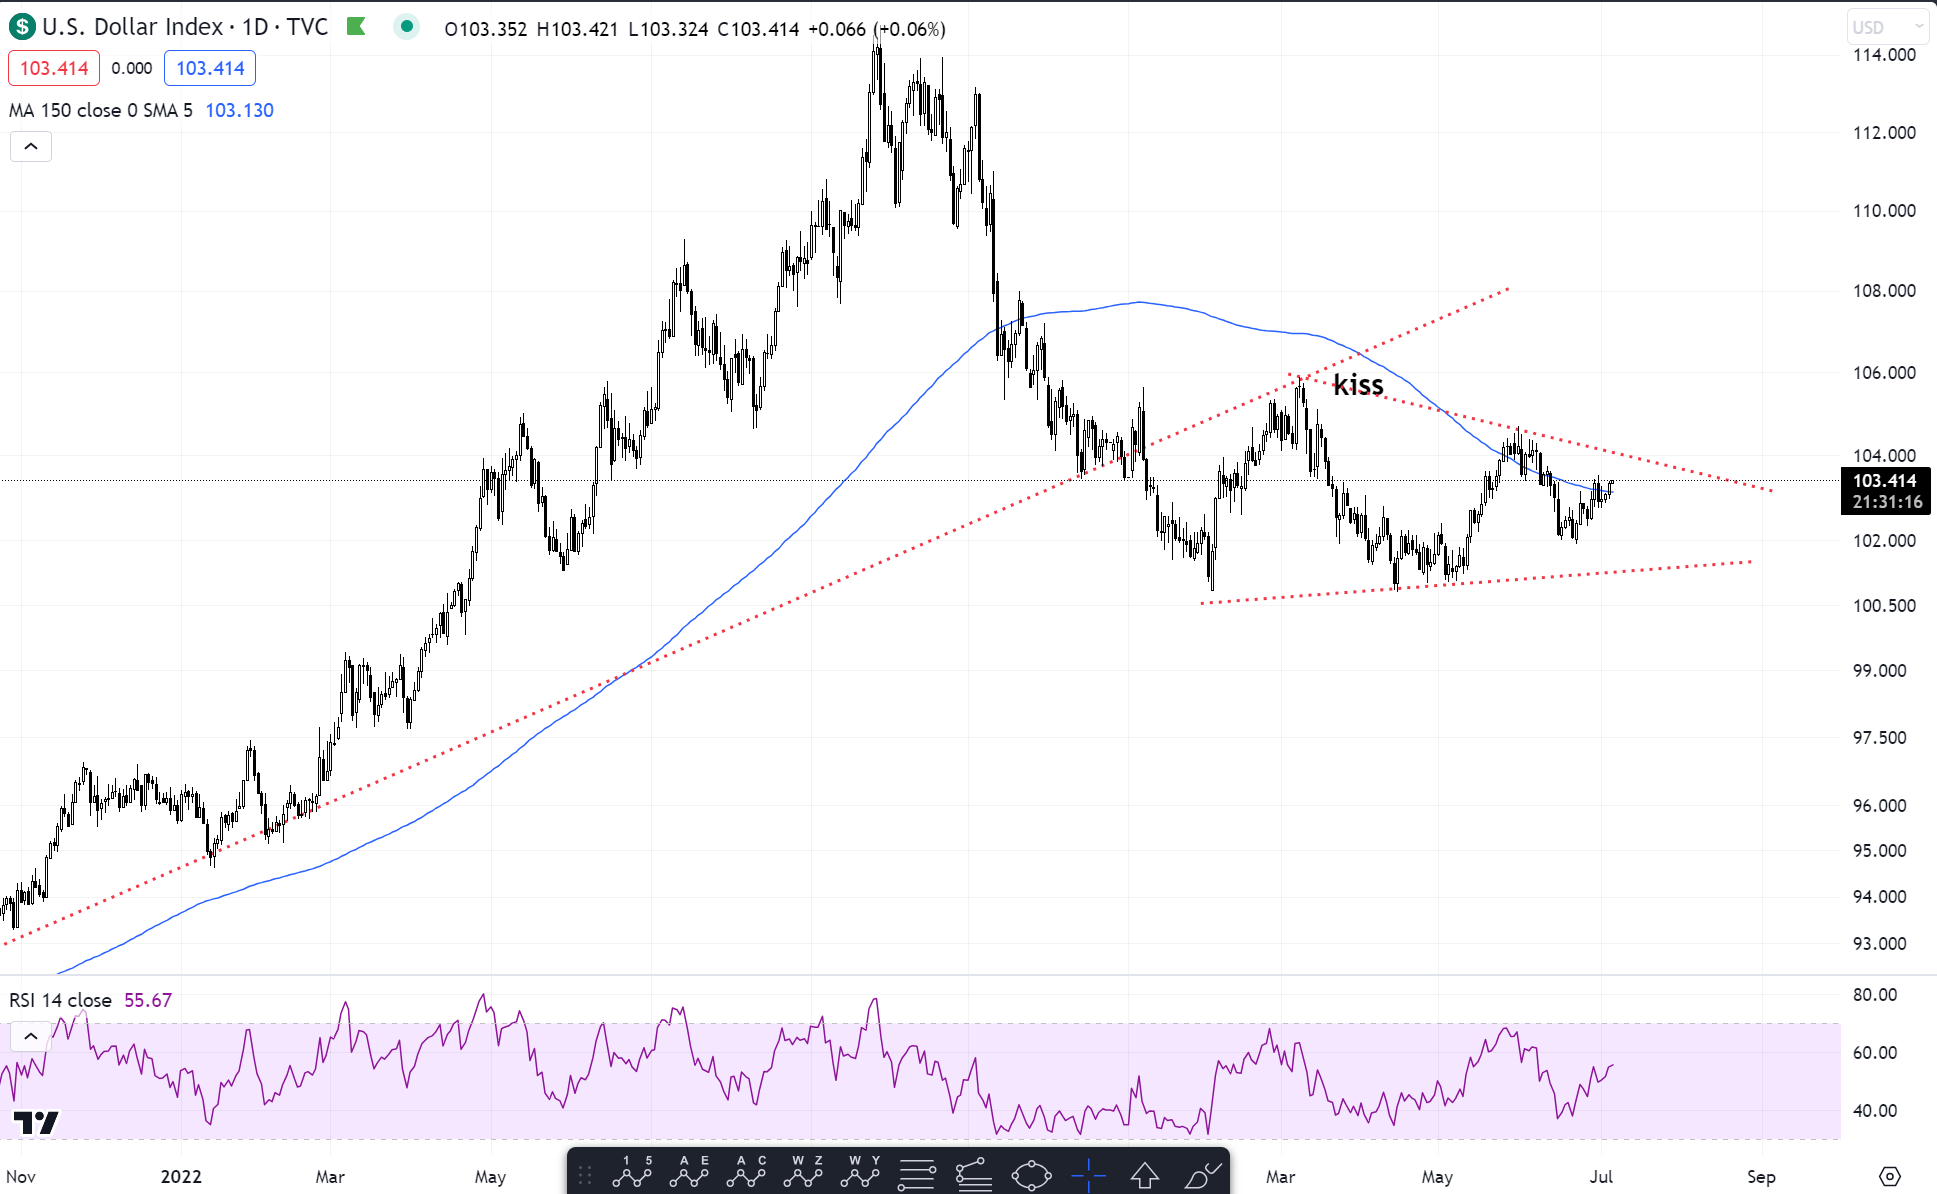
US Dollar
We’re still below that 61.8% zone shorter term and forming a series of higher lows and lower highs overall. Nothing to get excited about when prices are converging like this. We seem to have a good equilibrium and to be honest I would like it to stay this way. The last thing we need is some dramatic dollar moves to throw everything into a spin. If we crack 104 we open the door to 106 and good throw some “risk off” vibes in the mix. CPI and Fed can both whip this thing around. I don’t trade it much lately, I use it as a risk gauge on my dashboard.
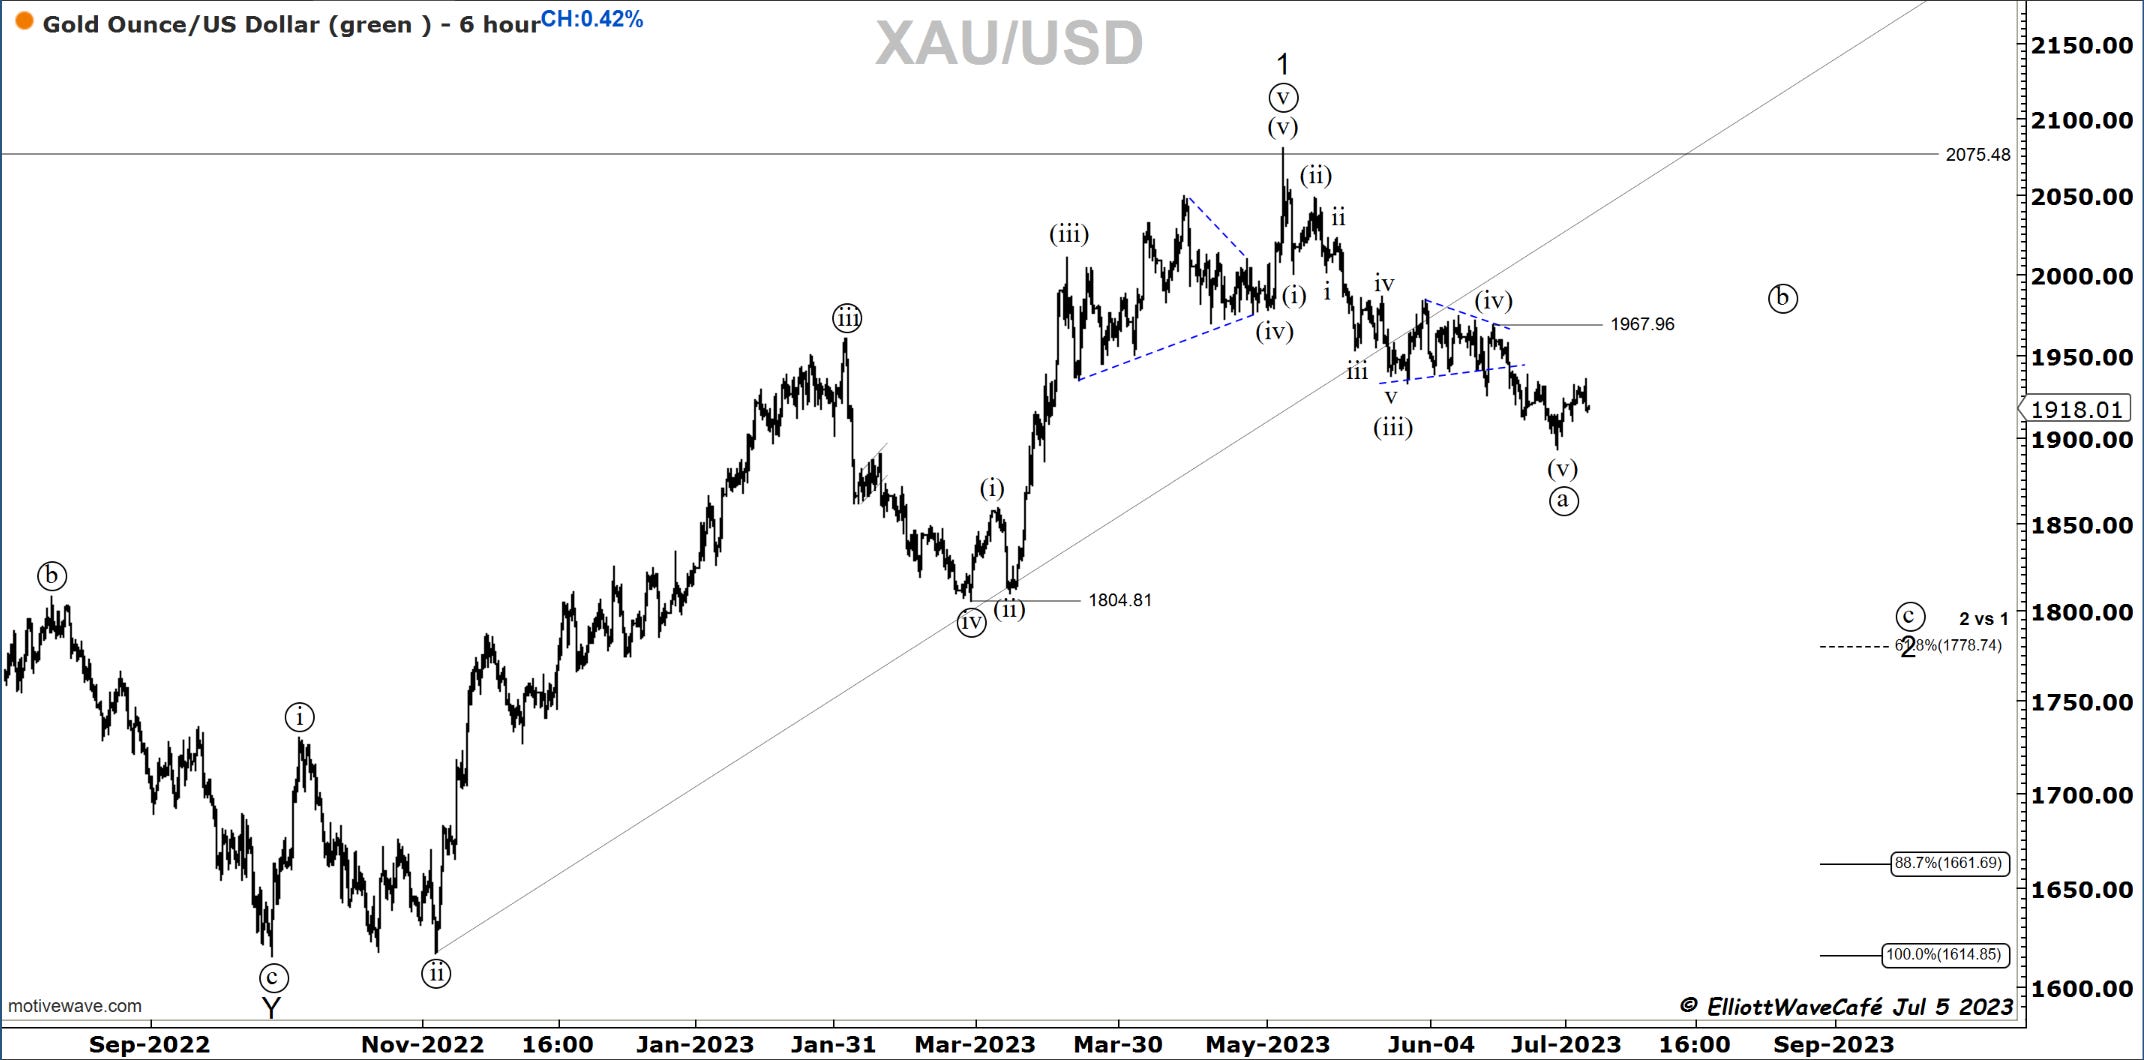
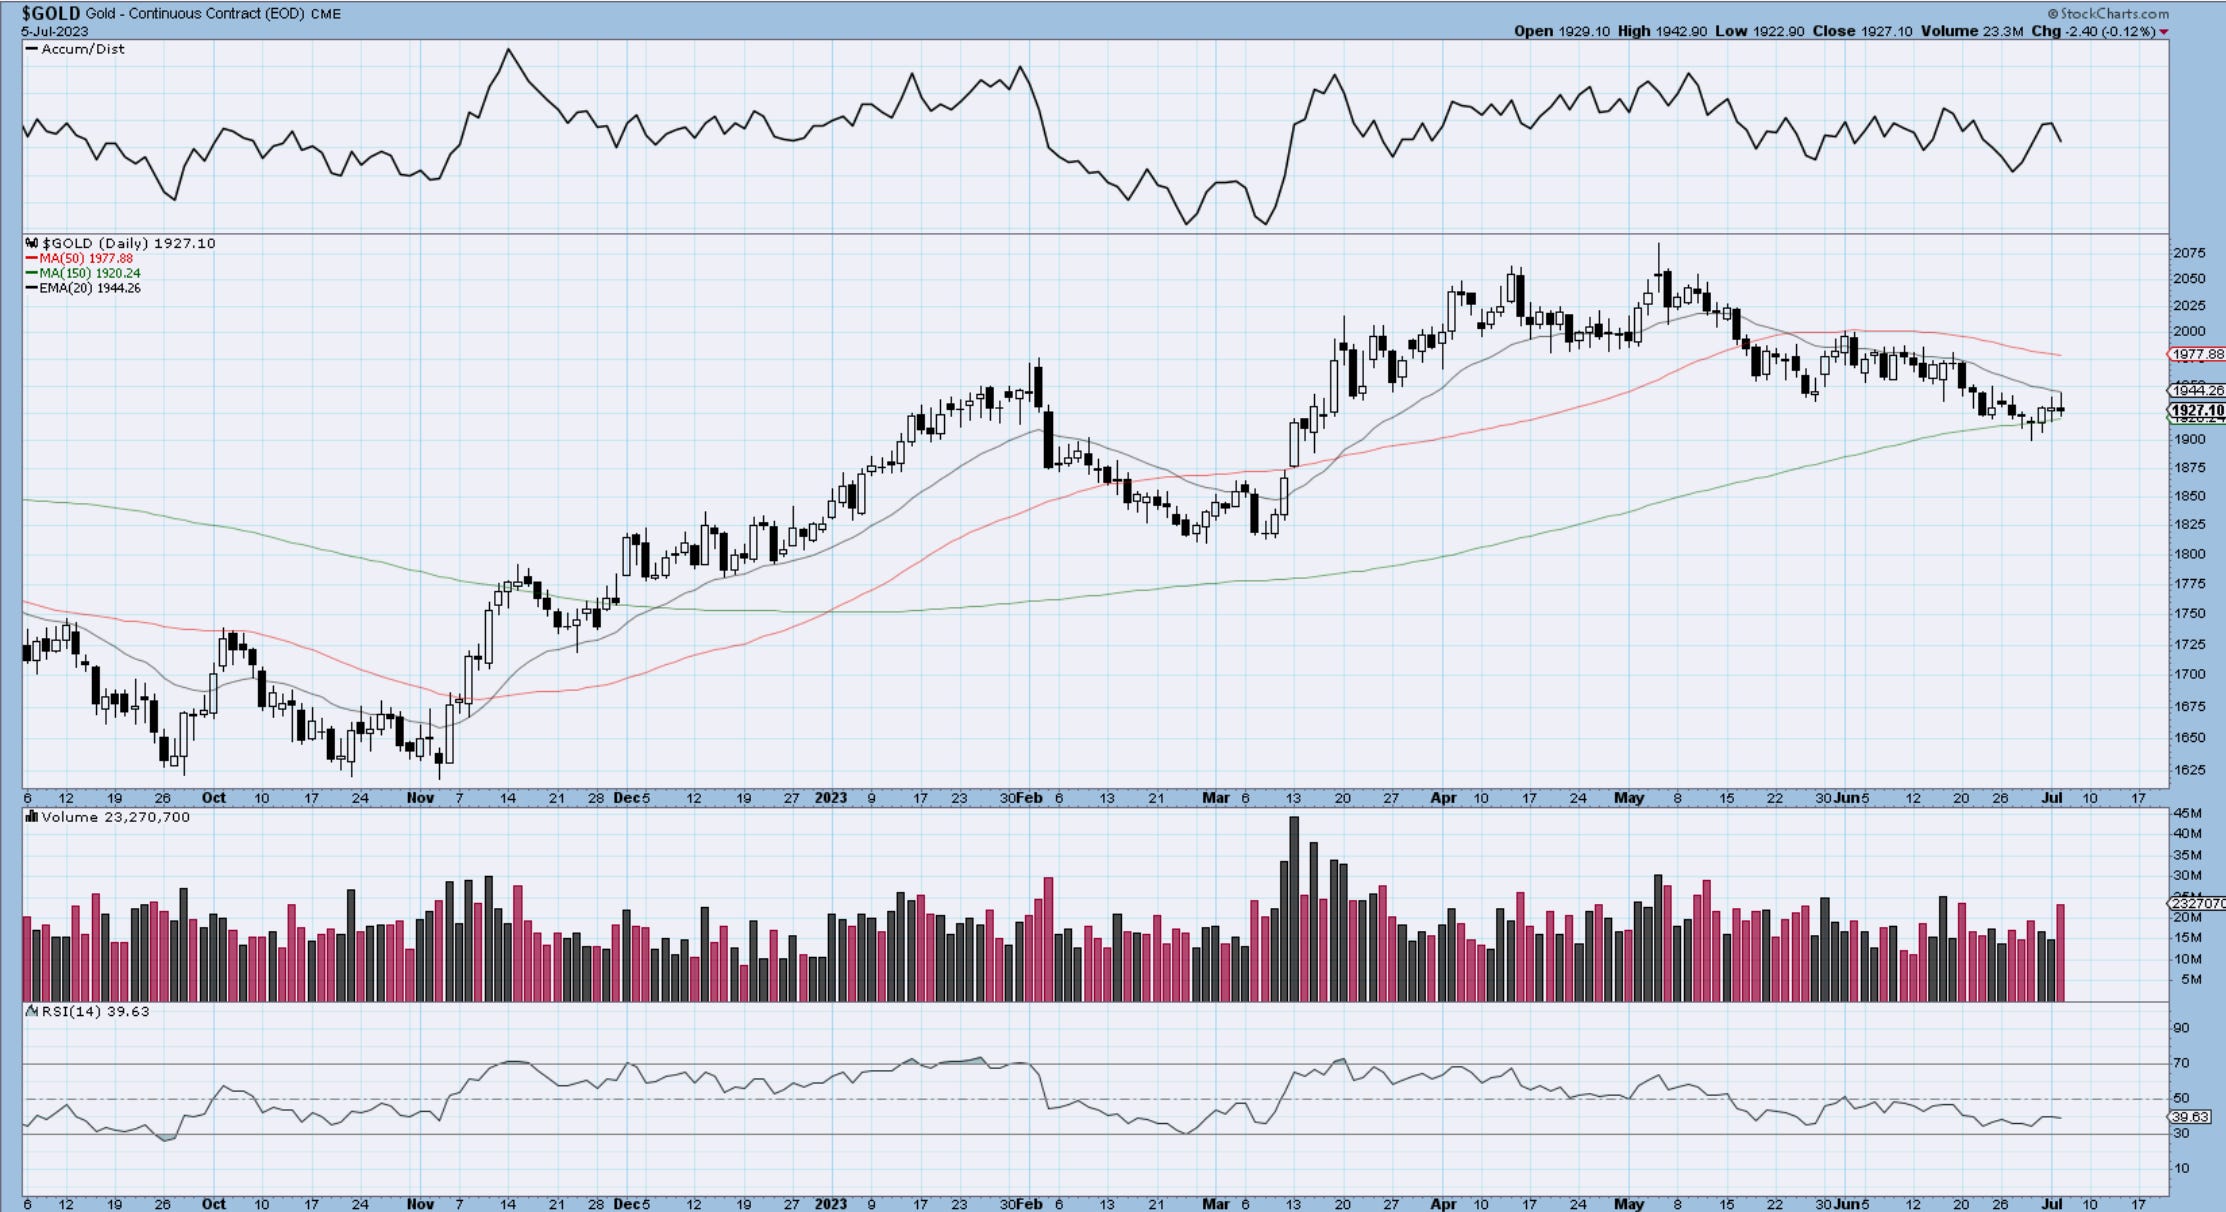
Gold
We did get the bullish move we discussed last week, but only as high as 1935 before retreating a bit. If the wave ((b)) started this bounce should not fail. A stronger dollar and rising yields would be a headwind for sure. The daily candles remain unimpressive, the RSI is sad below 50. So we might not have enough juice to keep this going. Not doing anything here but having that small exposure in the weekly ETF portfolio.
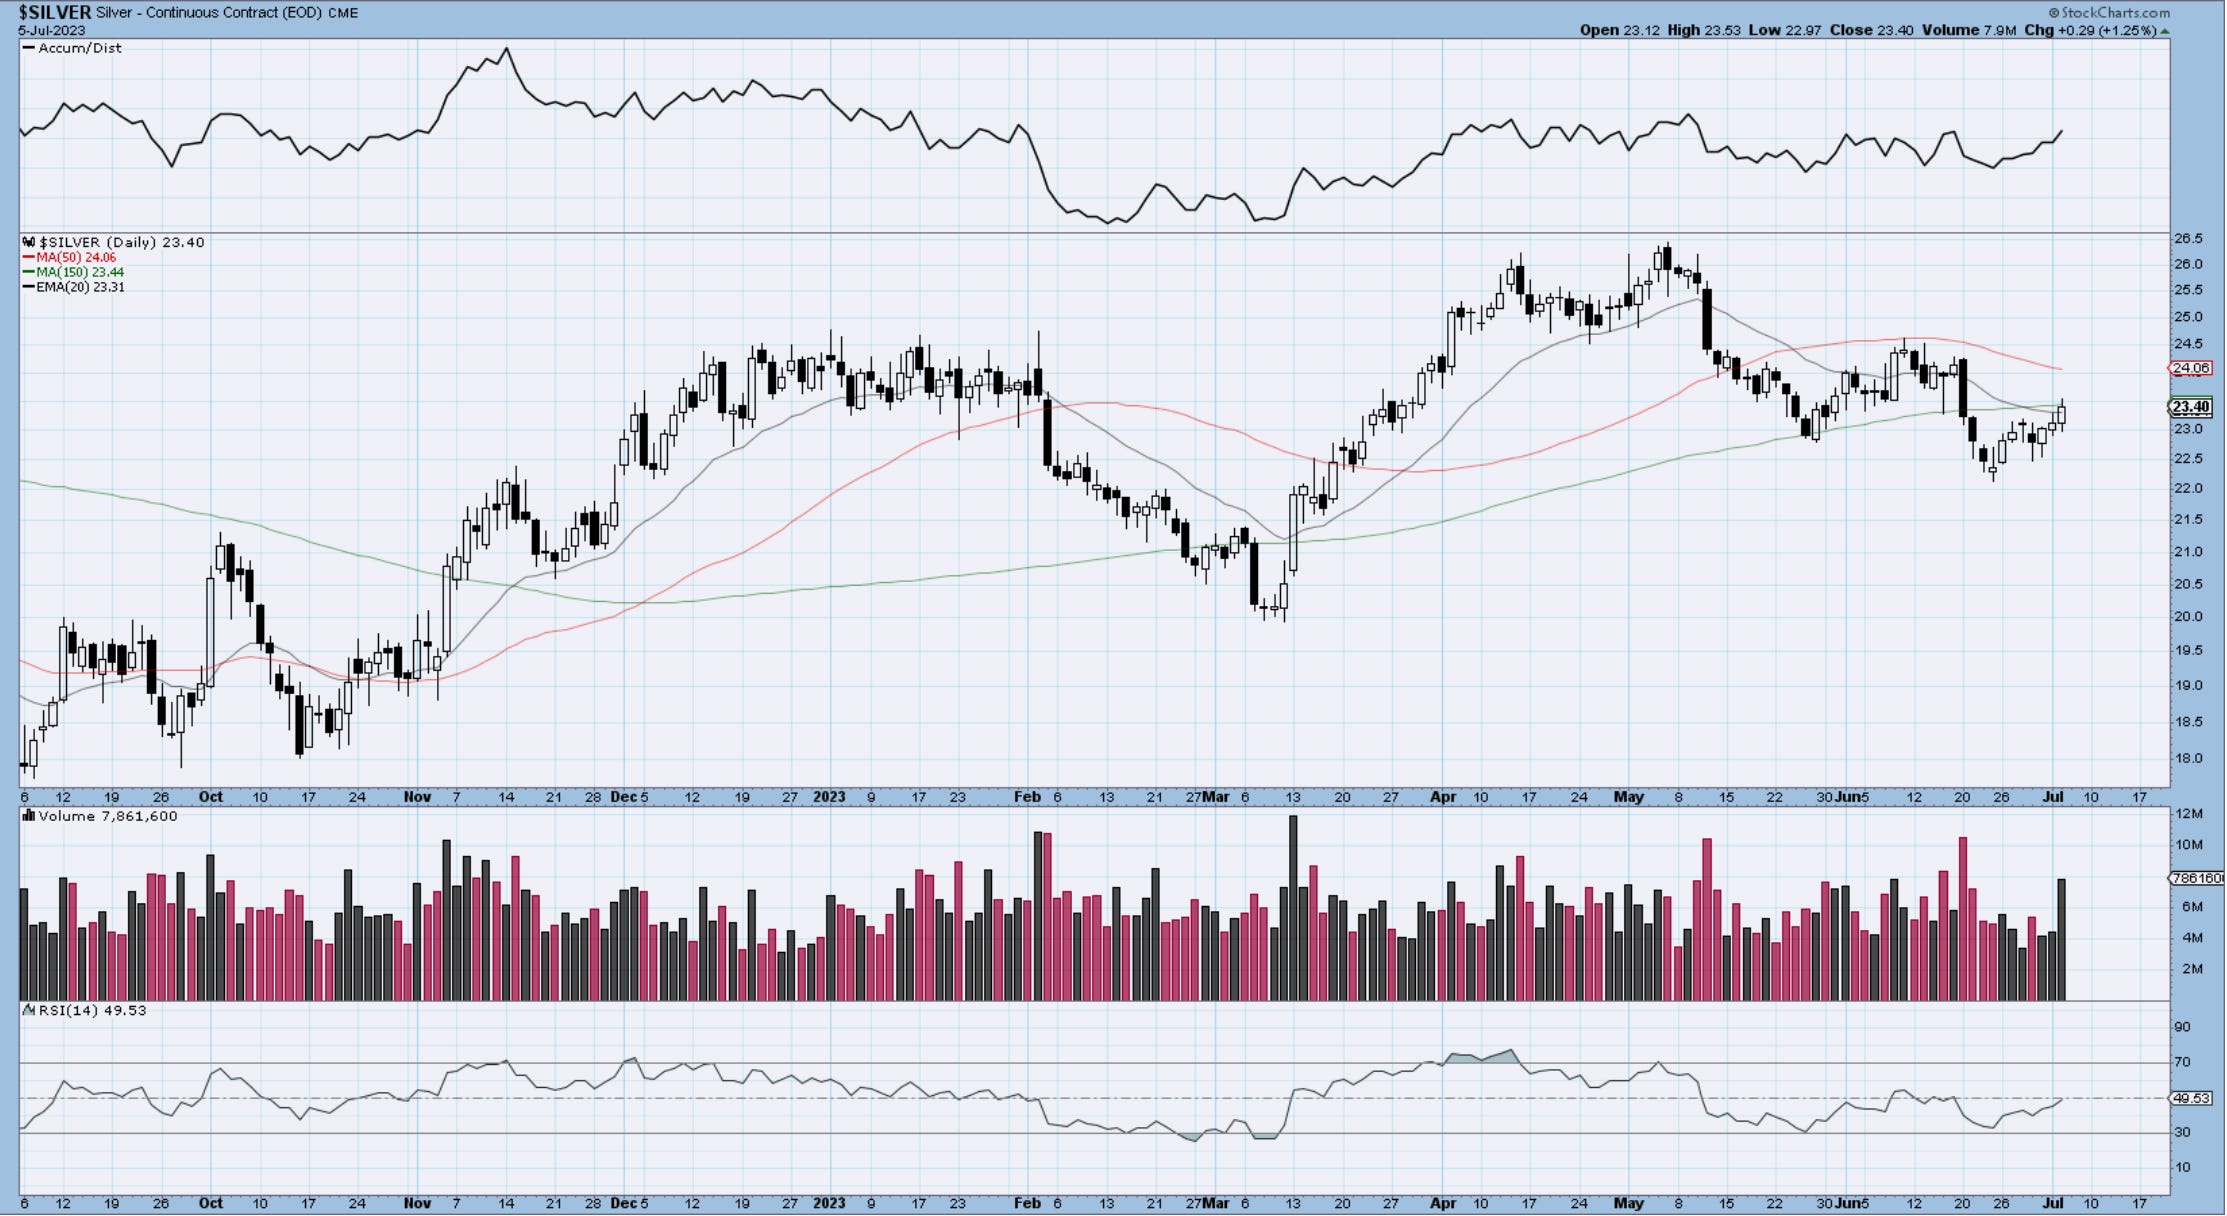
Silver
Silver is bringing some serious volume into the mix, but has yet to take us above the key MAs. Good reaction from the 61.8% for the second time on the drops. If we can crack again 24.50 and be above those trendlines and channels, the bullish arguments will be starting to flow more easily. We’ll be in fresher air.
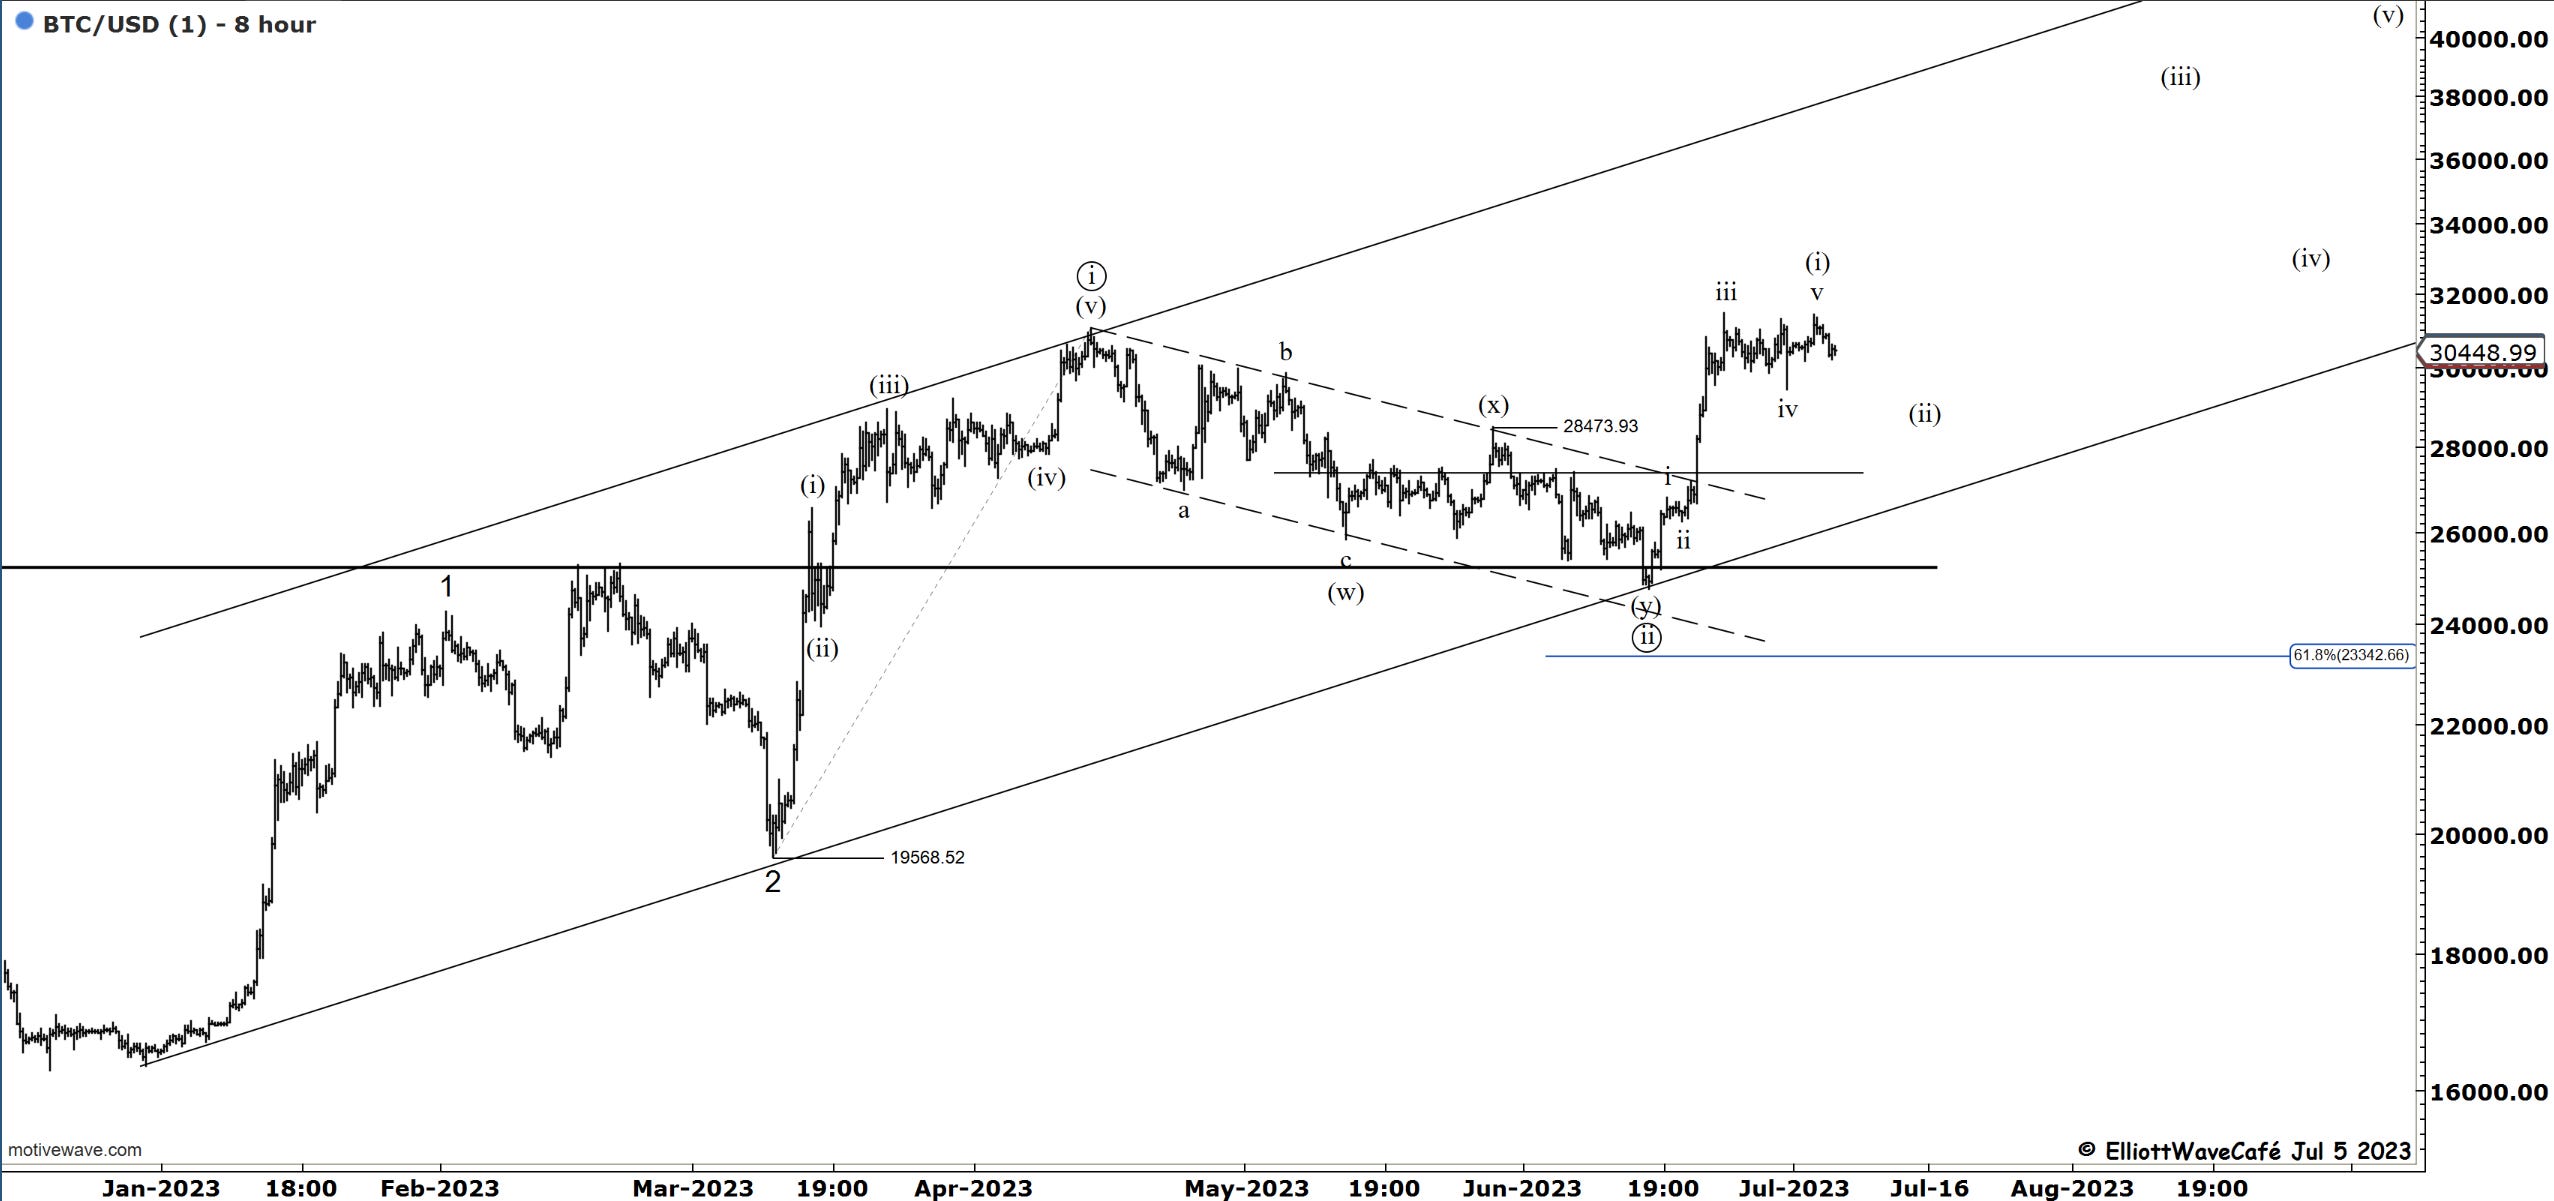
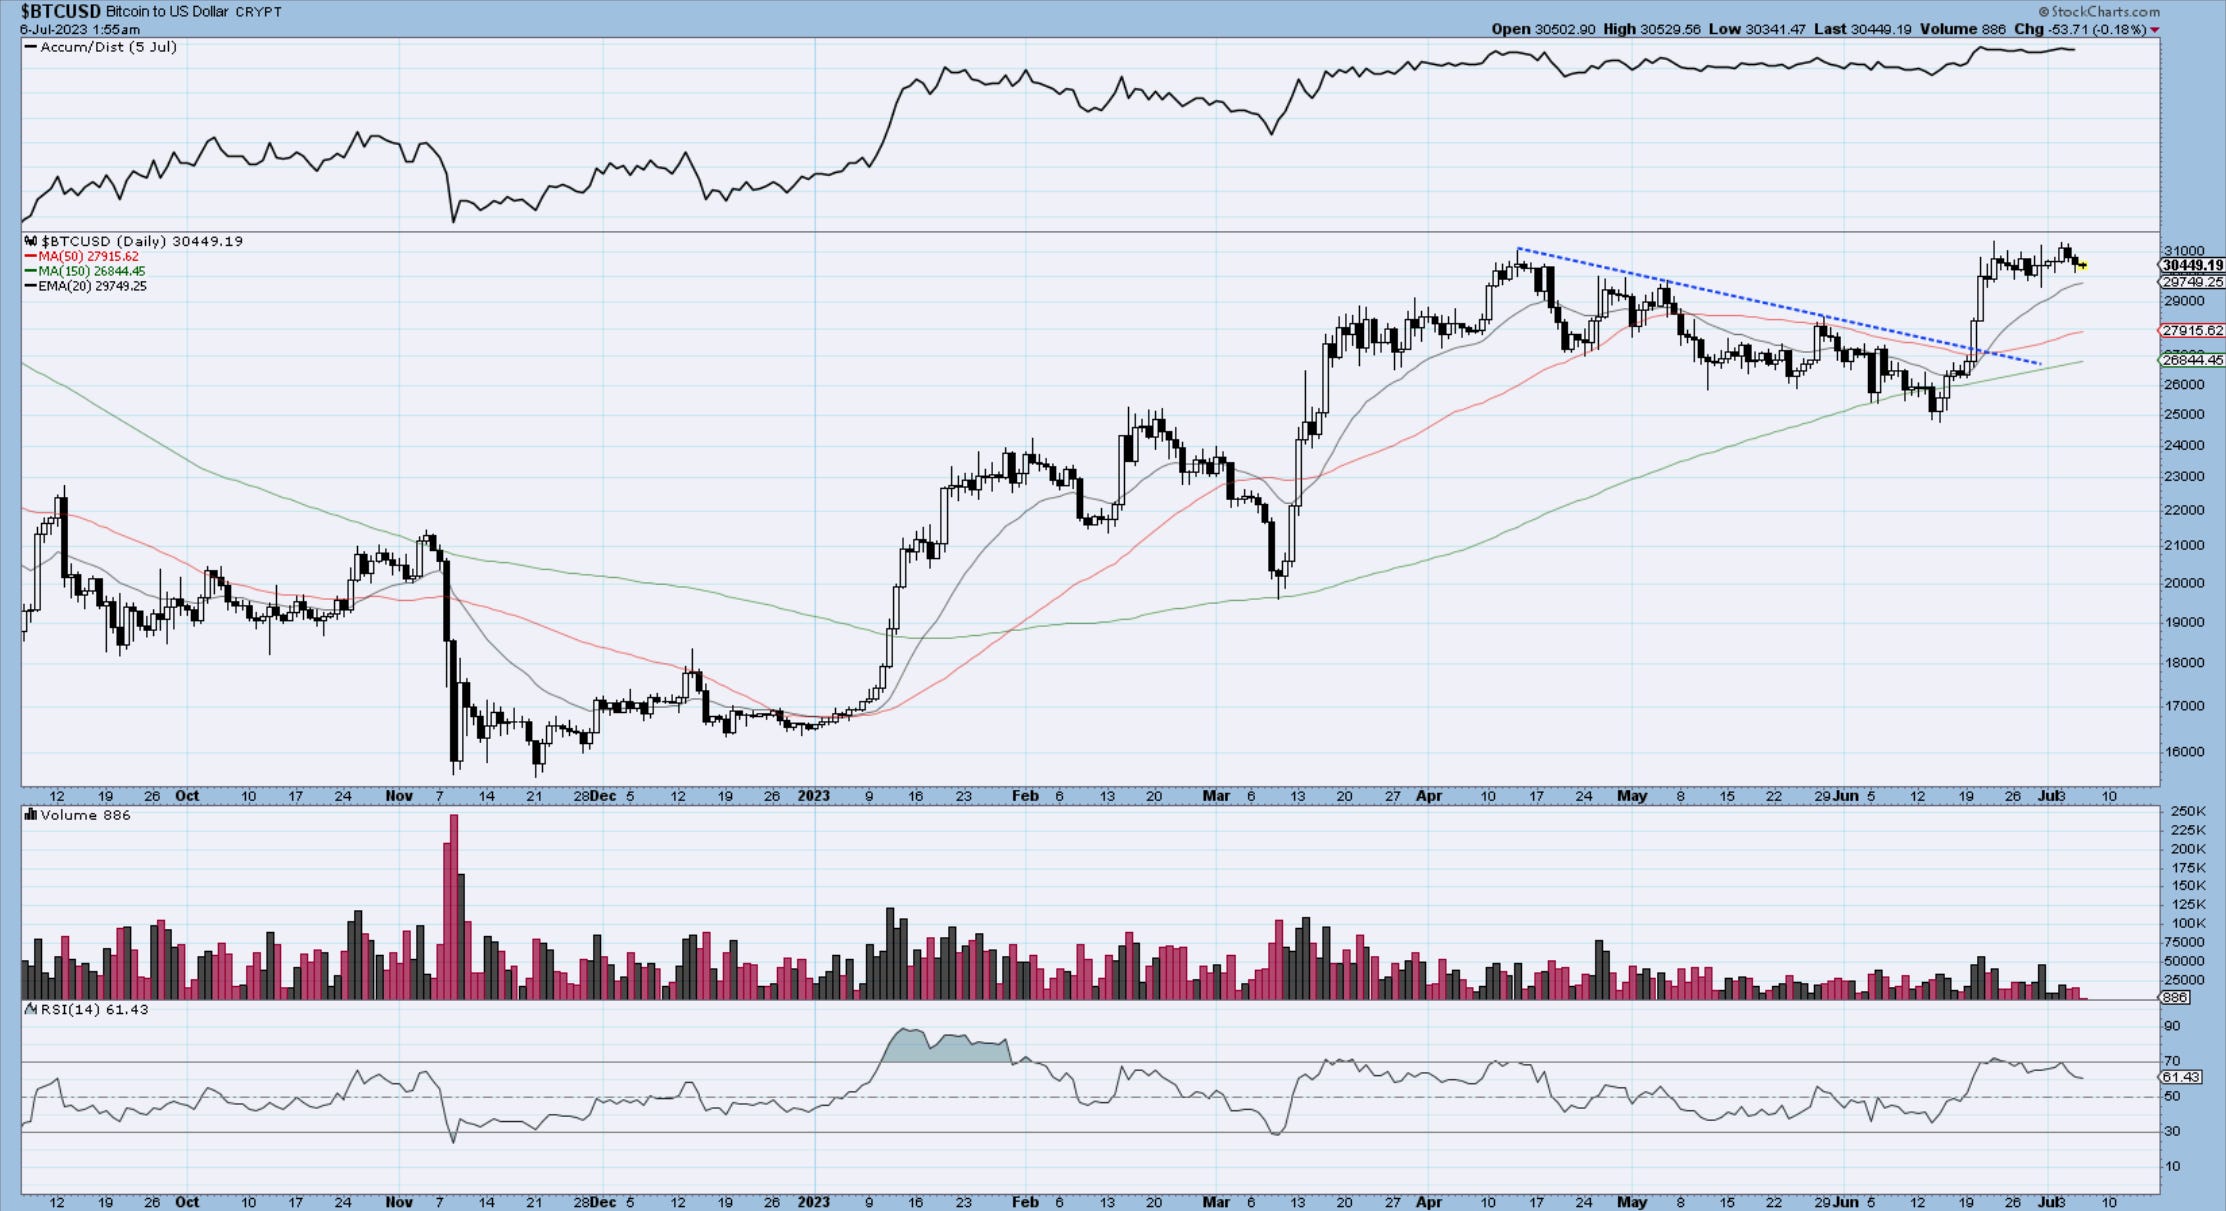
Bitcoin
The message I conveyed last week is still playing out. To build another explosive rally after a $6k move it’s tough to do. The 3rd wave is pretty obvious and during the last few days, we built 4th and maybe even the 5th. A normal expectation would be another setback for a wave (ii), before we charge higher once again. We have been trending higher since the year start and we will continue to play the ball from the long side. 28,700 would be my first area of buy interest and if we lose that we have 27,500 next.
The weekly chart below could not be any clearer in where the key zones are. If we close above 32k on a weekly basis, the 40k level is almost a given, if we can use those words in this business.
See you tomorrow - trade well,
Cris
email: ewcafe@pm.me