
The Daily Drip
Markets review, strategy and analysis
Note: The EW counts on the right edge are real-time, and they are prone to adjustments as price action develops. Elliott Wave has a fluid approach, is evidence-based, and requires constant monitoring of certain thresholds.
In the counts below, this (( )) = circle on chart
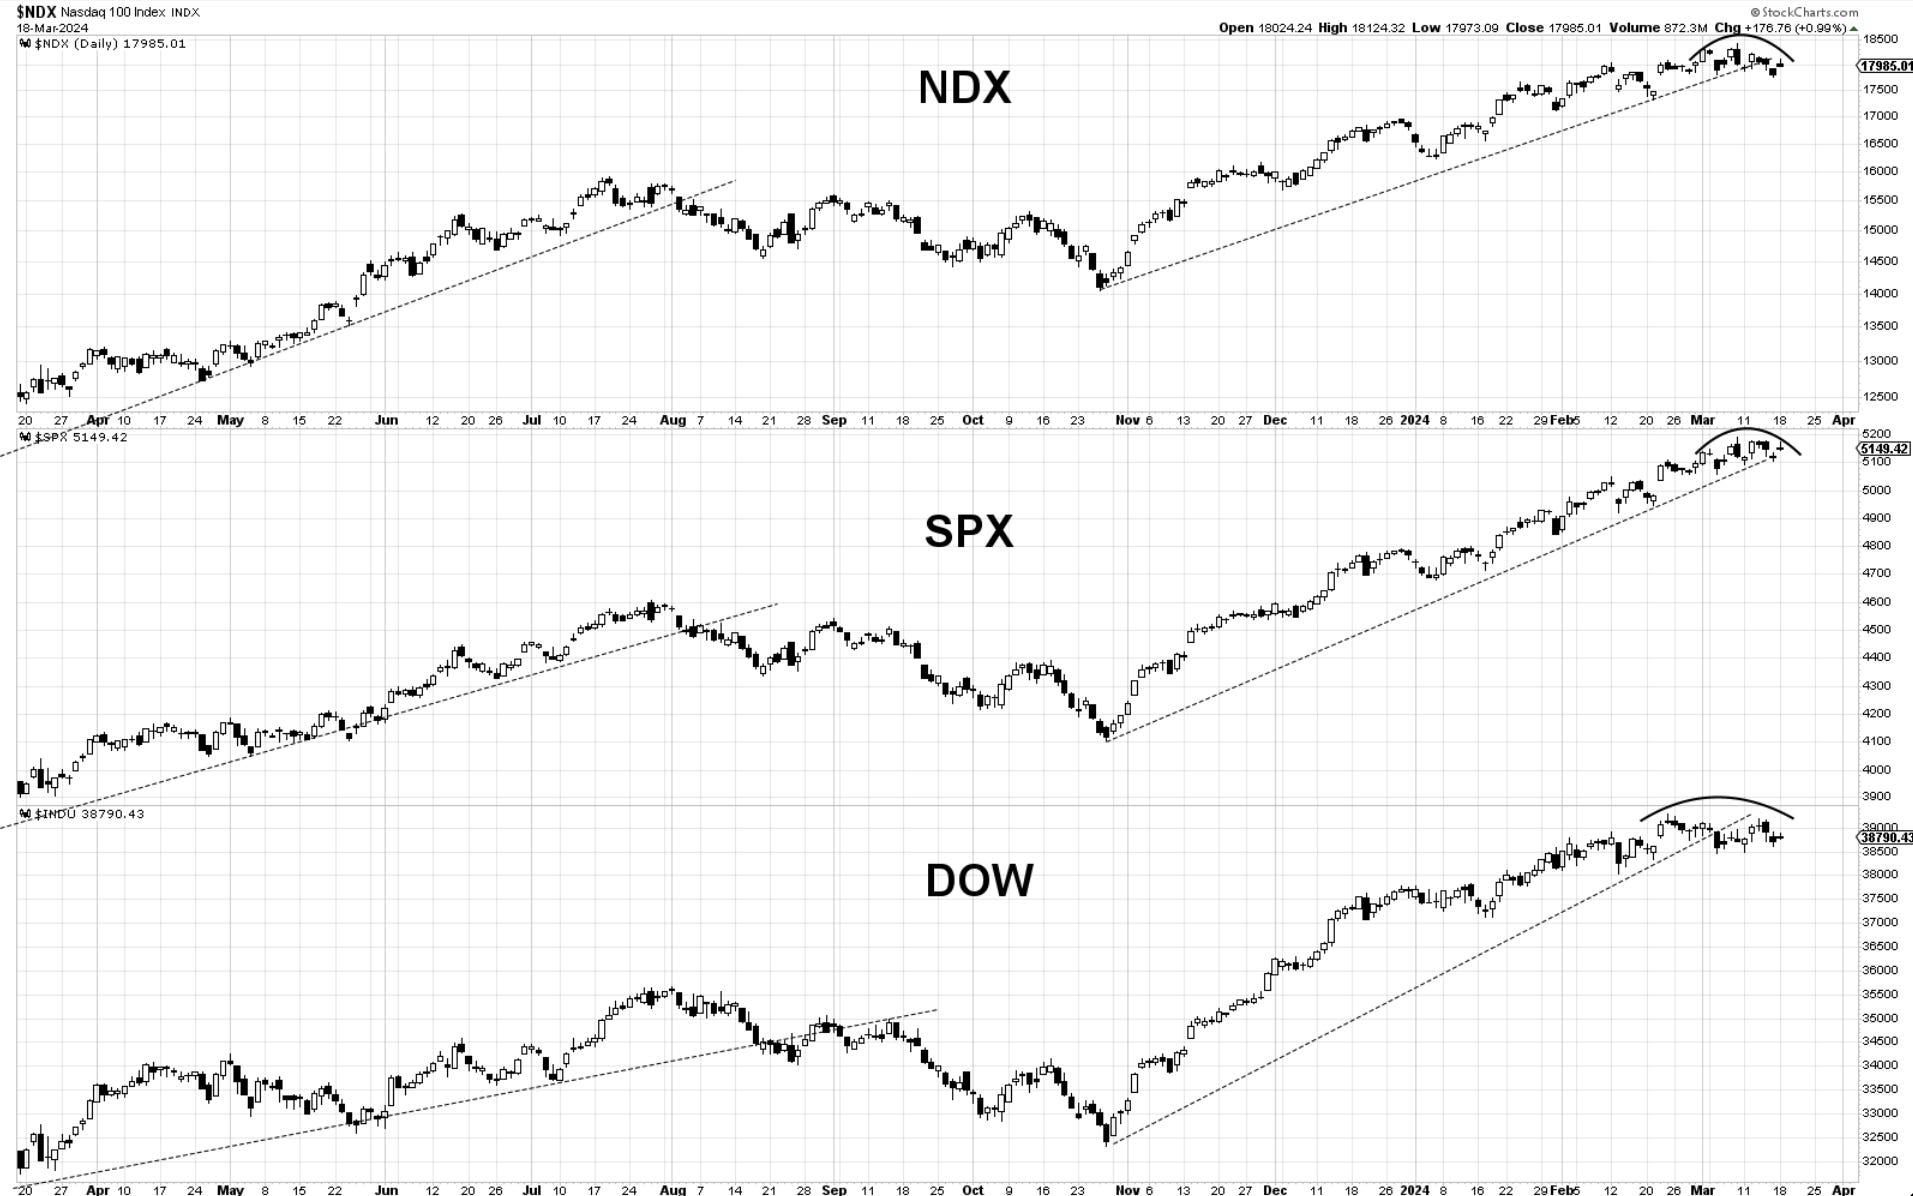
Chart of the Day - Combo NDX,SPX,DOW. Markets have been stalling since the start of the month. Trendlines are having trouble supporting the advance. It is not a bearish signal just yet, but something as simple as this can hint at changes in price behavior.
On the last Daily Drip of last week, I discussed how the sp500 struggled to get above 5180, how it was important for the bulls to regain control, and how we’re showing signs of cracks in the foundation. I have also mentioned how the current wave lacks the impulsiveness required for a 3rd wave. I talked about how anticipating moves can be a recipe for losses and how confirmations are sometimes worth the premium paid. Regarding Bitcoin, I suggested no blame in taking profits and said this:“A loss of 68,300 should take us to 64,900 where more bids are likely lined up. MACD is curling over a bit with a slight loss of momentum.”
In the video, I reviewed around 27 crypto coins and their weekly chart formations.
Today, markets started the week with a bang from the overnight futures but faded away as the day went on. We’re entering a period of weak seasonality for the rest of the month. It remains to be seen if the market conforms to it or ignores it, like in February.
In today’s video I will review daily charts and lay my general thoughts at the current juncture. I will also discuss an opportunity in a stock I wrote about earlier today and how can we use elliott wave to identify trade opportunities.
The note below will continue, as always, with coverage of core markets ….
A free trial will get you 7-day access!
