
The Daily Drip
Markets review, strategy and analysis
Note: The EW counts on the right edge are real-time, and they are prone to adjustments as price action develops. Elliott Wave has a fluid approach, is evidence-based, and requires constant monitoring of certain thresholds.
In the counts below, this (( )) = circle on chart
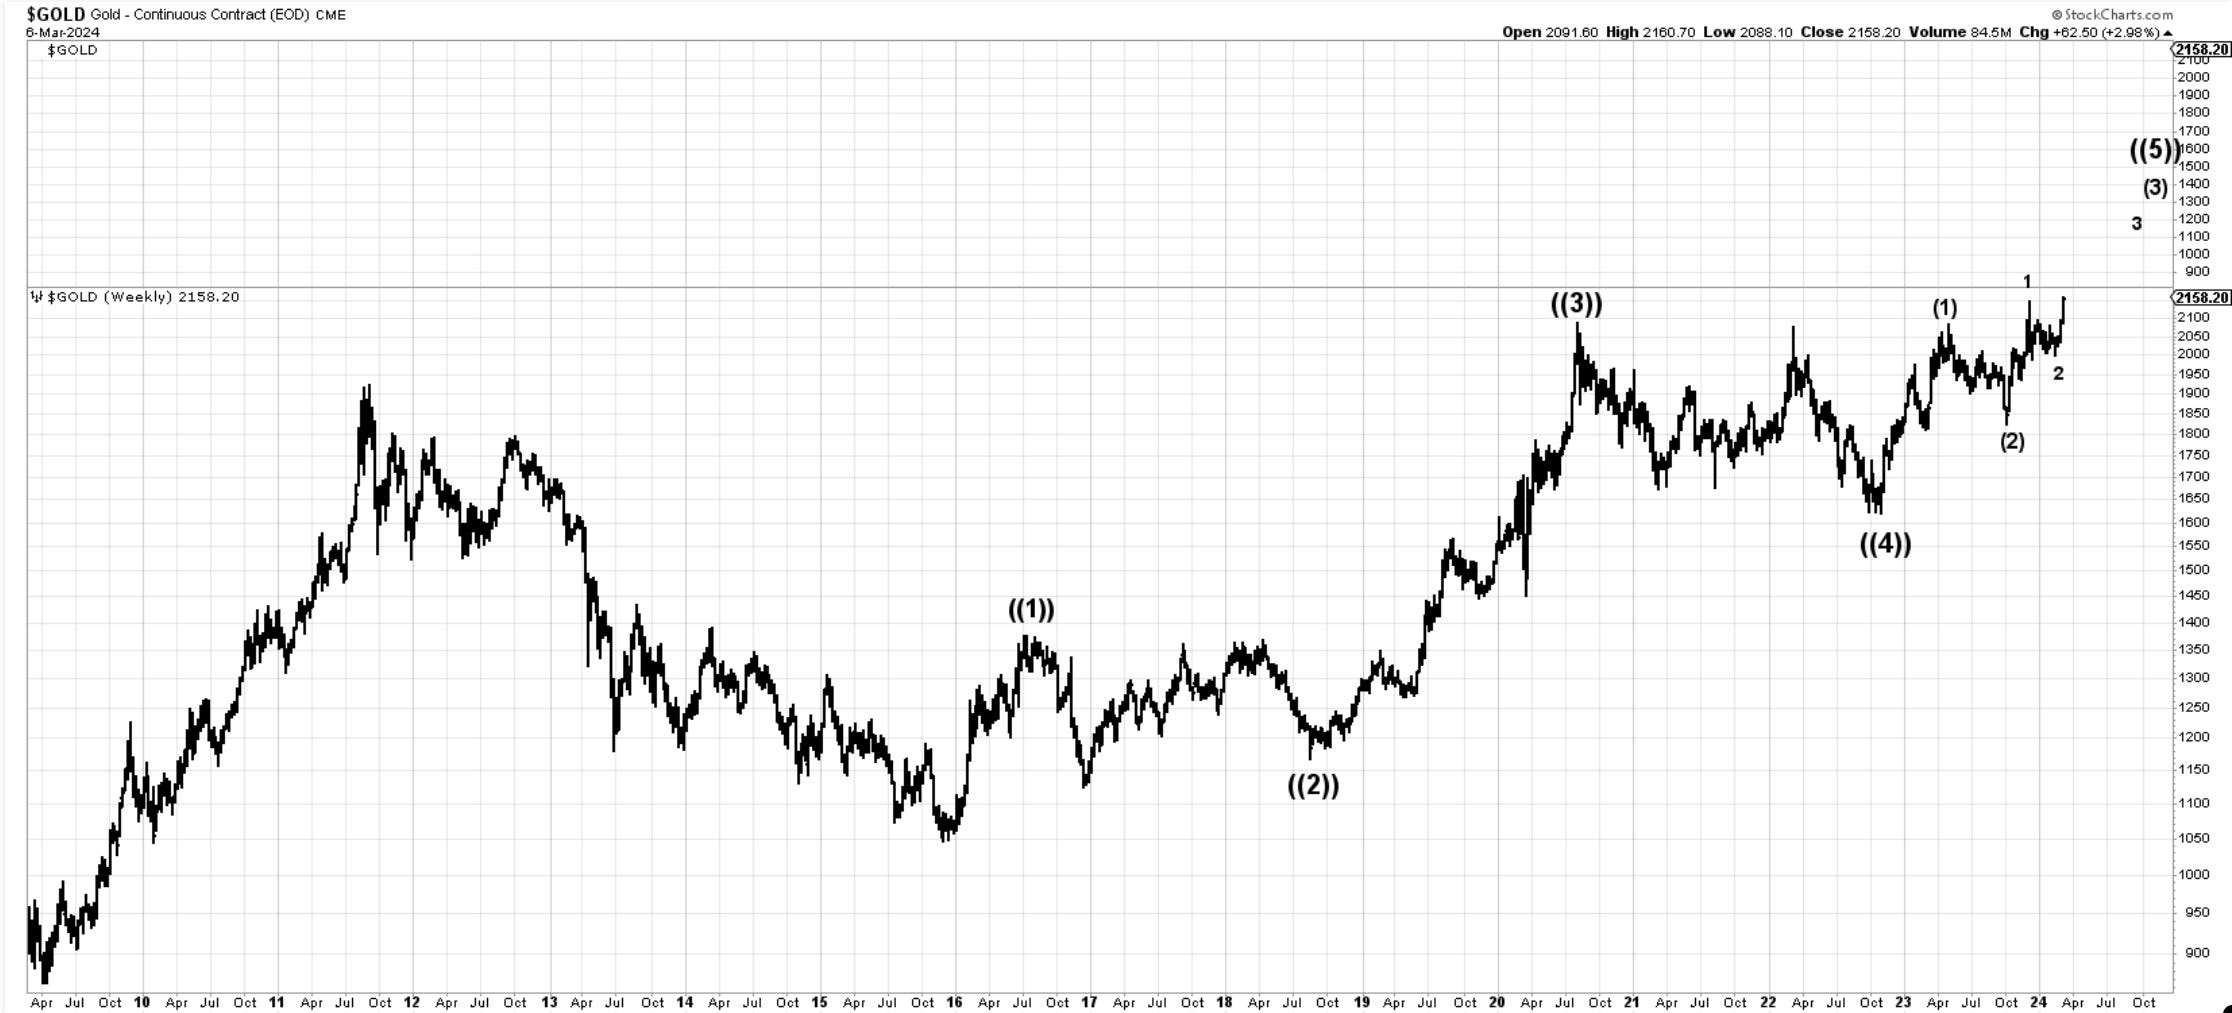
Chart of the Day GOLD - It’s been roughly three years since gold’s range started. The market is attempting to break out into the next higher sequence. We start with a 1,2 and go from there.
In yesterday’s note, we discussed dip buyers having the proper levels to step in and support the market. We also talked about two different market characters from Nov-Dec and then Jan- March. The first one is quite sharp and no overlaps, followed by smaller moves, choppy, overlapping but trending higher. We know impulsive moves are usually clean.
We discussed large caps, bar patterns, and the technical reviews of core markets. From a chart structure perspective, we closed with BTC wave counts and what caused the 10k selloff.
In the chart below, we see SPY, DIA, ONEQ, and IWM and their distance relative to the 200-day MA. I show this chart to make the point that we rarely have markets that drive themselves past these percentages. Either markets consolidate and wait for the moving average to catch up, or they sell off only to restart again. I will present some charts in today’s note to show historical tendencies.
Let’s take a look at the charts below and review SPX, NDX, IWM, DOW, DXY, GOLD, BTC
Daily video following as well…
