
The Daily Drip
Core markets charts updates and commentary
Note: The counts on the right edge are real-time, and they are prone to adjustments as price action develops. Elliott Wave has a fluid approach, is evidence-based, and requires constant monitoring of certain thresholds.
In the counts below, this (( )) = circle on chart
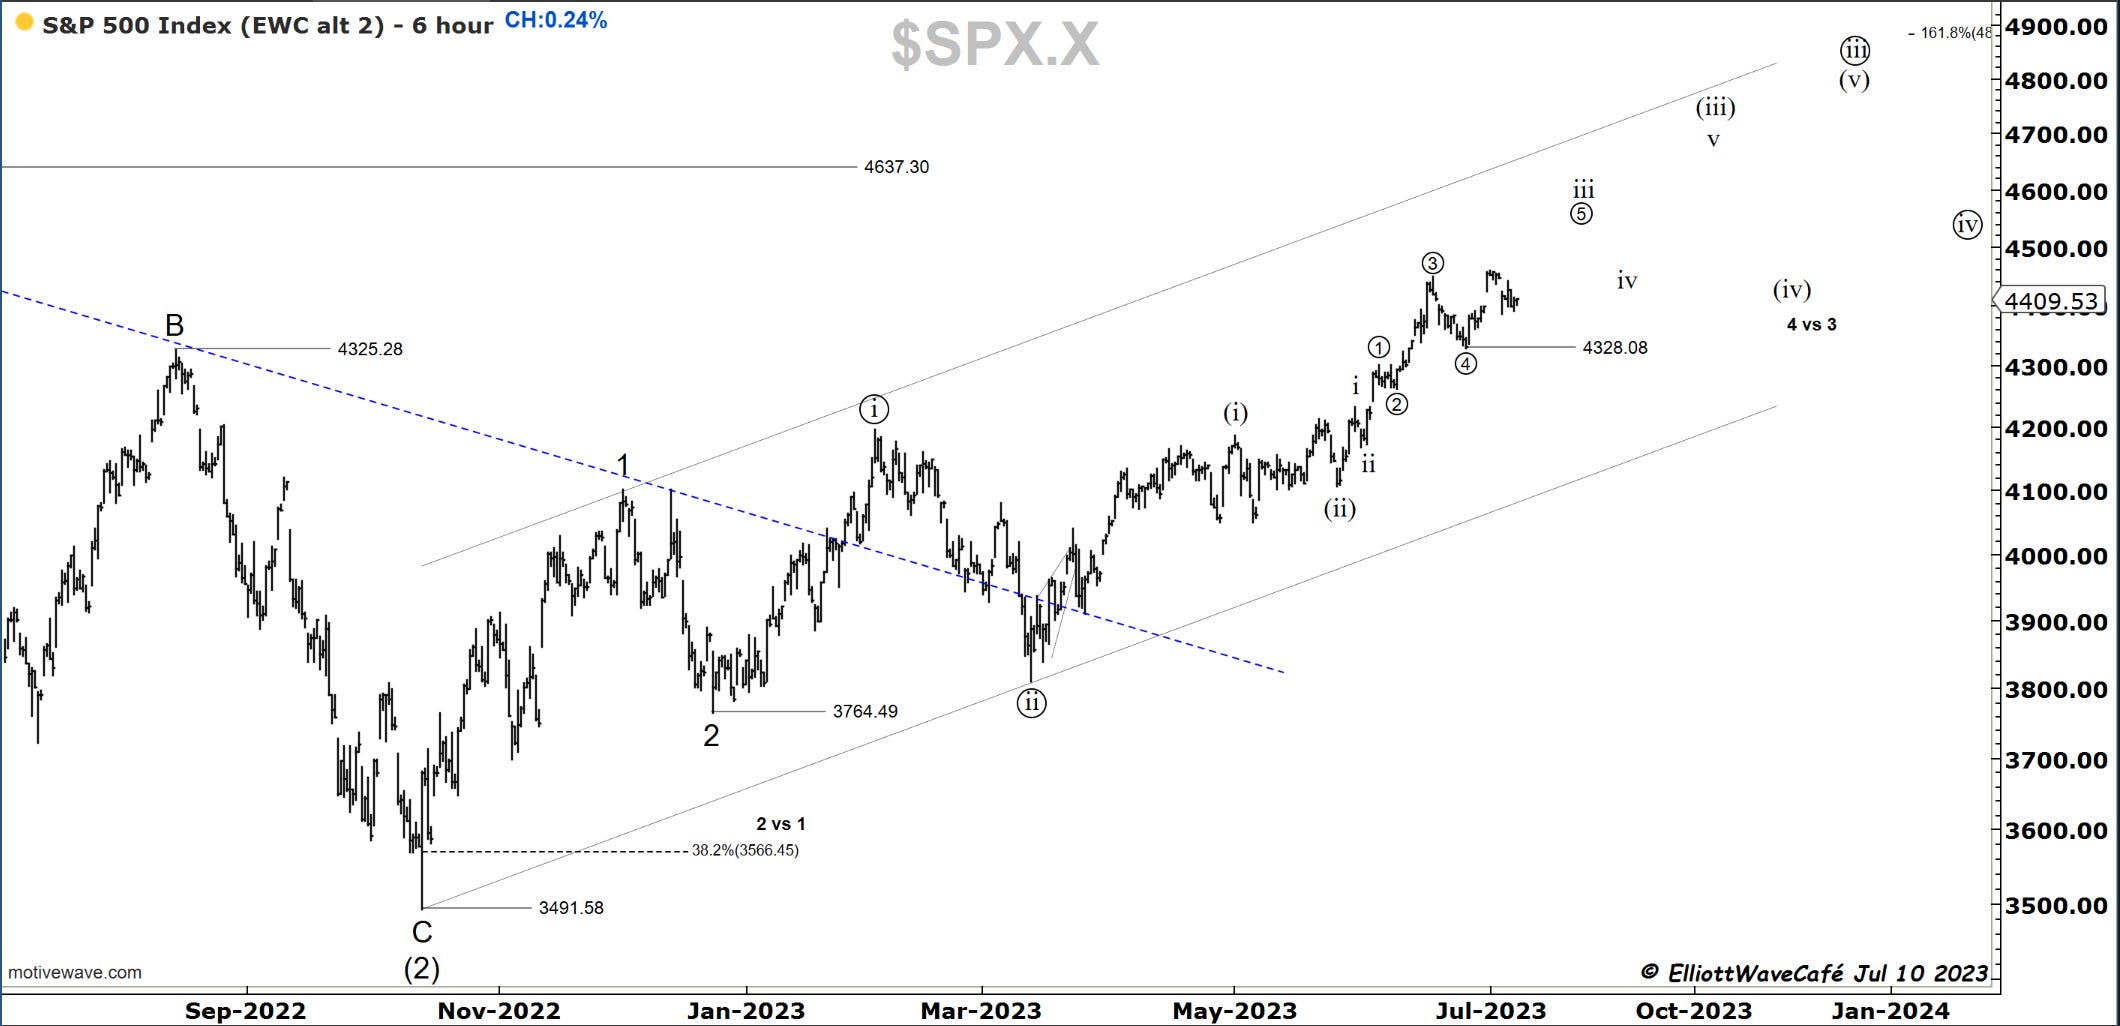
SP500
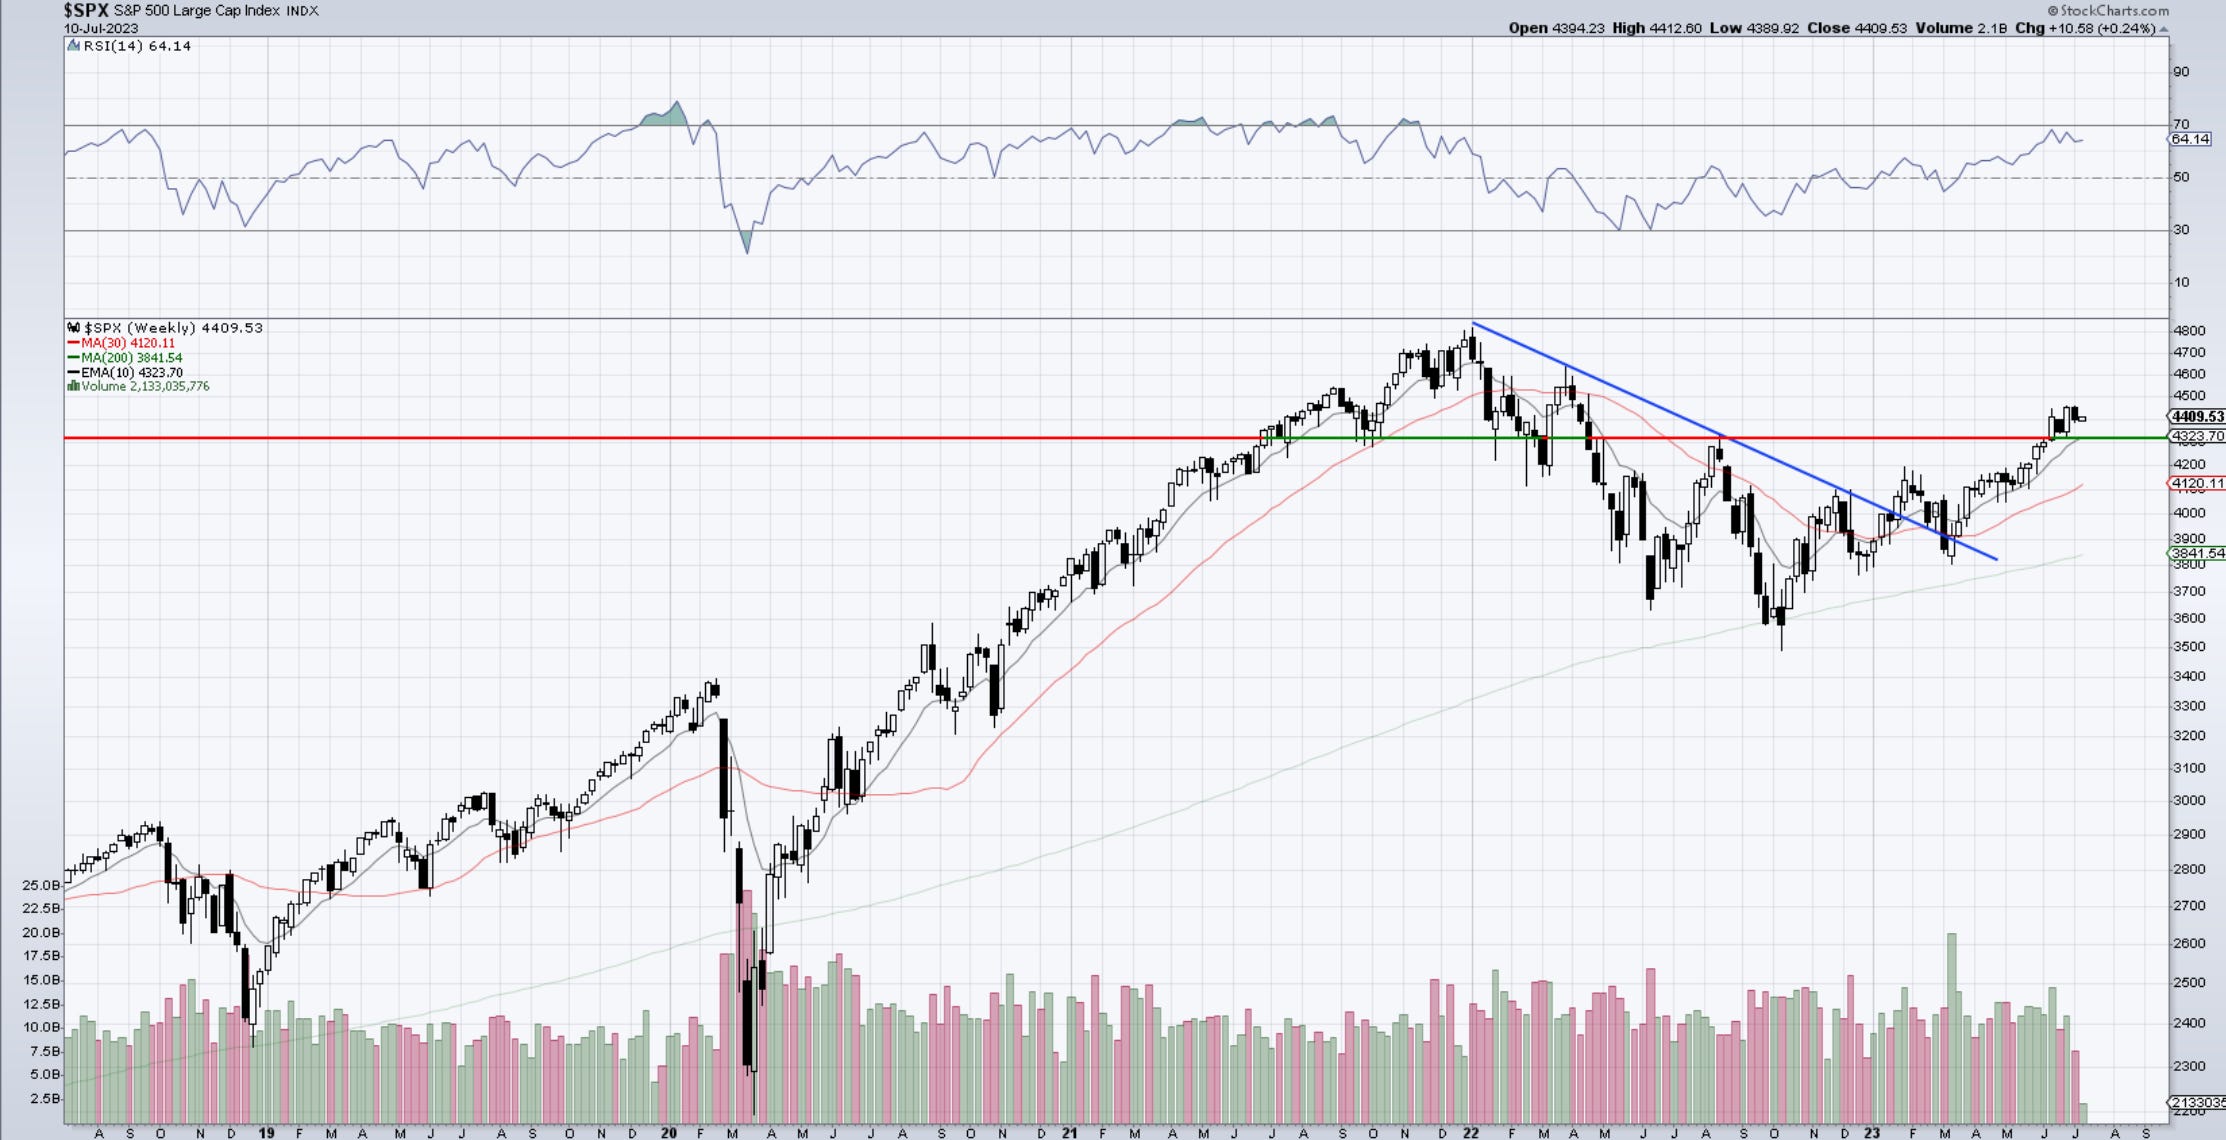
The index was slightly positive today and we continue to search for higher prices in an ongoing 3rd wave. The smaller degree waves could vary but the larger sequence remains uninterrupted. Weekly remains above the key 4320 zone with rising averages and trending RSI. 4328 is the nearby support that should not get violated.
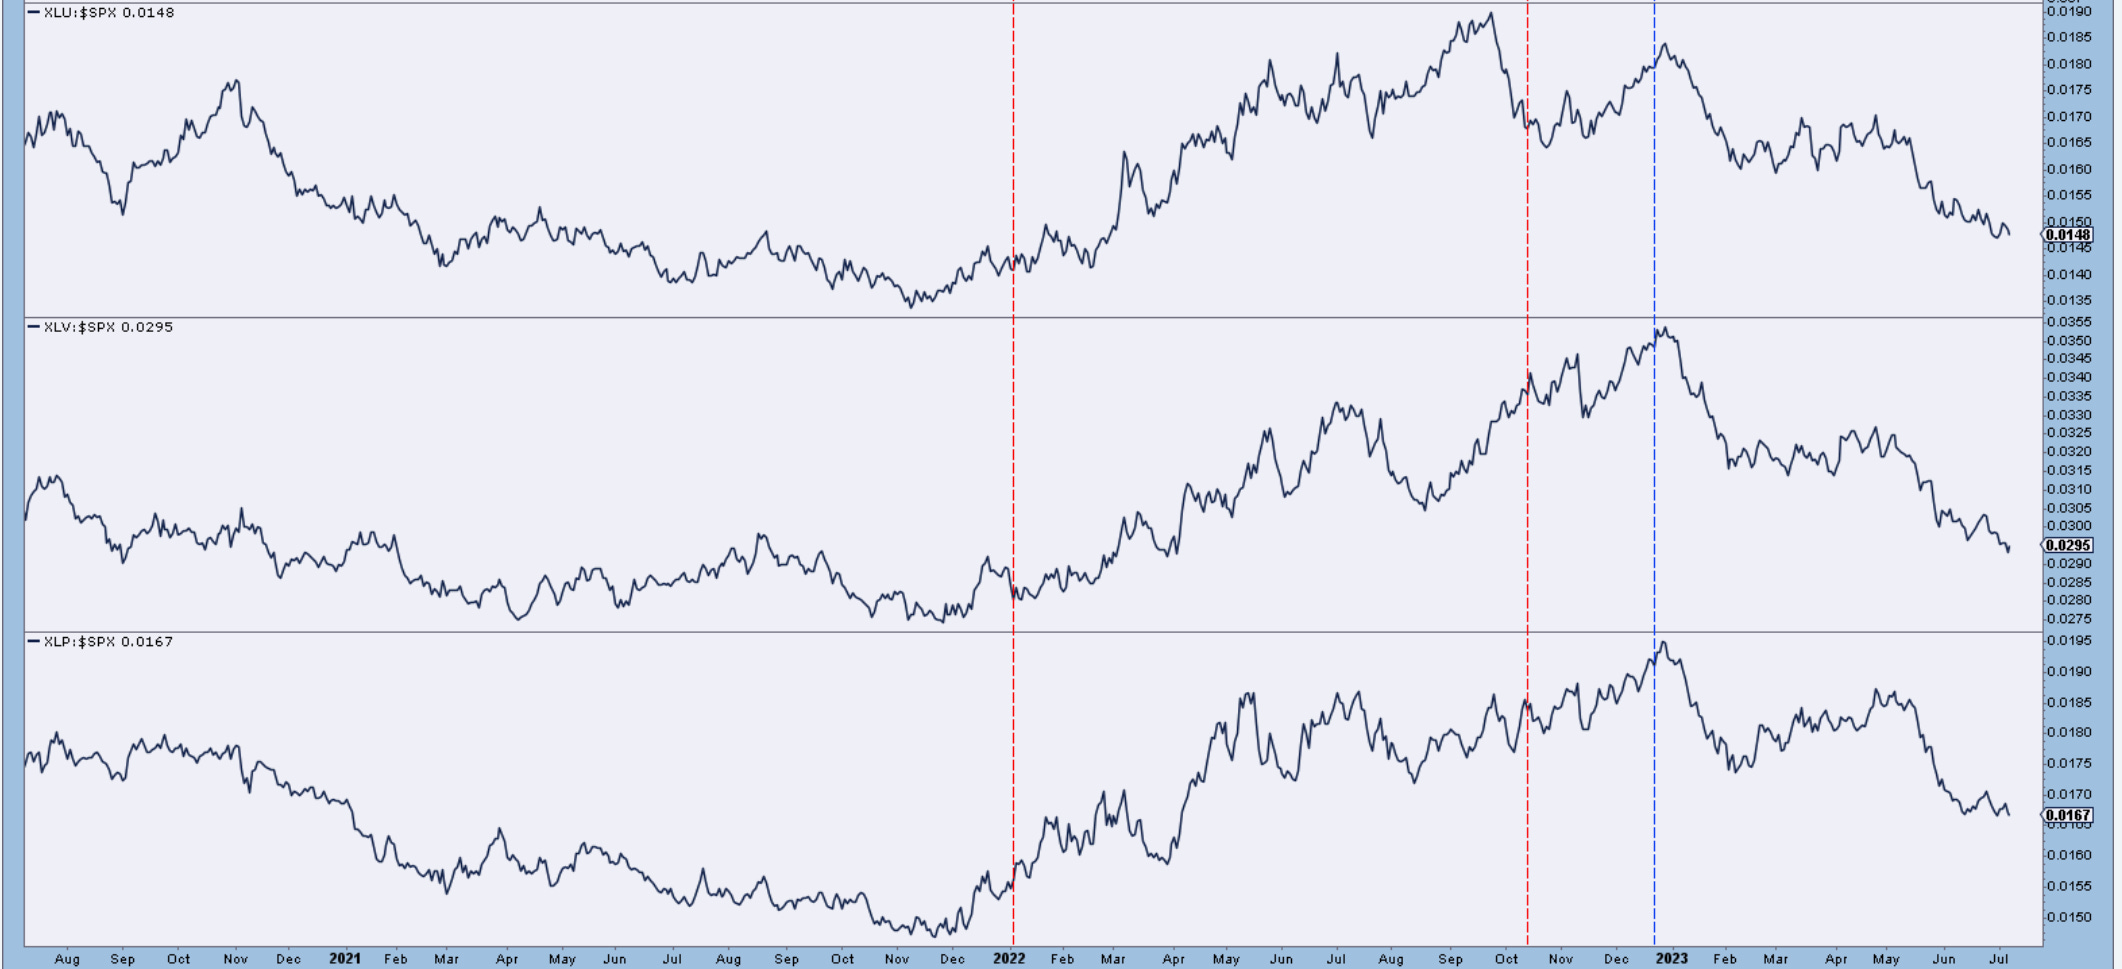
Three defensive sectors from the SP500 remain in relative downtrends, a further indication of Wall Street’s appetite for risk instead of safety.
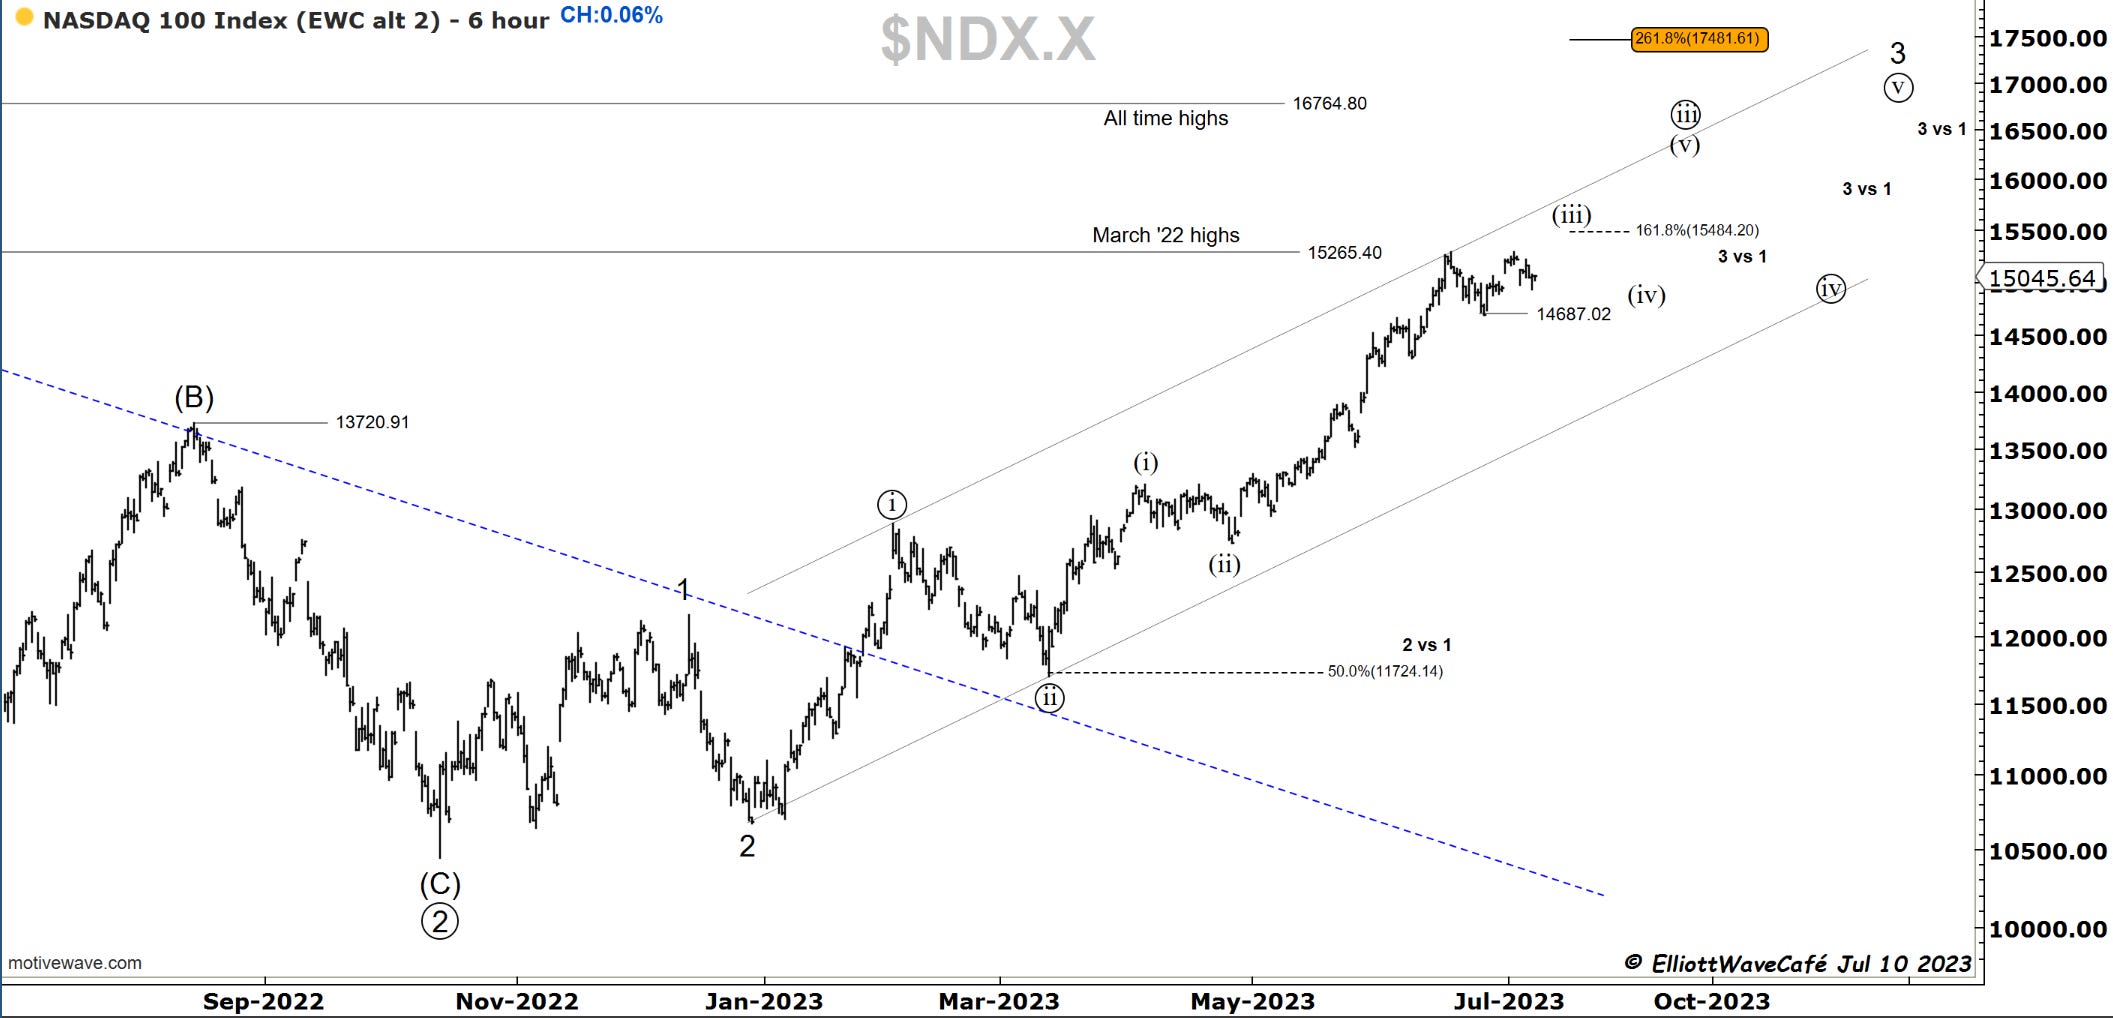
Nasdaq100
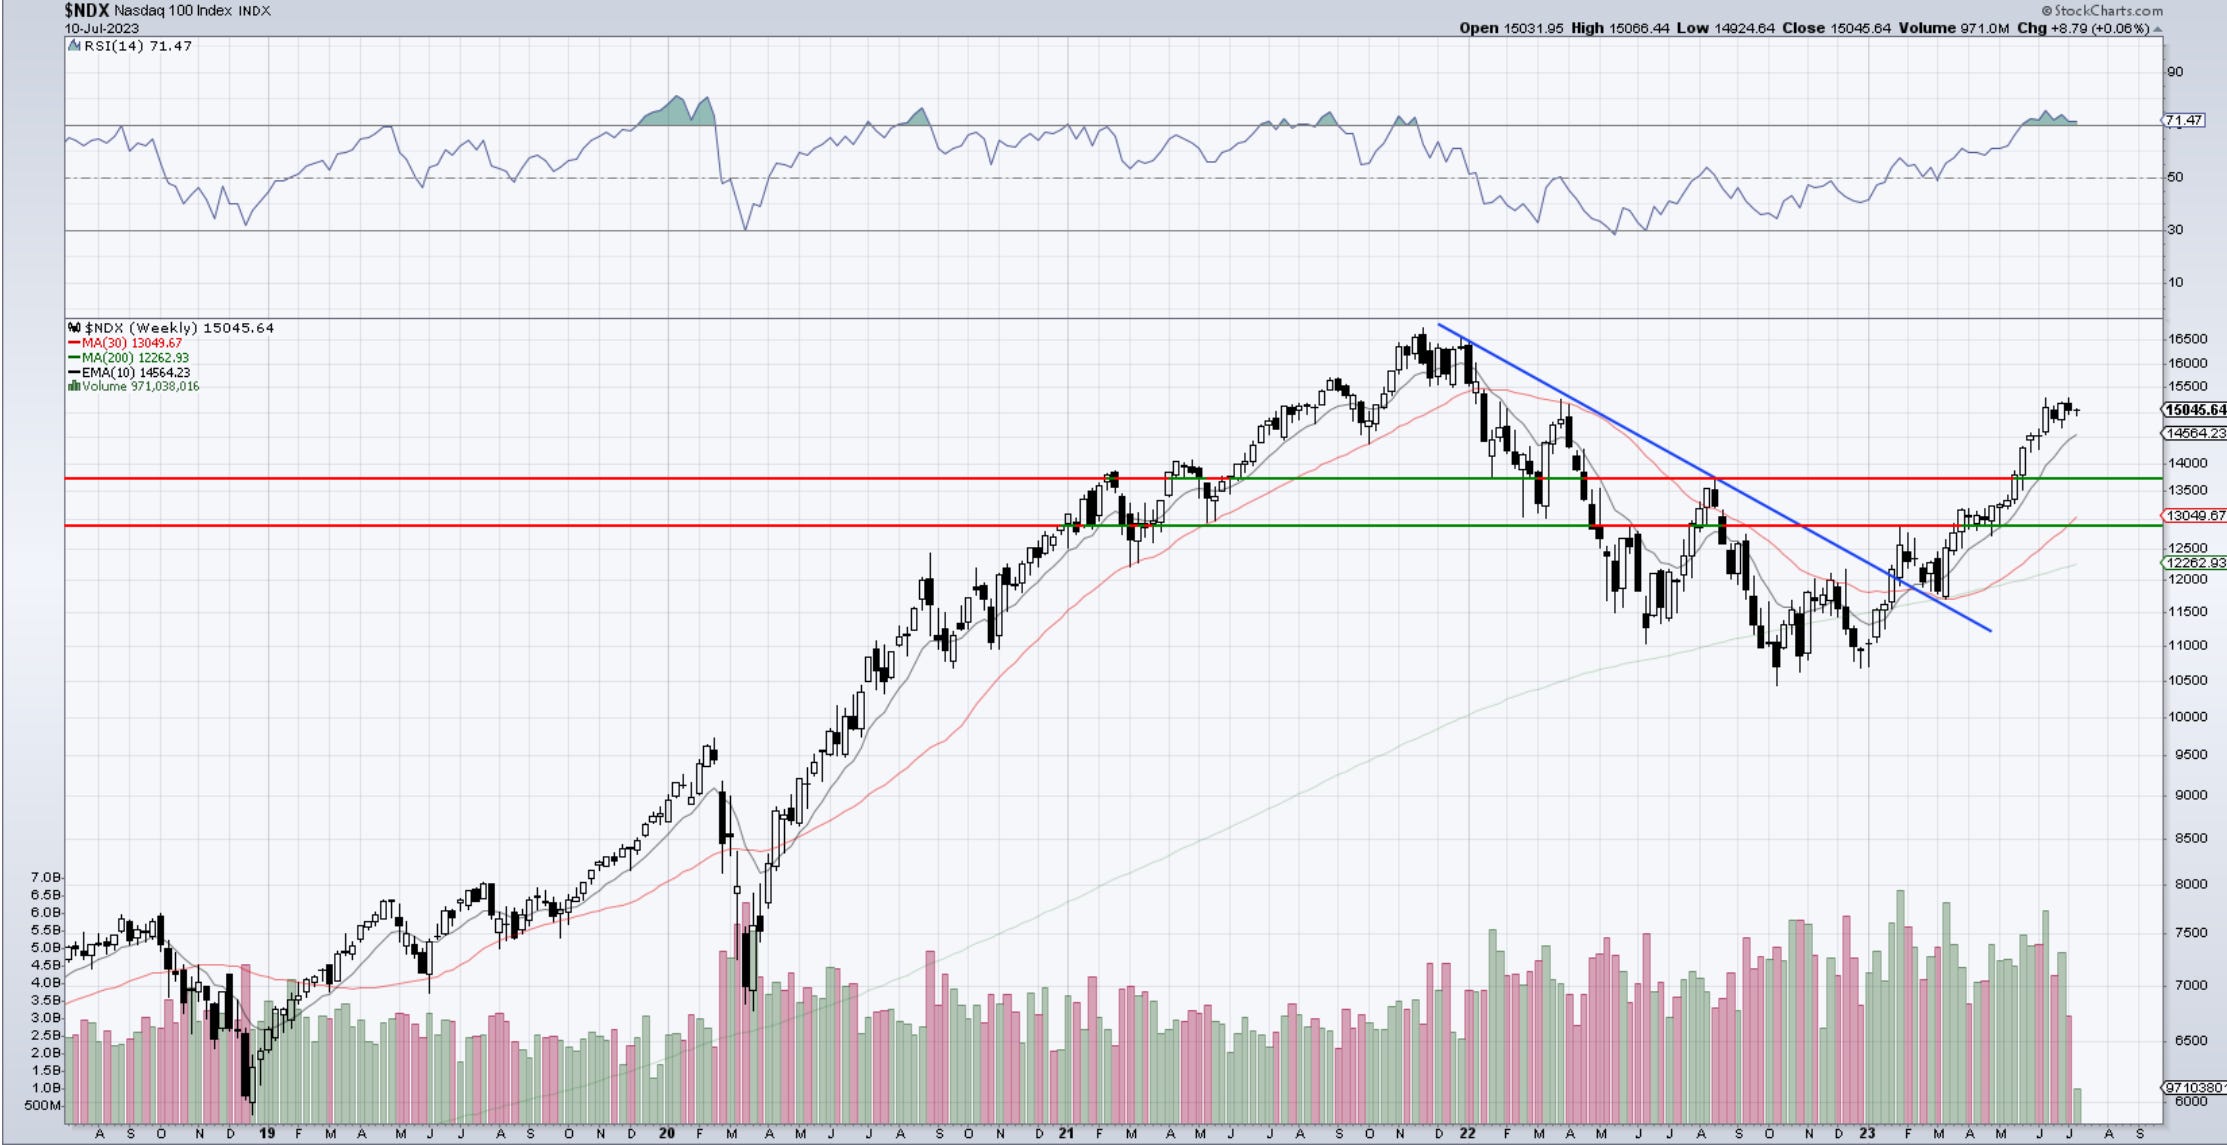
It seems that Nasdaq was weaker the last few days but the chart is not really showing it. We remain under the March ‘22 high, but if we overtake those, new ATH are just a matter of time. The count shows further upside but maybe at a slower pace. This is the best 1/2 year performance in the history of this index and the chart shows it.
EWCafe turned bullish in January 23rd right around the time the indexes were breaking the down trendline in blue. When a bear market downtrend gets violated we need to listen. Bearish sentiment always keeps you scared, but it’s the way it works, otherwise, the market would not function. It feels good to be bullish right now, but I always check myself. Again this is a pitfall of being in the market, as we get scared out of trends too soon.
Dow30
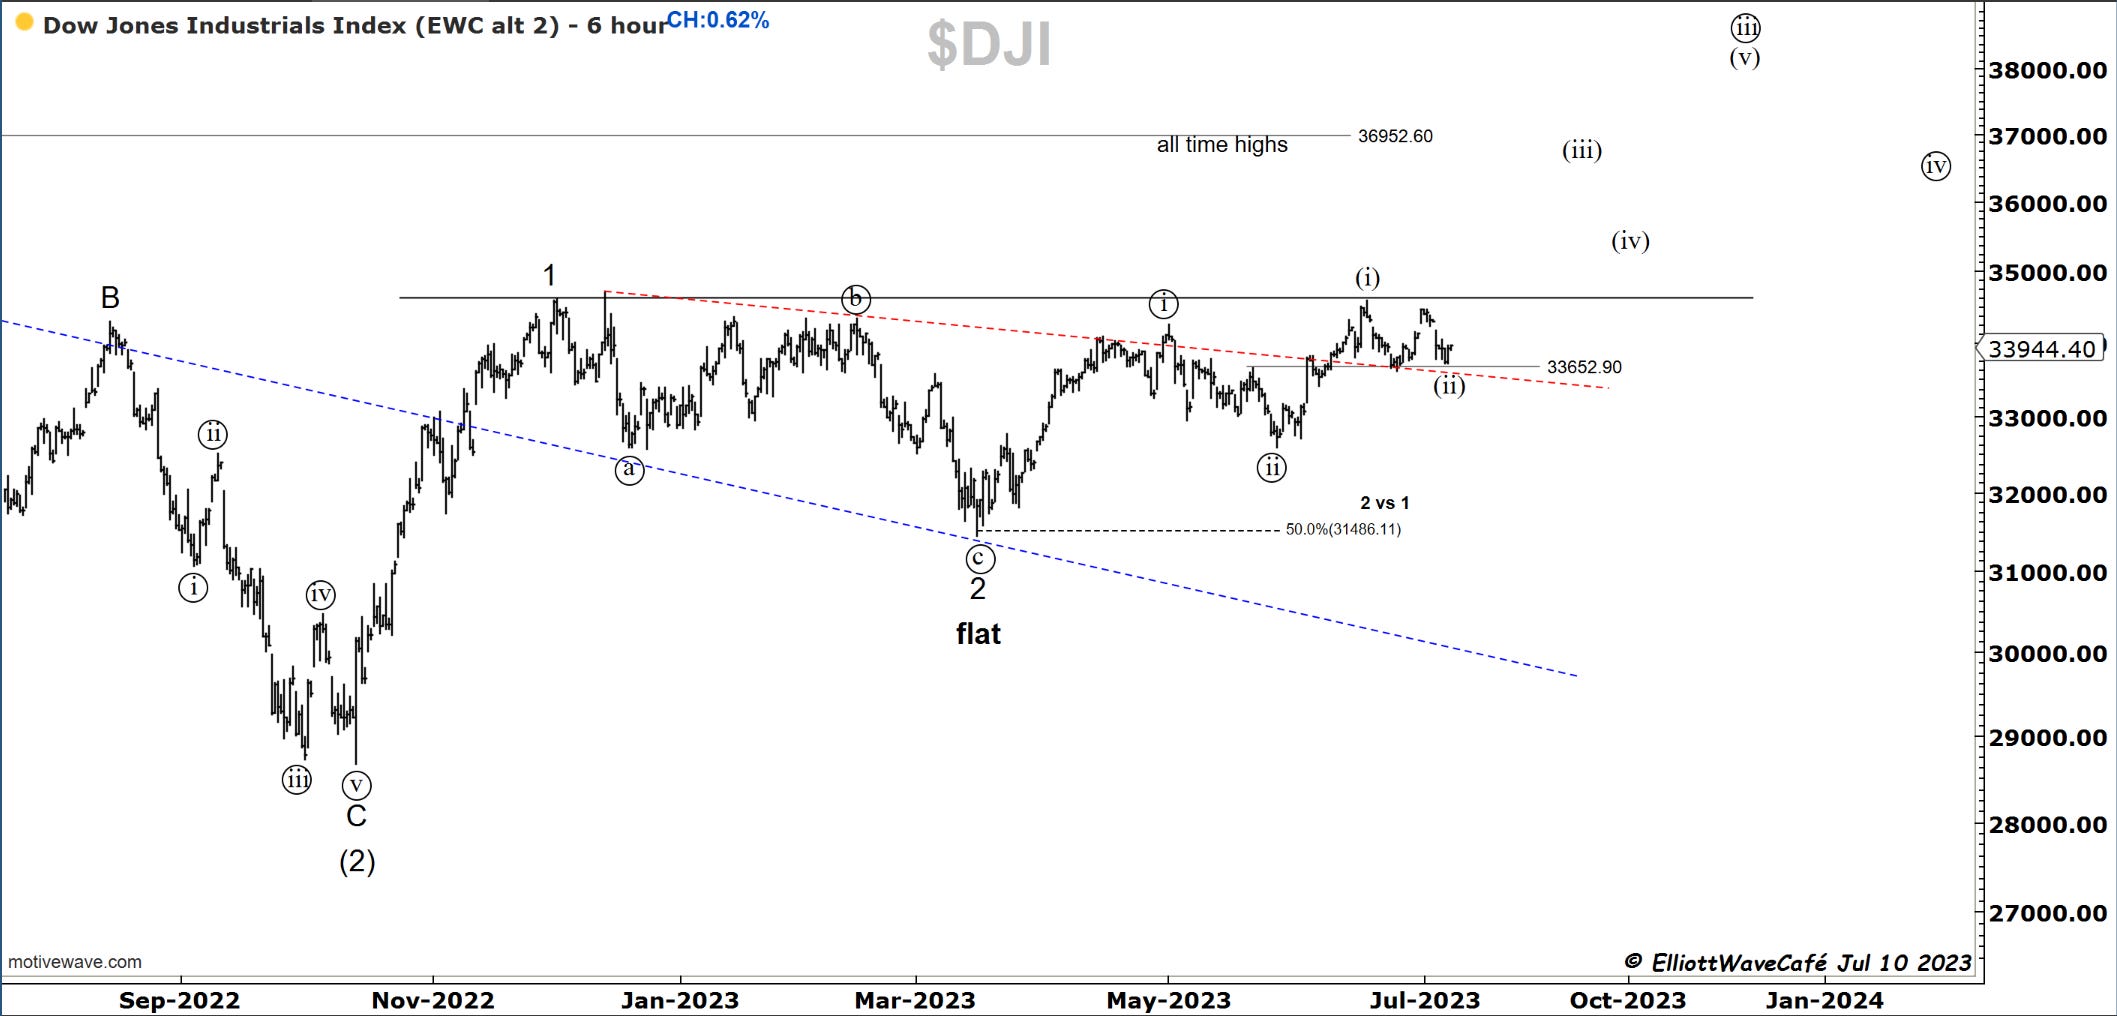
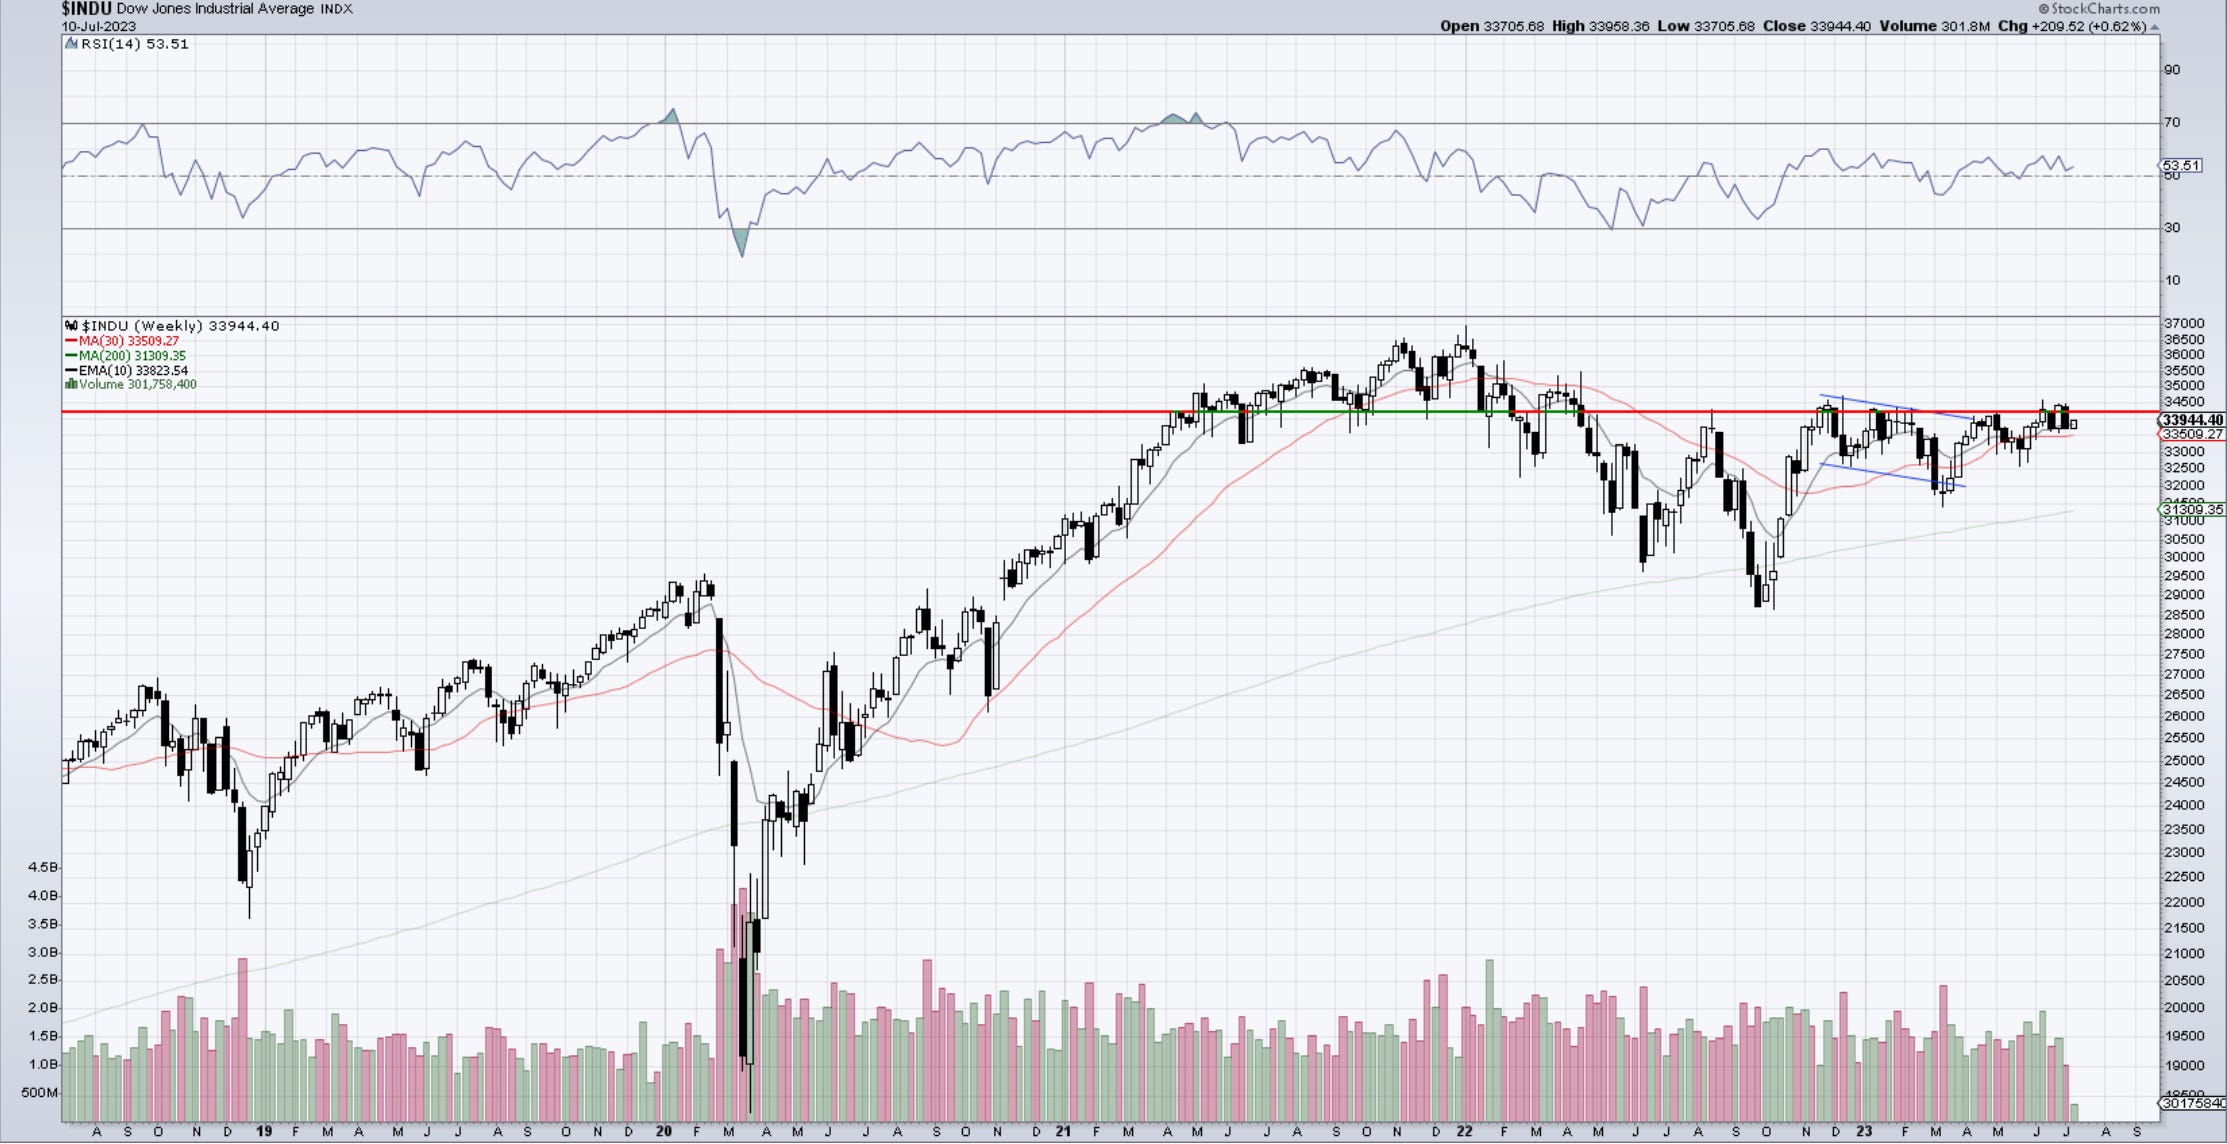
The story of the sideways Dow continues. The 1,2 1,2 is looking even more appealing. If we break 34500 the race is on. I like this wave (ii) as a nice 3-wave flat or zigzag. The blue line is the large trendline we broke above in November and retested it in March. Clean 3-wave setback. After that another couple of impulses with corrective waves after. A failure to rally after such a nice setup would be a disappointment. I think we will get the breakout.
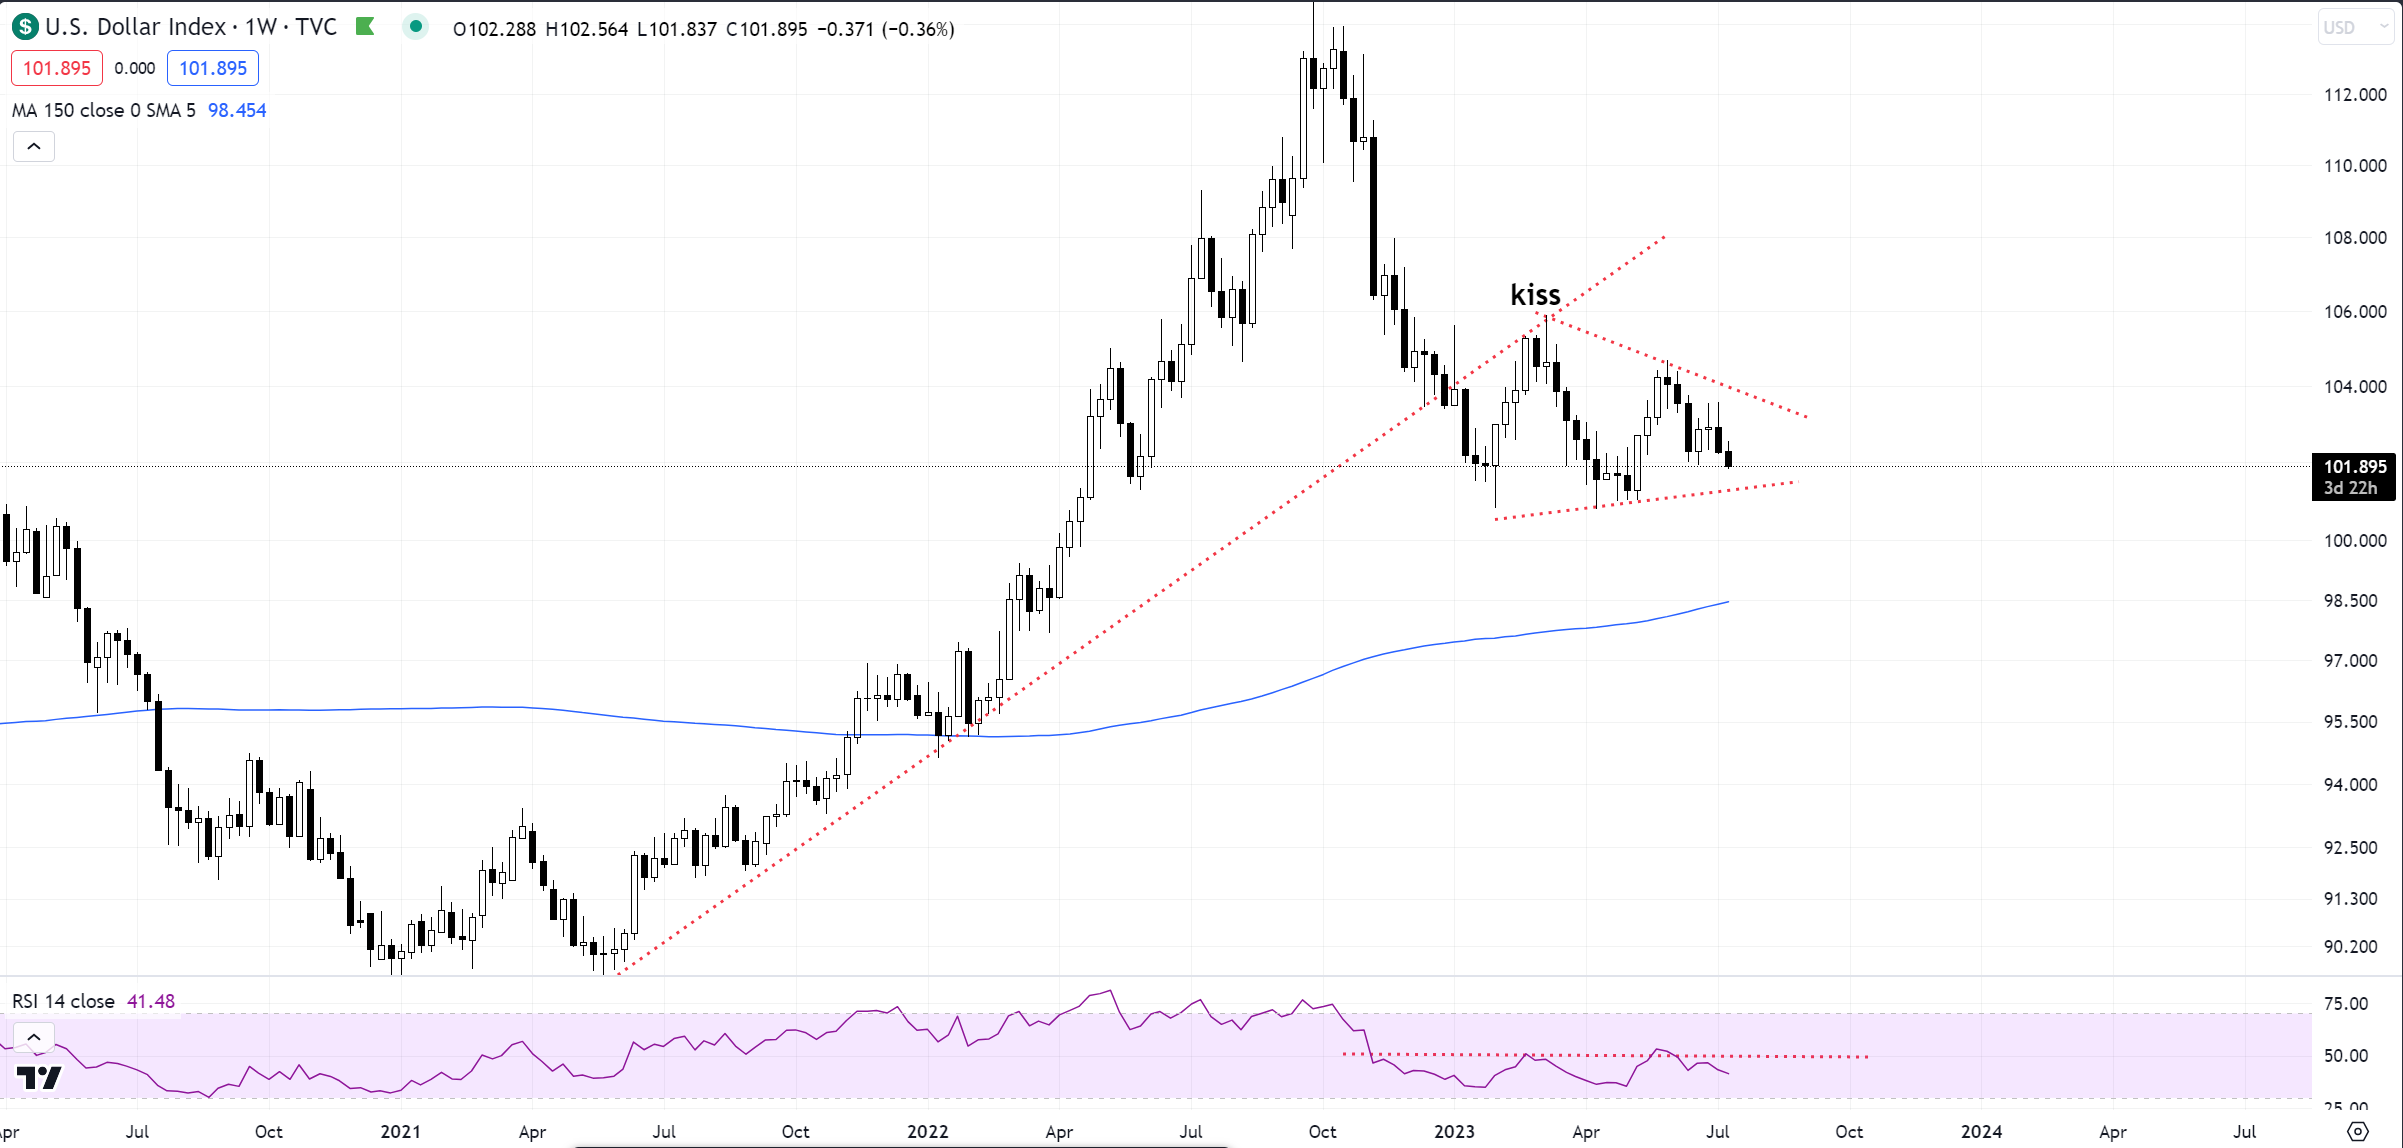
US Dollar
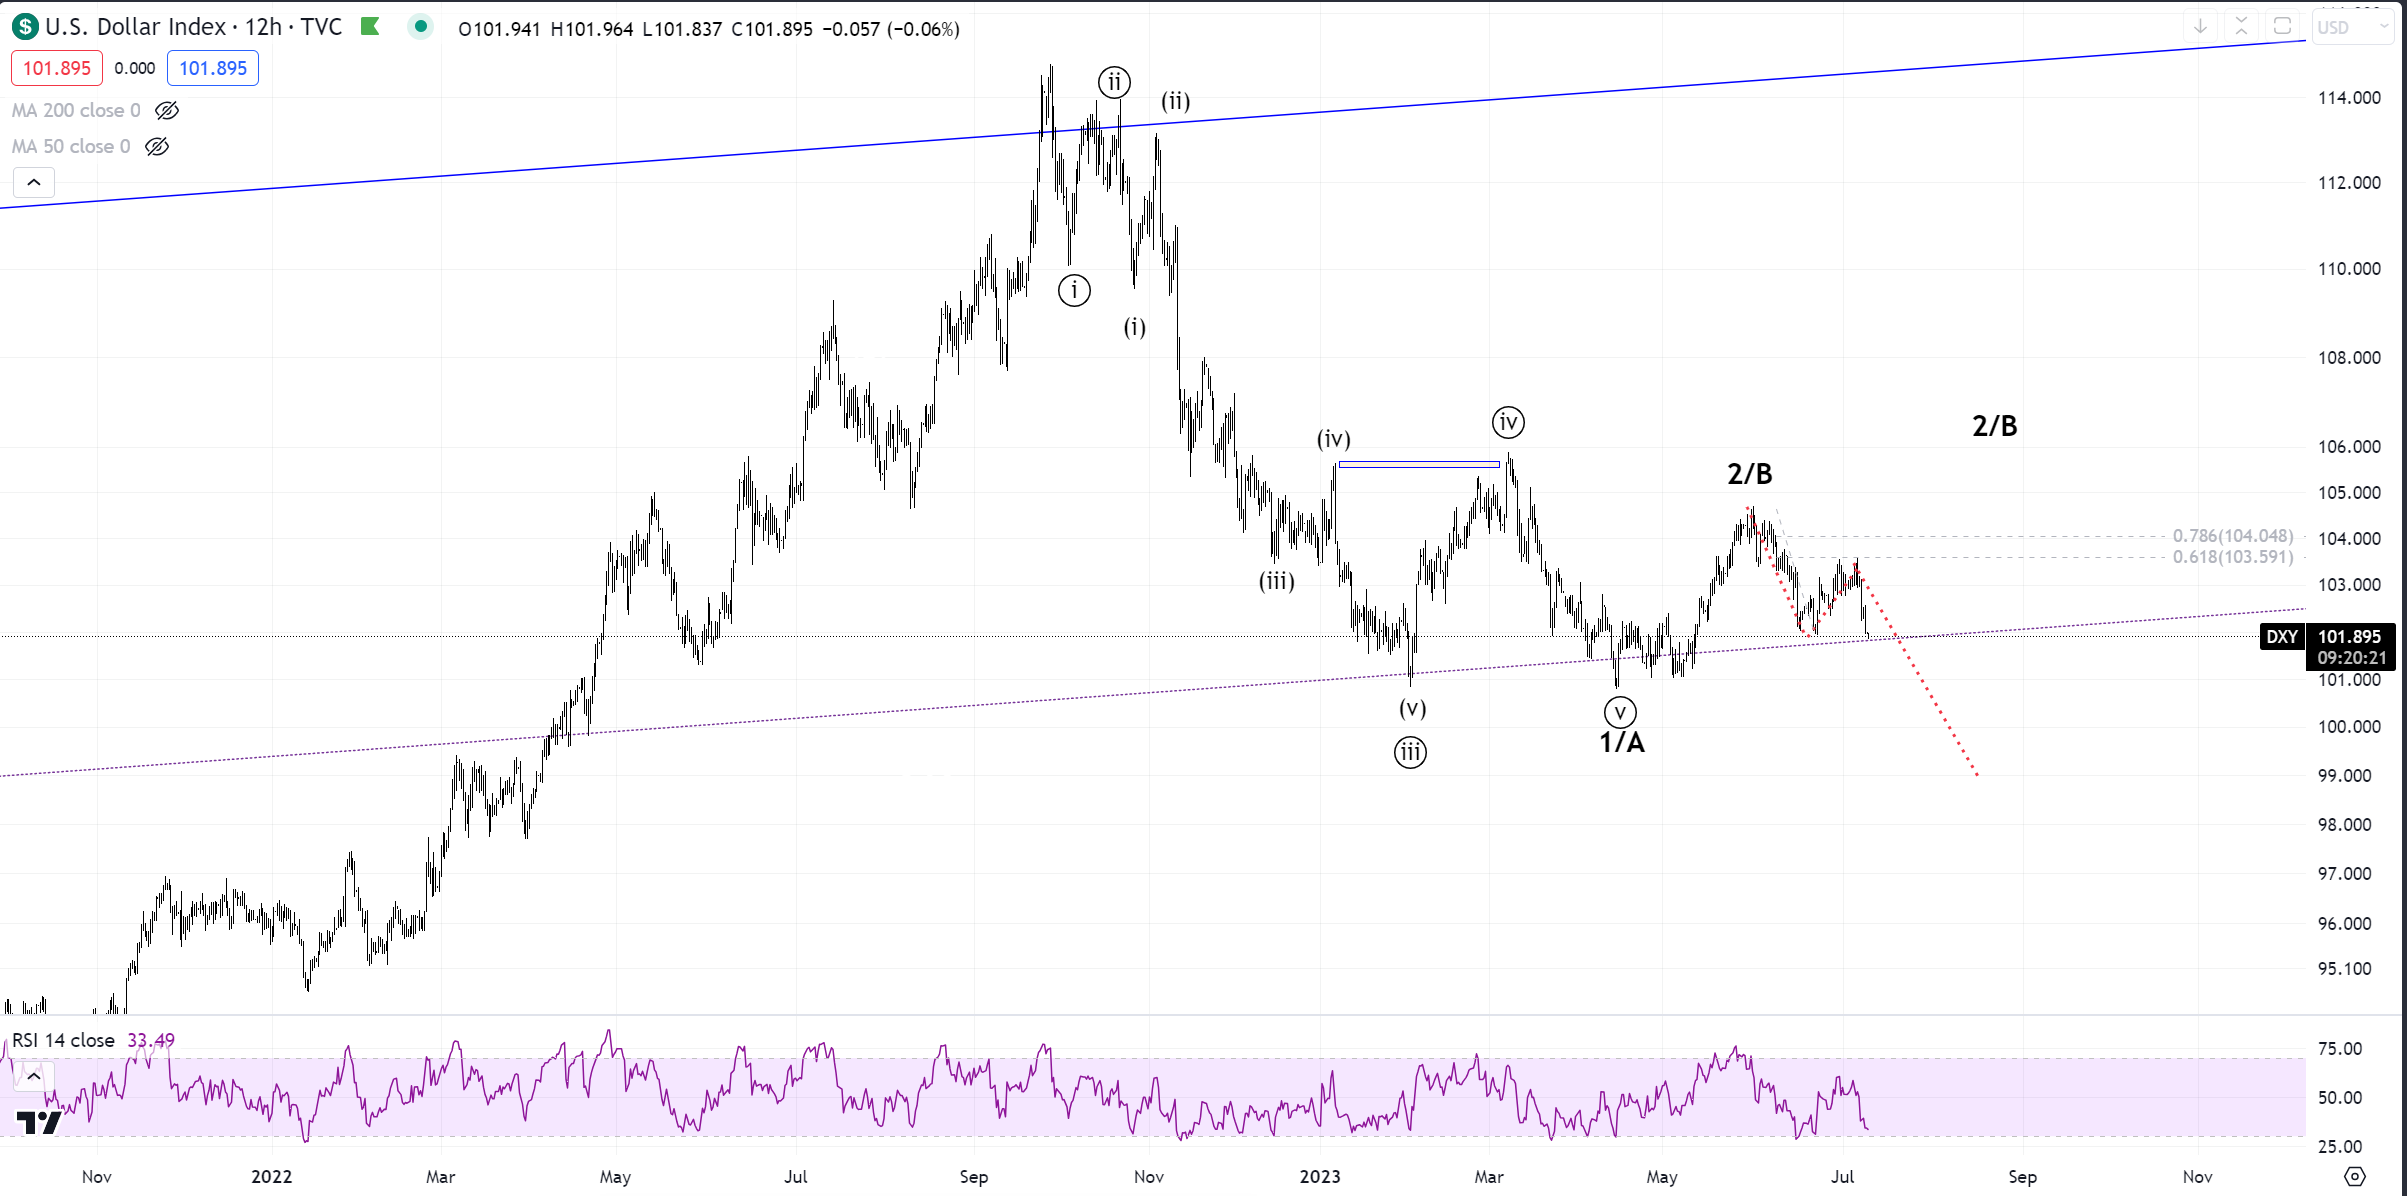
Finally, we got some good reactions from the 61.8% . We have yet to violate the April- May lows, but once we do, things can really accelerate for the dollar. Until those get taken out we still run the risks of a triangle at two different degrees. I have discussed this in today’s video.
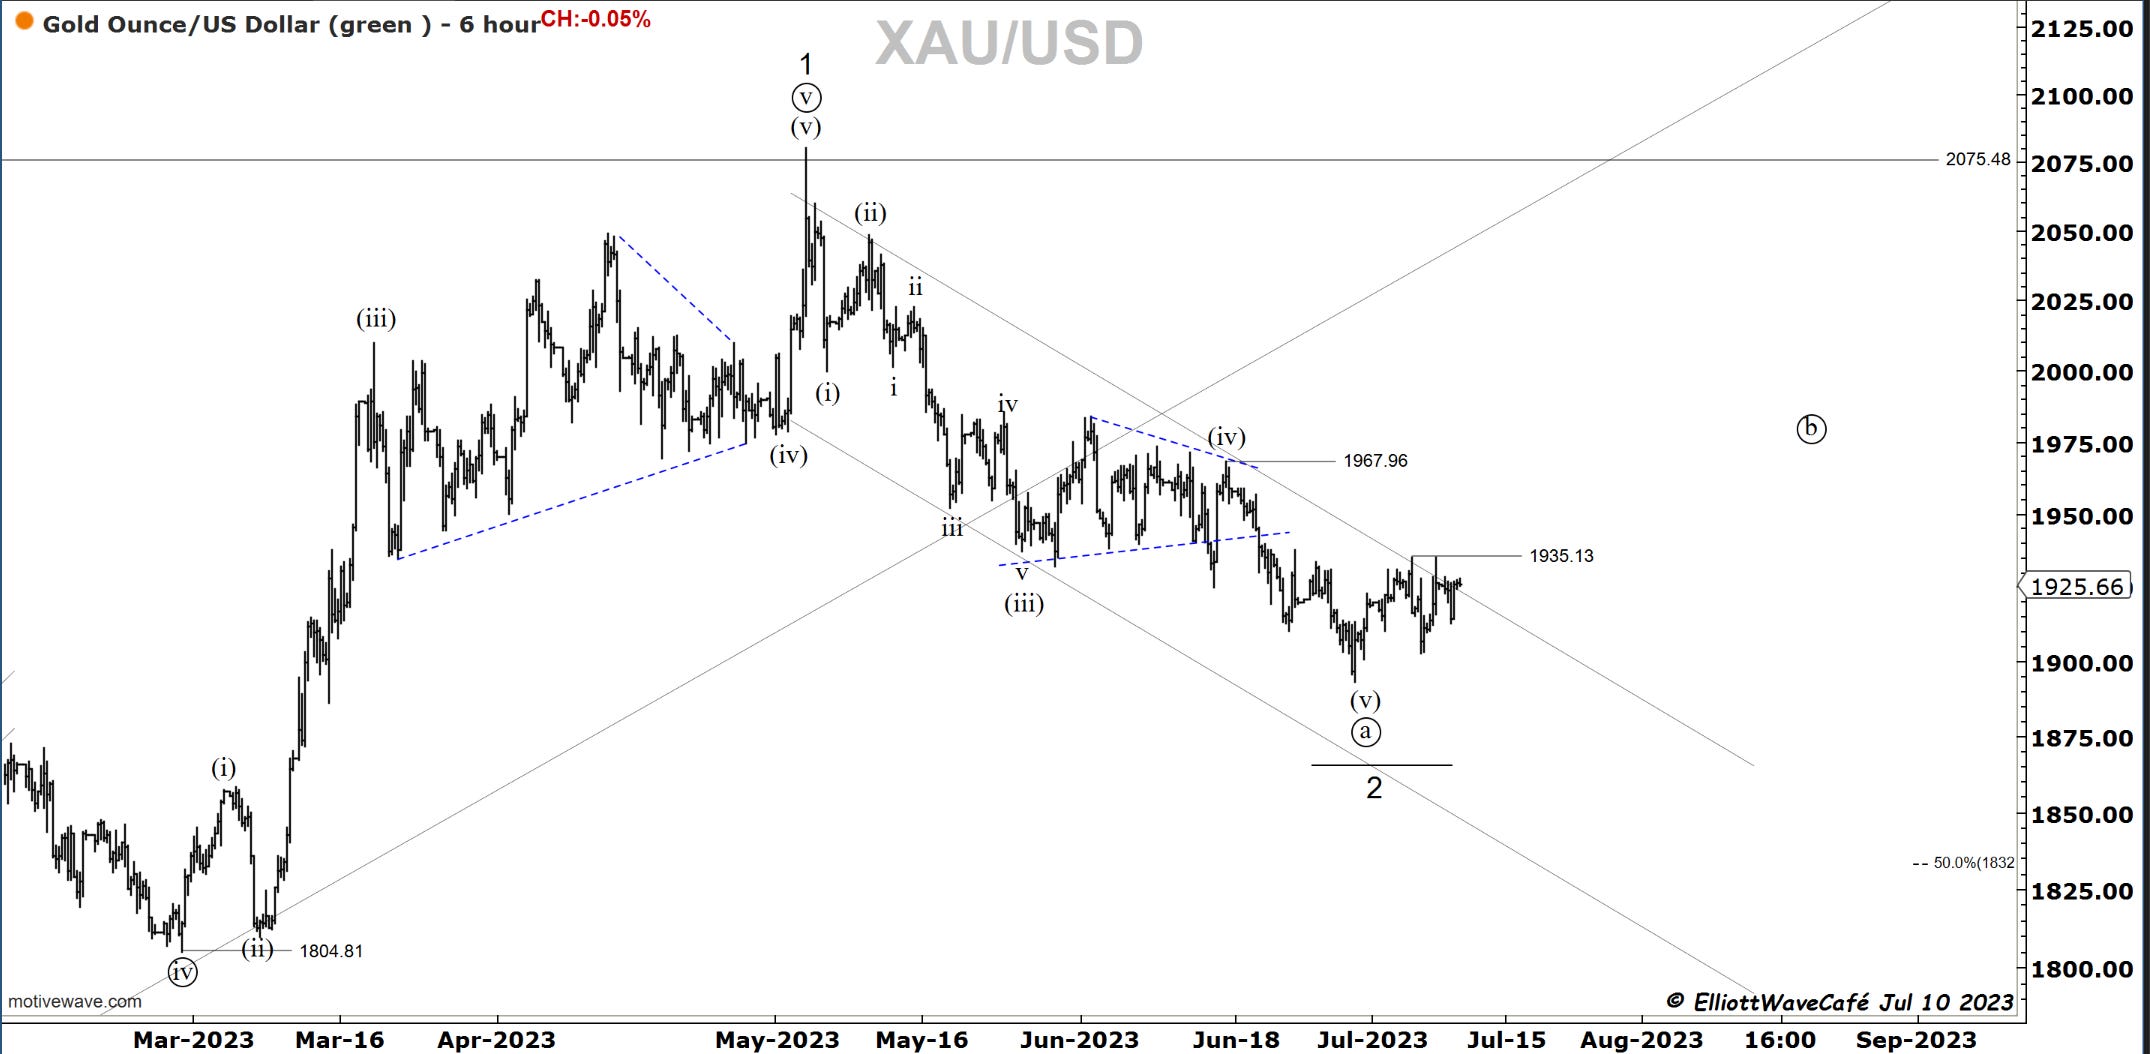
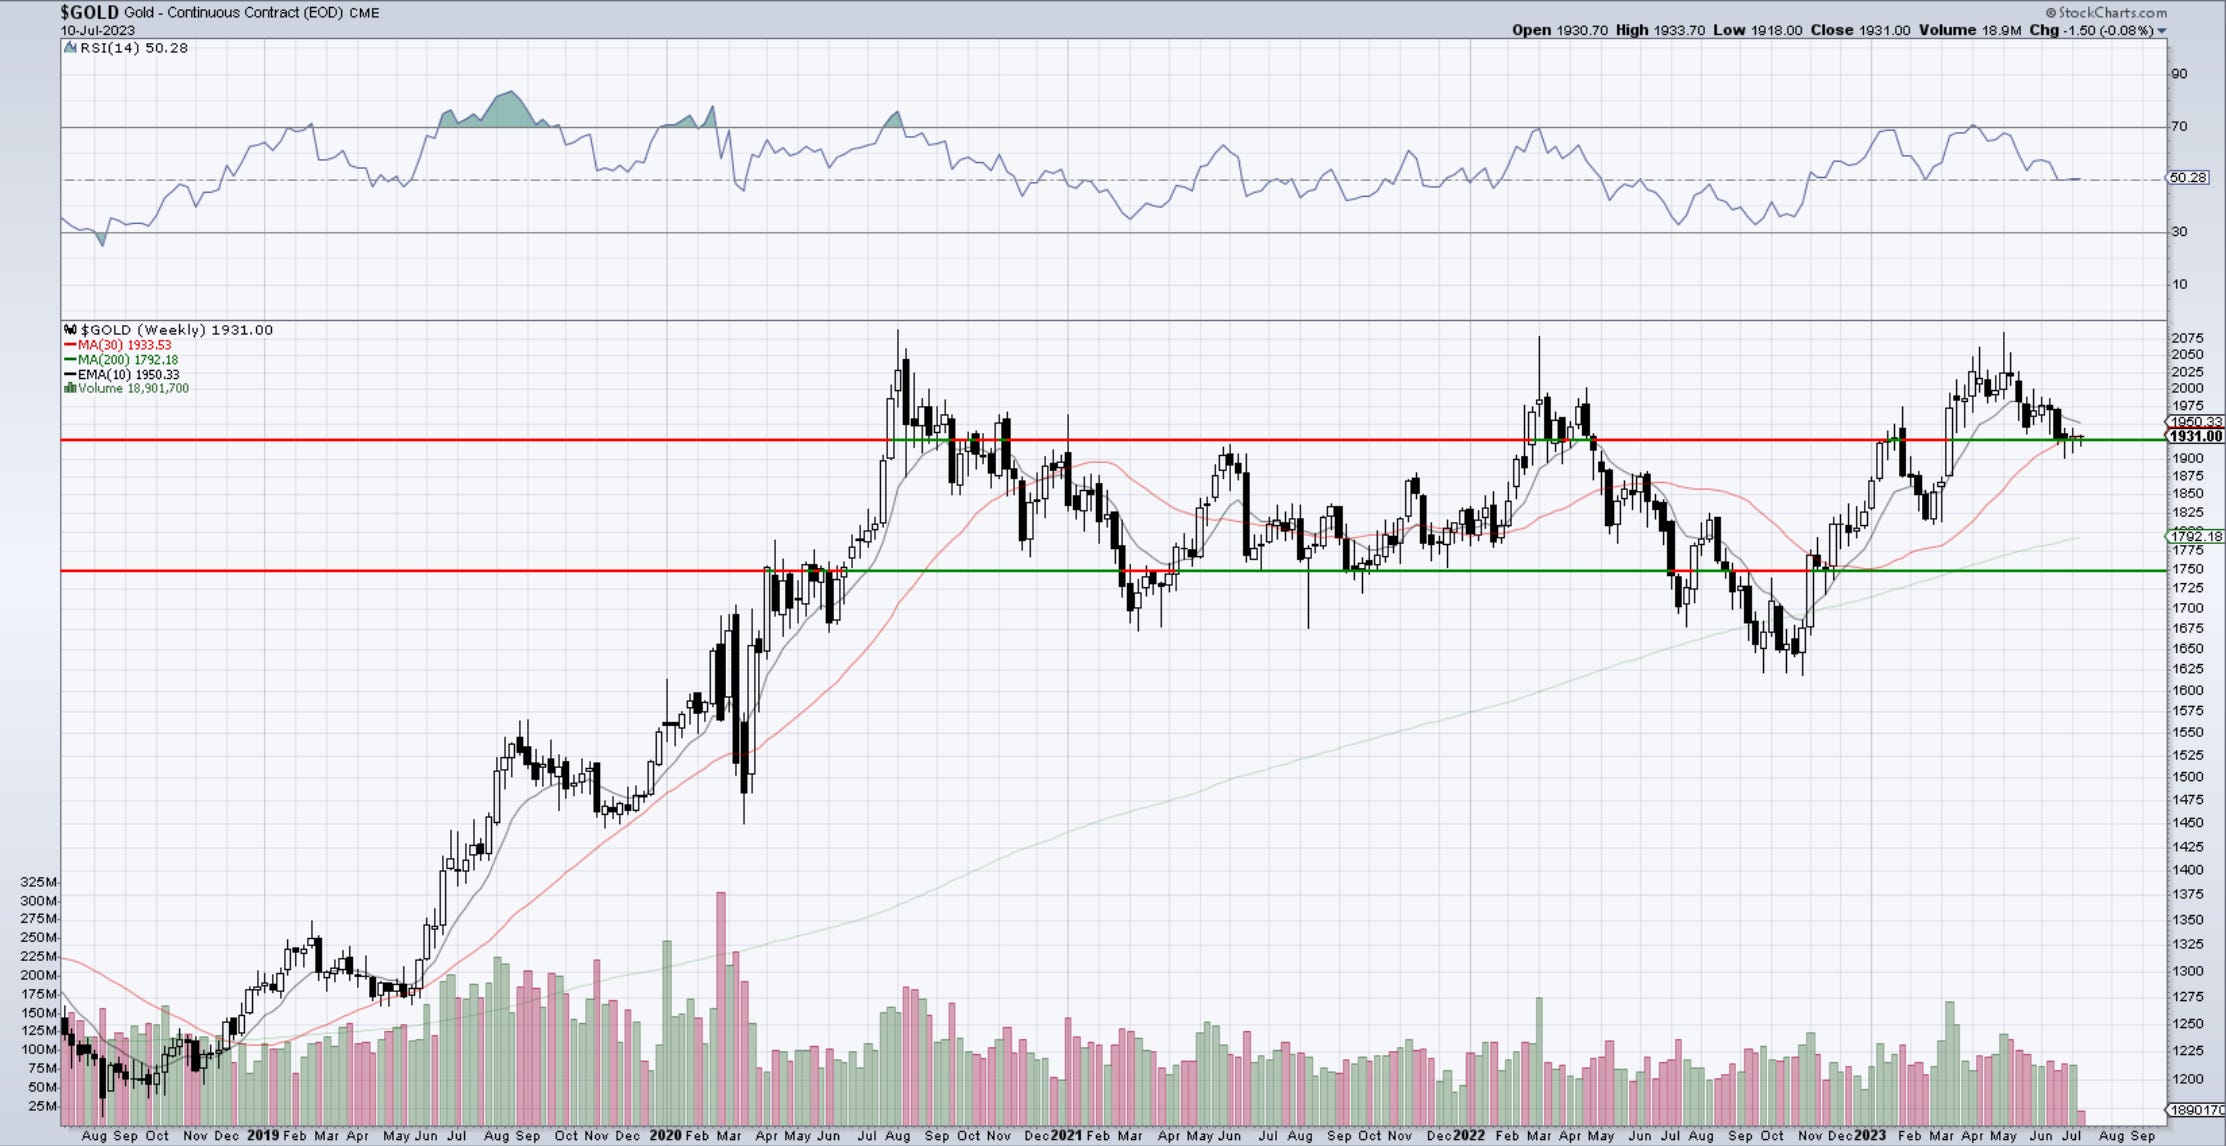
Gold
Gold made back some losses from last week, but it’s still undecided. The weekly chart below shows the horizontal support along with a rising 30week. We just need the price to respond. The break down in the dollar should definitely help if sustained. A rally towards 2k would ensue.
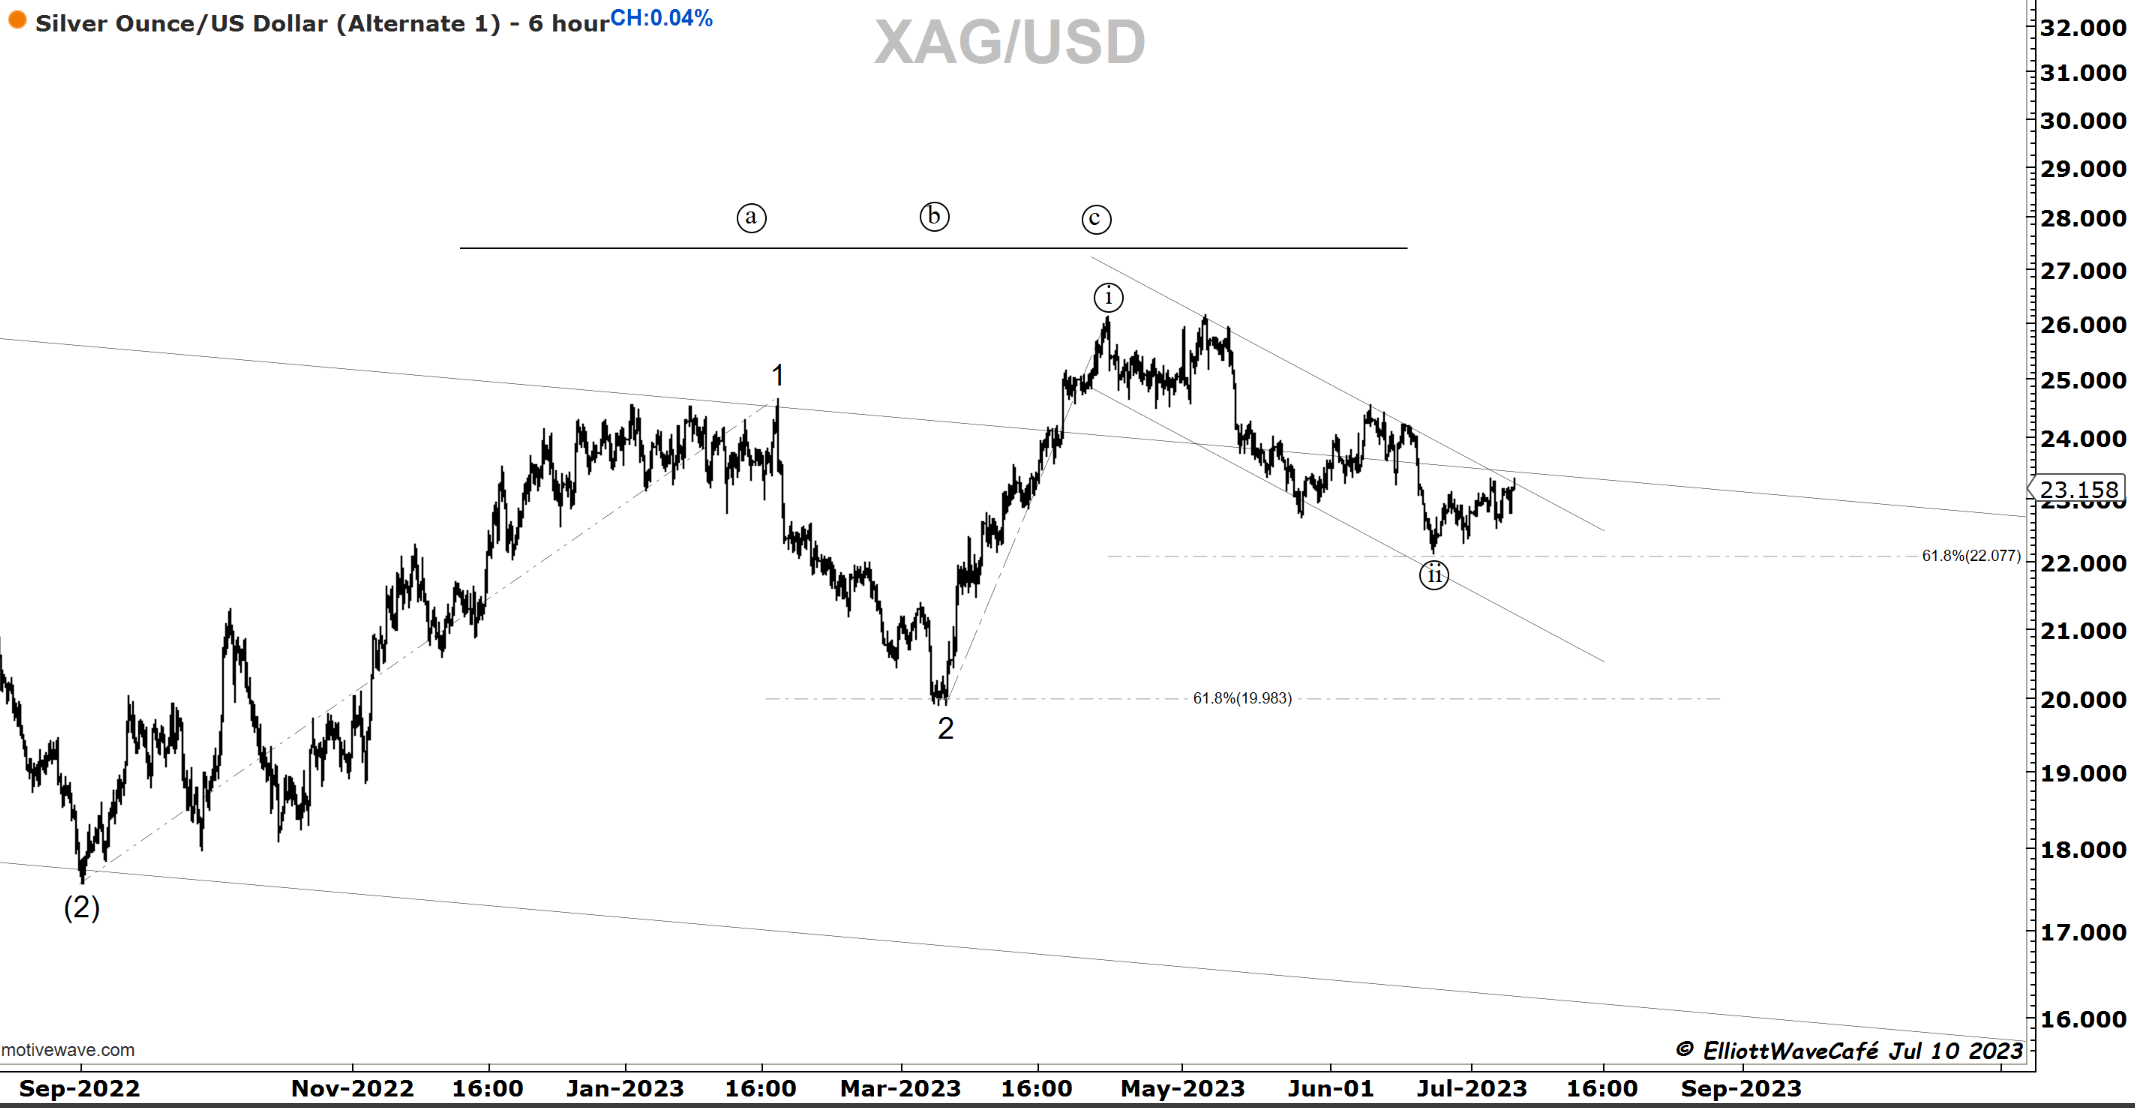
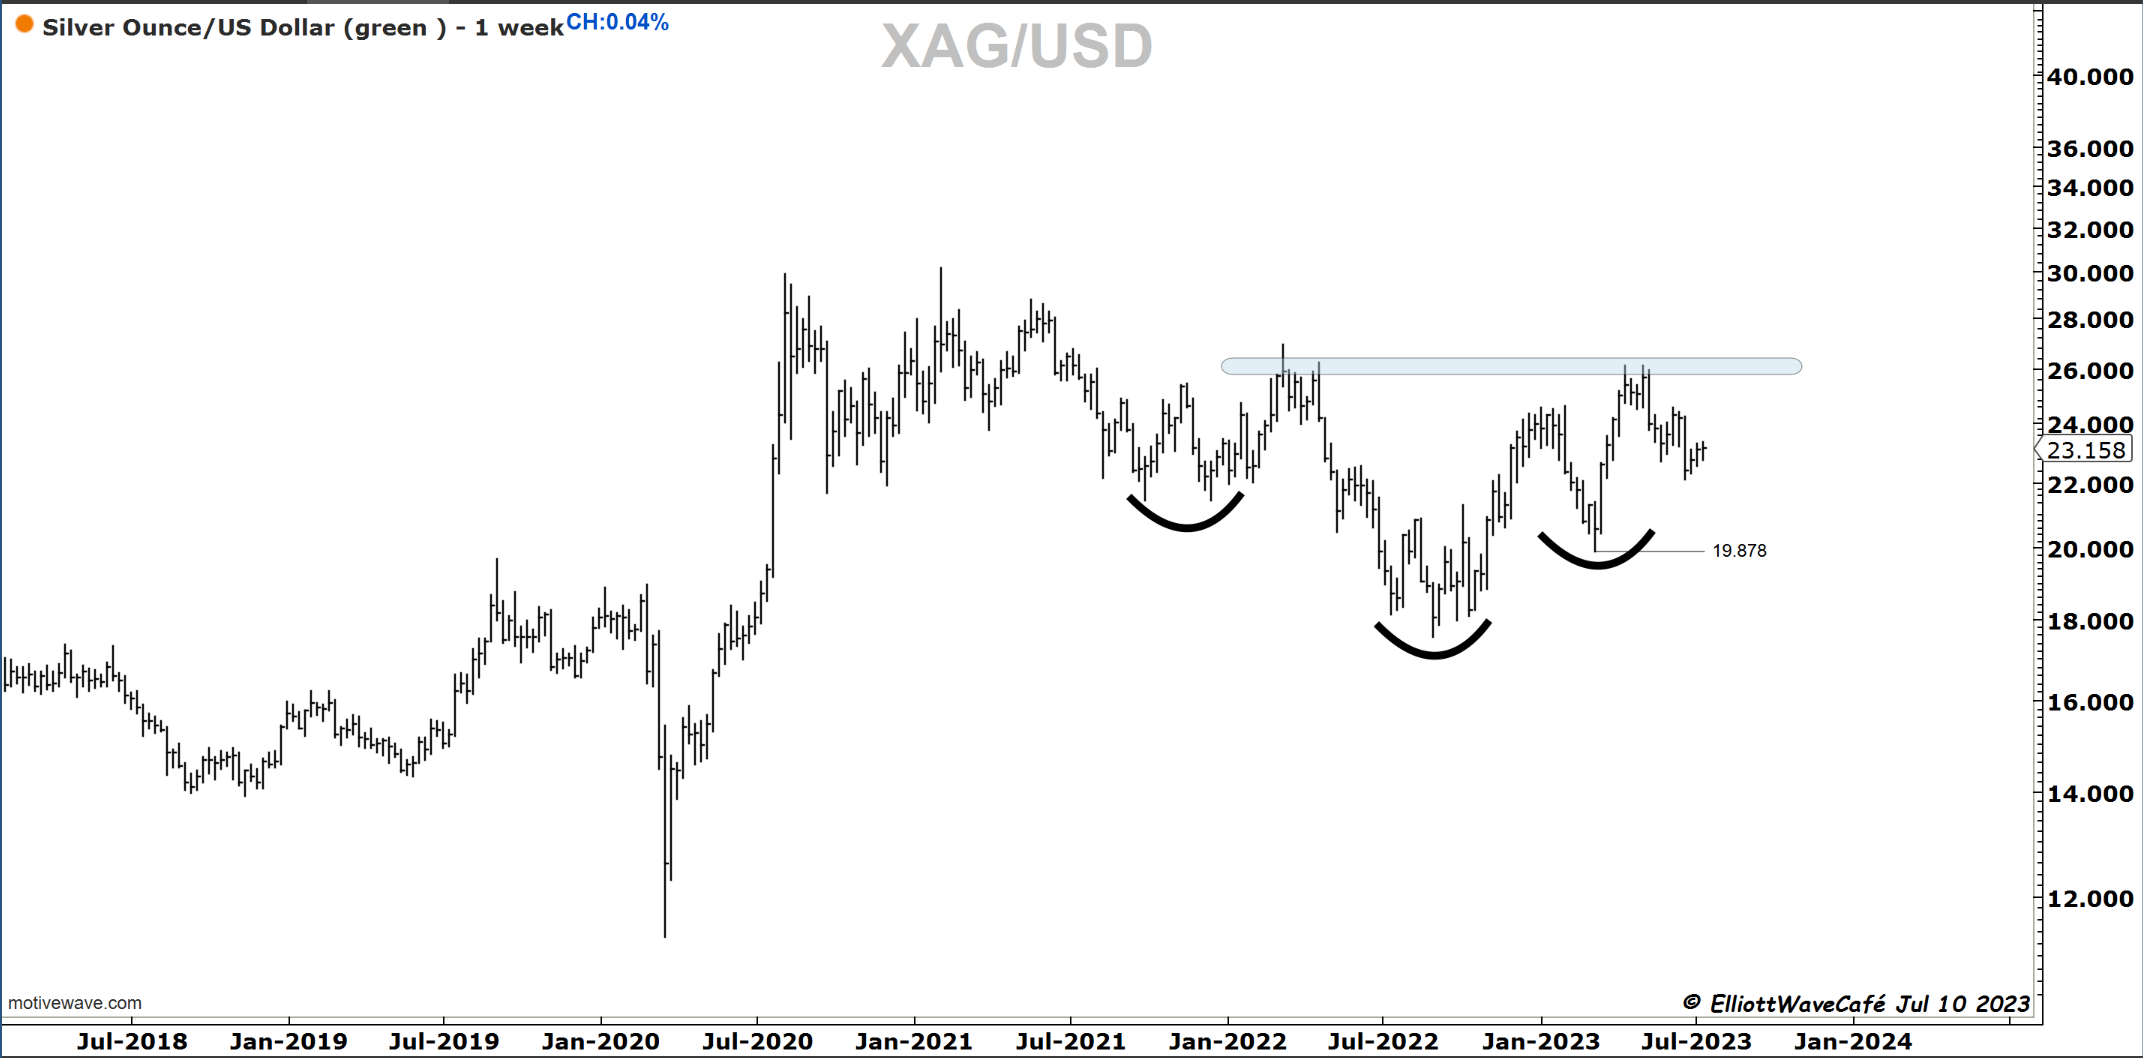
Silver
Silver did not continue the breakdown, and instead, it’s back at the top of the down trending channel and old declining trendline. Above them, I need to be bullish. The lower chart shows the inverted formation with $26 neckline. I need to see a bit more, but I am listening closely.
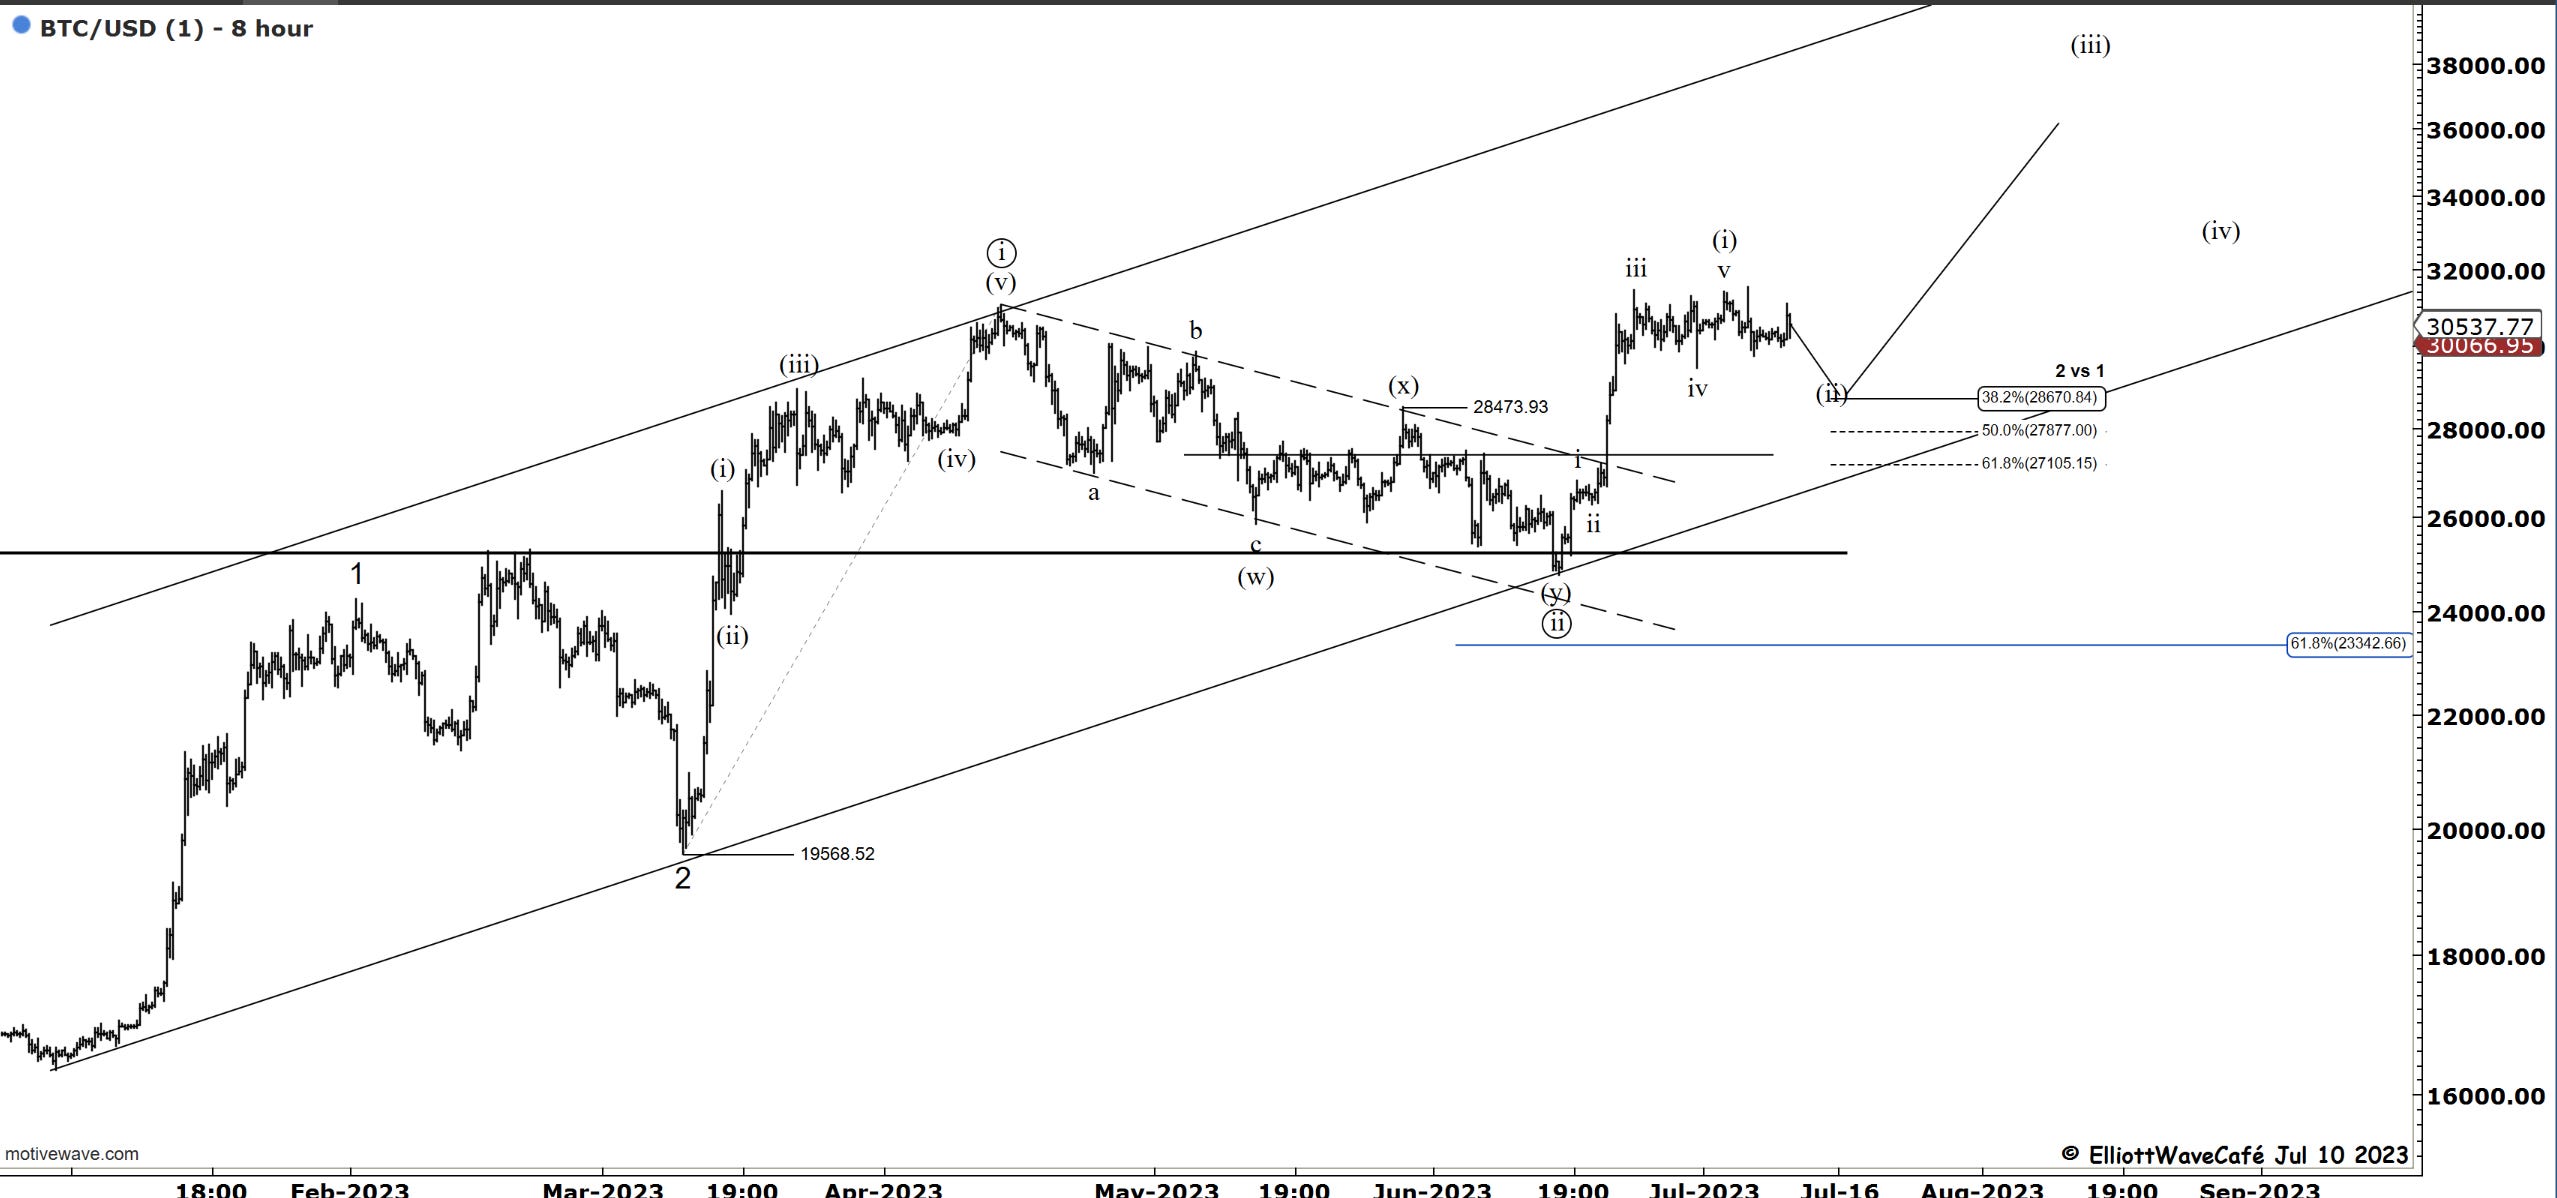
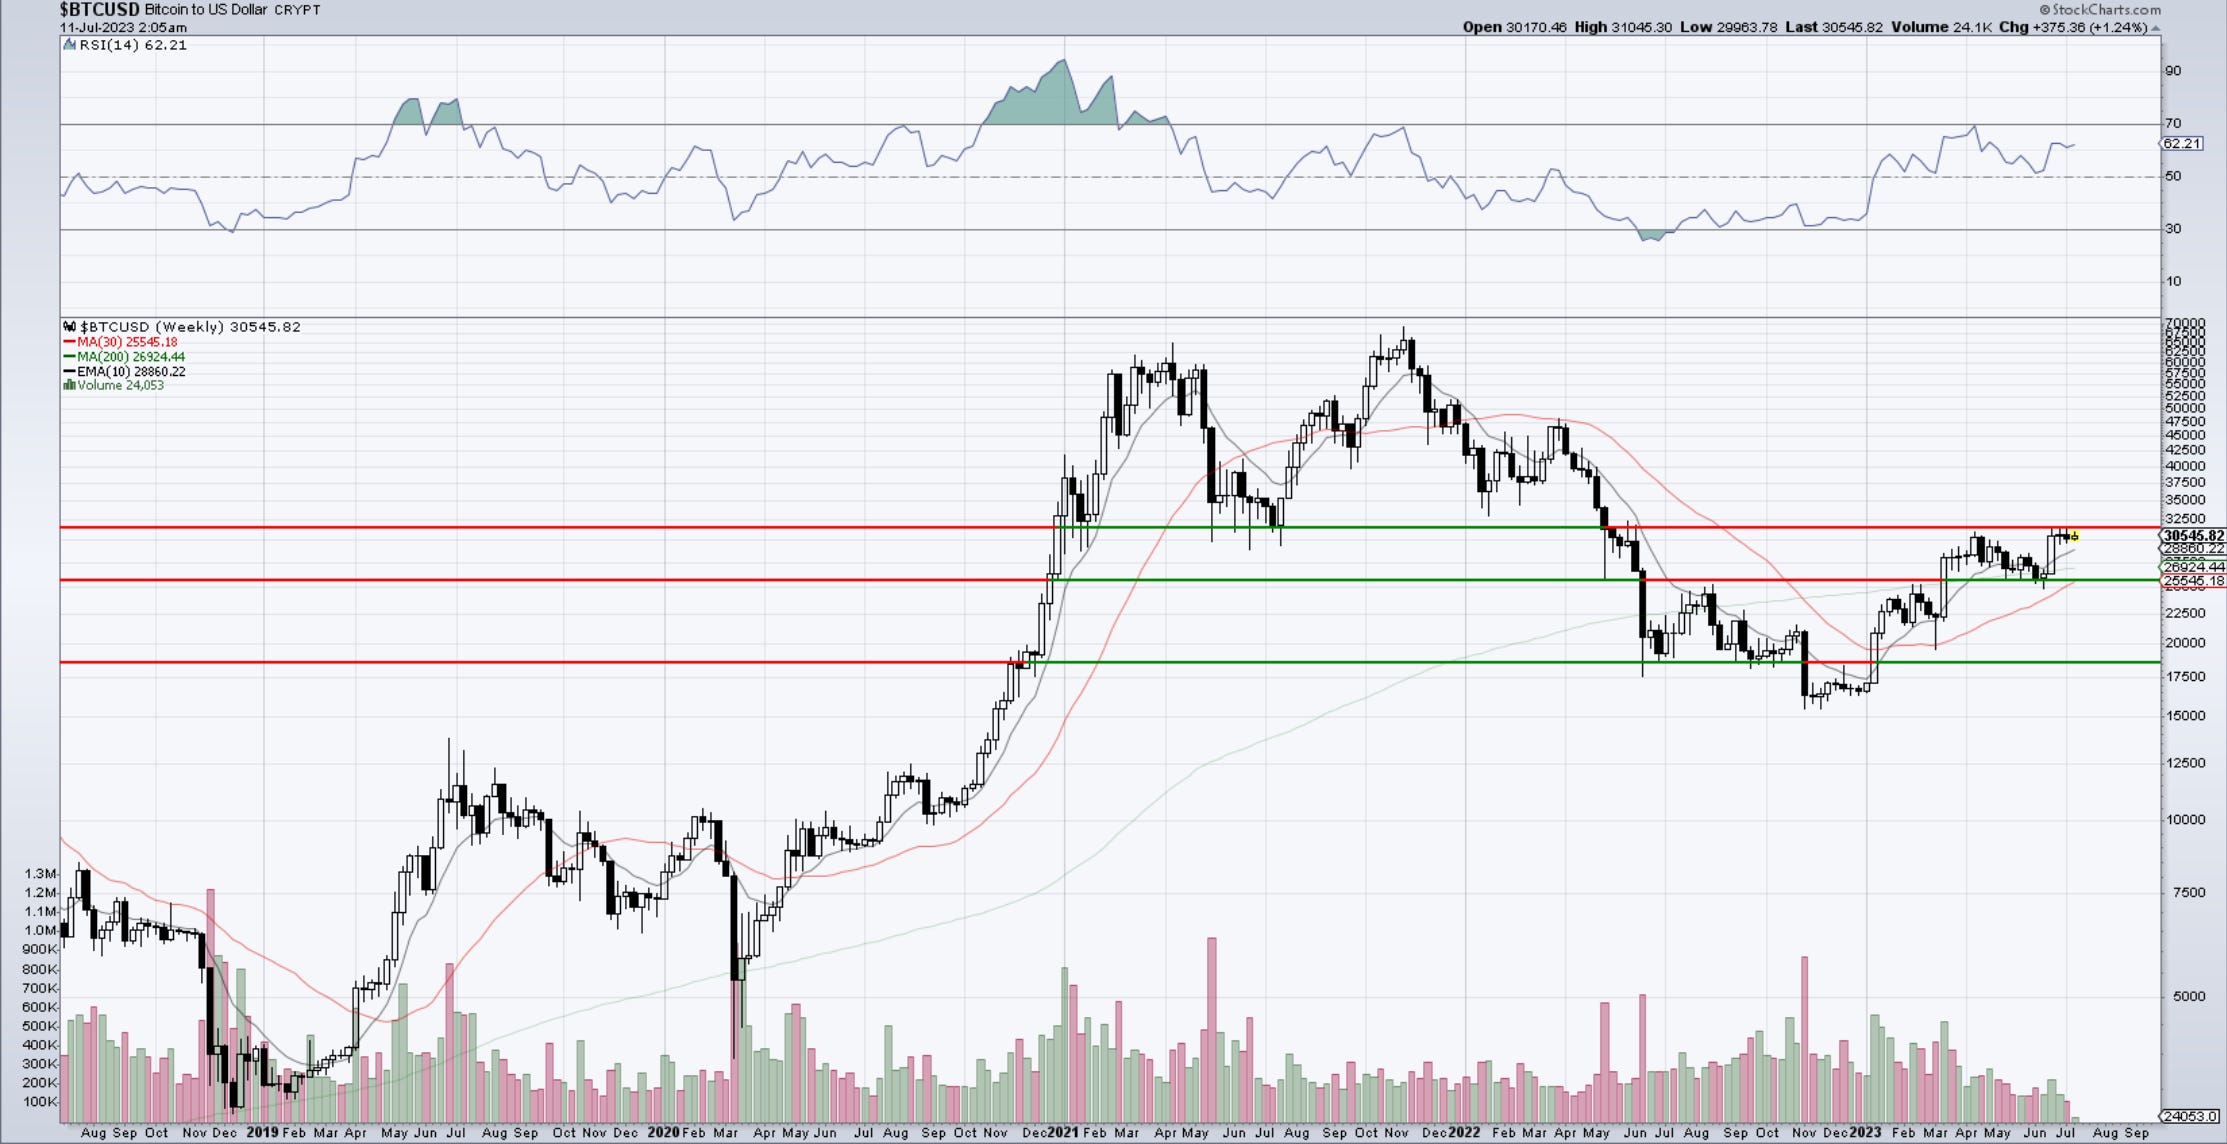
Bitcoin
Is Bitcoin ready for prime time or do we need to wait for a dip into the fibs? It briefly tried but failed. The weekly chart below with the clear resistance level shows this is the 4th week of trying. One could start a small position in anticipation of the breakout, or wait for it to happen with alerts. Buy stops can be placed above 31,500 but be prepared for whipsaw and failures. It might not be that easy. But that’s the risk we’re taking. Long above 31,500 only or not long at all it’s one take. The other is accumulating multiple small positions at different prices as we retreat into fibs with stope below 26,500. Pick what you like and what fits you better. Just know the risks and get out if it does not work out as intended. This is the type of “financial advise” that you find here, not many services will tell you that.
See you tomorrow - trade well ,
Cris
email: ewcafe@pm.me