
The Daily Drip
Core markets charts updates and commentary
Note: The counts on the right edge are real-time, and they are prone to adjustments as price action develops. Elliott Wave has a fluid approach, is evidence-based, and requires constant monitoring of certain thresholds.
In the counts below, this (( )) = circle on chart
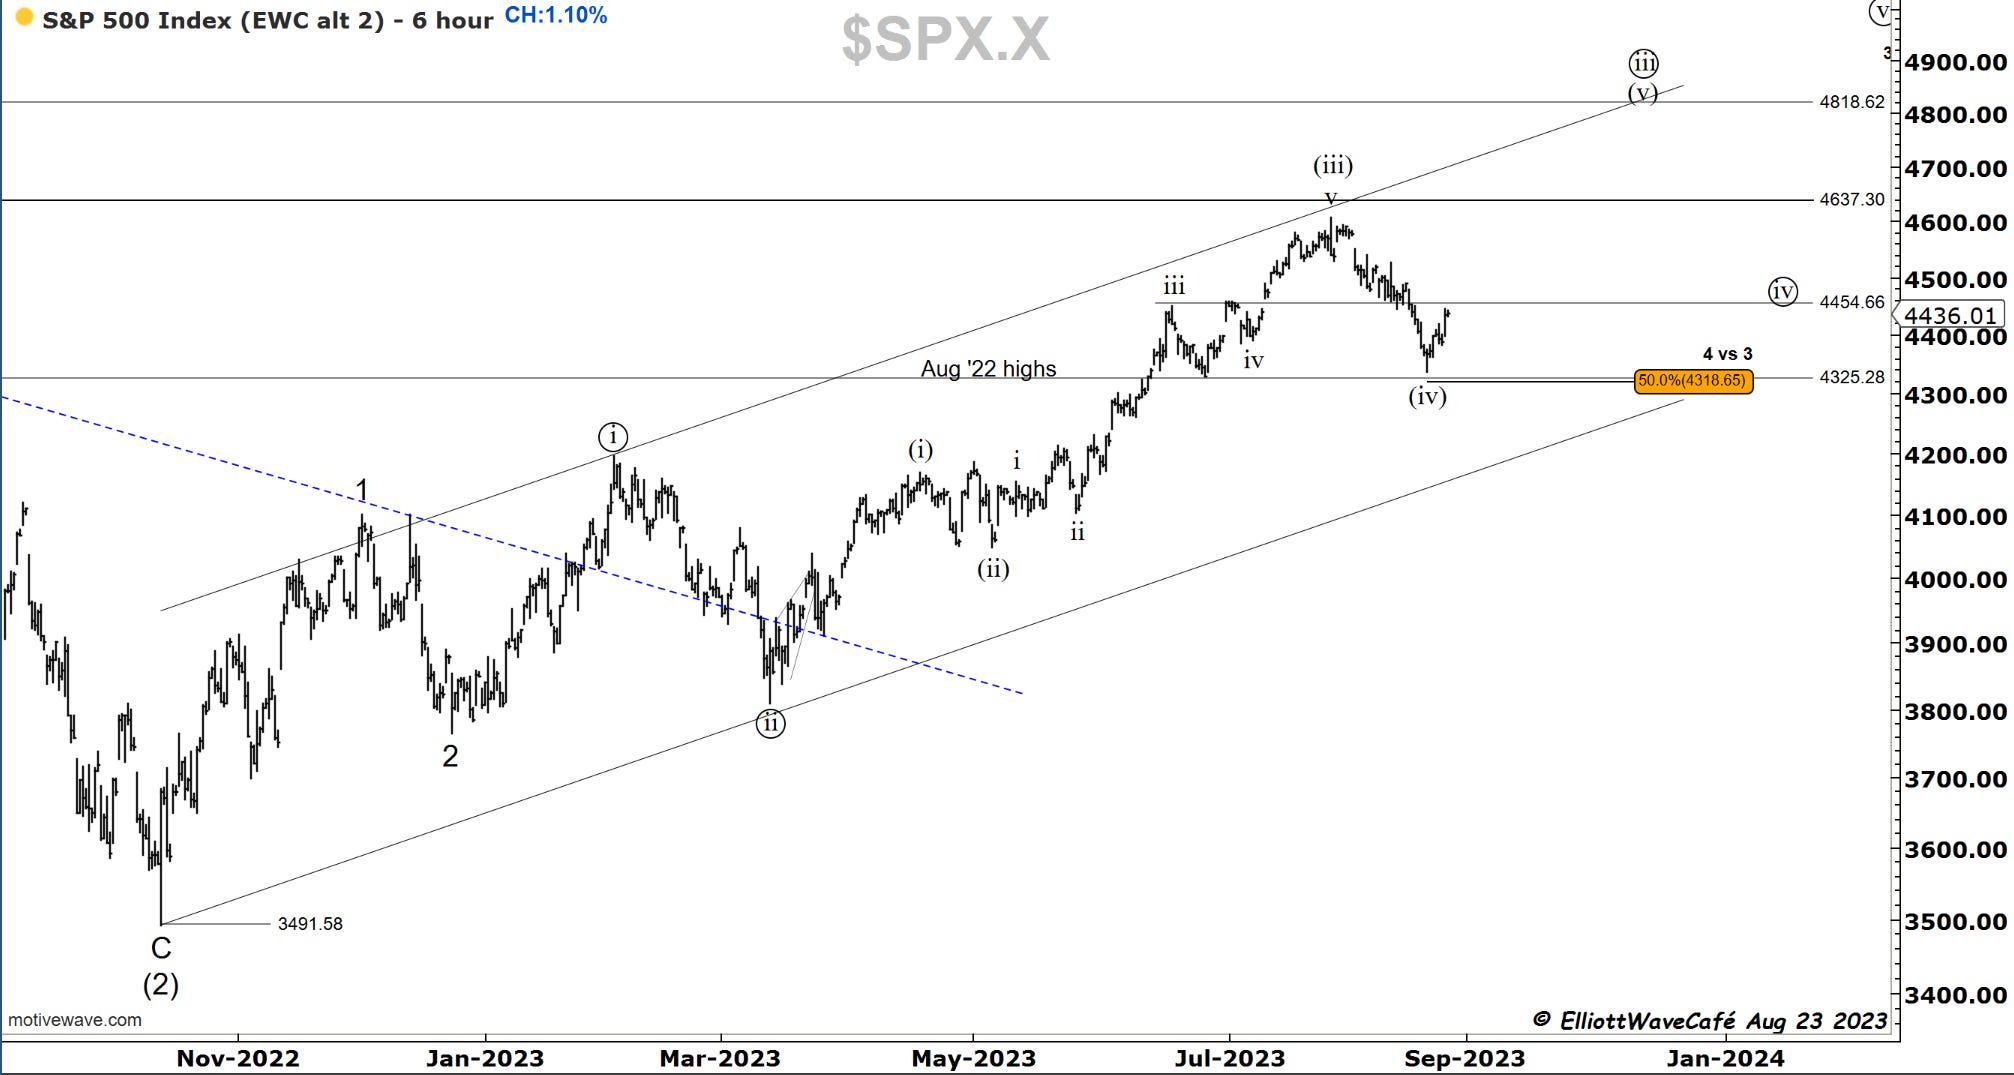
SP500
The rally of 4325 support continues, now reaching the underside of 4445 resistance. If wave (v) is underway, we will be watching for price behavior on throwbacks. As you can see on the 2nd chart we don’t only have the horizontal level at 4450, but also the shorter-term moving averages as well. Price has to fight and close above those for at least a couple of days to get things moving higher once again. It’s possible we get a quieter day tomorrow ahead of Jackson Hole, however NVDA earnings it’s boosting futures momentum. We remain long this market.
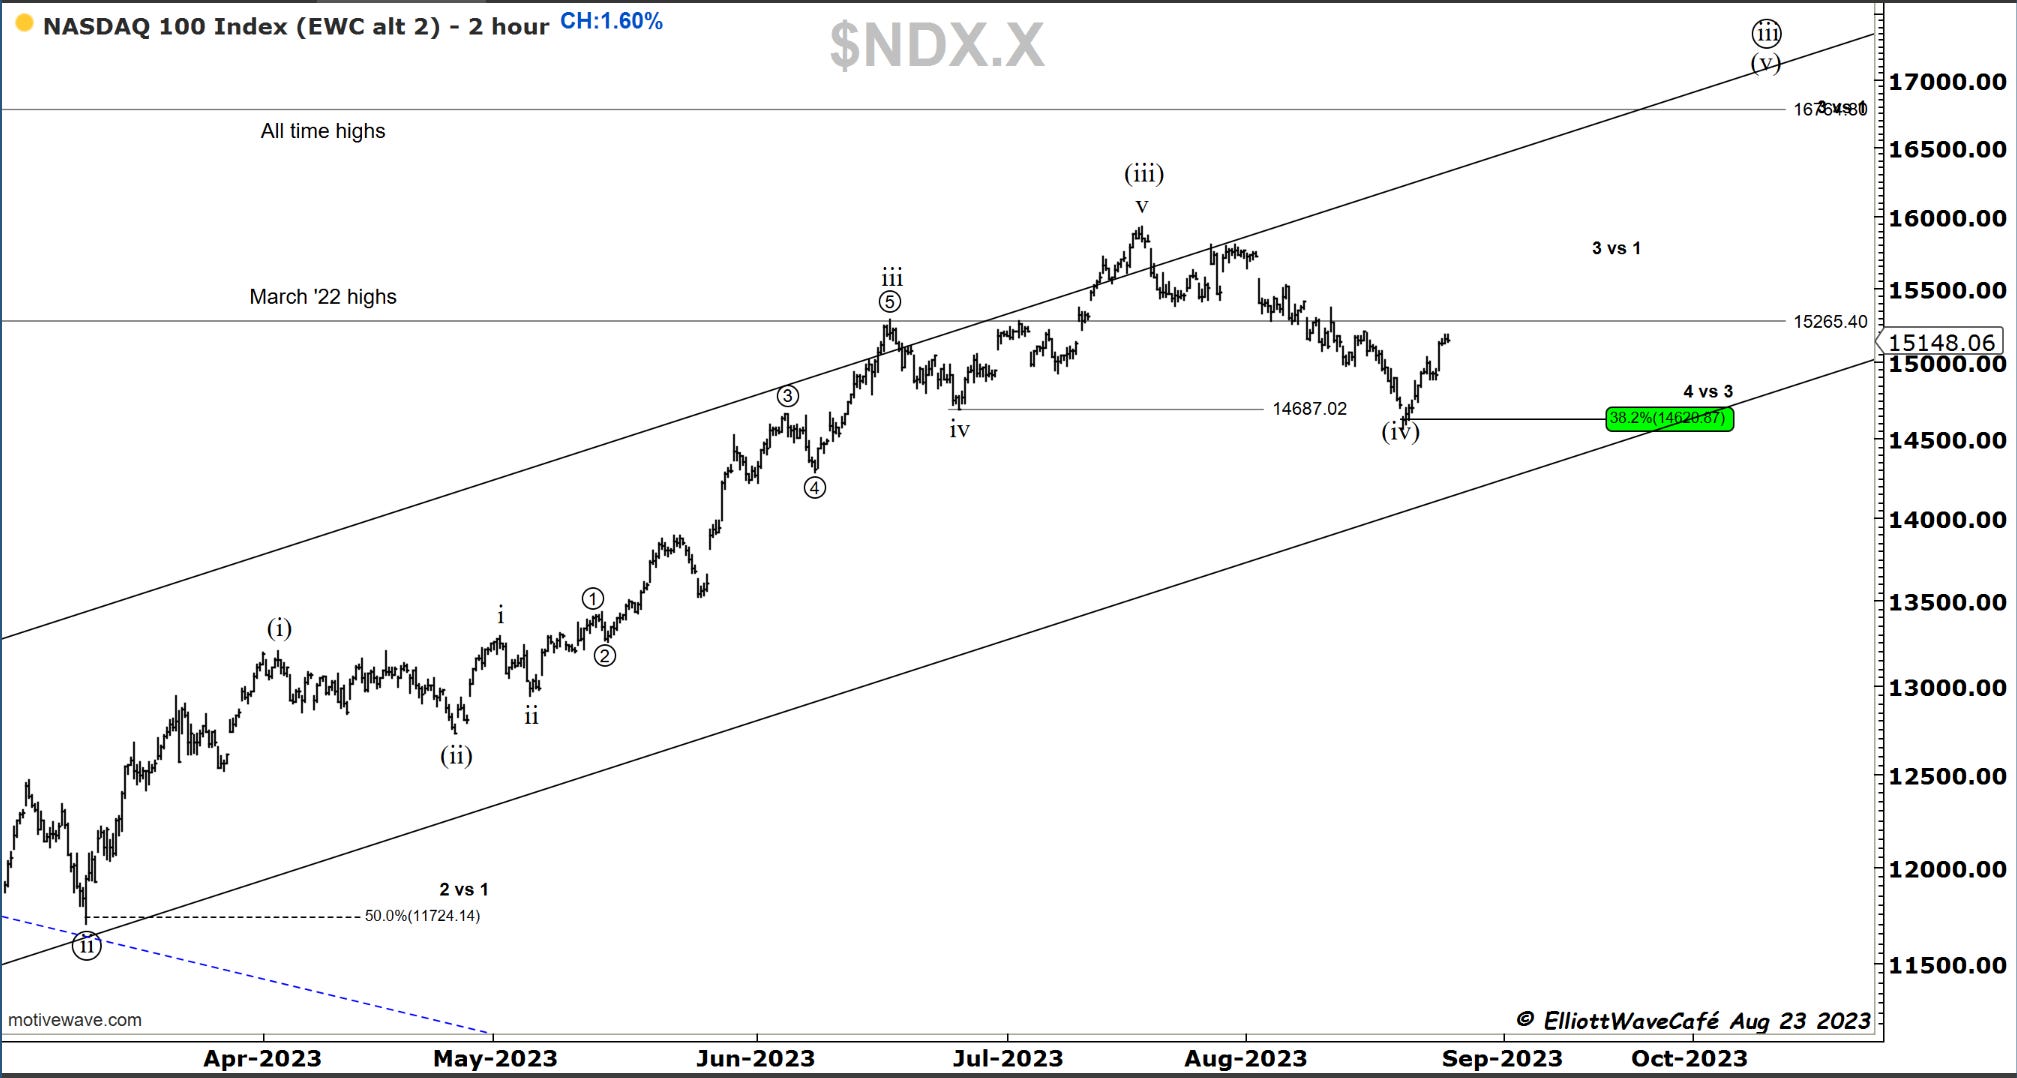
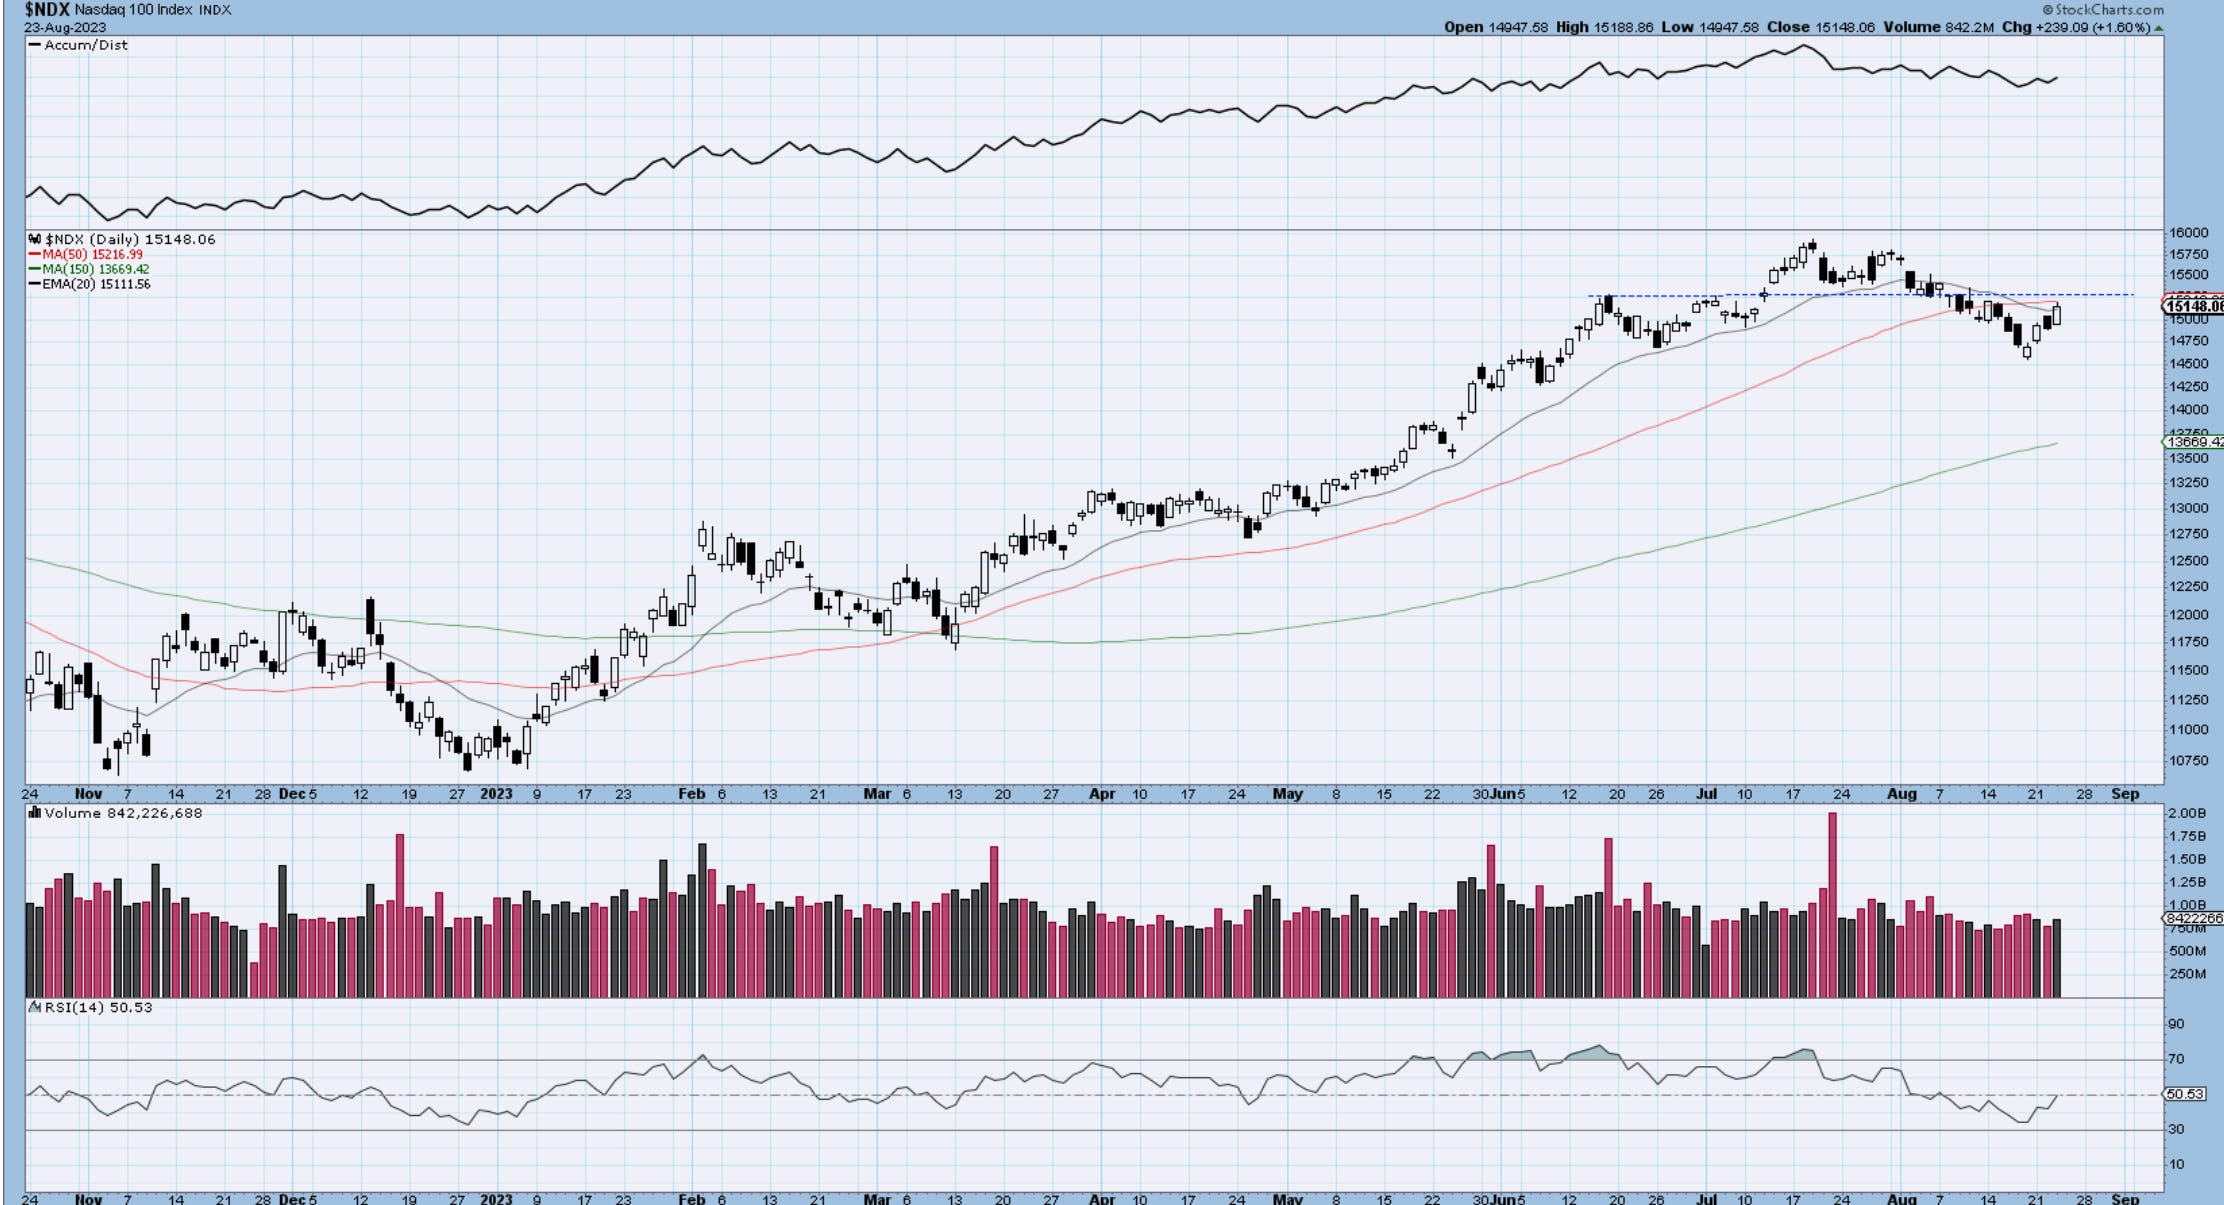
Nasdaq100
15,265 is the one to watch into tomorrow. We closed above the 20day and just below the 50, but the momentum seems strong once again in the Nasdaq. It was the first to hint to relative strength and rise of the prior 4th wave support. You will hear calls of head and shoulders from bears, but we need to watch the volume on that. If it increases how it seems to do, chances are we continue to break higher instead. Failed formations like that are usually very powerful in the opposite direction. Let’s see how we close the week Friday. It will provide a good clue for next week. We are hanging to out TQQQ position built on the decline.
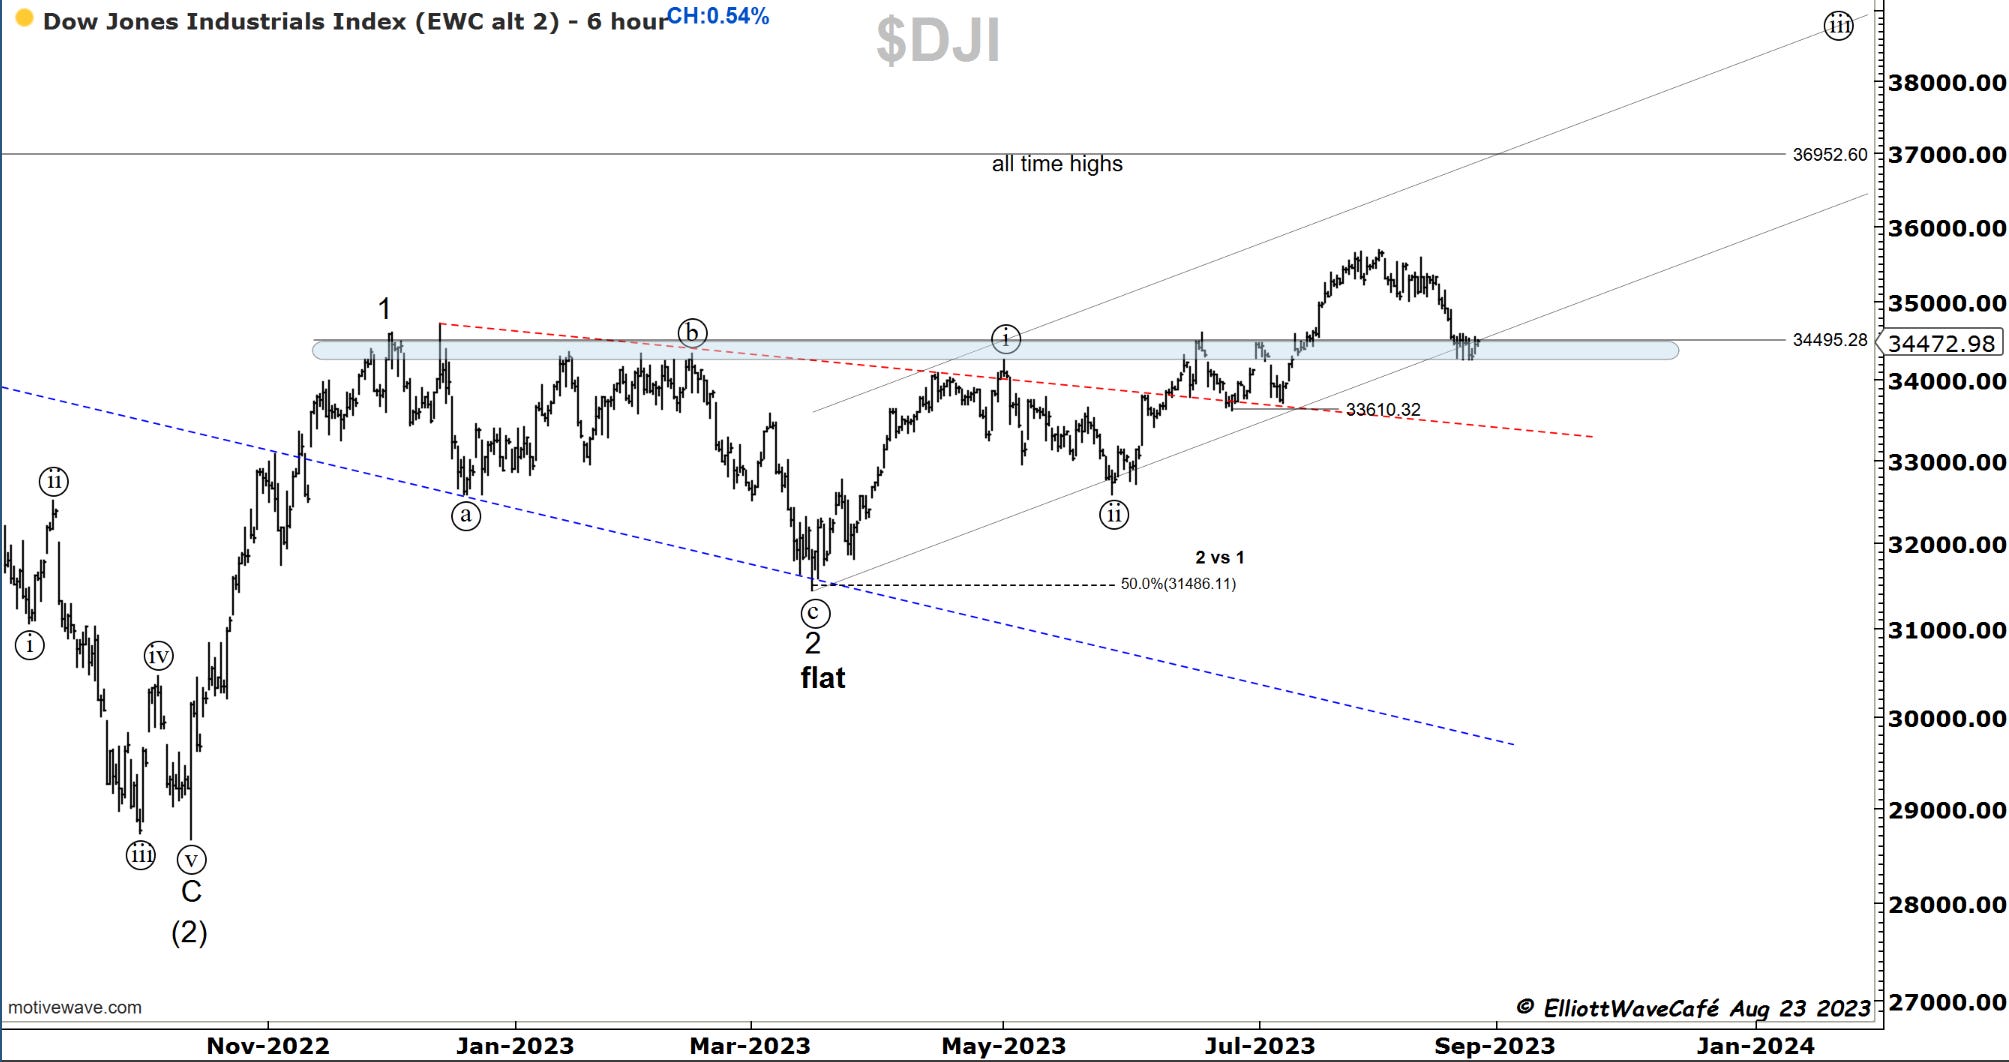
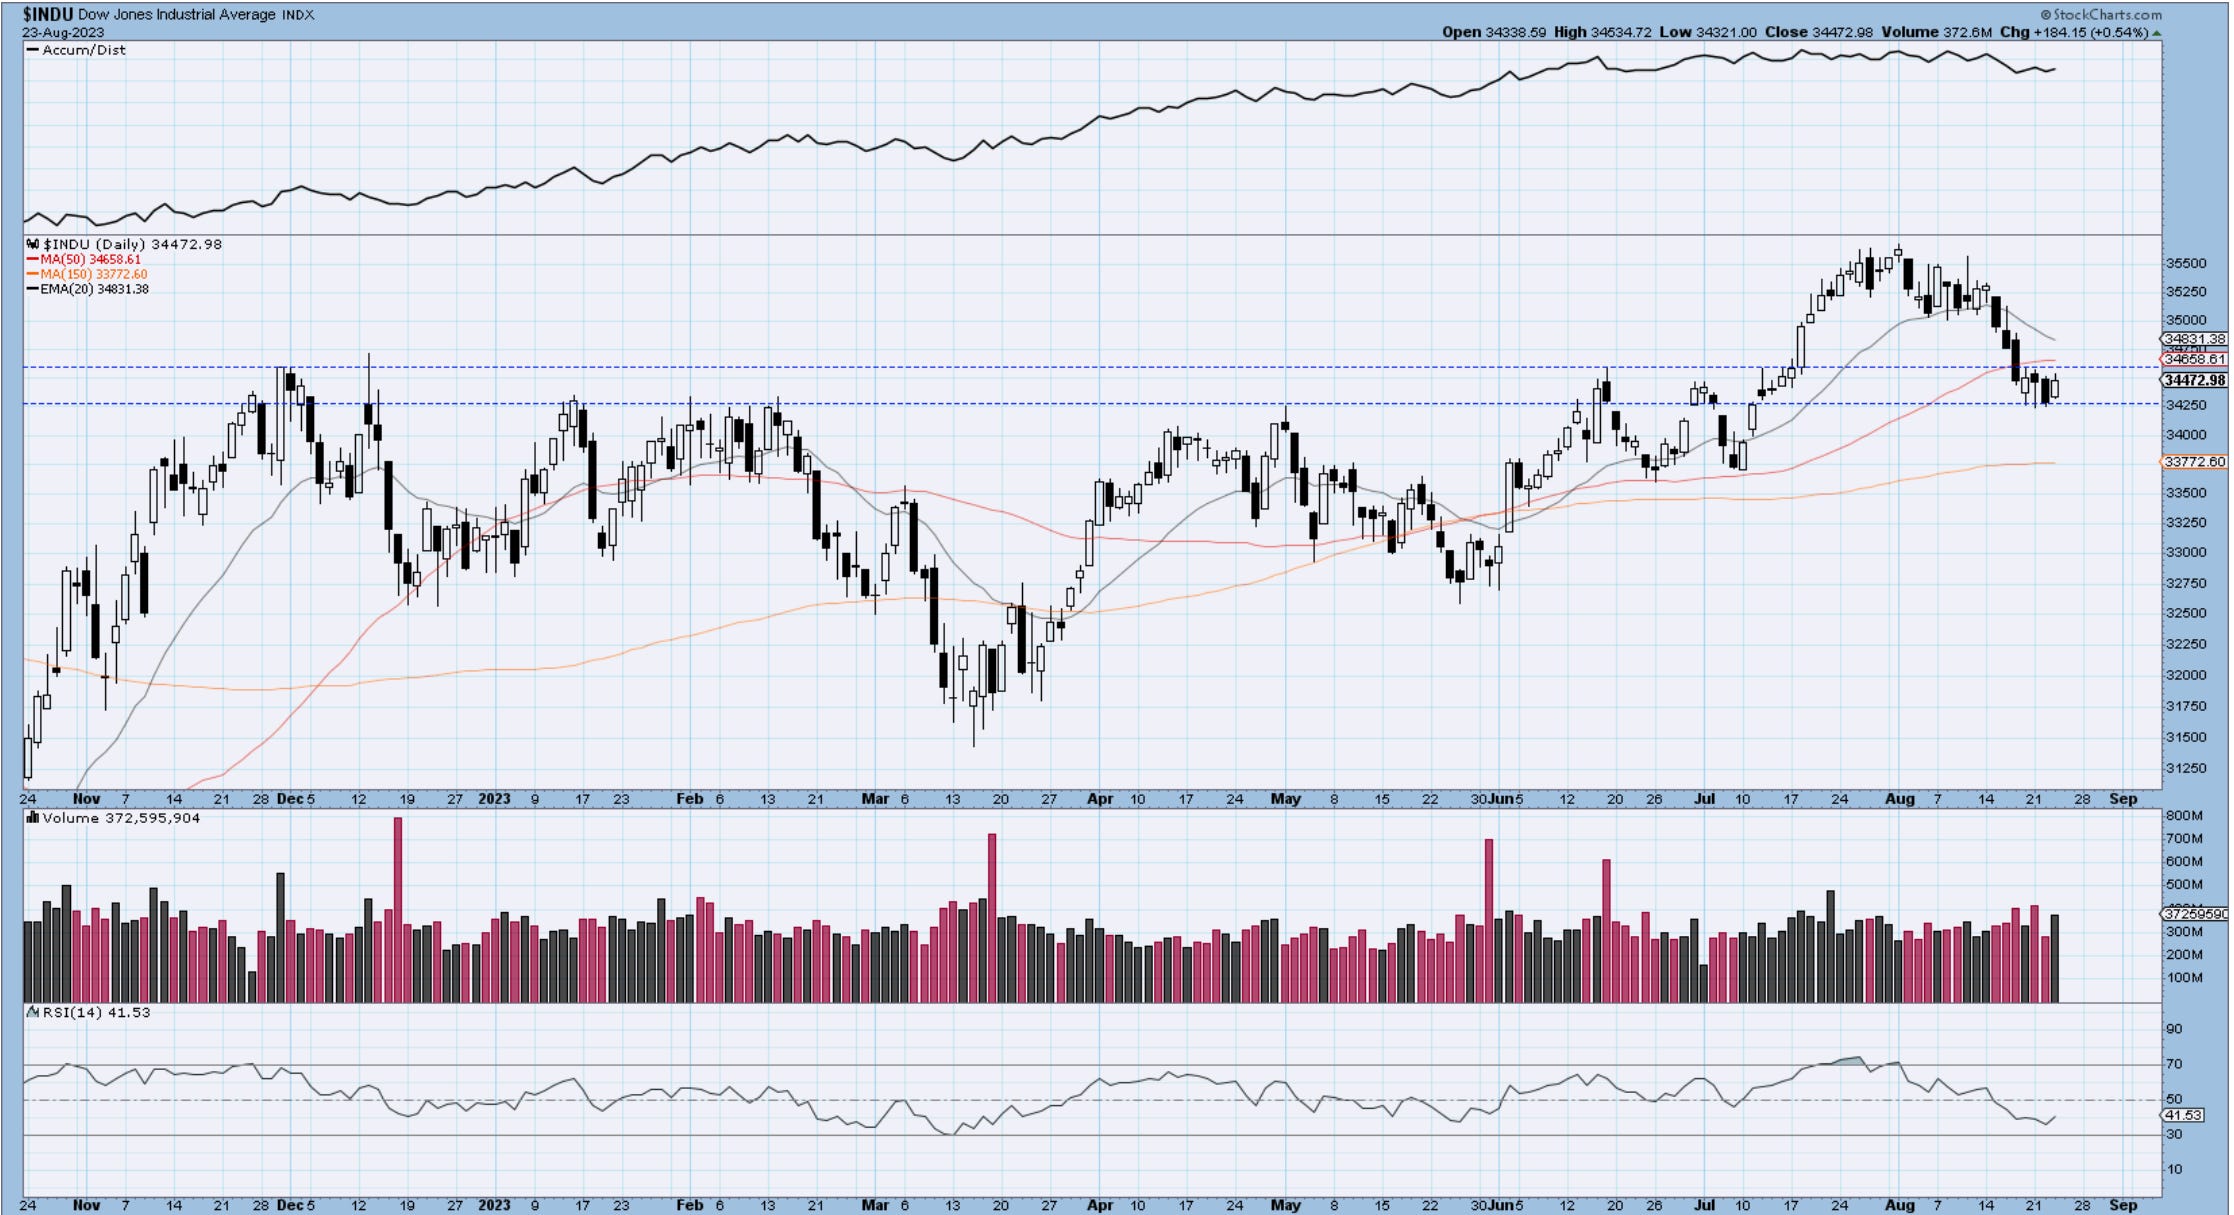
Dow30
Only a 1/2 of one percent rally today in the Dow, but check out that volume. NKE was a drag on the index with the retail rout, but support seems to be holding once again. We need dow participation higher with the rest of the markets to secure a more significant low and to start the higher degree wave.
US Dollar
Check out that rejection candle on the daily candle charts from our resistance line. It’s a start and exactly what we should see to help equities rally higher. Still somewhat premature. Yields not presented here but discussed in several videos have also pulled back sharply today, which is another piece of the intermarket puzzle we’re trying to put together. I am thinking about starting to open long bond positions, via some leveraged ETFs, mostly towards the short end of the curve. The market is positioned super bearish just as we’re about to end the 5th wave. ( see prior videos).
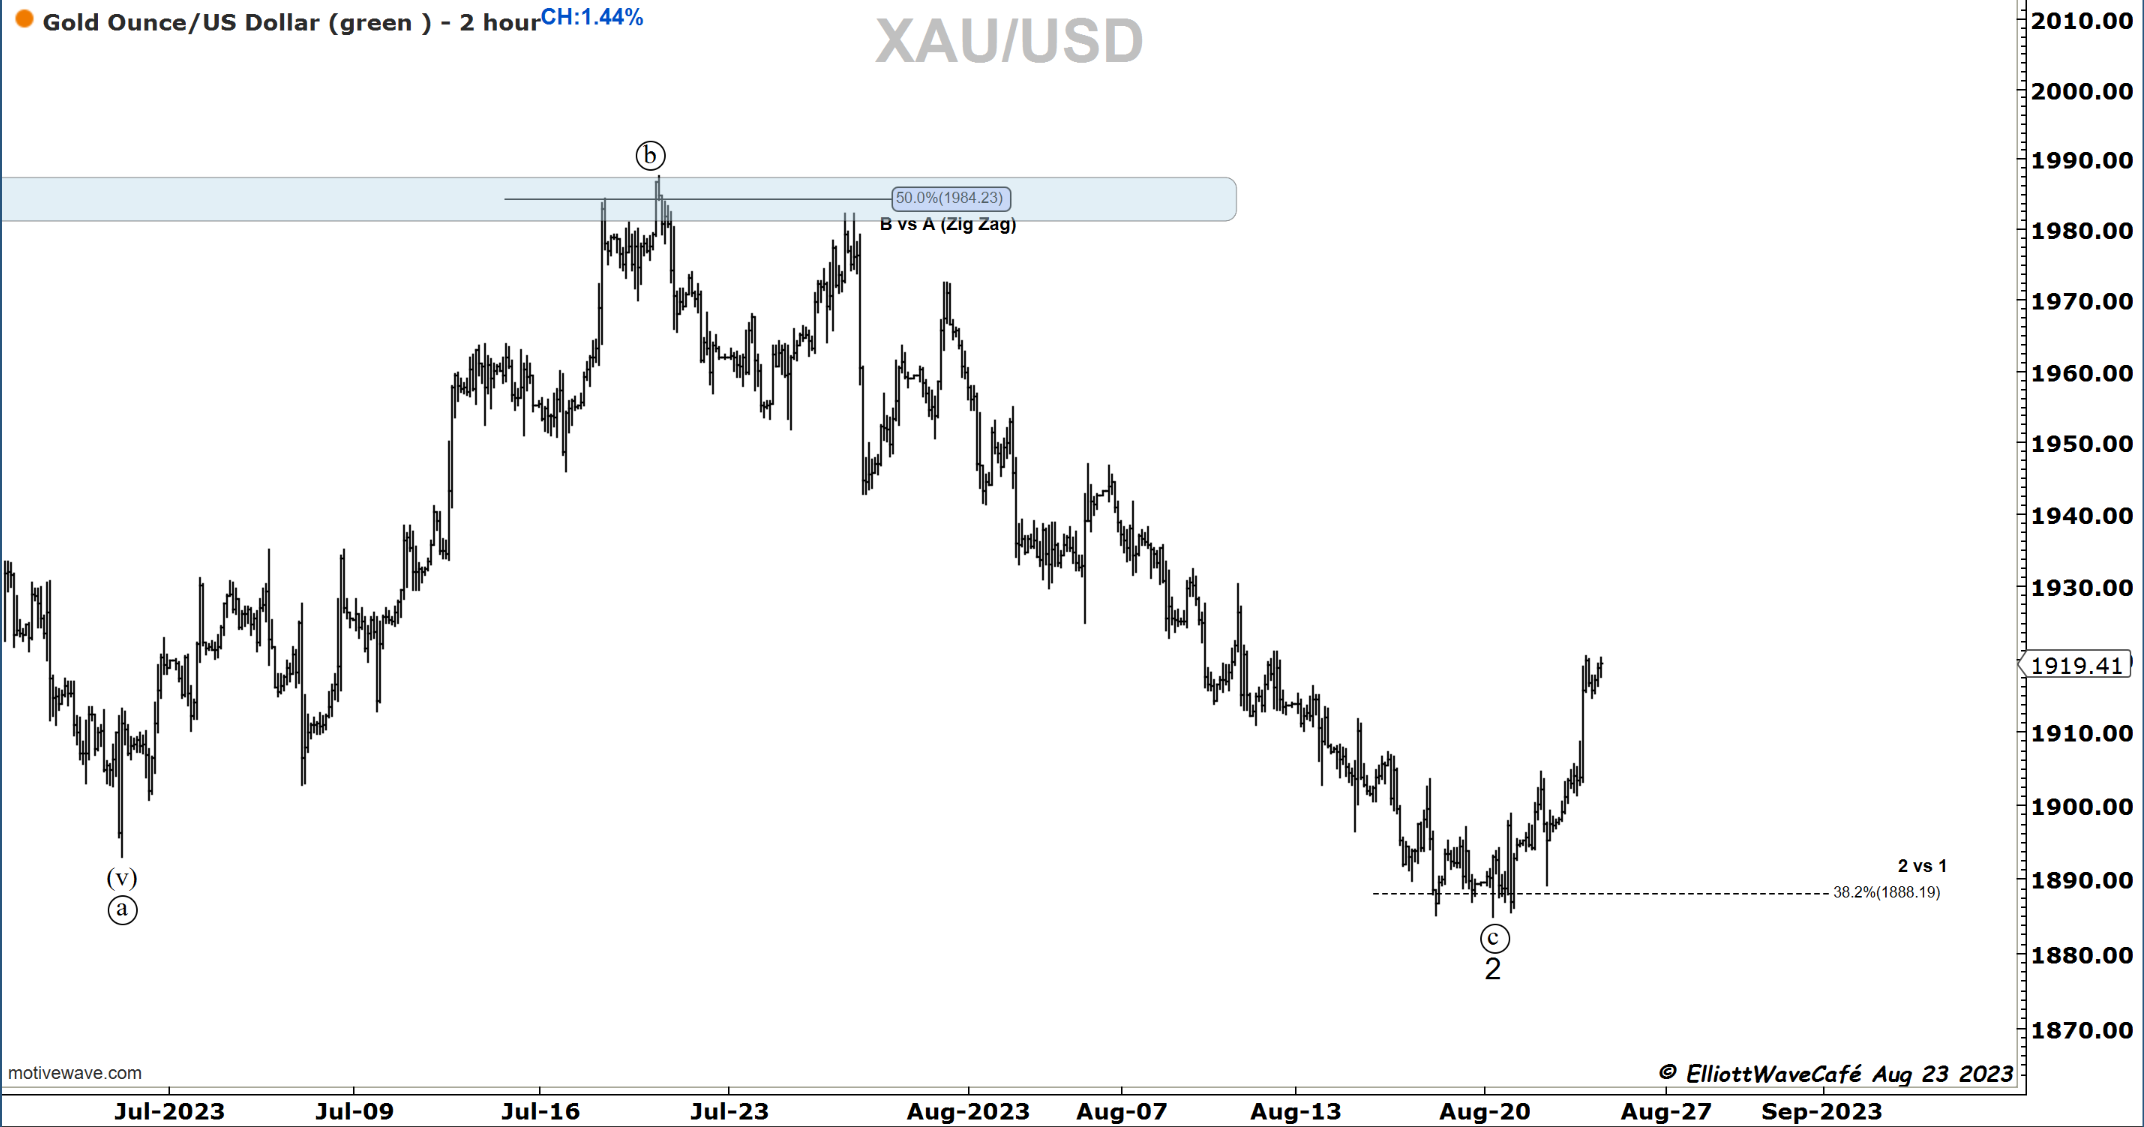
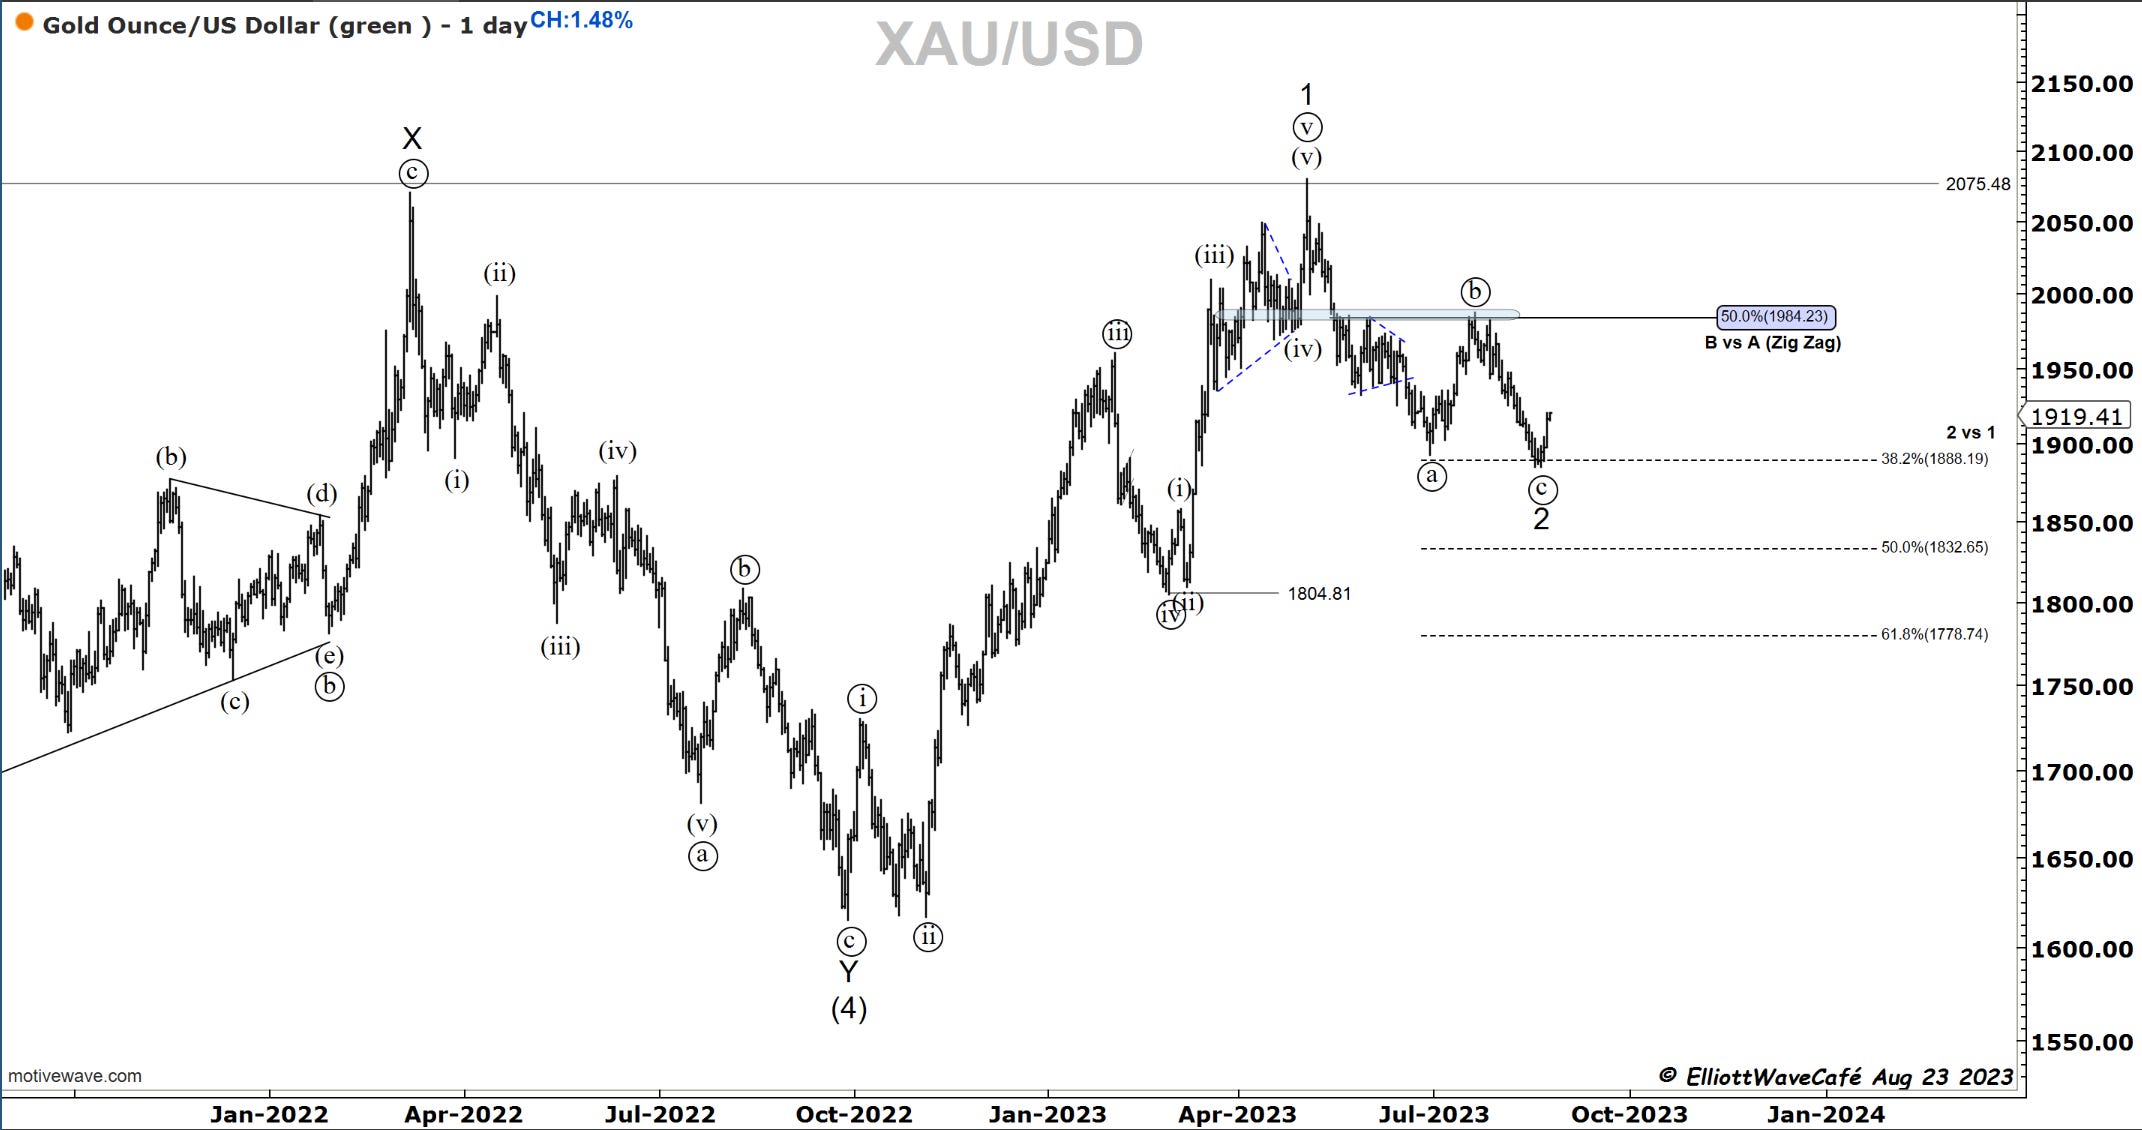
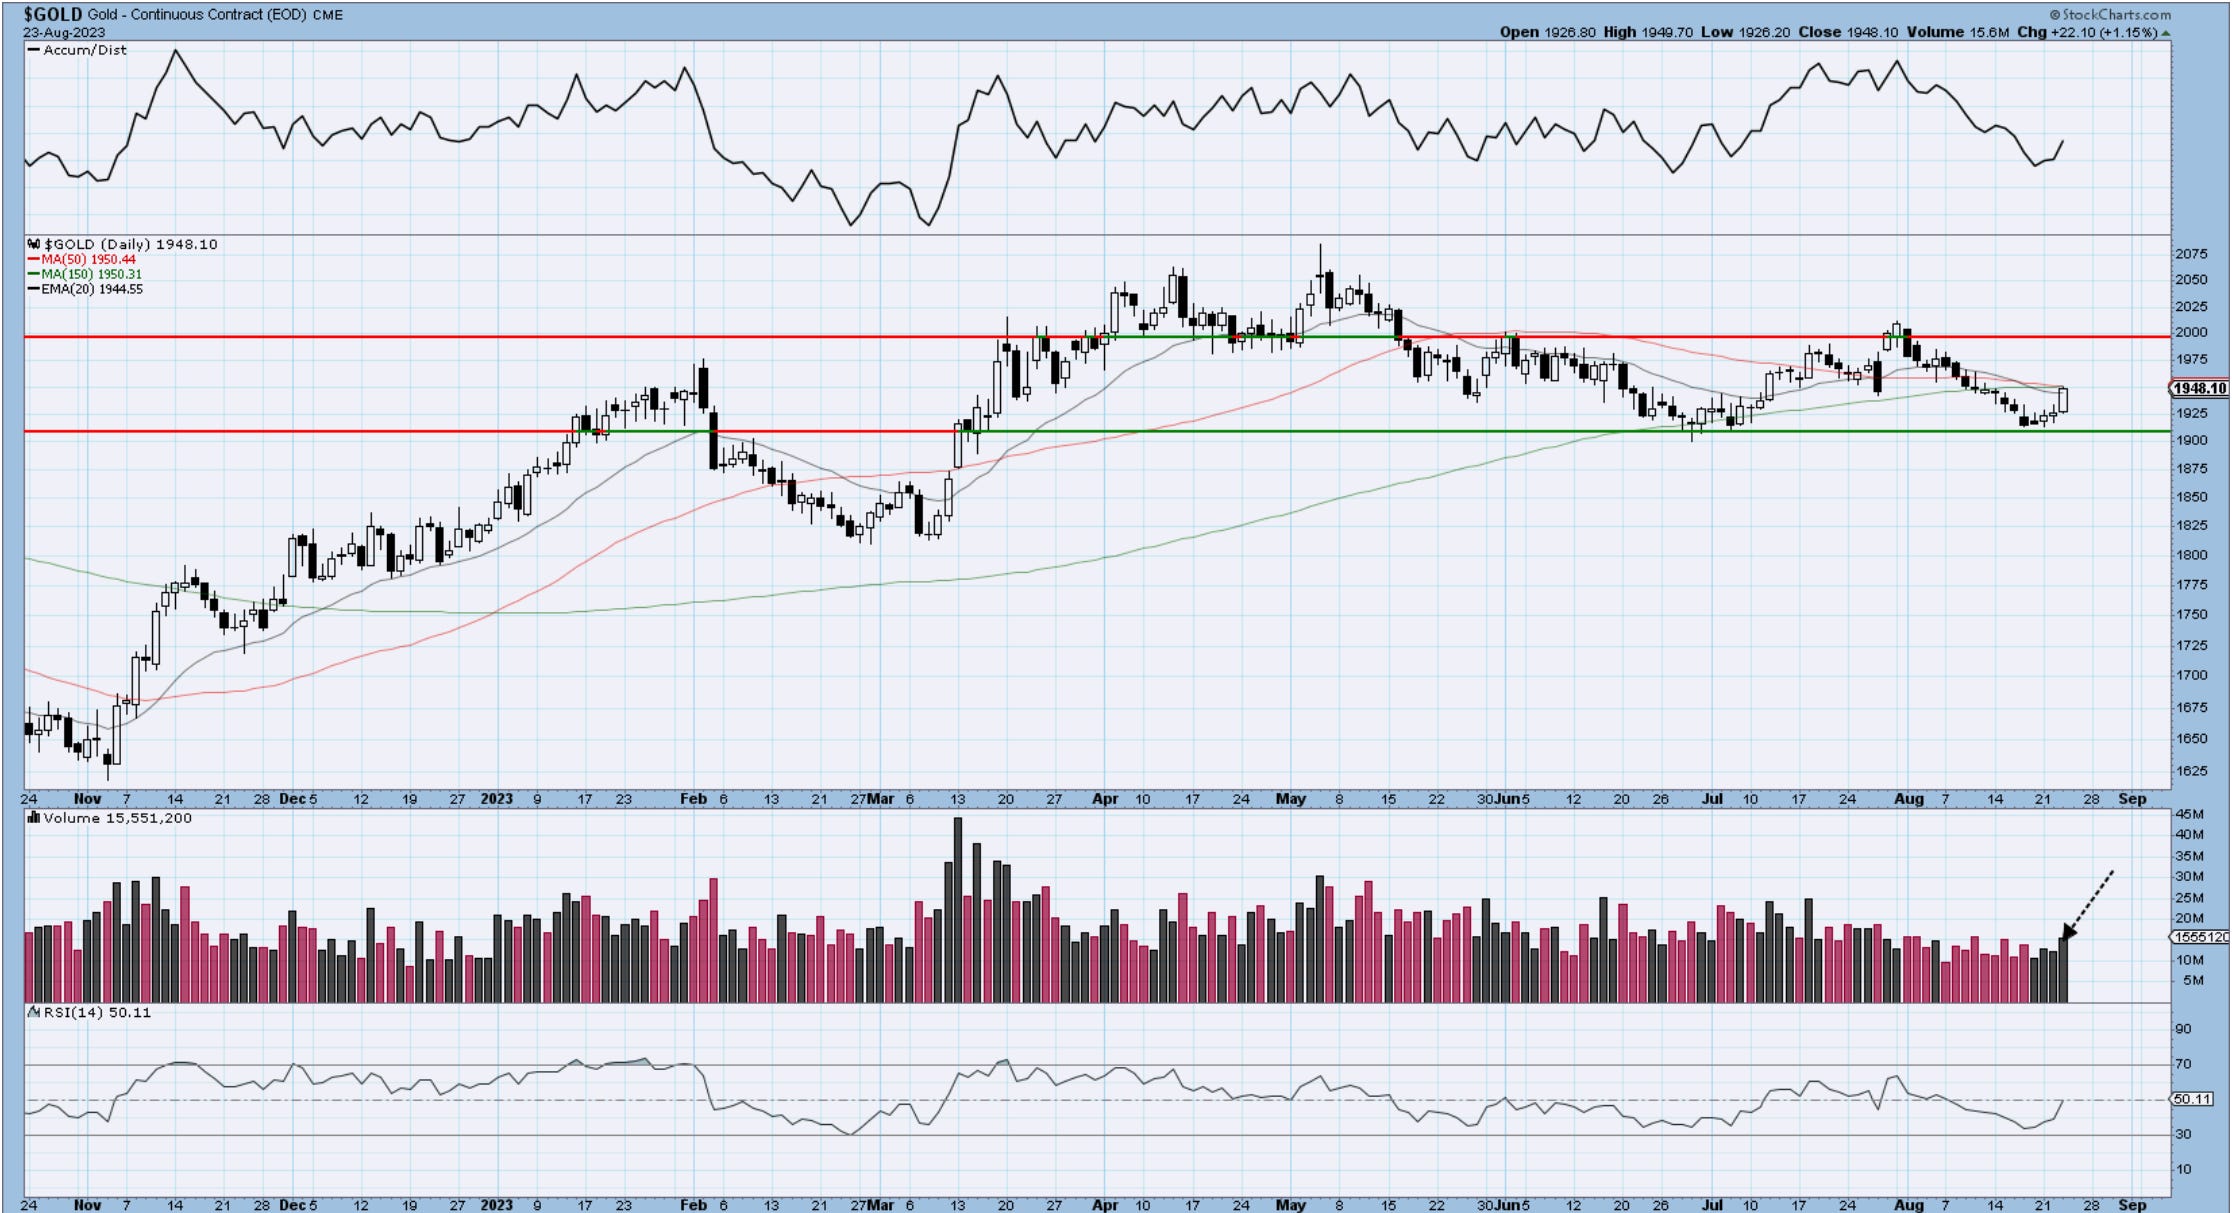
Gold
It’s a beautiful rally in metals and, gold does not hold back. Impressive volume of support. This makes me want to anchor the wave ((c )) of 2 low in place. I am a buyer on throwbacks.
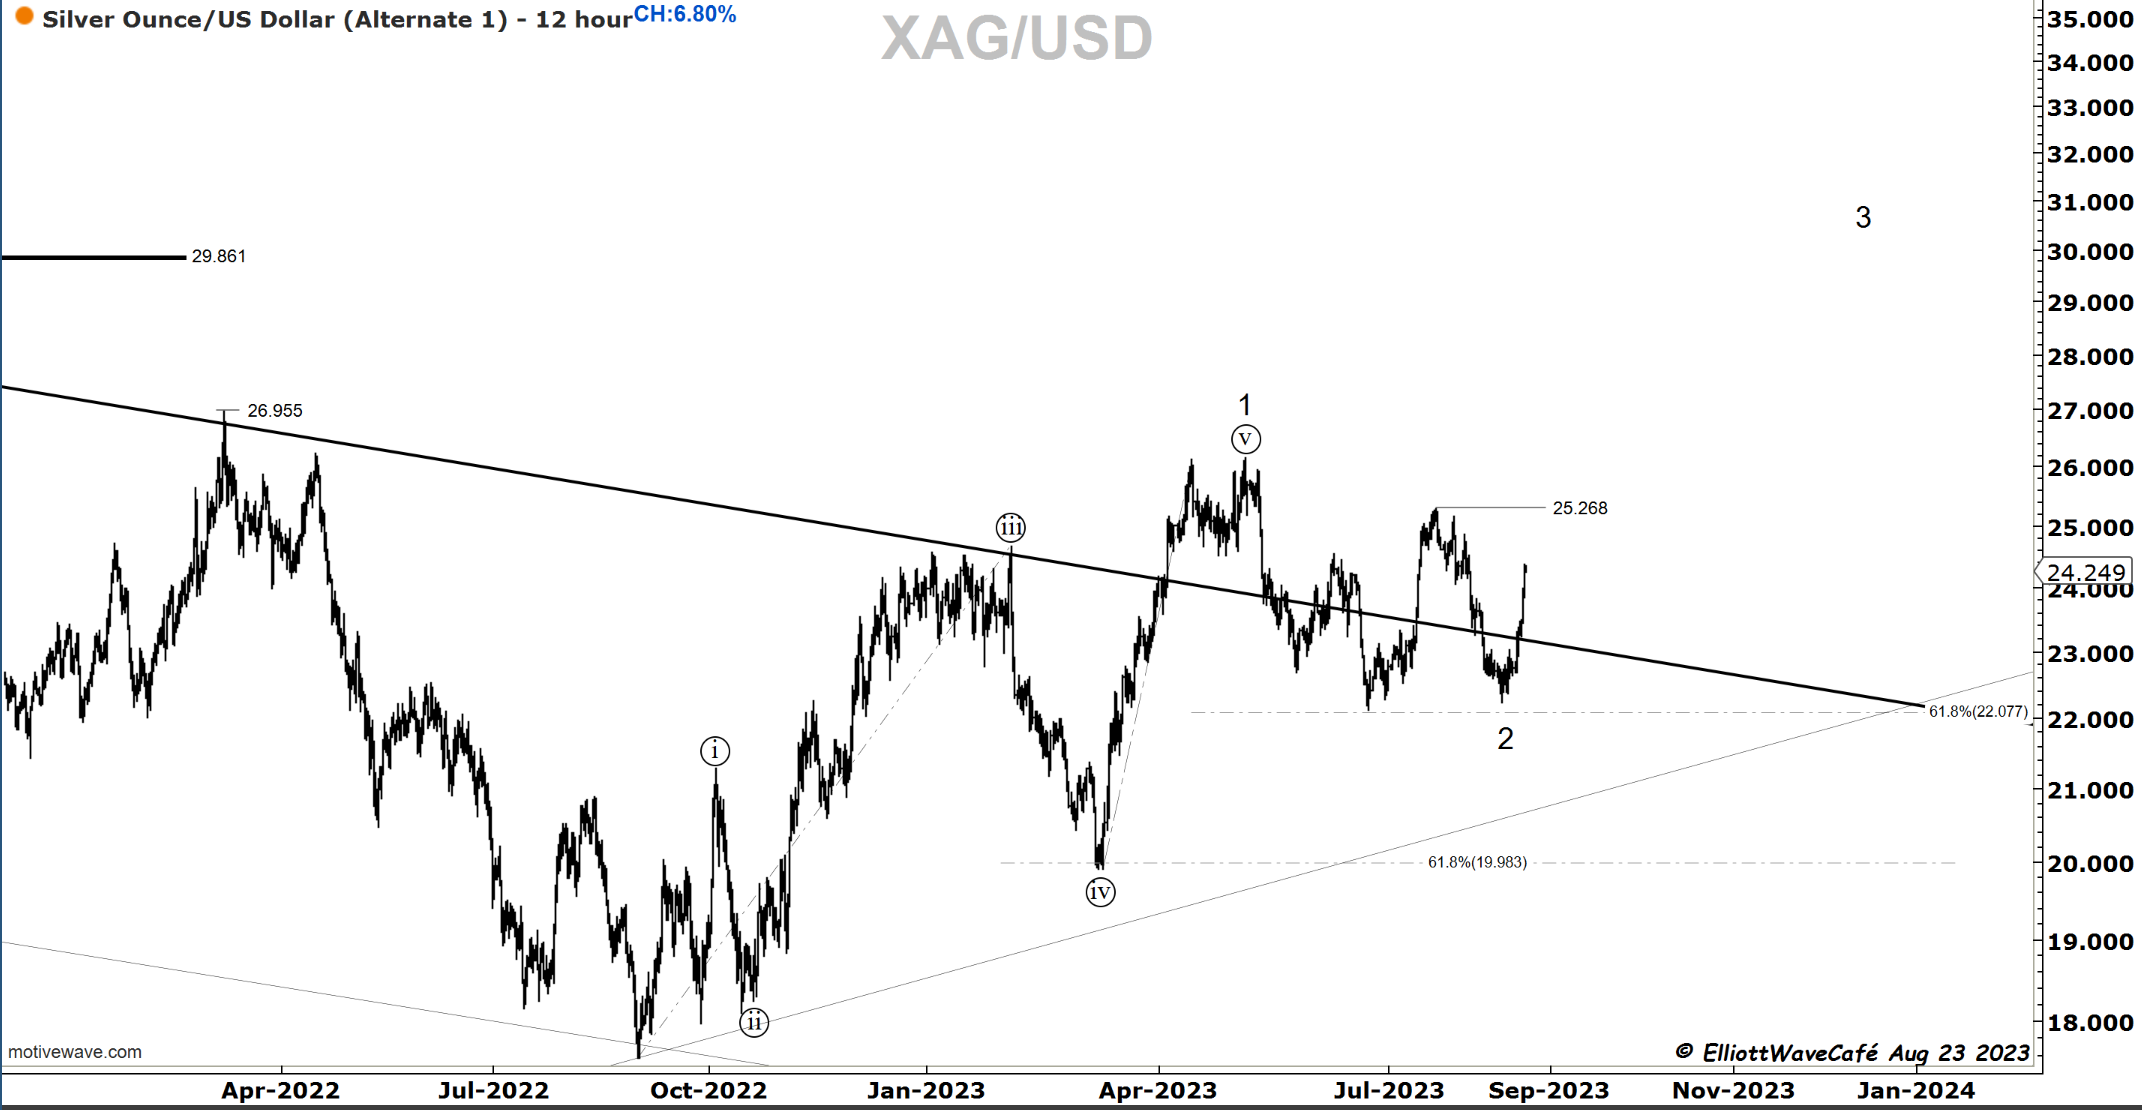
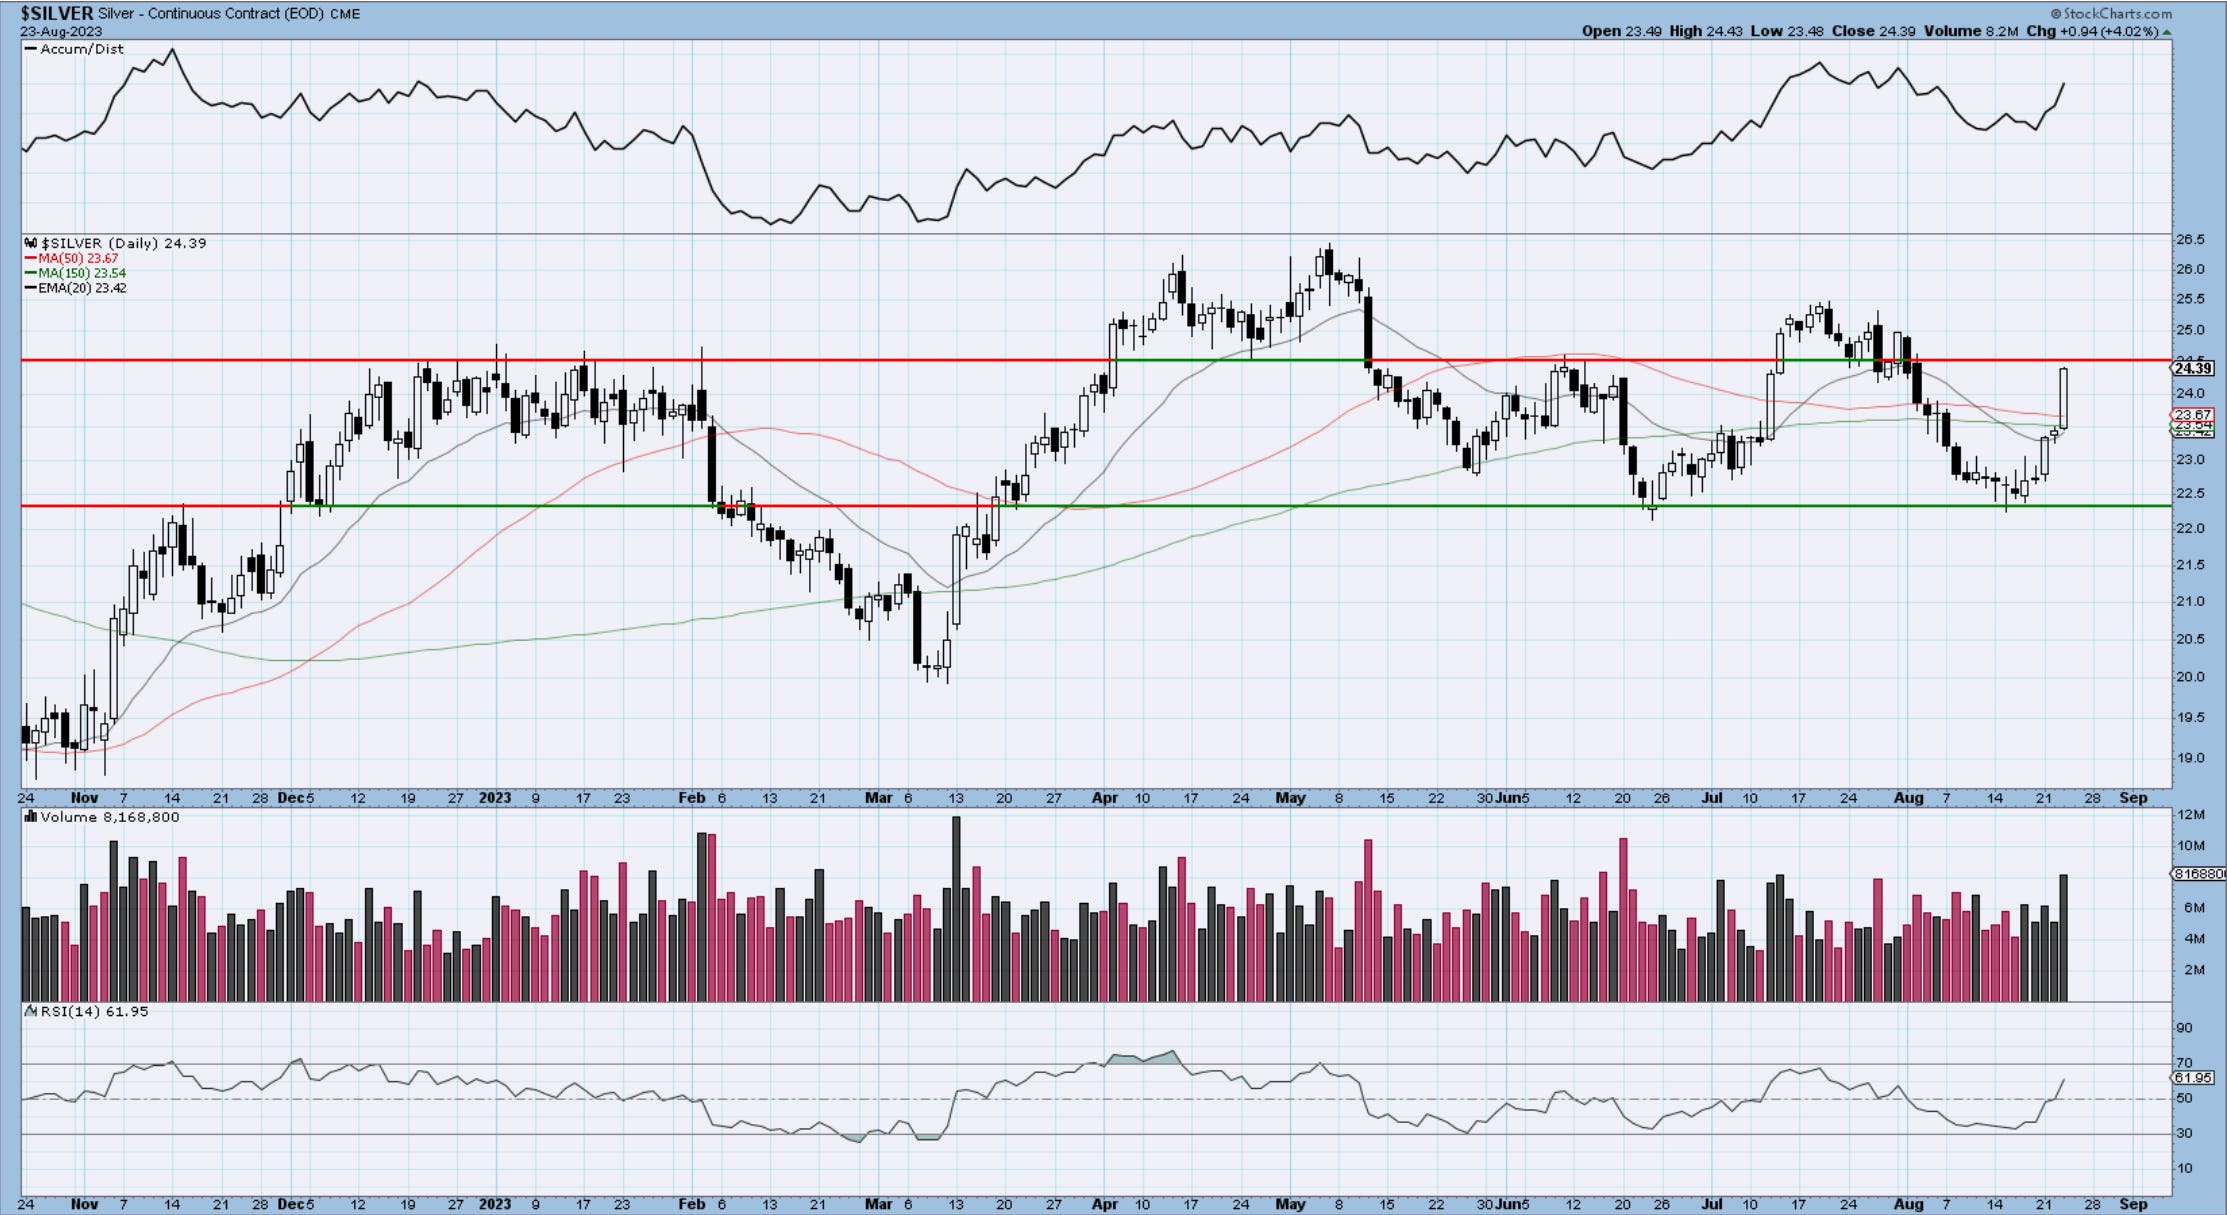
Silver
Silver is paying handsomely here with a 10% rally of the 61.8%. We’ve been all over this in prior Drip issues, since the lows showed signs of holding. Check the volume on the second chart. Hold your temper here as we’re approaching resistance, but Silver could become an even wilder horse come September. Get ready.
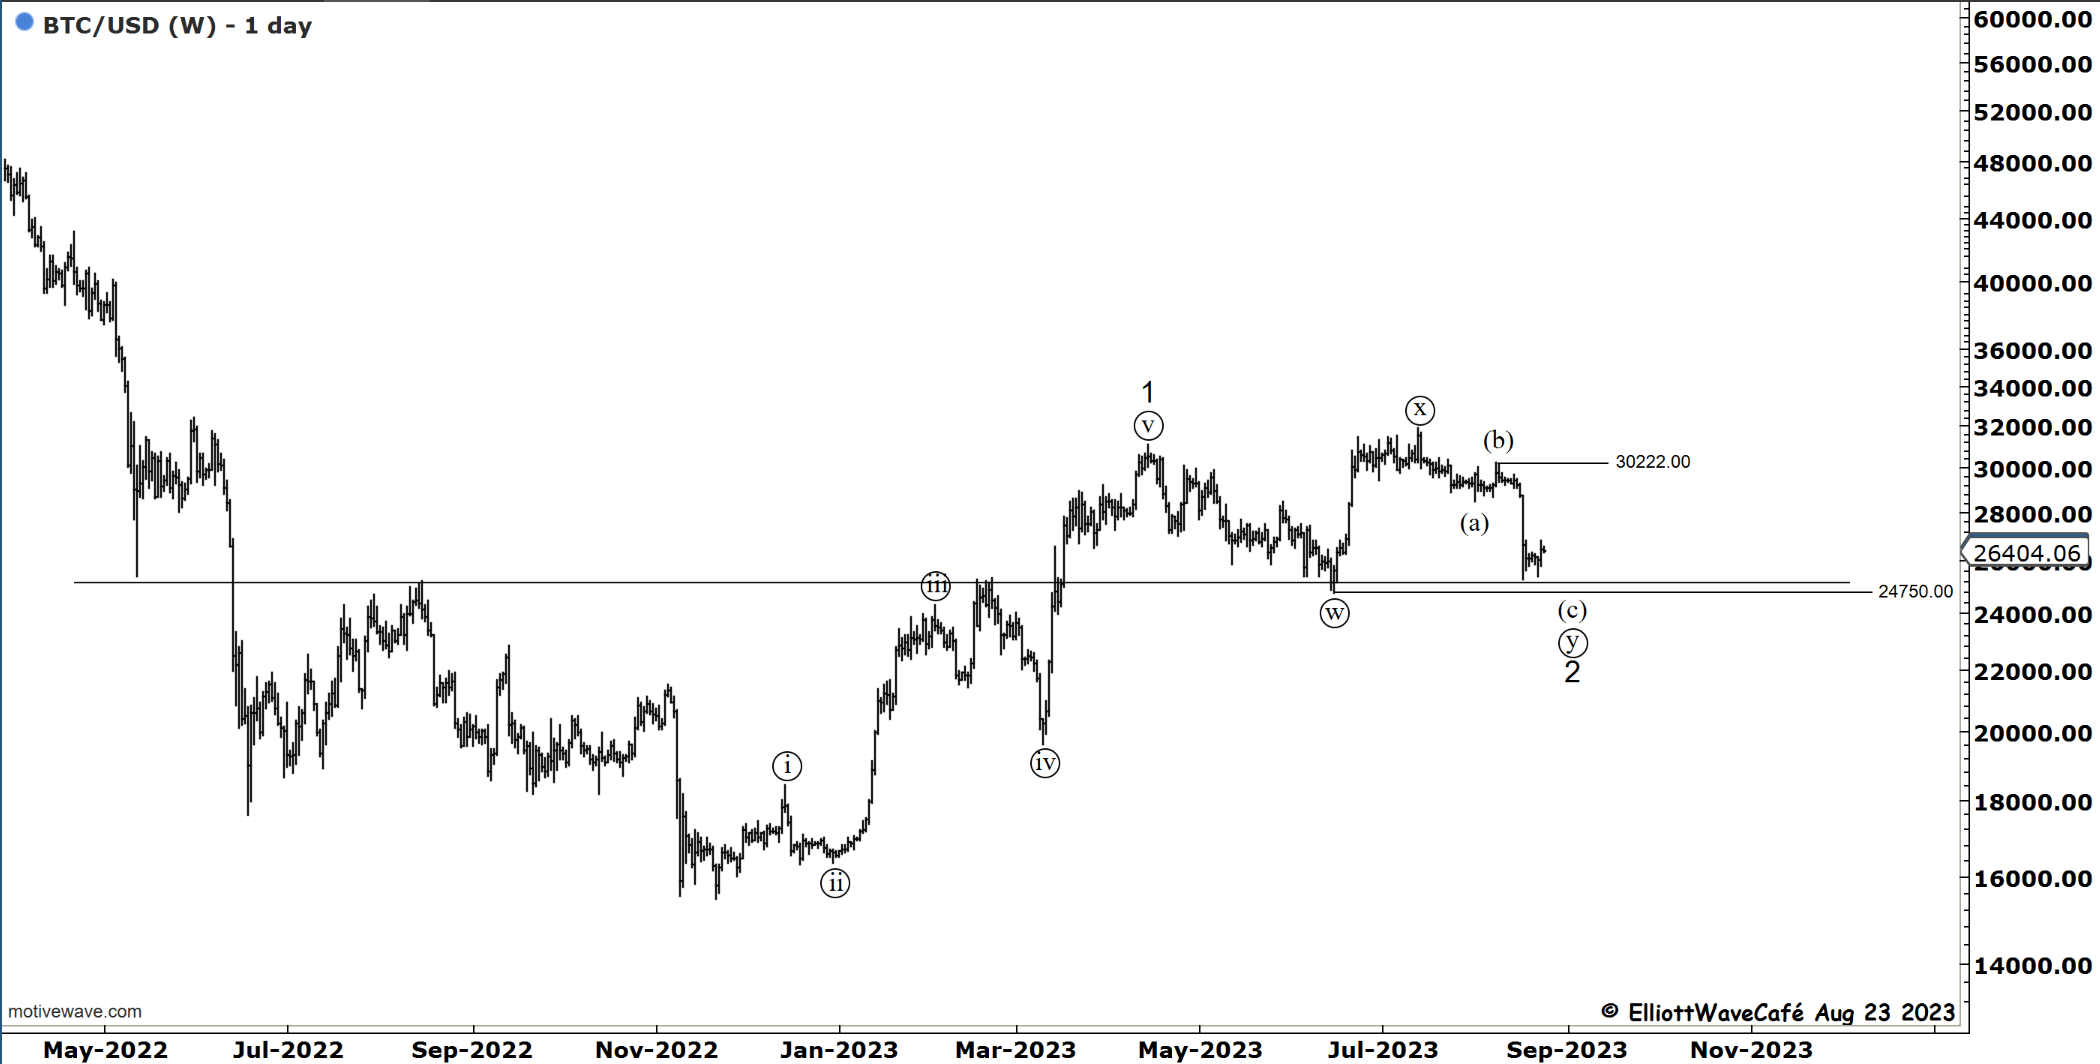
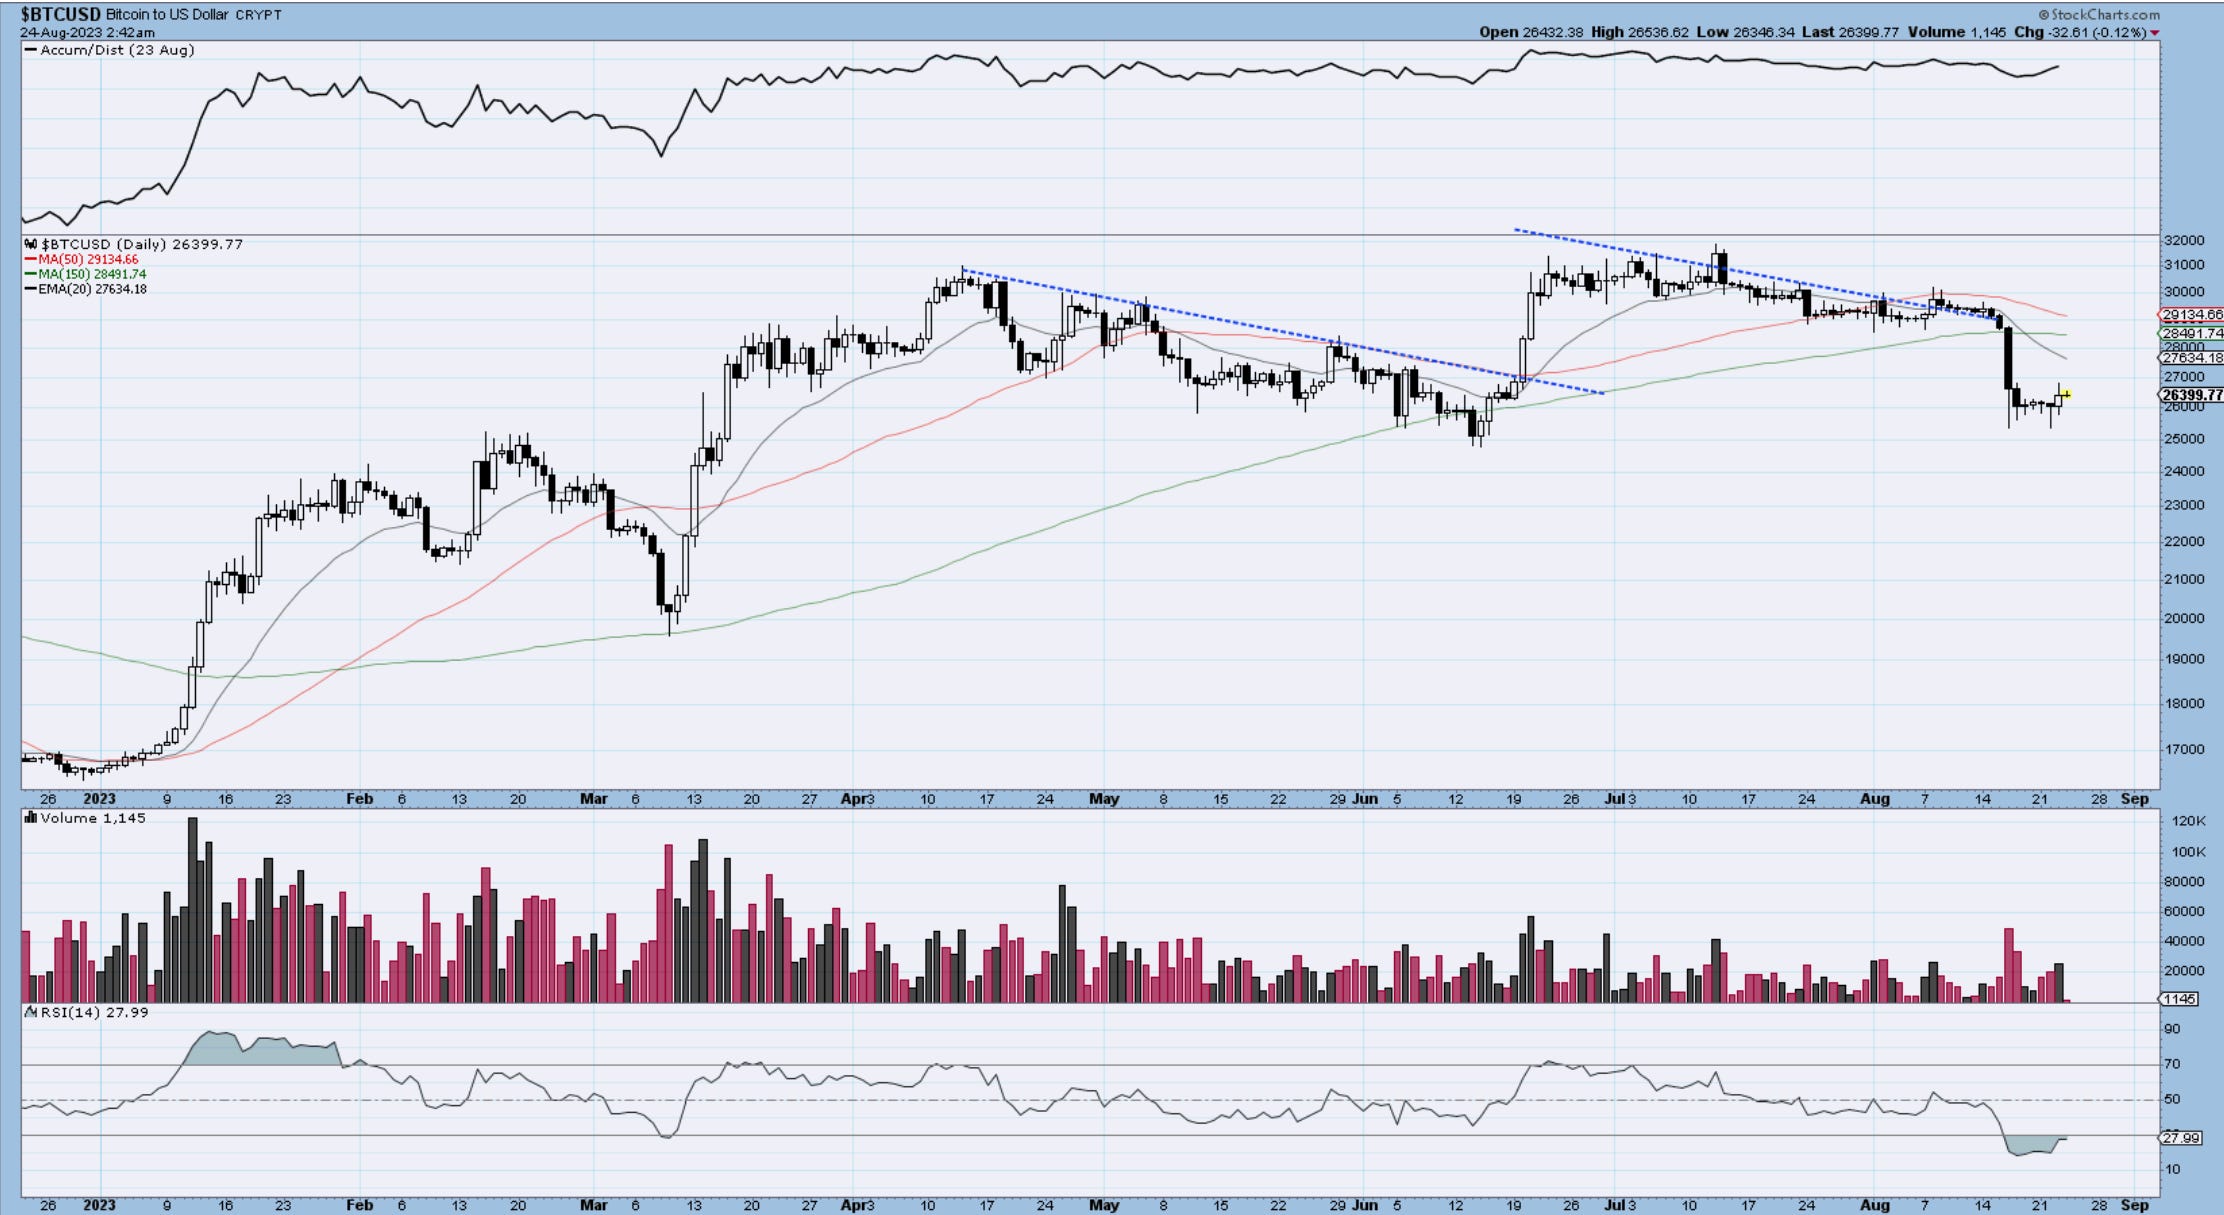
Bitcoin
I am not 100% convinced we can anchor the wave 2 low yet, but we’re continuing to hold that massive horizontal line at 24,800. The short rally appears in 3 waves, which hints at one more lower leg maybe to steal stops below support. Will see. If we manage to continue climbing and get above 28k initially, I think we have higher odds at lows and next leg higher starting. I don’t like moving averages that point down and if we don’t overtake them soon, the risks of downside pressure will continue to build. A bit more patience is required here, but as I said in prior updates, risk/reward is appealing at these levels. If equities manage to recover, I am looking to increase my long BTC exposure via BITX. GBTC had an impressive 7% rally today as well.
See you tomorrow - trade well,
Cris
email: ewcafe@pm.me