
The Daily Drip
Core markets charts updates and commentary
Note: The counts on the right edge are real-time, and they are prone to adjustments as price action develops. Elliott Wave has a fluid approach, is evidence-based, and requires constant monitoring of certain thresholds.
In the counts below, this (( )) = circle on chart
SP500
Quite a rollocoaster today. The session started weak with a lower gap and early weakness. The market felt heavy coming off the weekend and after the tensed closed on Friday. Twitter even had the hashtag #blackmonday running. It was poised for a short squeeze which took place roughly 15 min after the open. It continues until noon, at which point we reversed more about half of the day’s gains.
In the chart below you can see the massive support at 4200 and the attempted hold today. The volume and volatility have been obviously growing here as we’re into the last innings of October. Thr RSI has not entered oversold just yet and it’s actually a touch higher then early Oct drop.
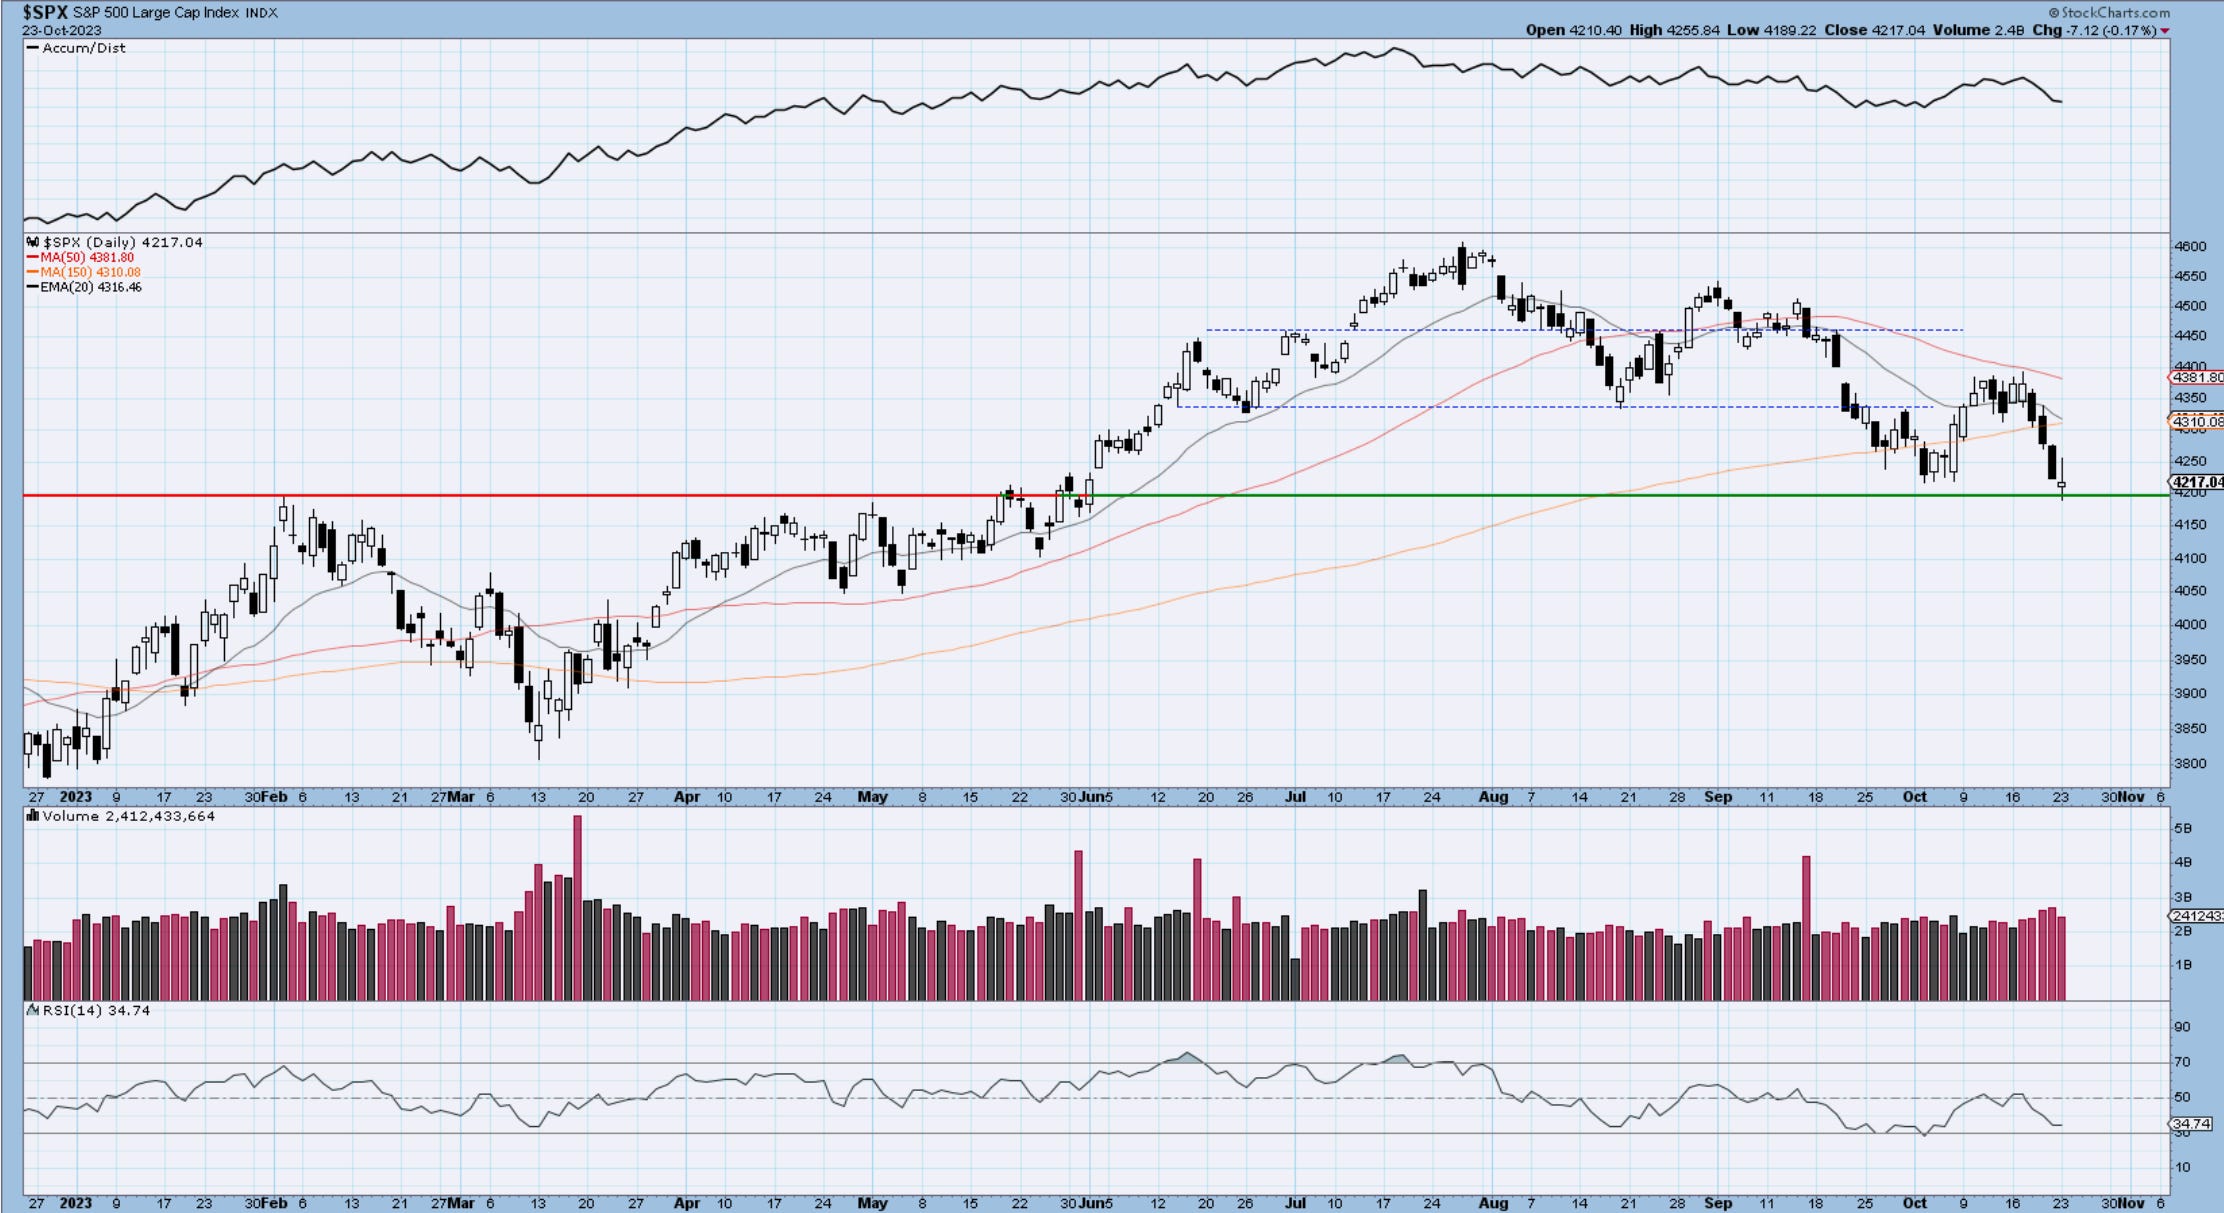
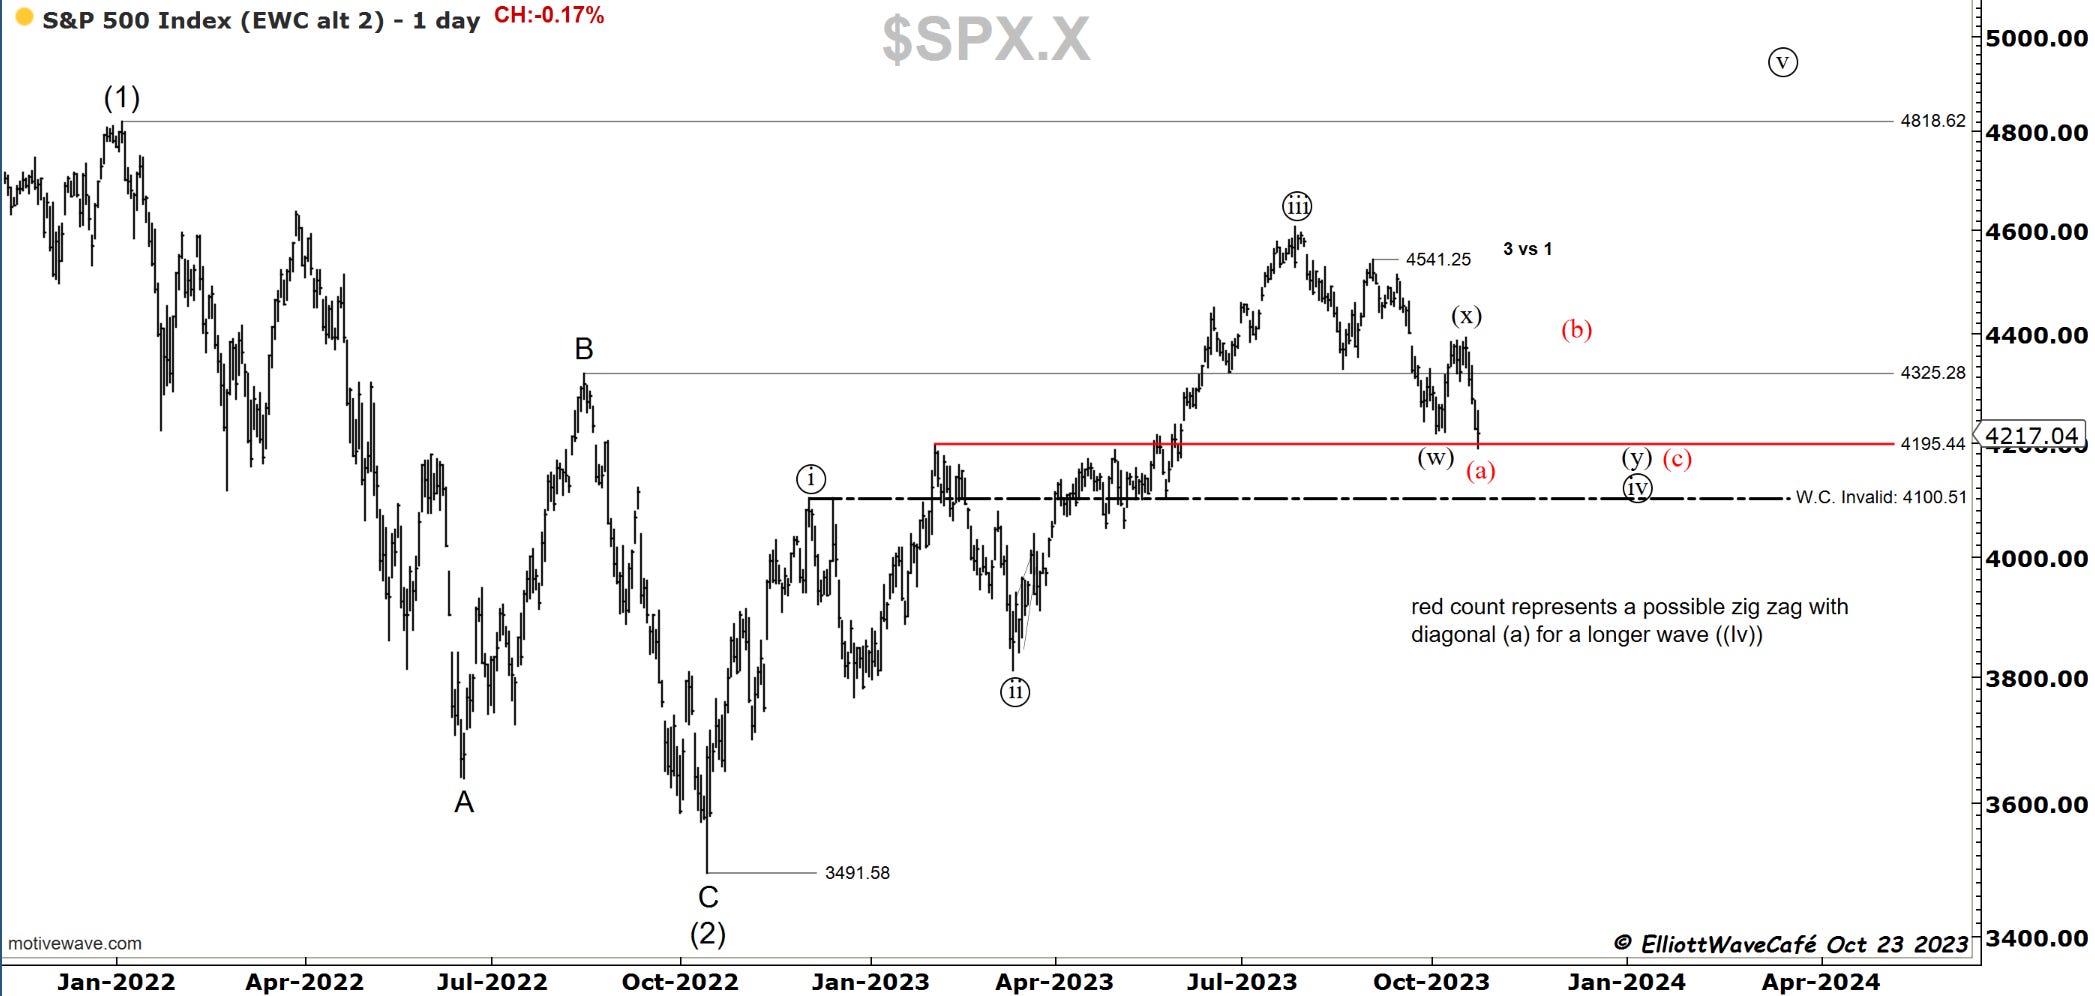
The Elliott Wave corrective count is now suspicious with the the drop below early October low. Under the ((i)) ((ii)) flat count, wave ((iv)) is still alive and deserves the benefit of the doubt. The only problem is that a 5 wave decline cannot be corrective, which means that to become one we need 2 more legs to unfold. Either b and c of an (y) wave, or (b) and (c ) of a zigzag with wave (a) being a leading diagonal due to overlaps. If you have missed my video on the SP500 from Saturday here is the link .
A drop below 4100 nulifies both and opens the path for an attack to Oct ‘22 lows.
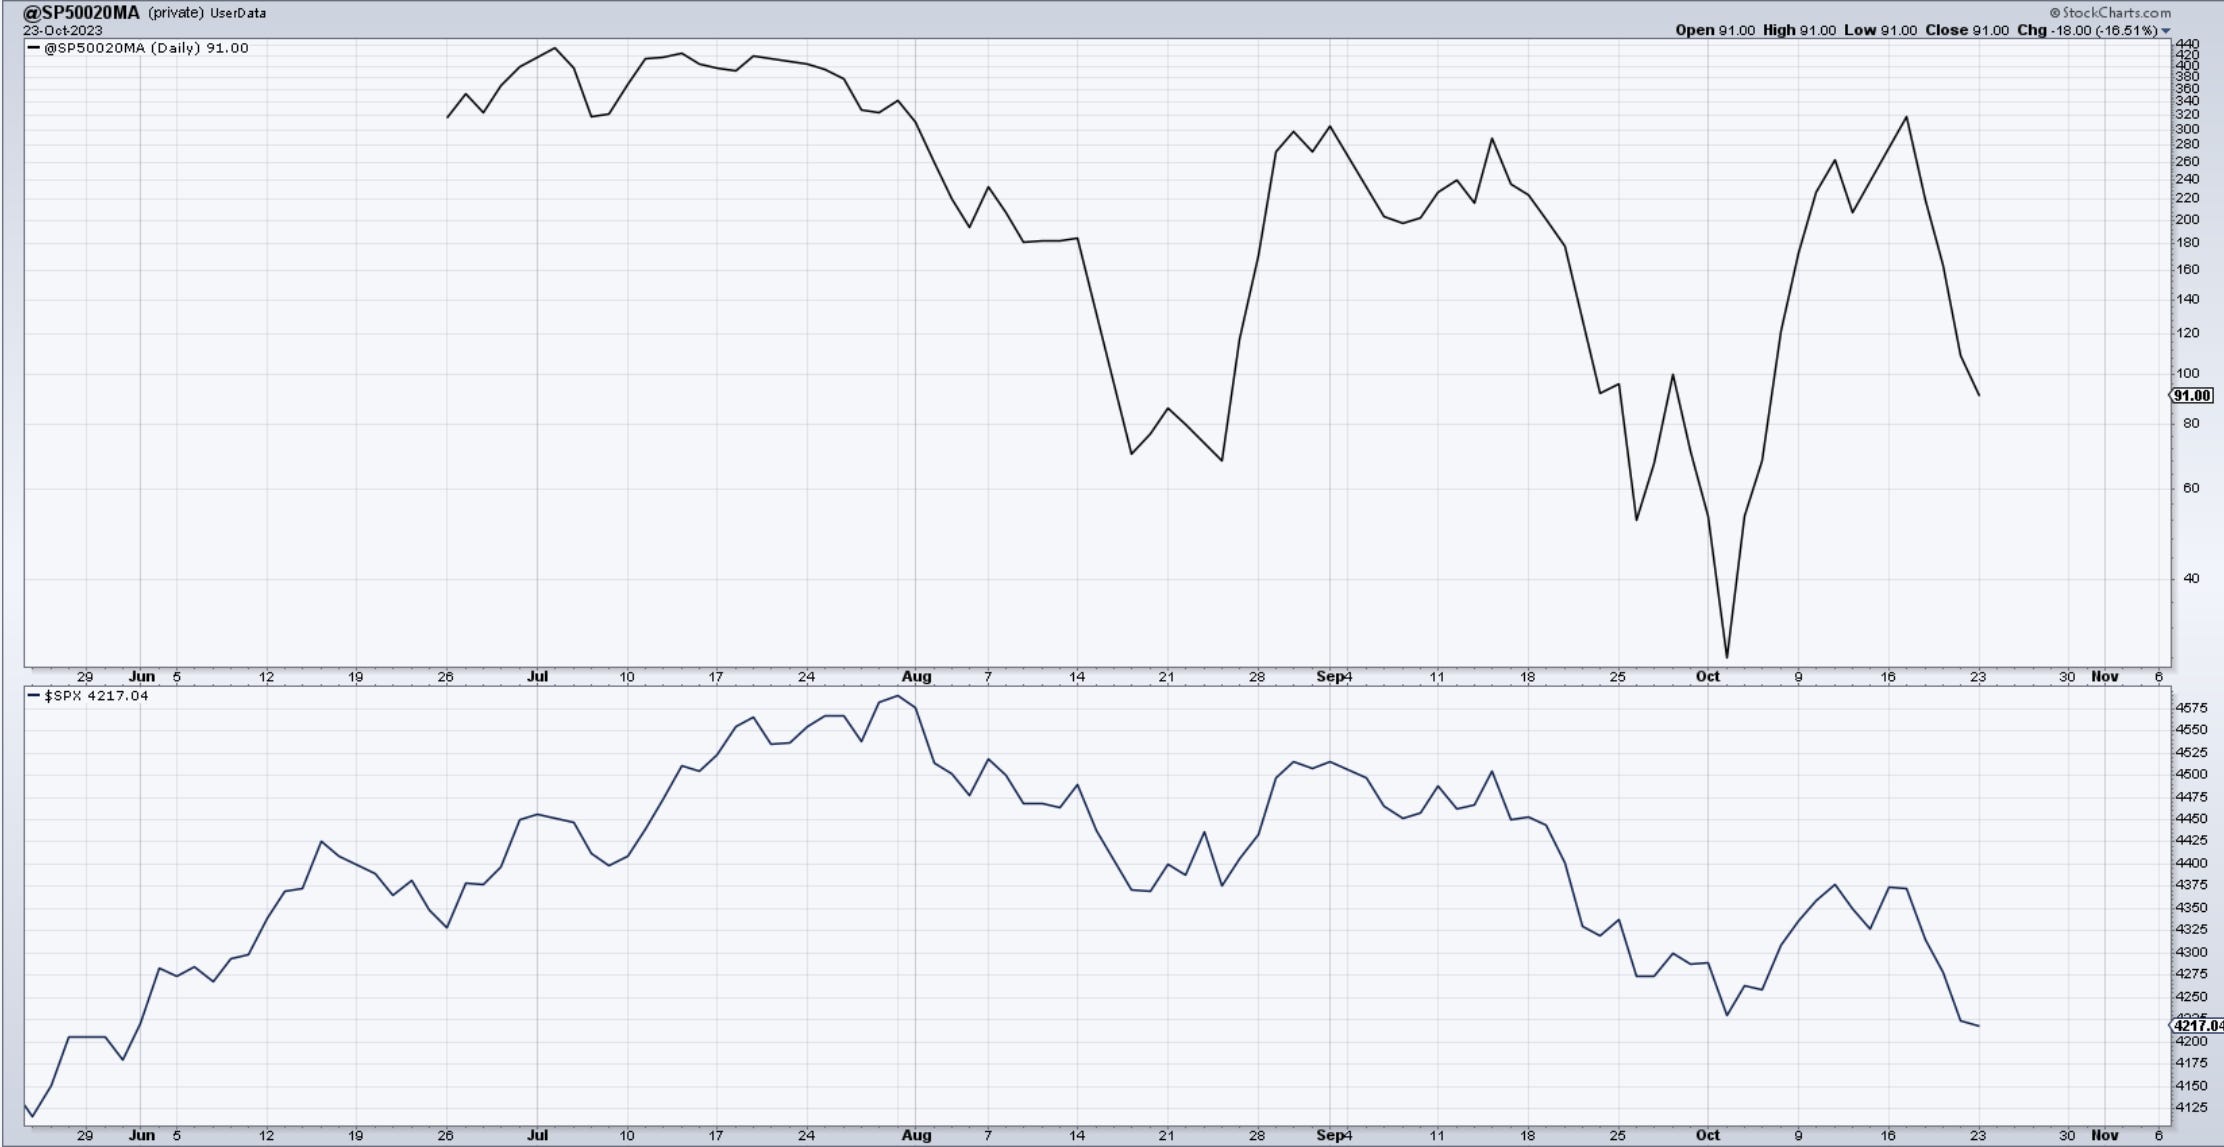
Pls take a look at the chart below that shows the number of stocks above their 20day MA in the SP500. Notice the divergence between early Oct low and now with the index making a new low. I think this speaks to underlying strength and refusal of some stocks to continue declining.
Notice also the VIX losing ground as well on the attempted move lower.
Here is once again on the failed trip above the 21 levels. We’re not out of the woods but a 6% decline today is pretty significant.
In conclusion, the price traveled lower, but it should be losing momentum. There are some heavy earnings on schedule for this week and with positioning being short we could have a catalyst for further upside squeeze if those come in strong. I would be reducing exposure as a bear into these levels given the mentioned factors. I will discuss below, but the Dollar has also sold of today along with a nice BTC rally. The seasonality should be a positive factor until year end.
Nasdaq100
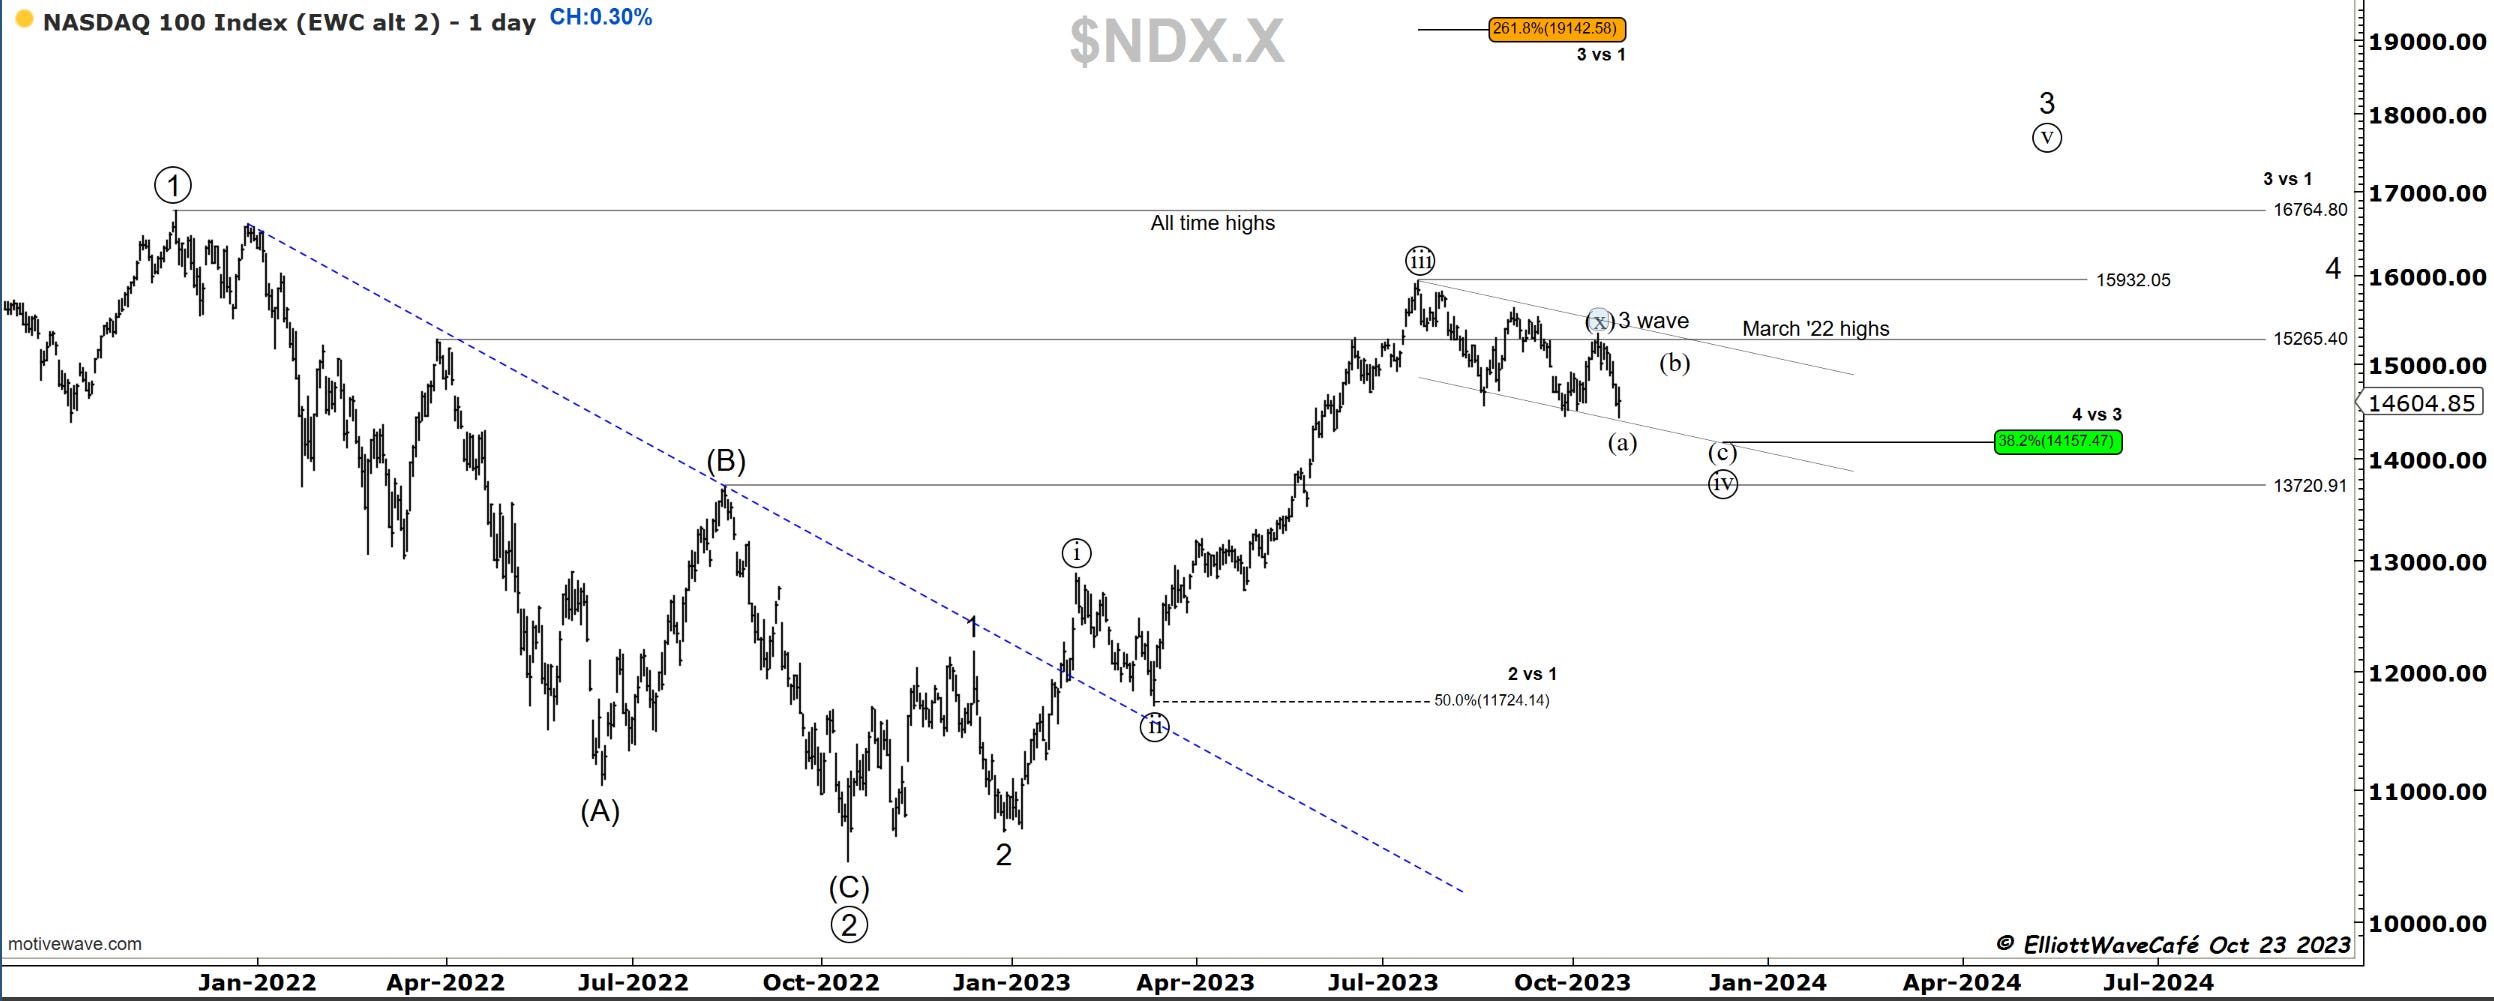
Nasdaq was actually positive today after the initial 15 min drop. Here, the count is cleaner and has room to merge more complex.
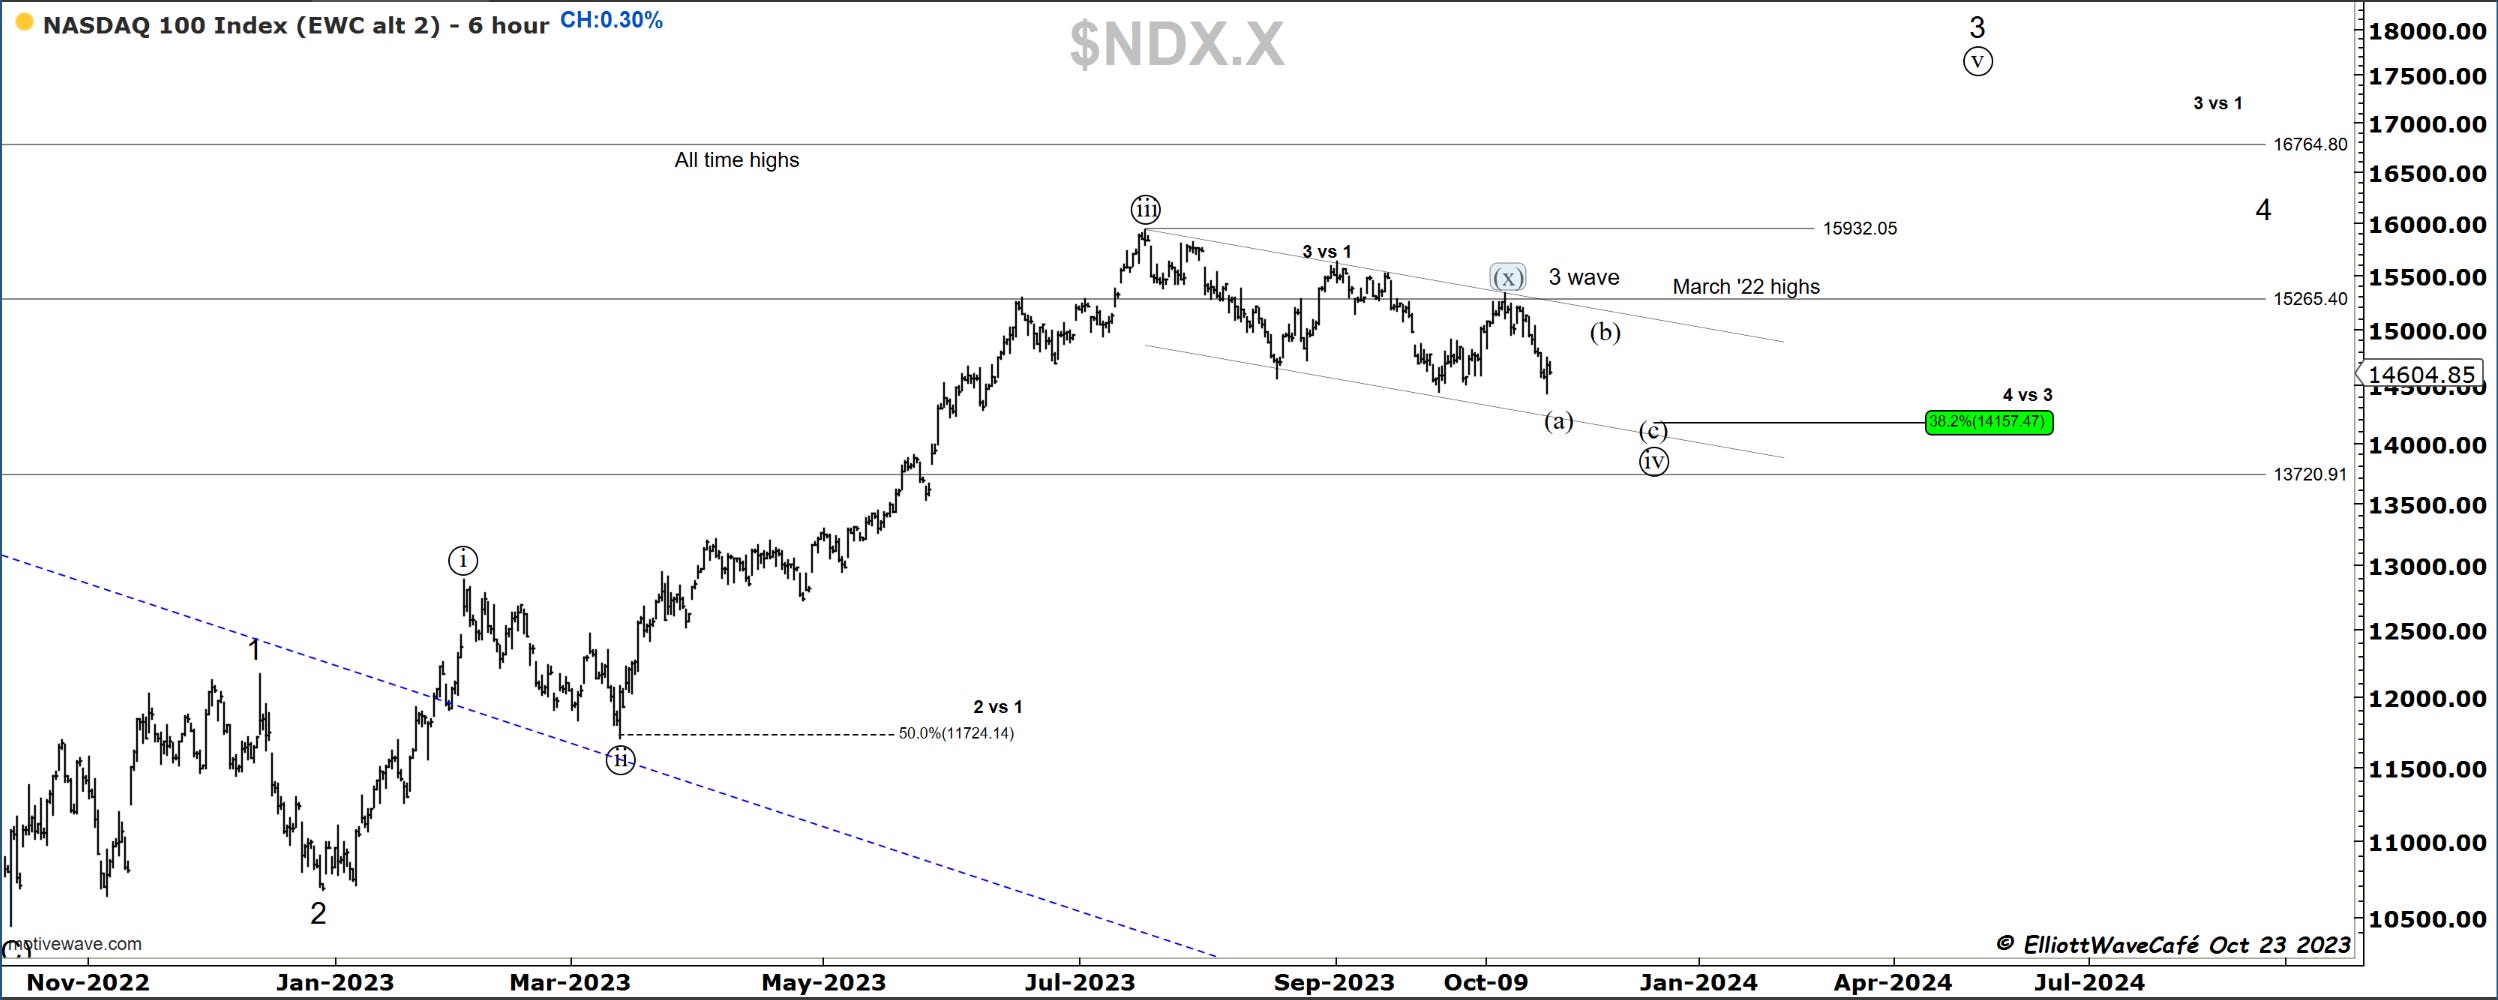
Just like in the SP500 a 5 wave decline here could be a leading diagonal which still requires a wave two pullback before resuming lower. I will present that alternate when appropriate.
RUSSELL 2000
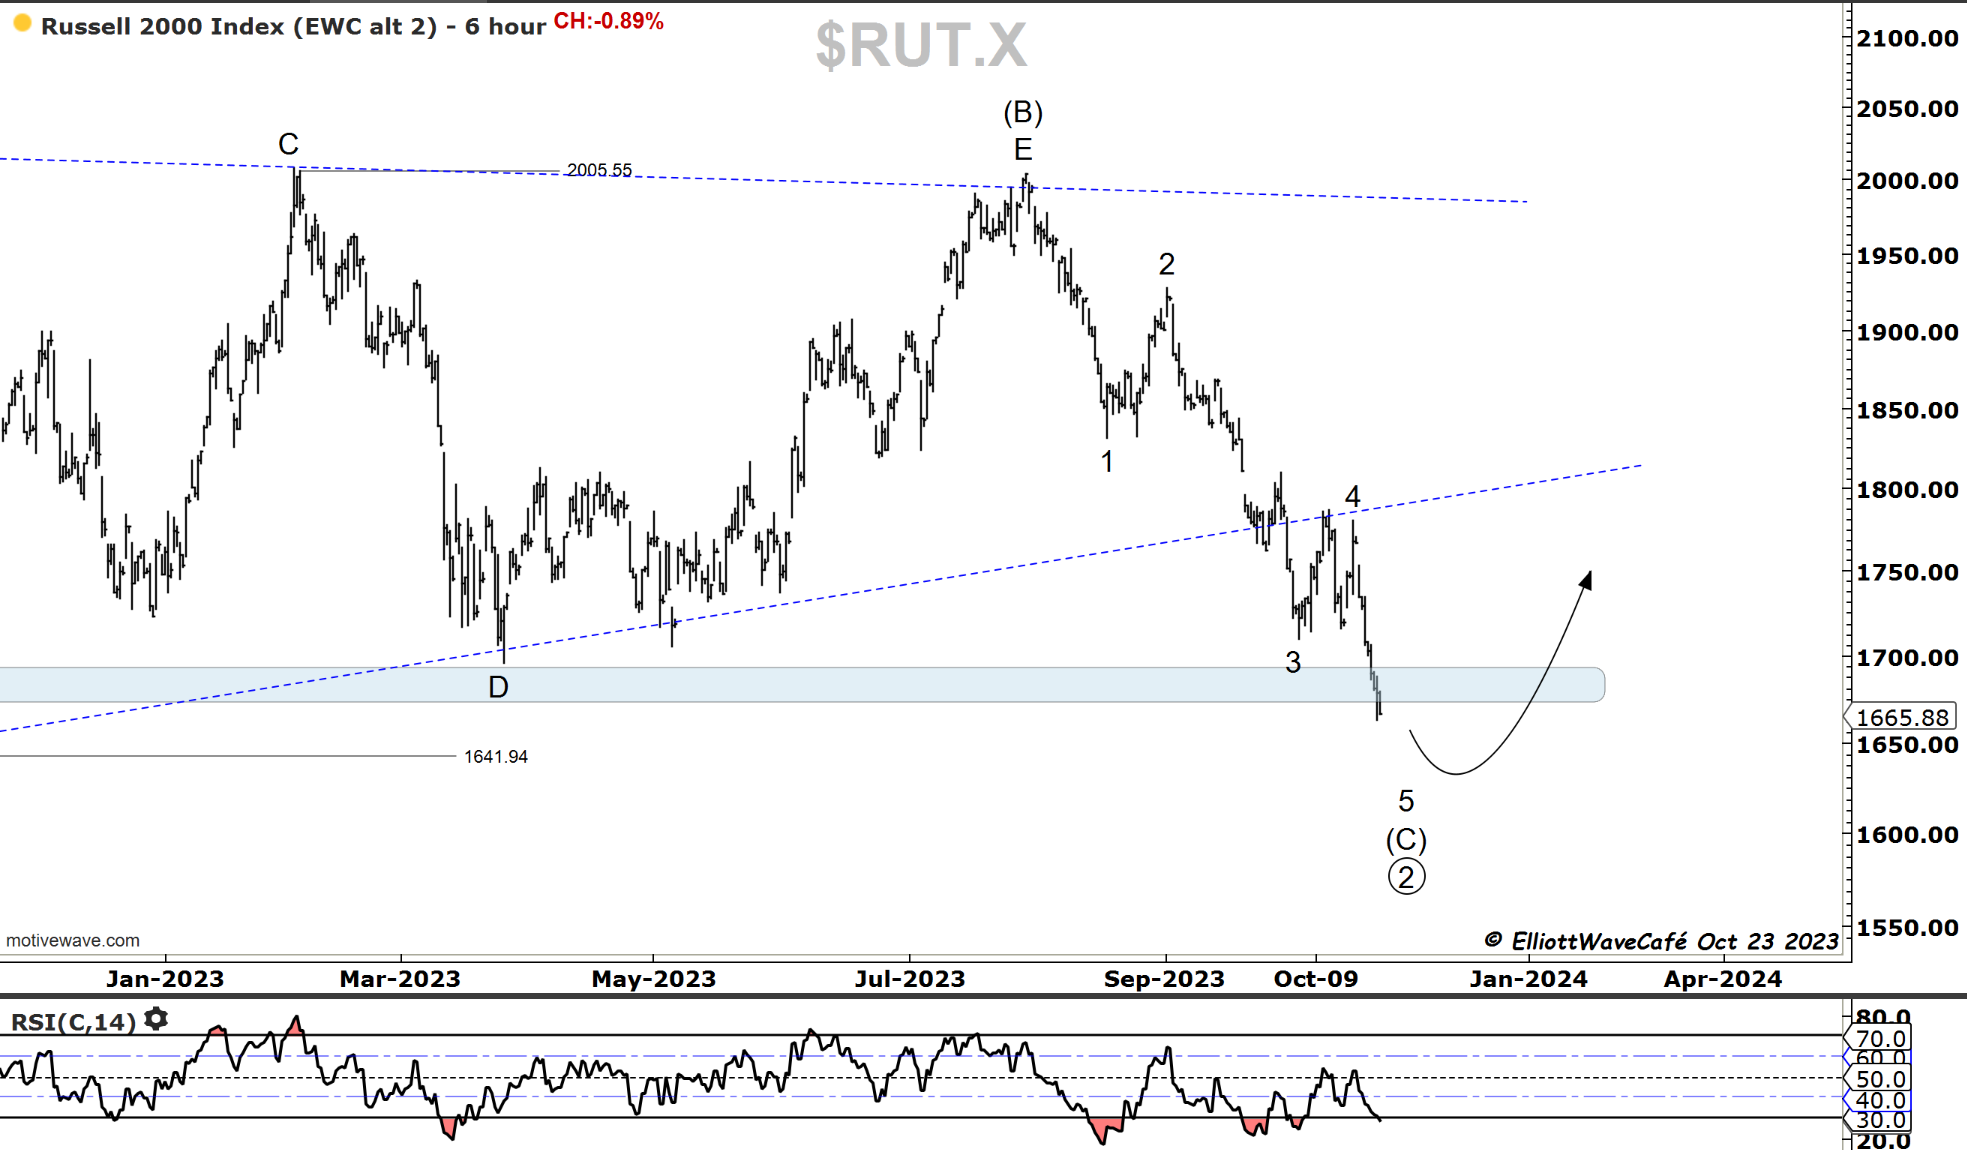
Russell should be close to completing its 5 wave decline.
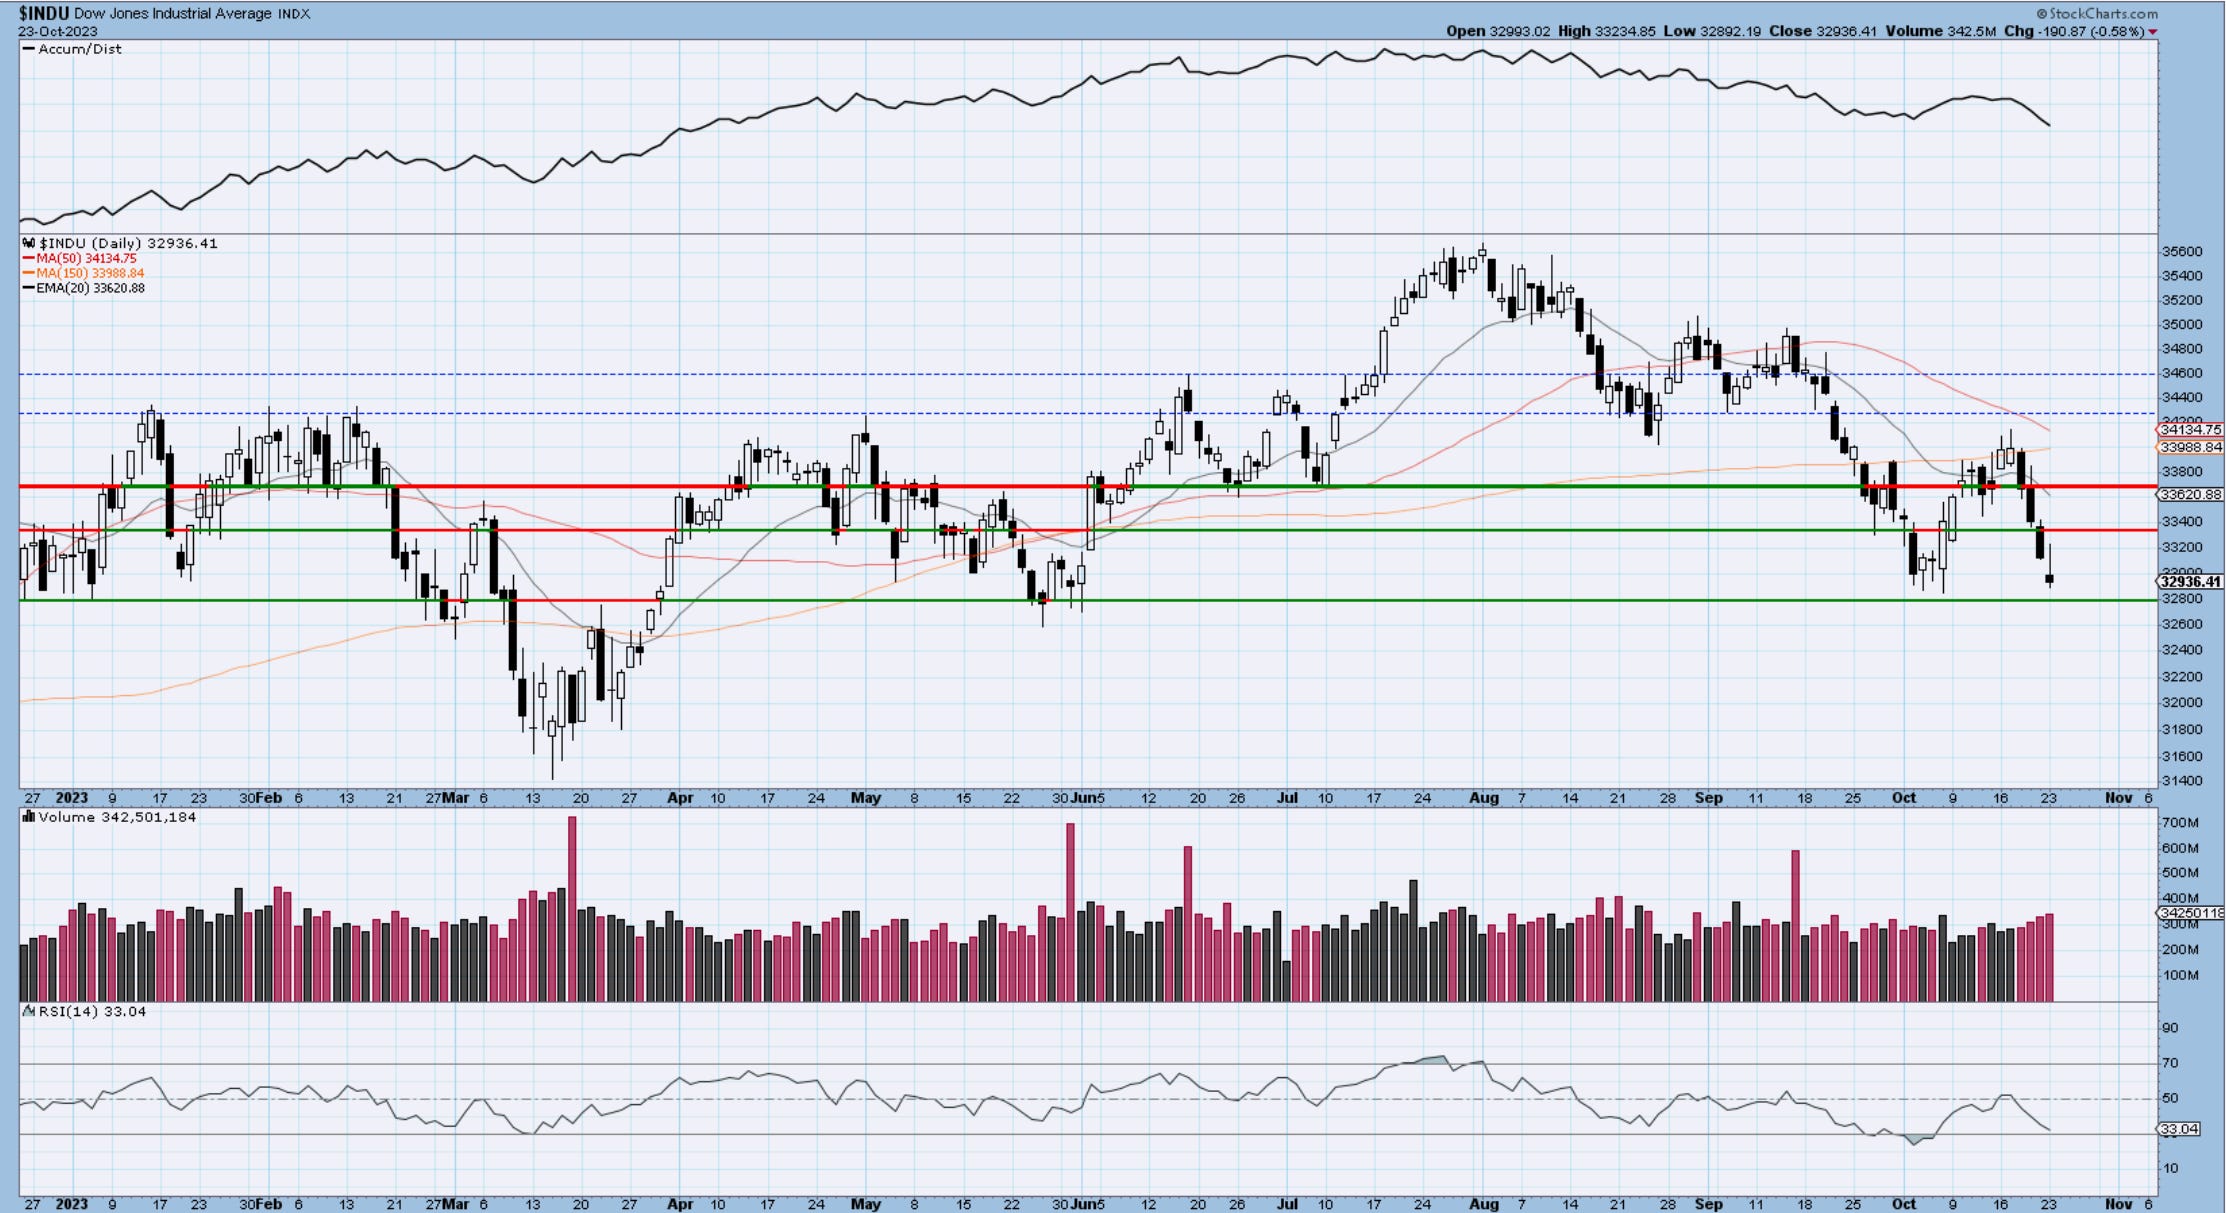
Dow30
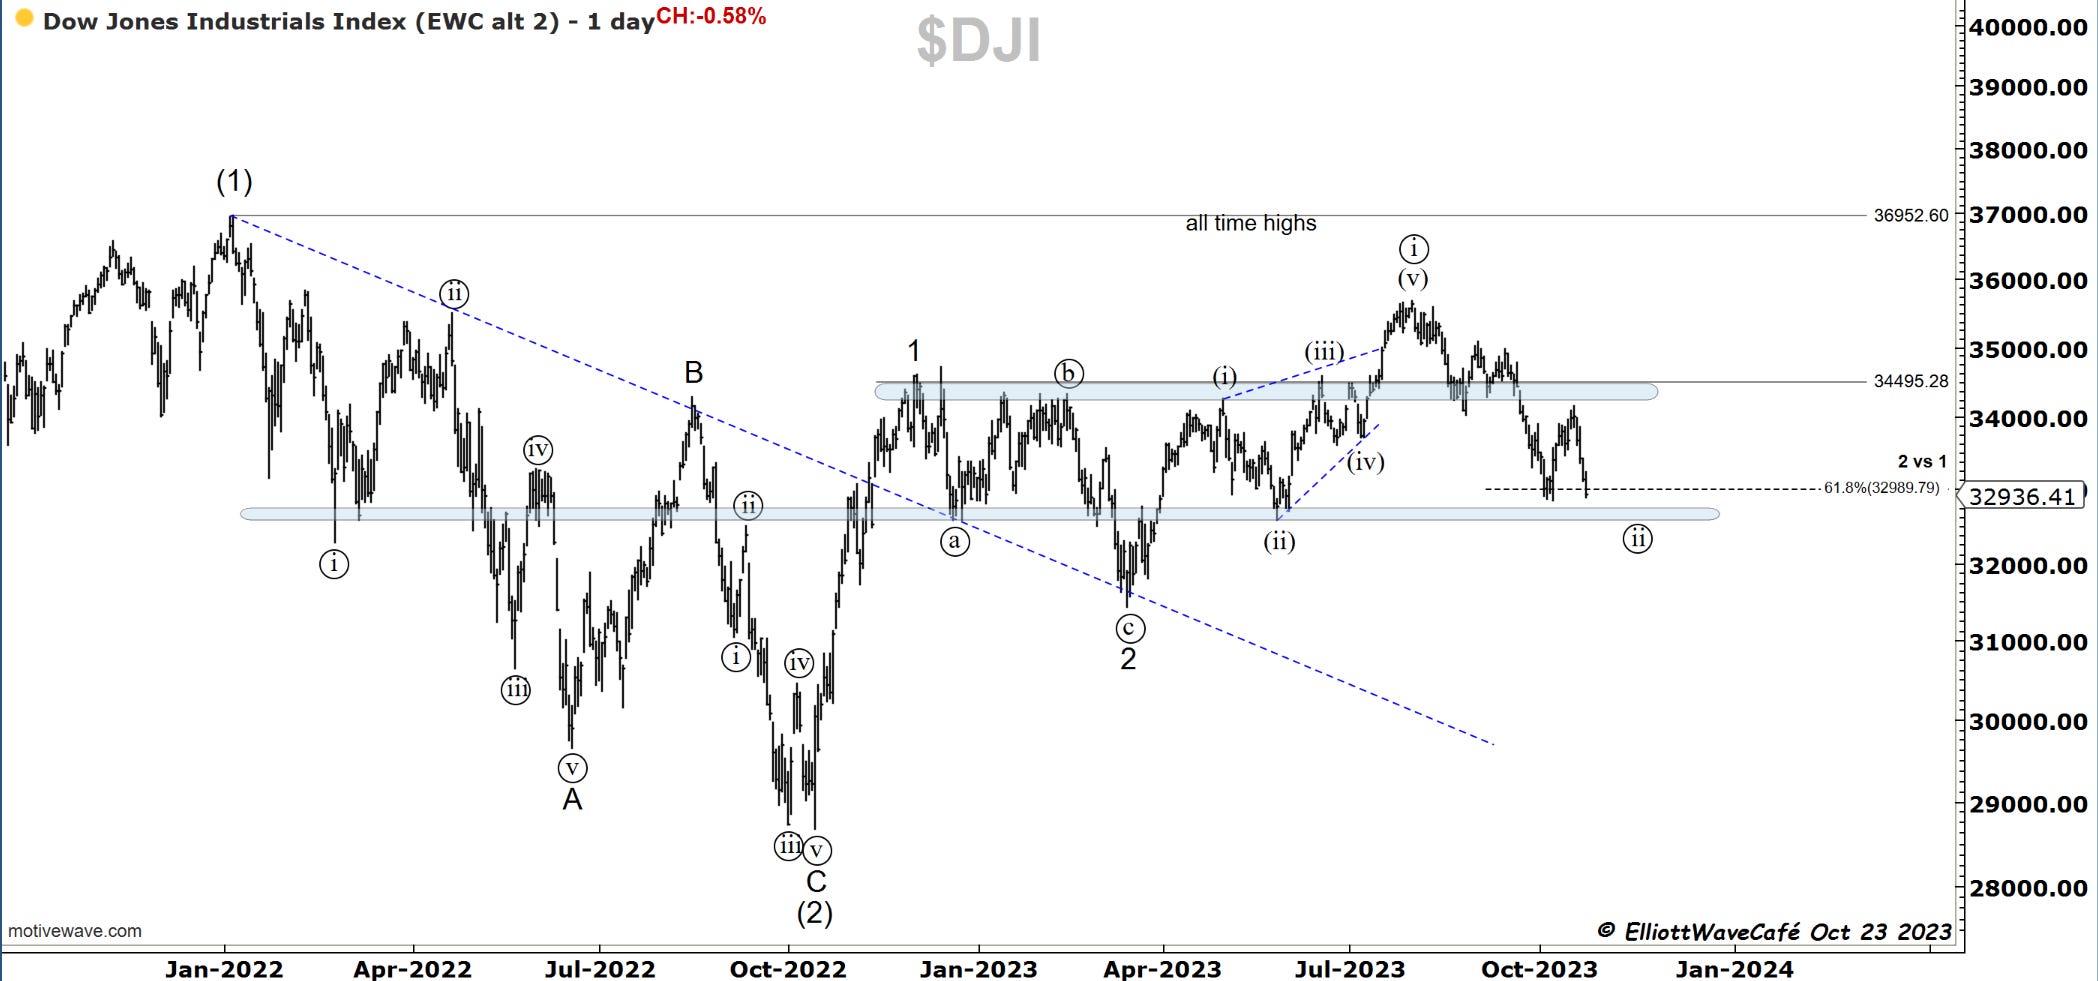
Dow Jones it’s trying to hold the 61.8% and just above a good demand zone. Not sure how to label this a wave ((ii)) with the appearance of a 5 wave move. There the flat variant where wave 2 on chart is wave A of a flat , wave ((i)) top is B and current decline is C in a much larger wave 2. It’s a stretch but something to work with in the event we rally and overtake 35k. The range here is pretty massive.
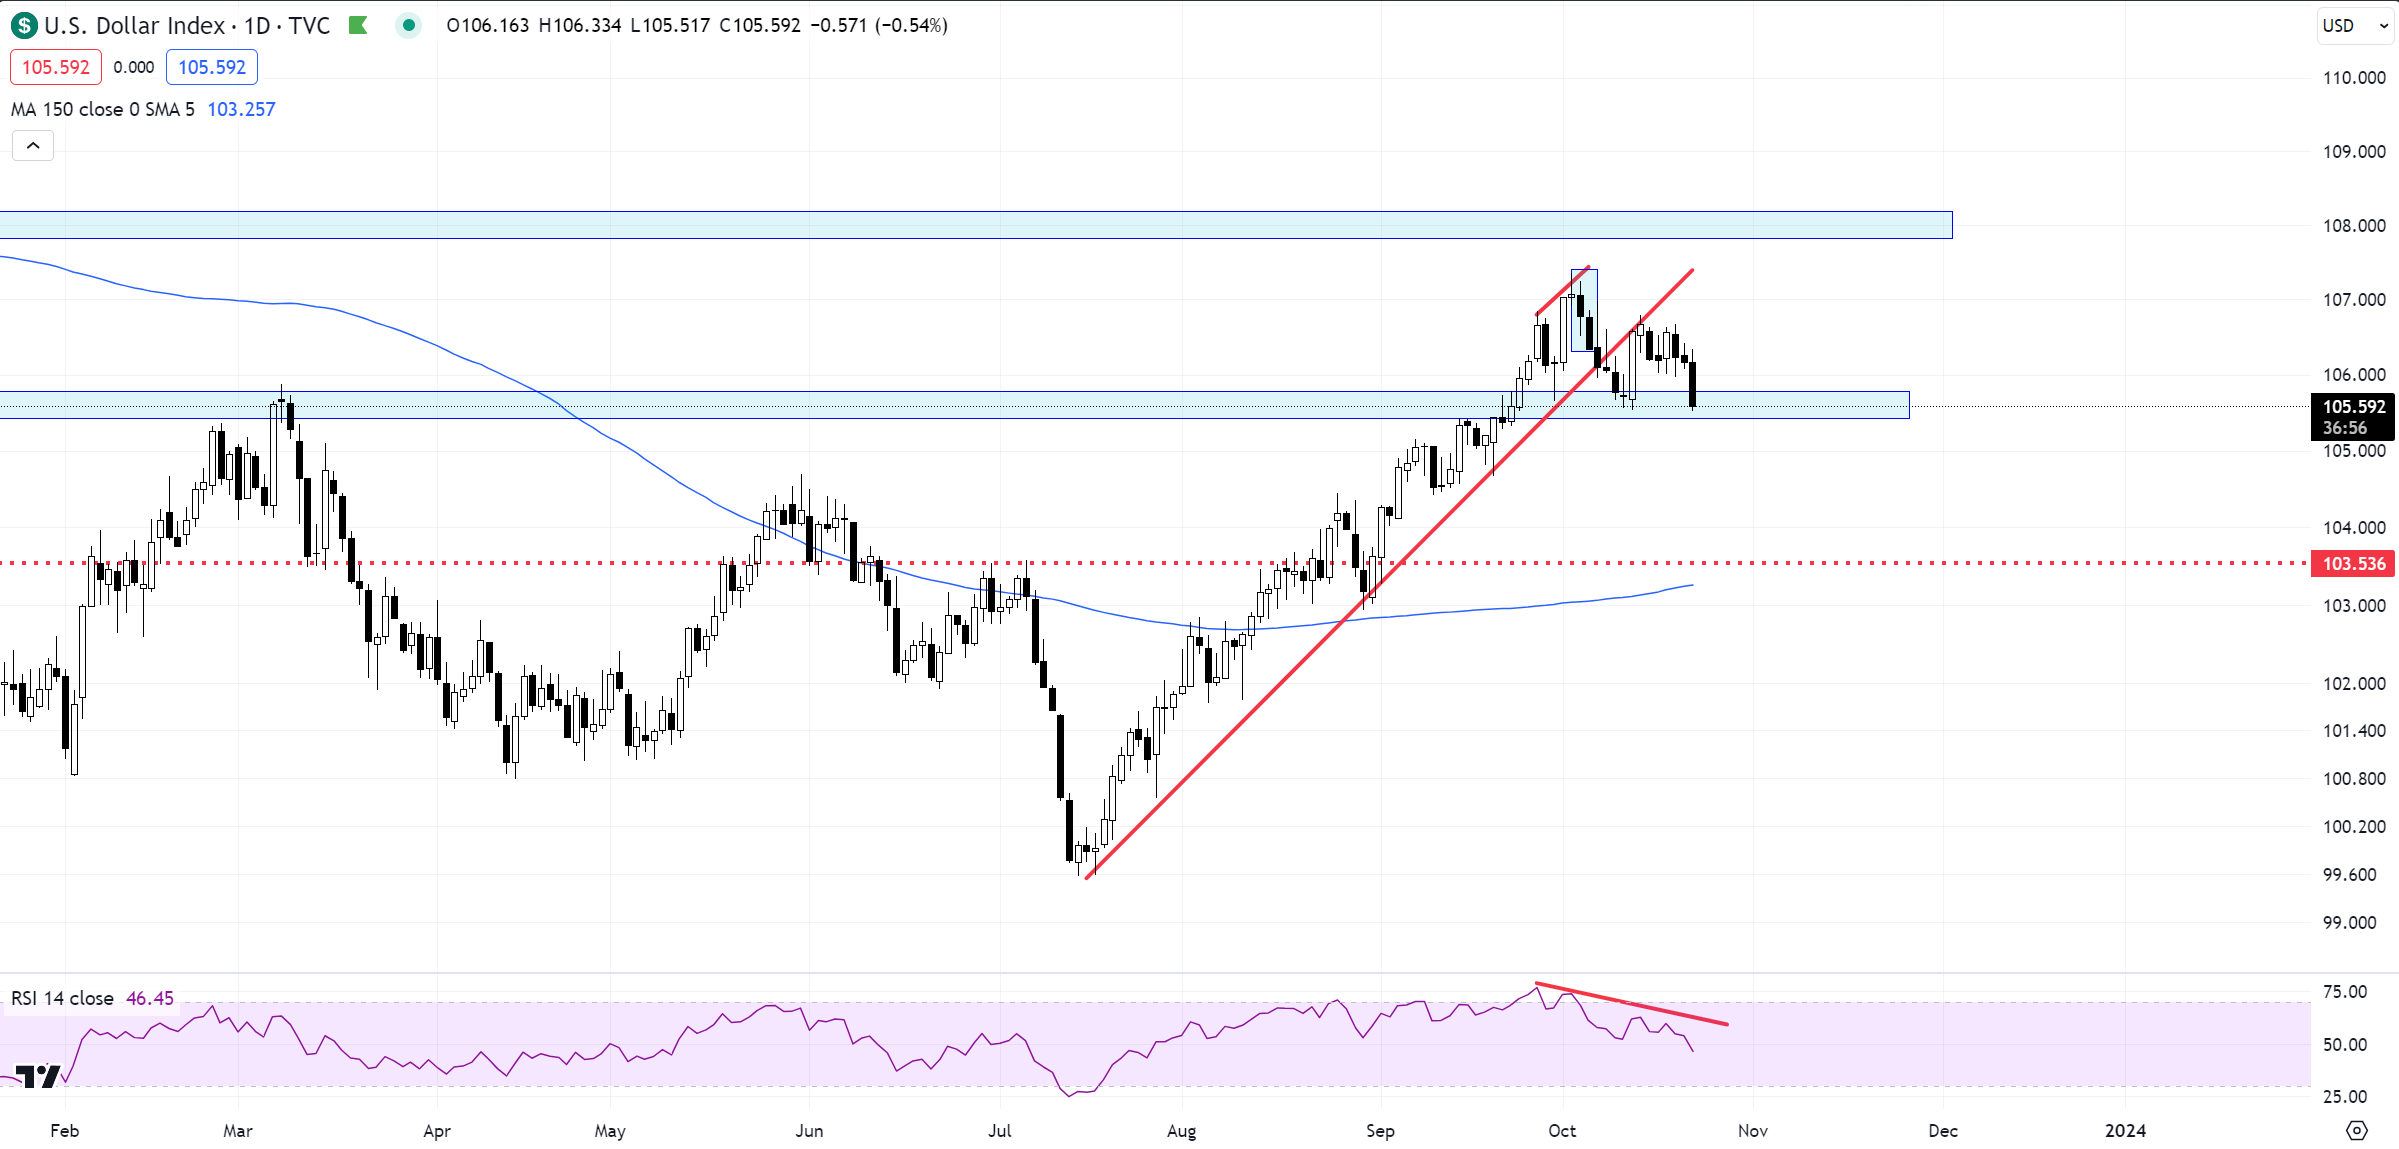
US Dollar and Yields
The dollar never bought the equity selloff and broke the correlation on risk quite a few days prior. It’s not to say that it cannot revert from here, but the way it’s been acting is not really suggestive of that. The first risk is an ABC decline, so extending past 104 lower would indicate impulse in my view. A weak dollar should be positive for risk assets, it’s just a matter of time to line them up.
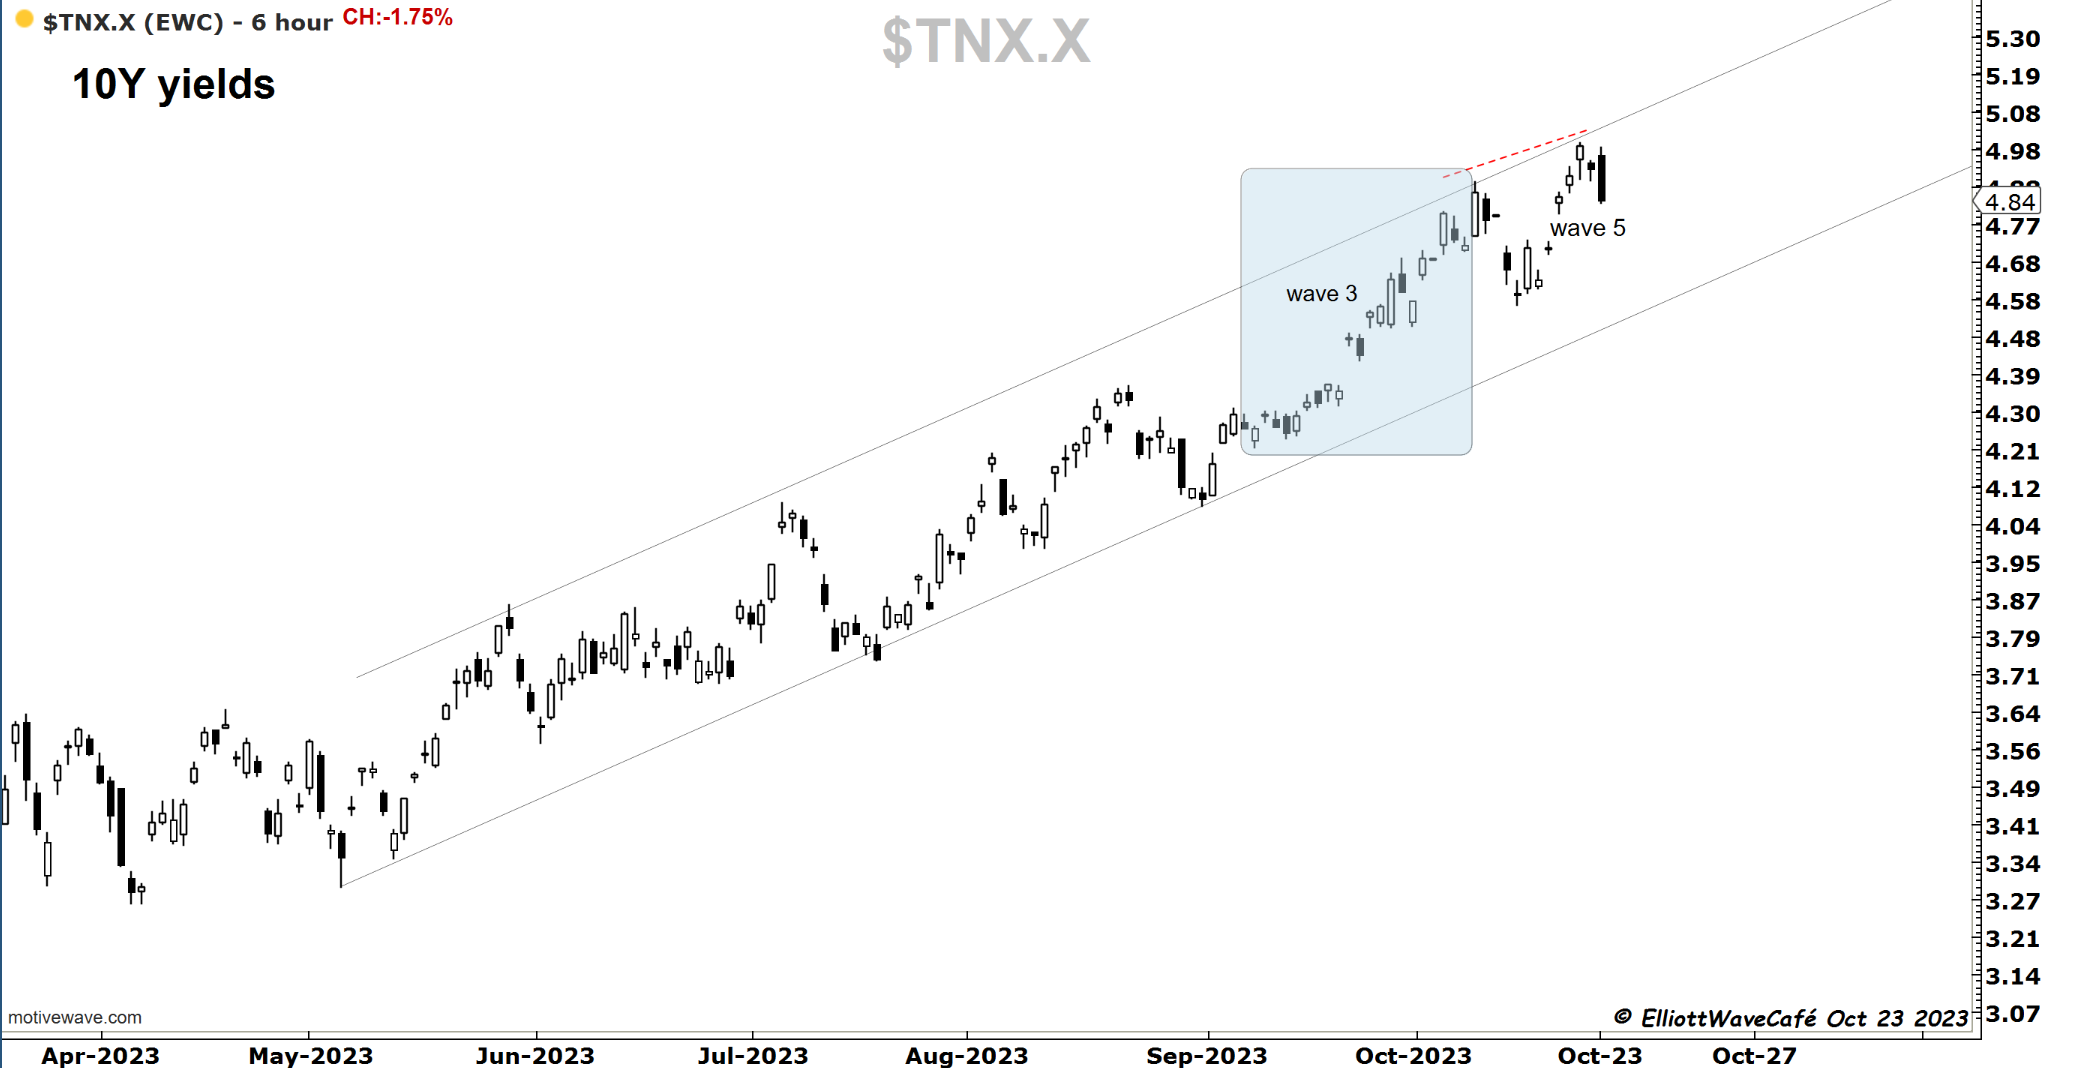
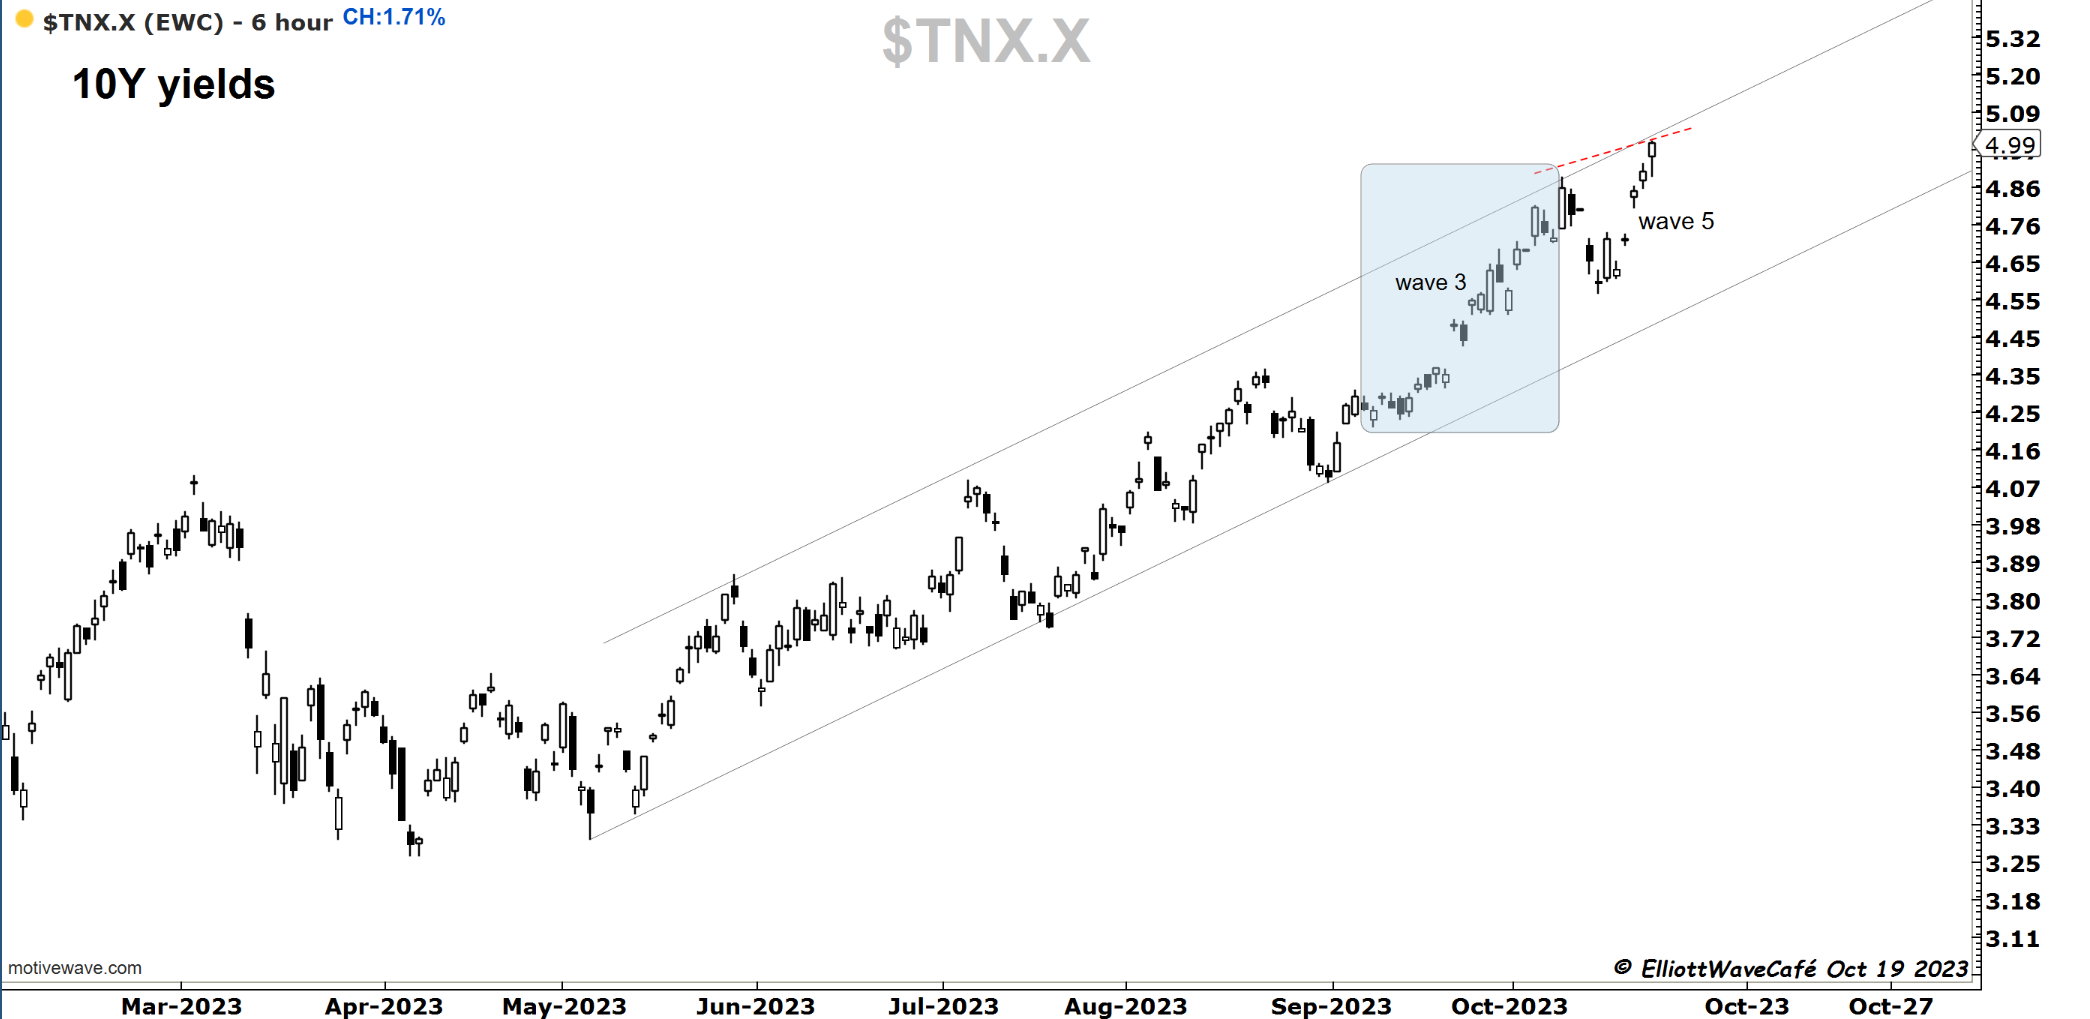
As I said on Thursday’s note, the 10yr yield is reaching top of the channel and looks as a wave 5 move. Today we lost almost 2% that. Of course Bill Ackman tweeted that he covered his long yields position. You can’t make this stuff up.
Thursday’s chart.
Gold
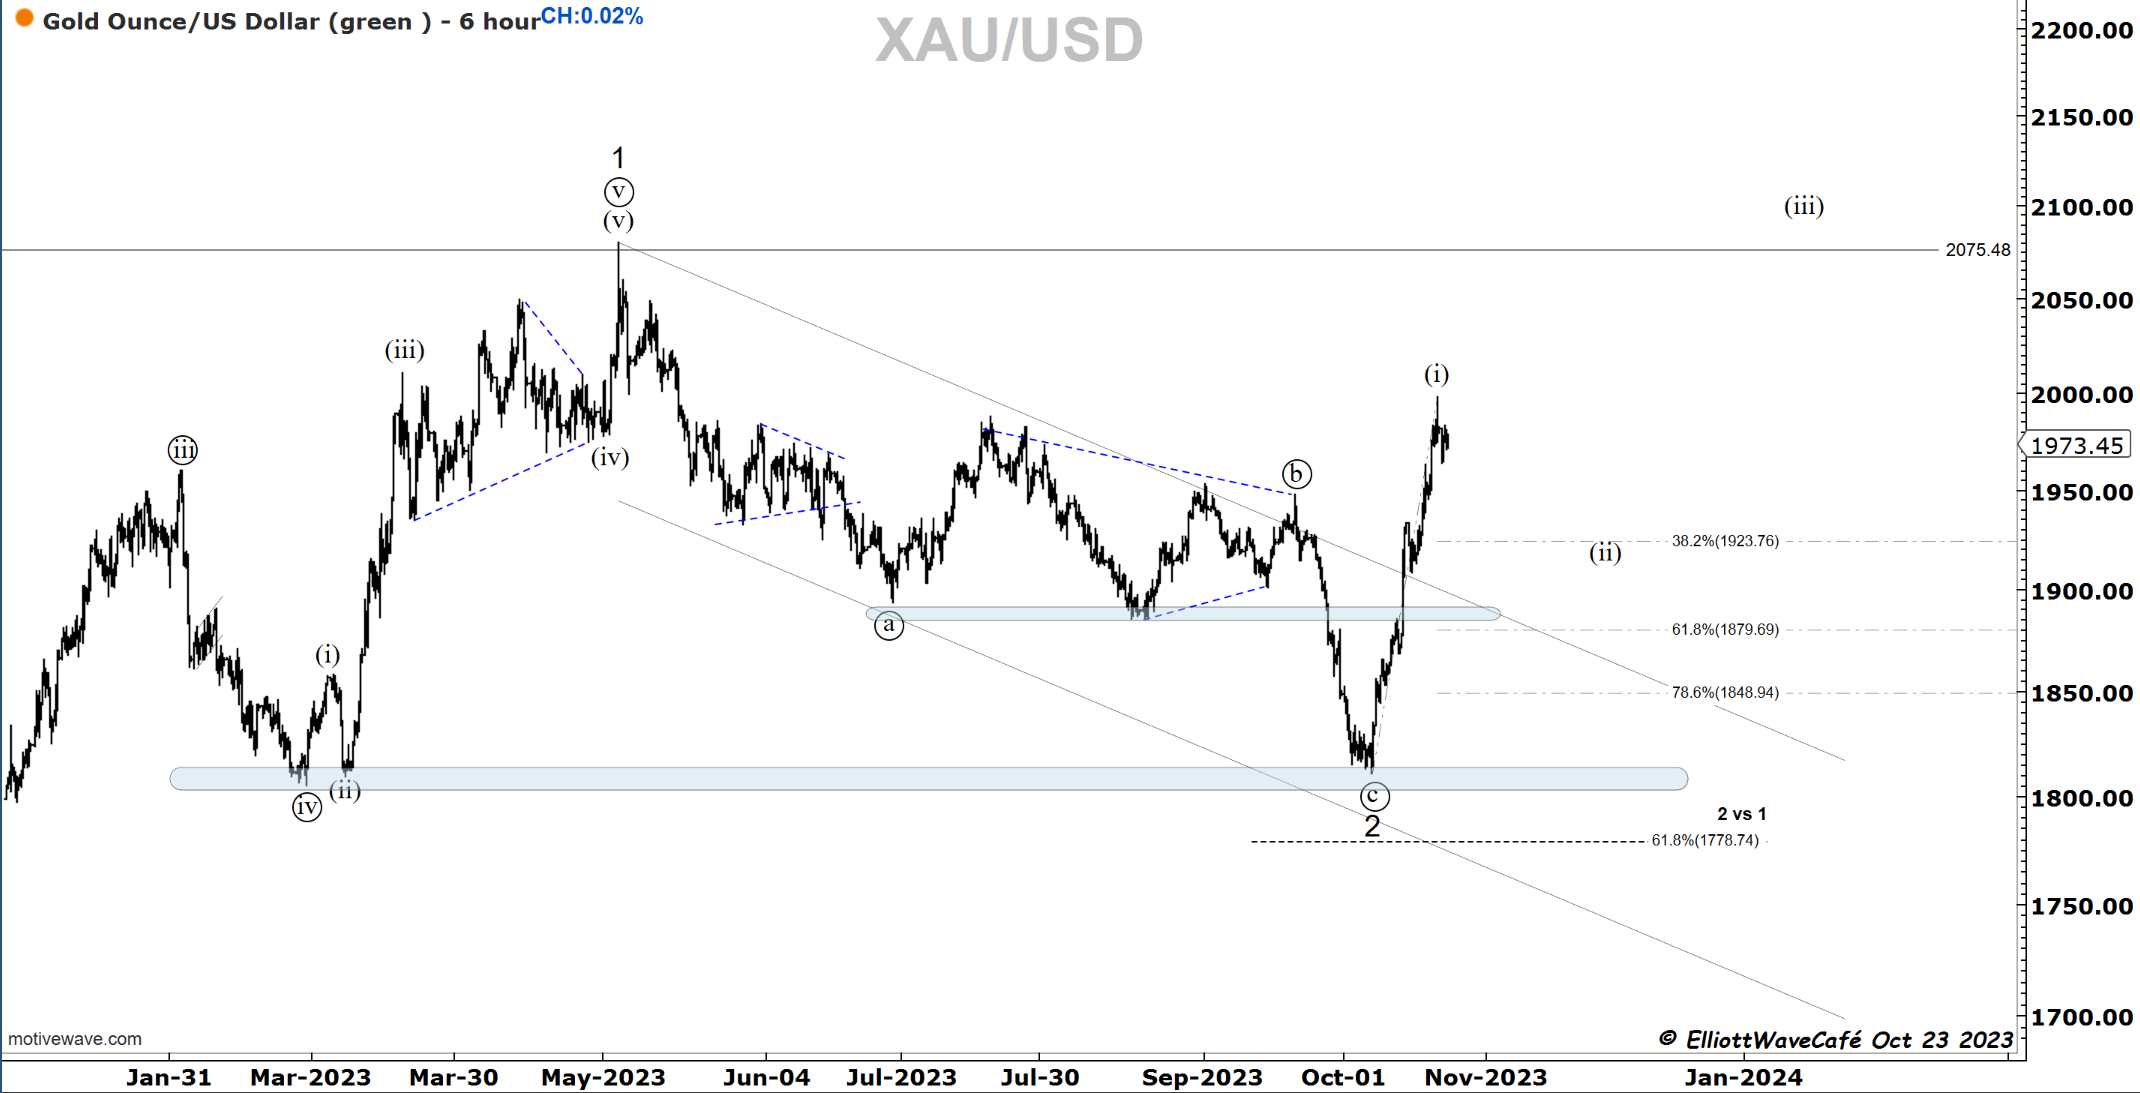
The move in Gold should be now complete and an appropriate fib correction should take place. Let’s start with 38% and see how that appears on the chart for a wave (ii). It looks like it front ran the dollar, so I am quite curious how it reacts if the dollar sells.
I guess the surprise would be a dollar rally, gold drop.
Bitcoin
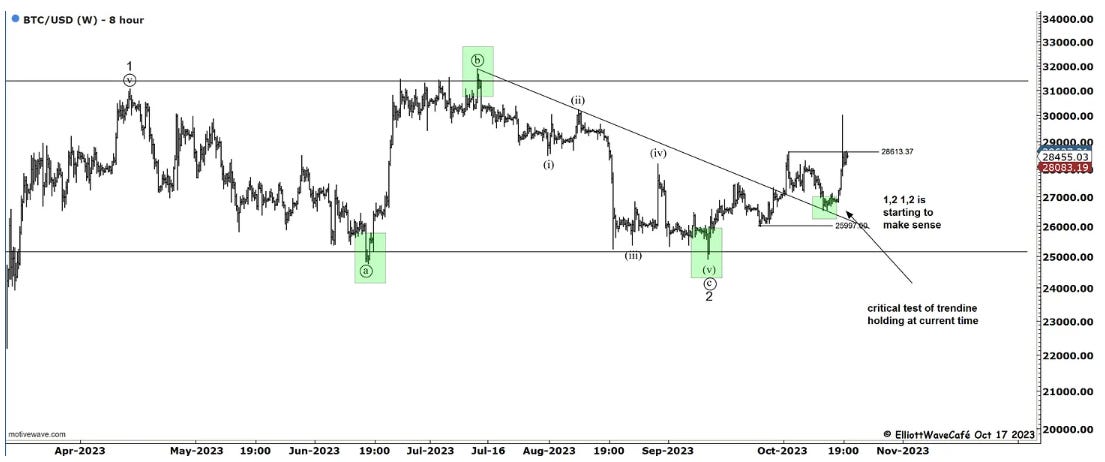
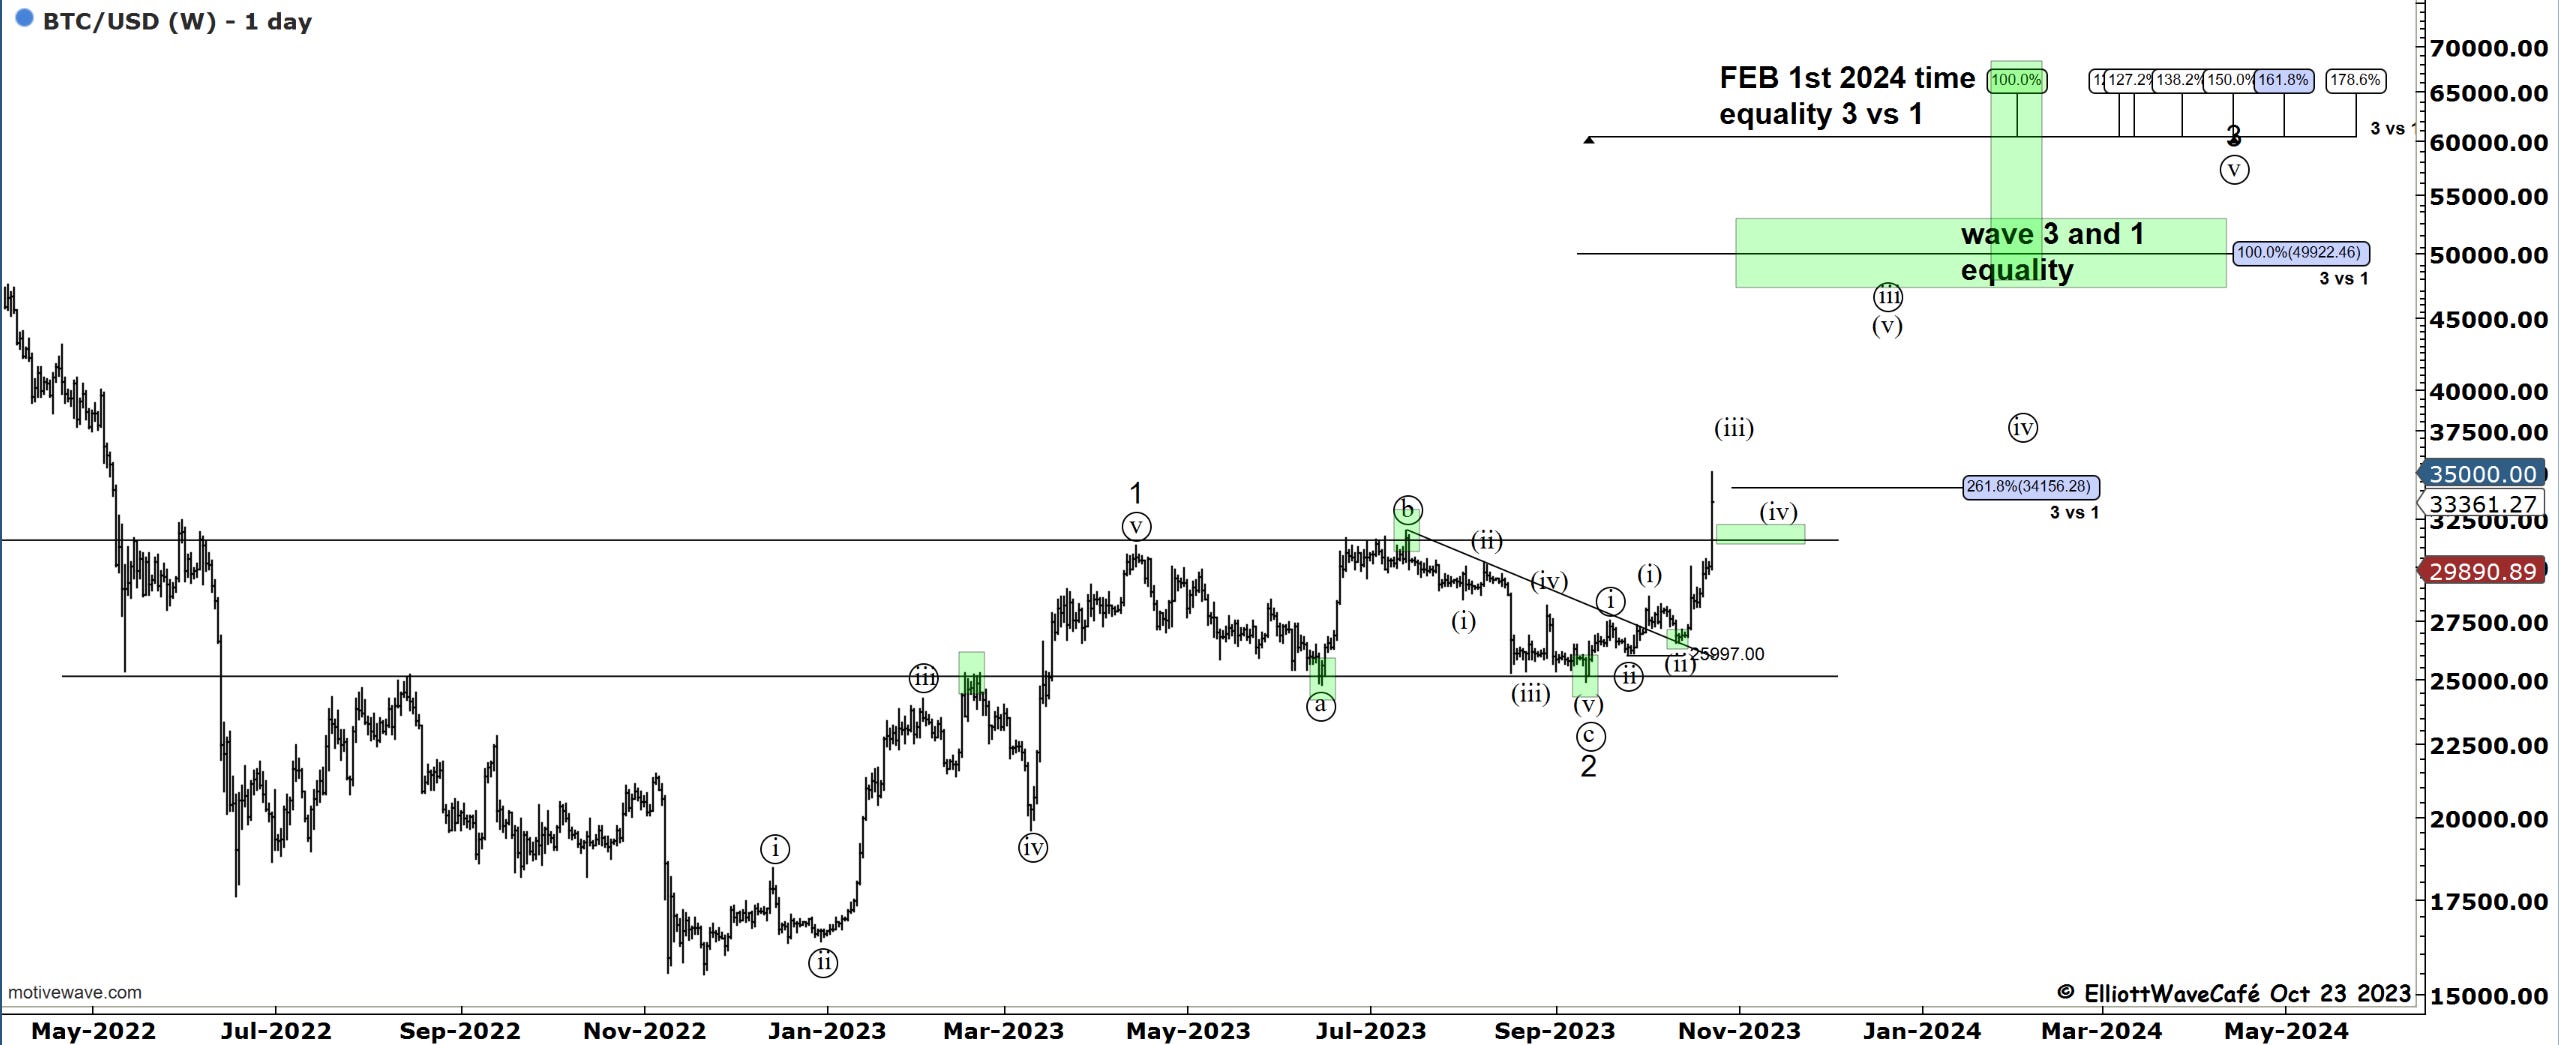
As I am typing BTC futures just hit 34,790. This is how a great 1,2 1,2 is suppose to develop and react. The truth is that BTC has been acting quite resilient in the face of risk assets selling and has somewhat been hinting at a potential breakout. Measuring targets here will be difficult if this continues, but as corrections take place we should ba able to identify lower degree waves. For now wave (iii) is in progress. That means we need two sets of 4th waves before the larger degree even begins to end. I would watch for a retest of the breakout 31k zone and see how we react if we get back there. We might not.
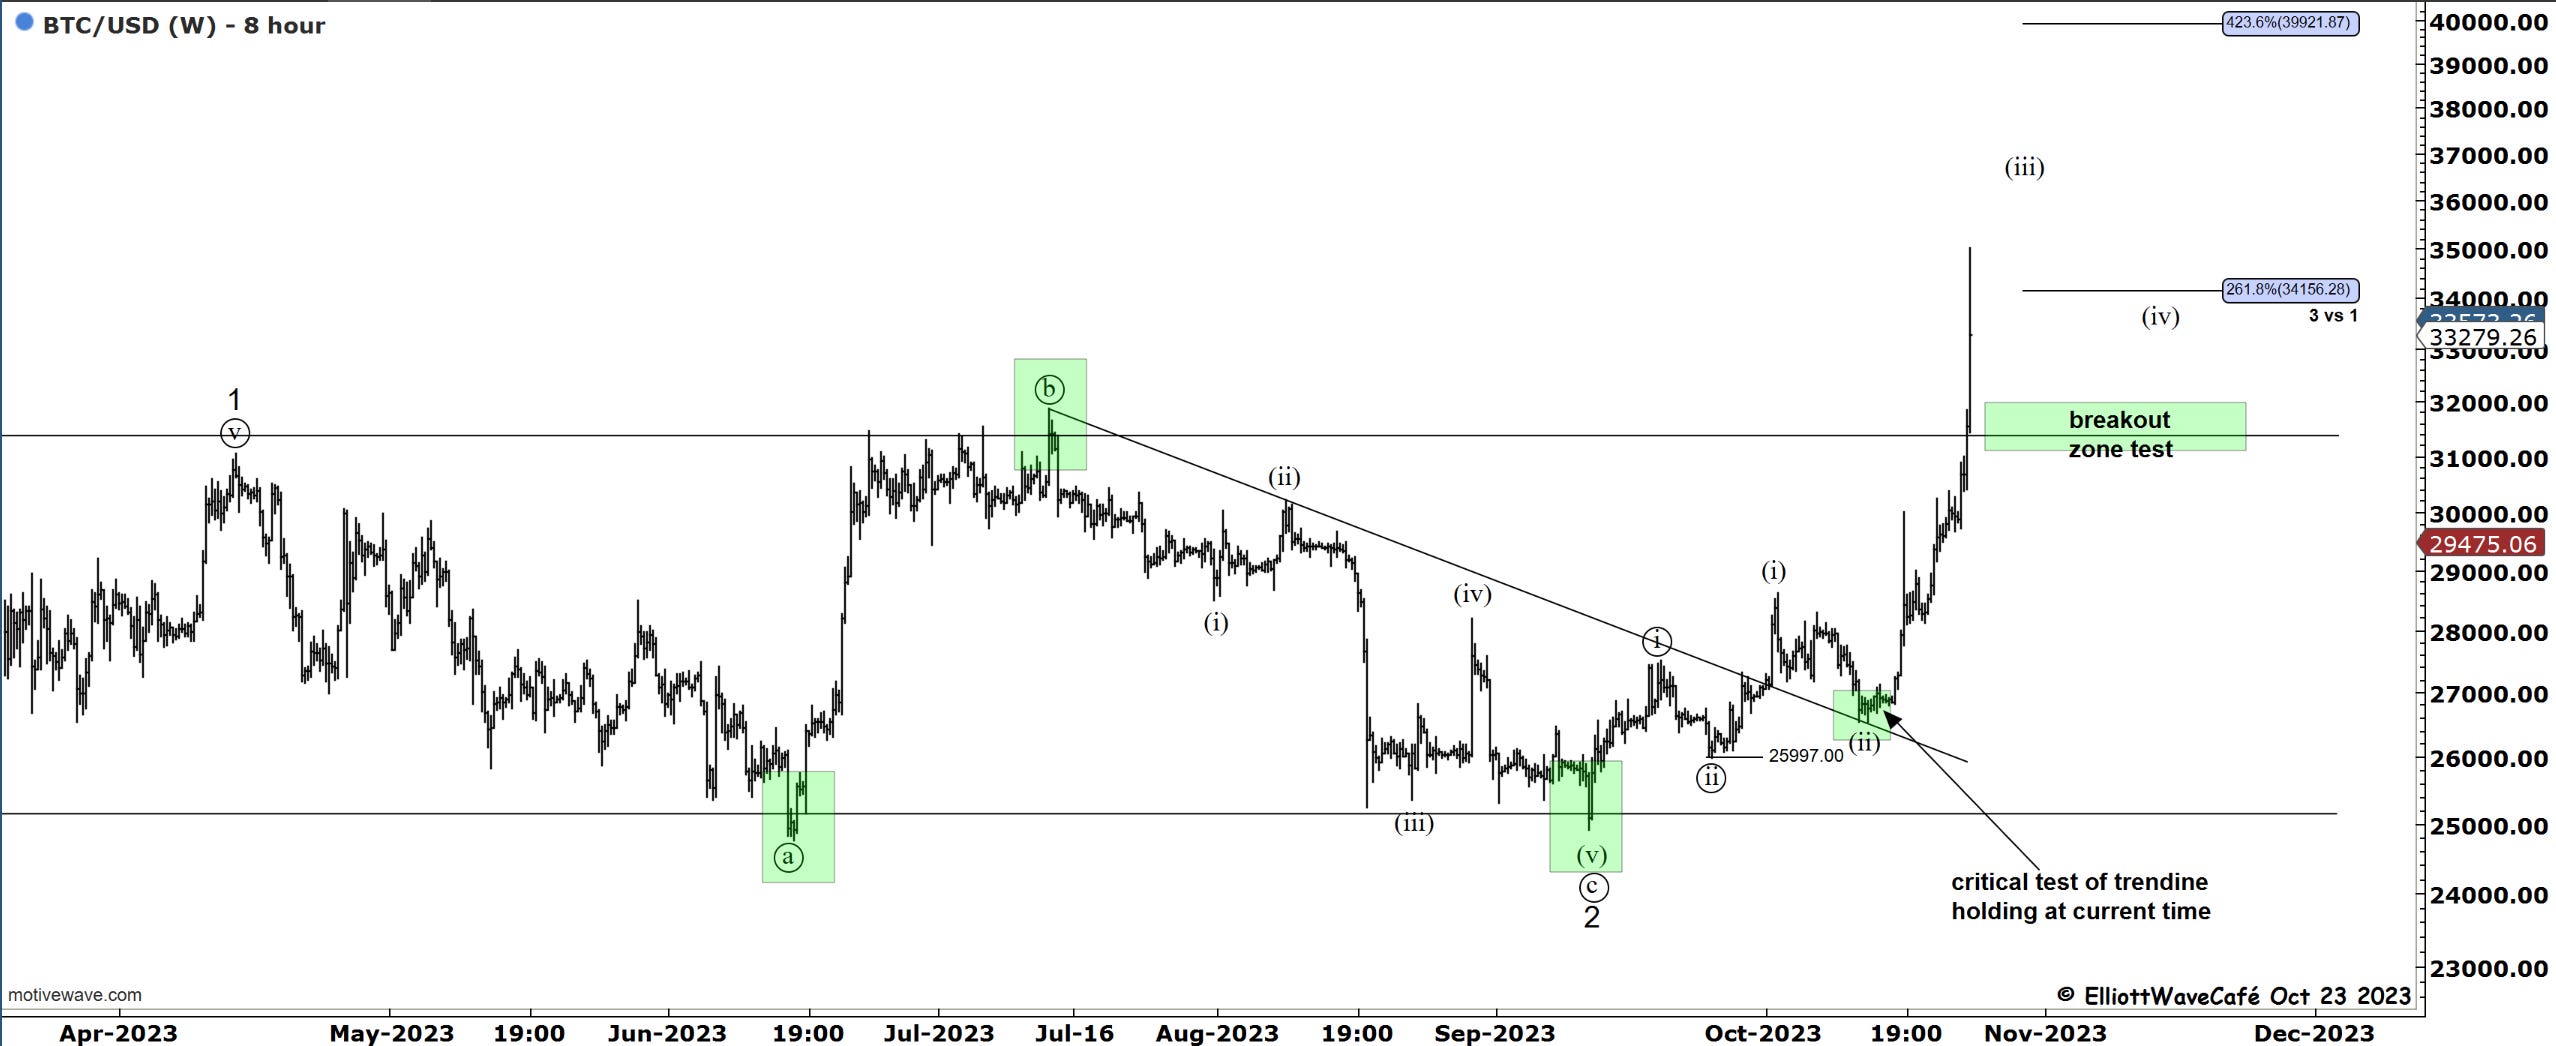
The top of that channel target is now an obvious target and it should land us near 40-45k.
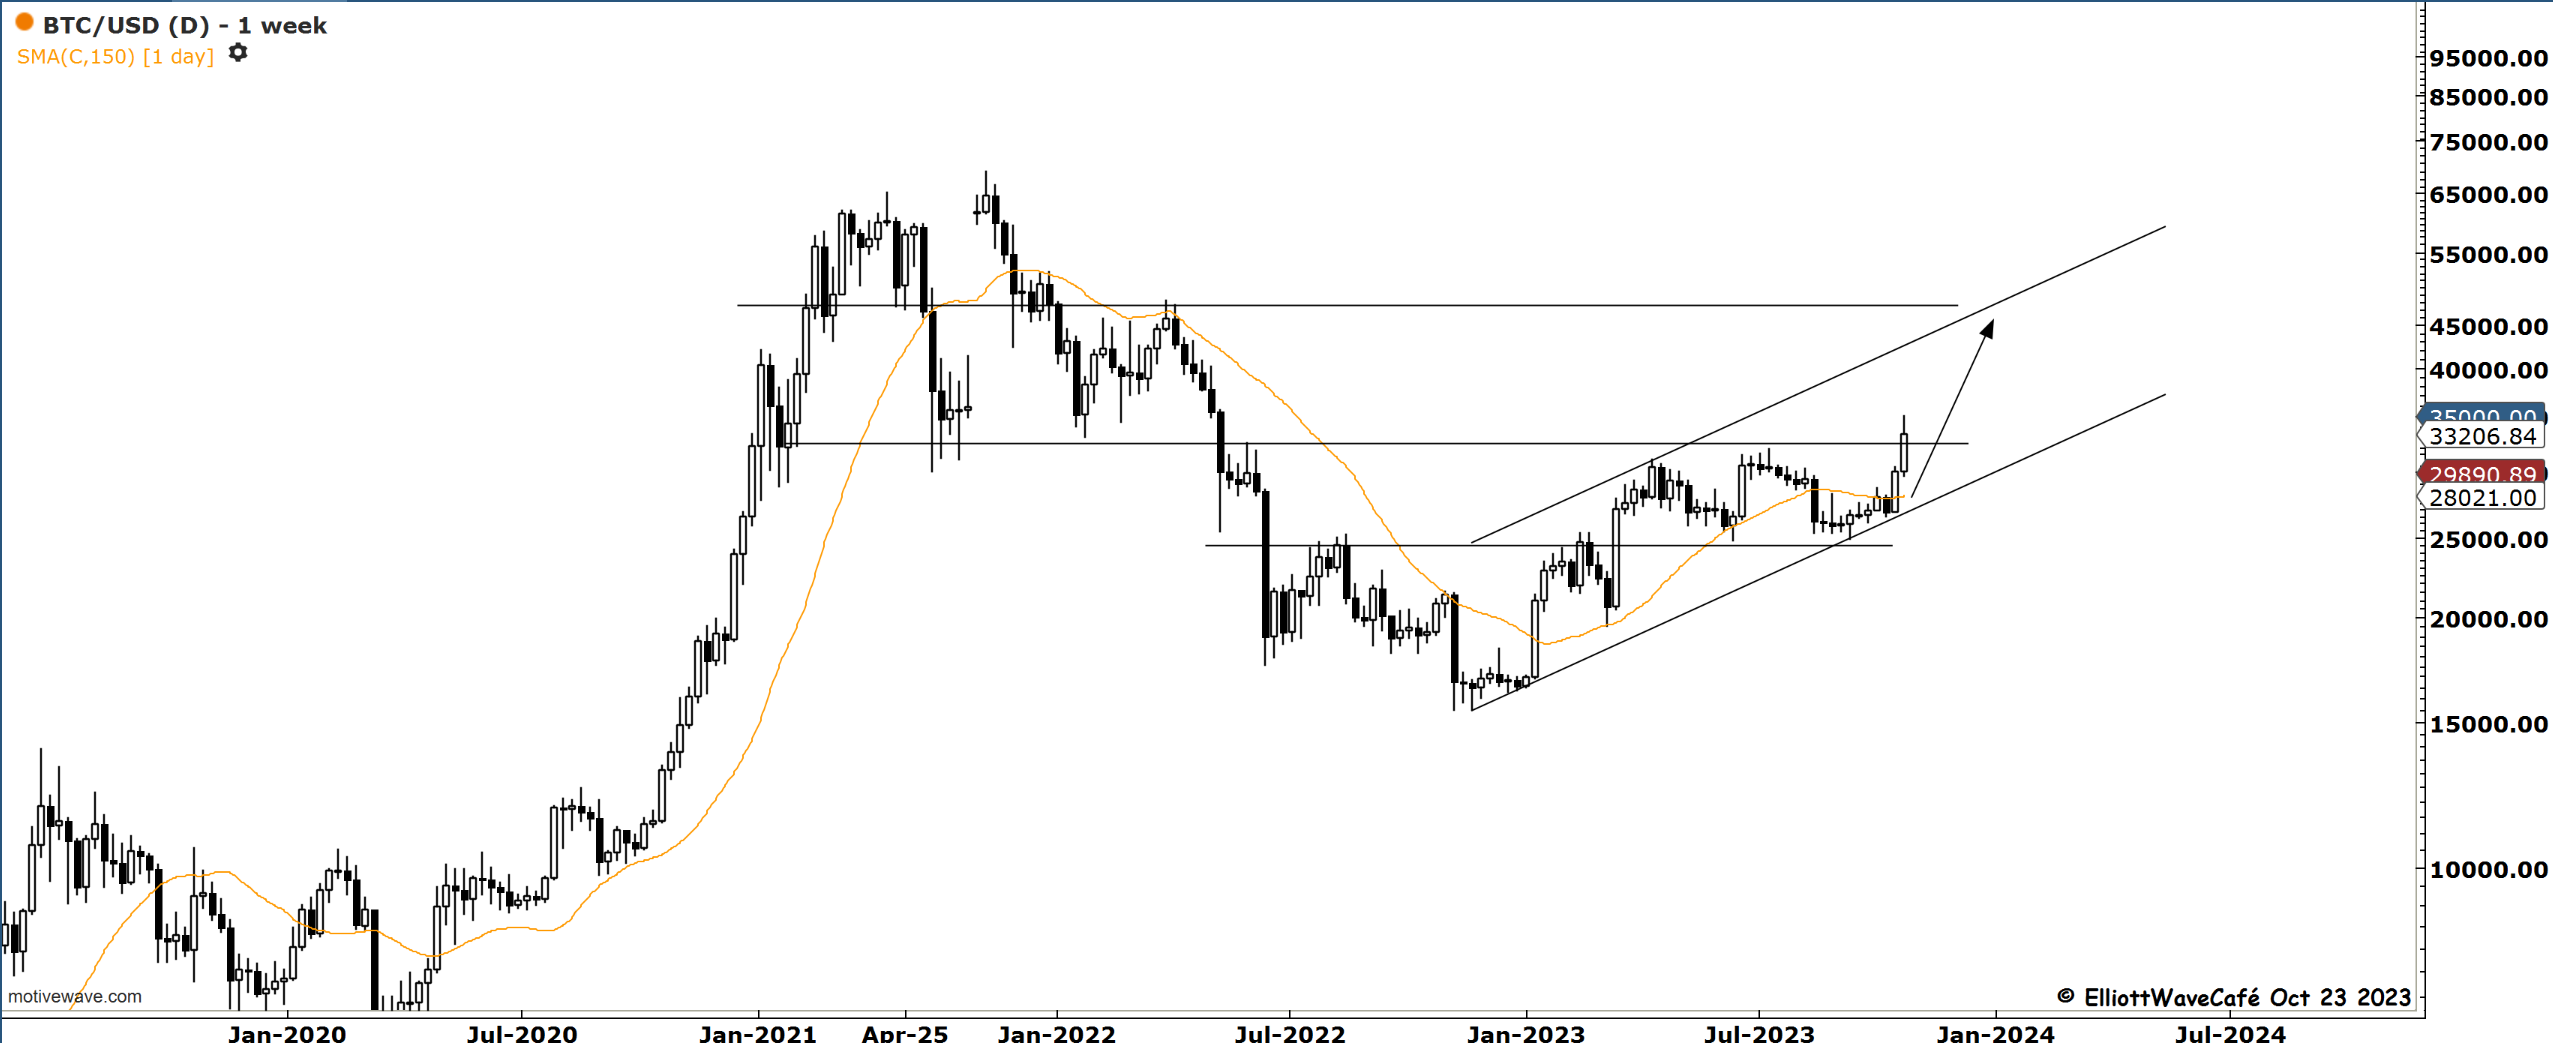
Wave 3 equality with 1 lands at 50k with time equality projection on Feb 1st. This is just information not guarantees as we all know.
Daily video coming up next,
See you next tomorrow - trade well,
Cris
email: ewcafe@pm.me
I buying that running flat.
but that B wave is hard to convince.
Where do you see 5 waves sir, what if this is large leading diagonal in BTC, that started on 9/11 and finish right now? I can see only 3 waves in subdivision on daily.