The Daily Drip
Markets review, strategy and analysis
Note: The EW counts on the right edge are real-time, and they are prone to adjustments as price action develops. Elliott Wave has a fluid approach, is evidence-based, and requires constant monitoring of certain thresholds.
In the counts below, this (( )) = circle on chart
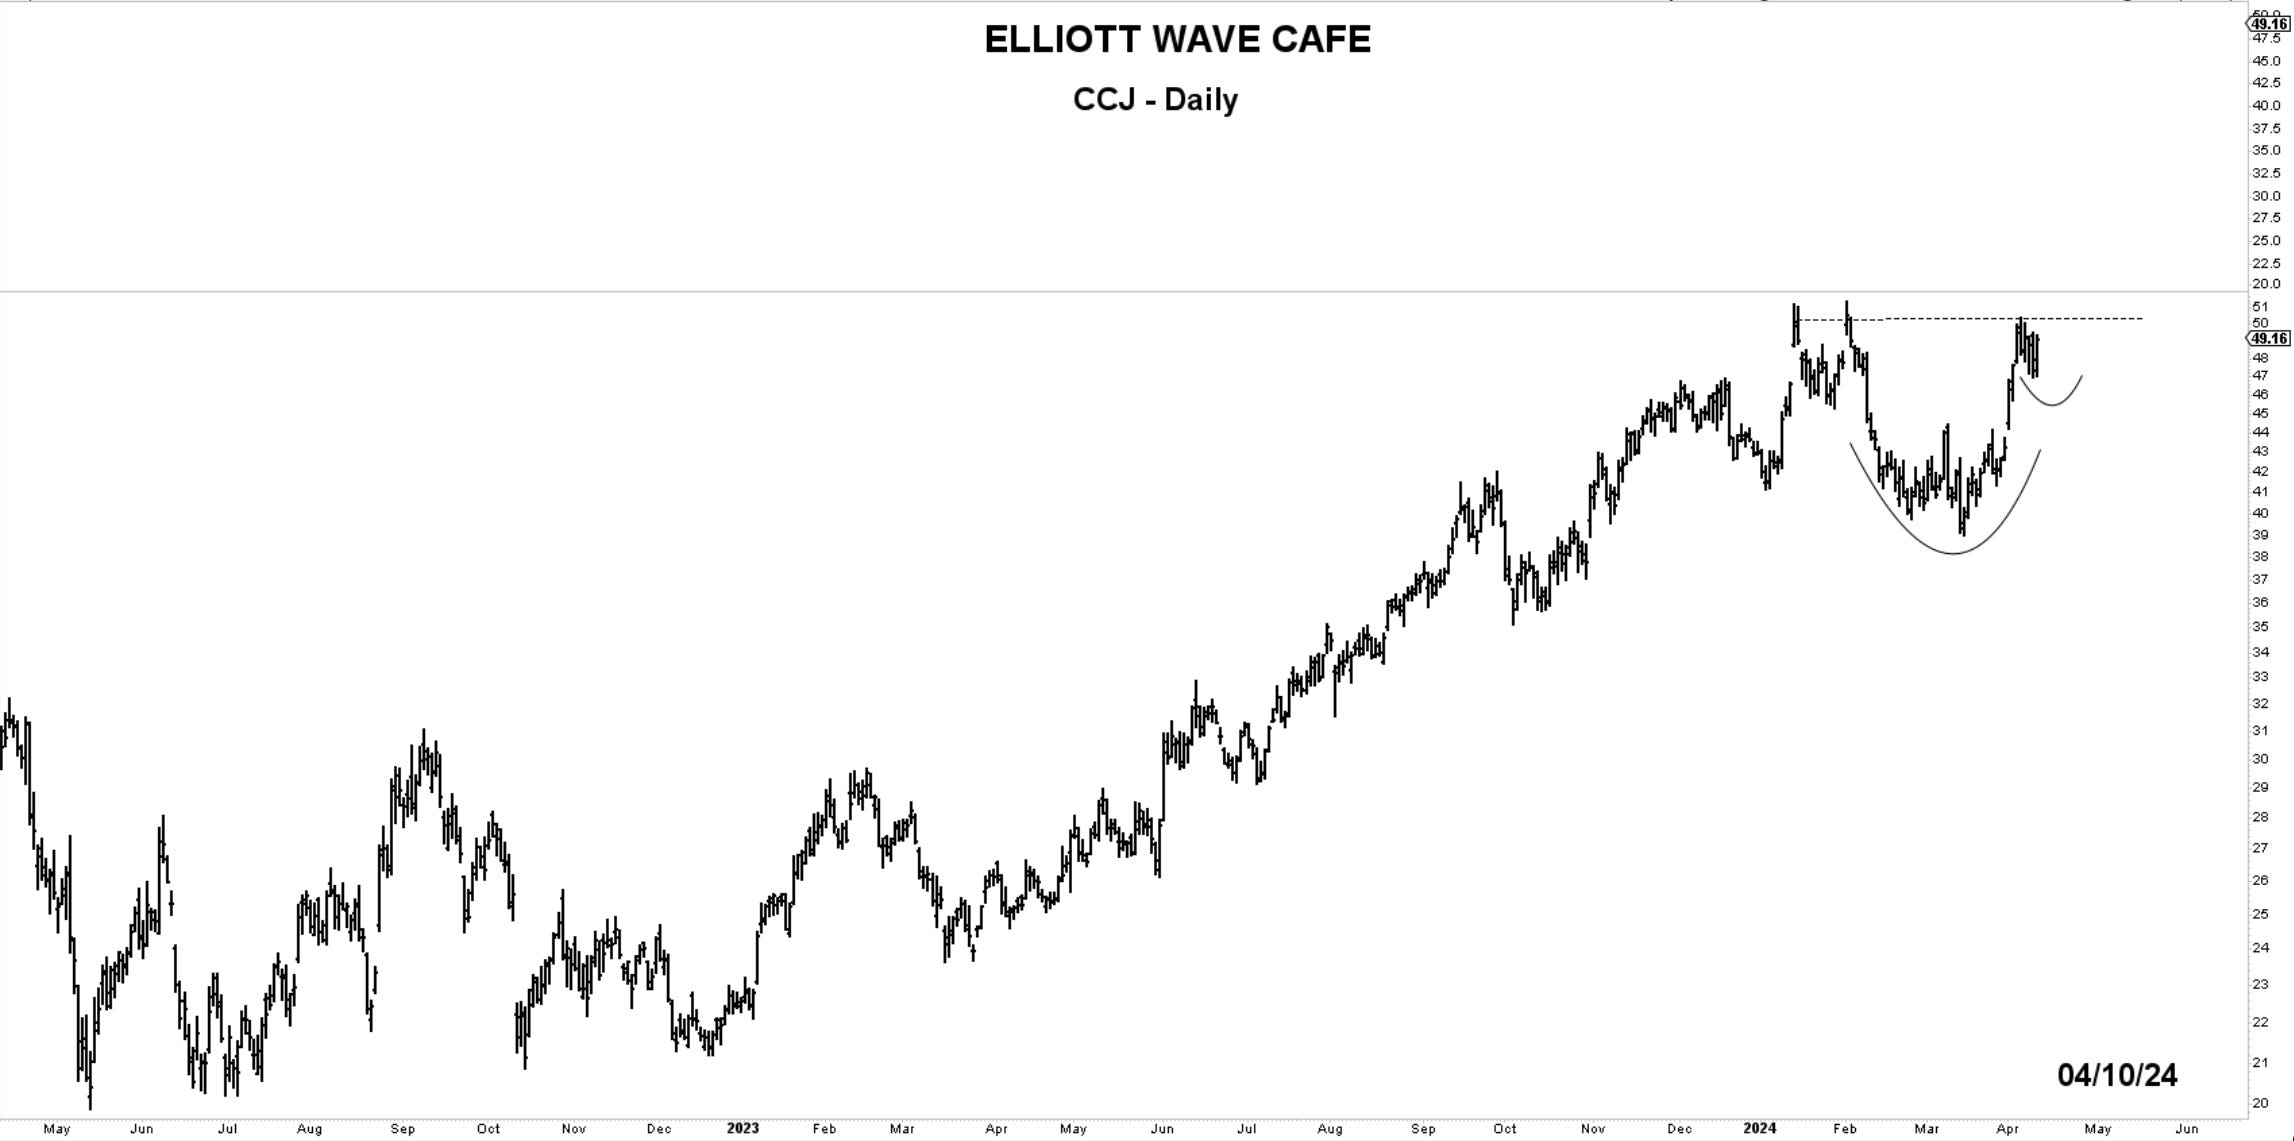
Chart of the Day—CCJ— It will likely need more time to work the right shoulder. A break of the neckline above would be a bullish development.
Yesterday’s note is available to all. You can find it here
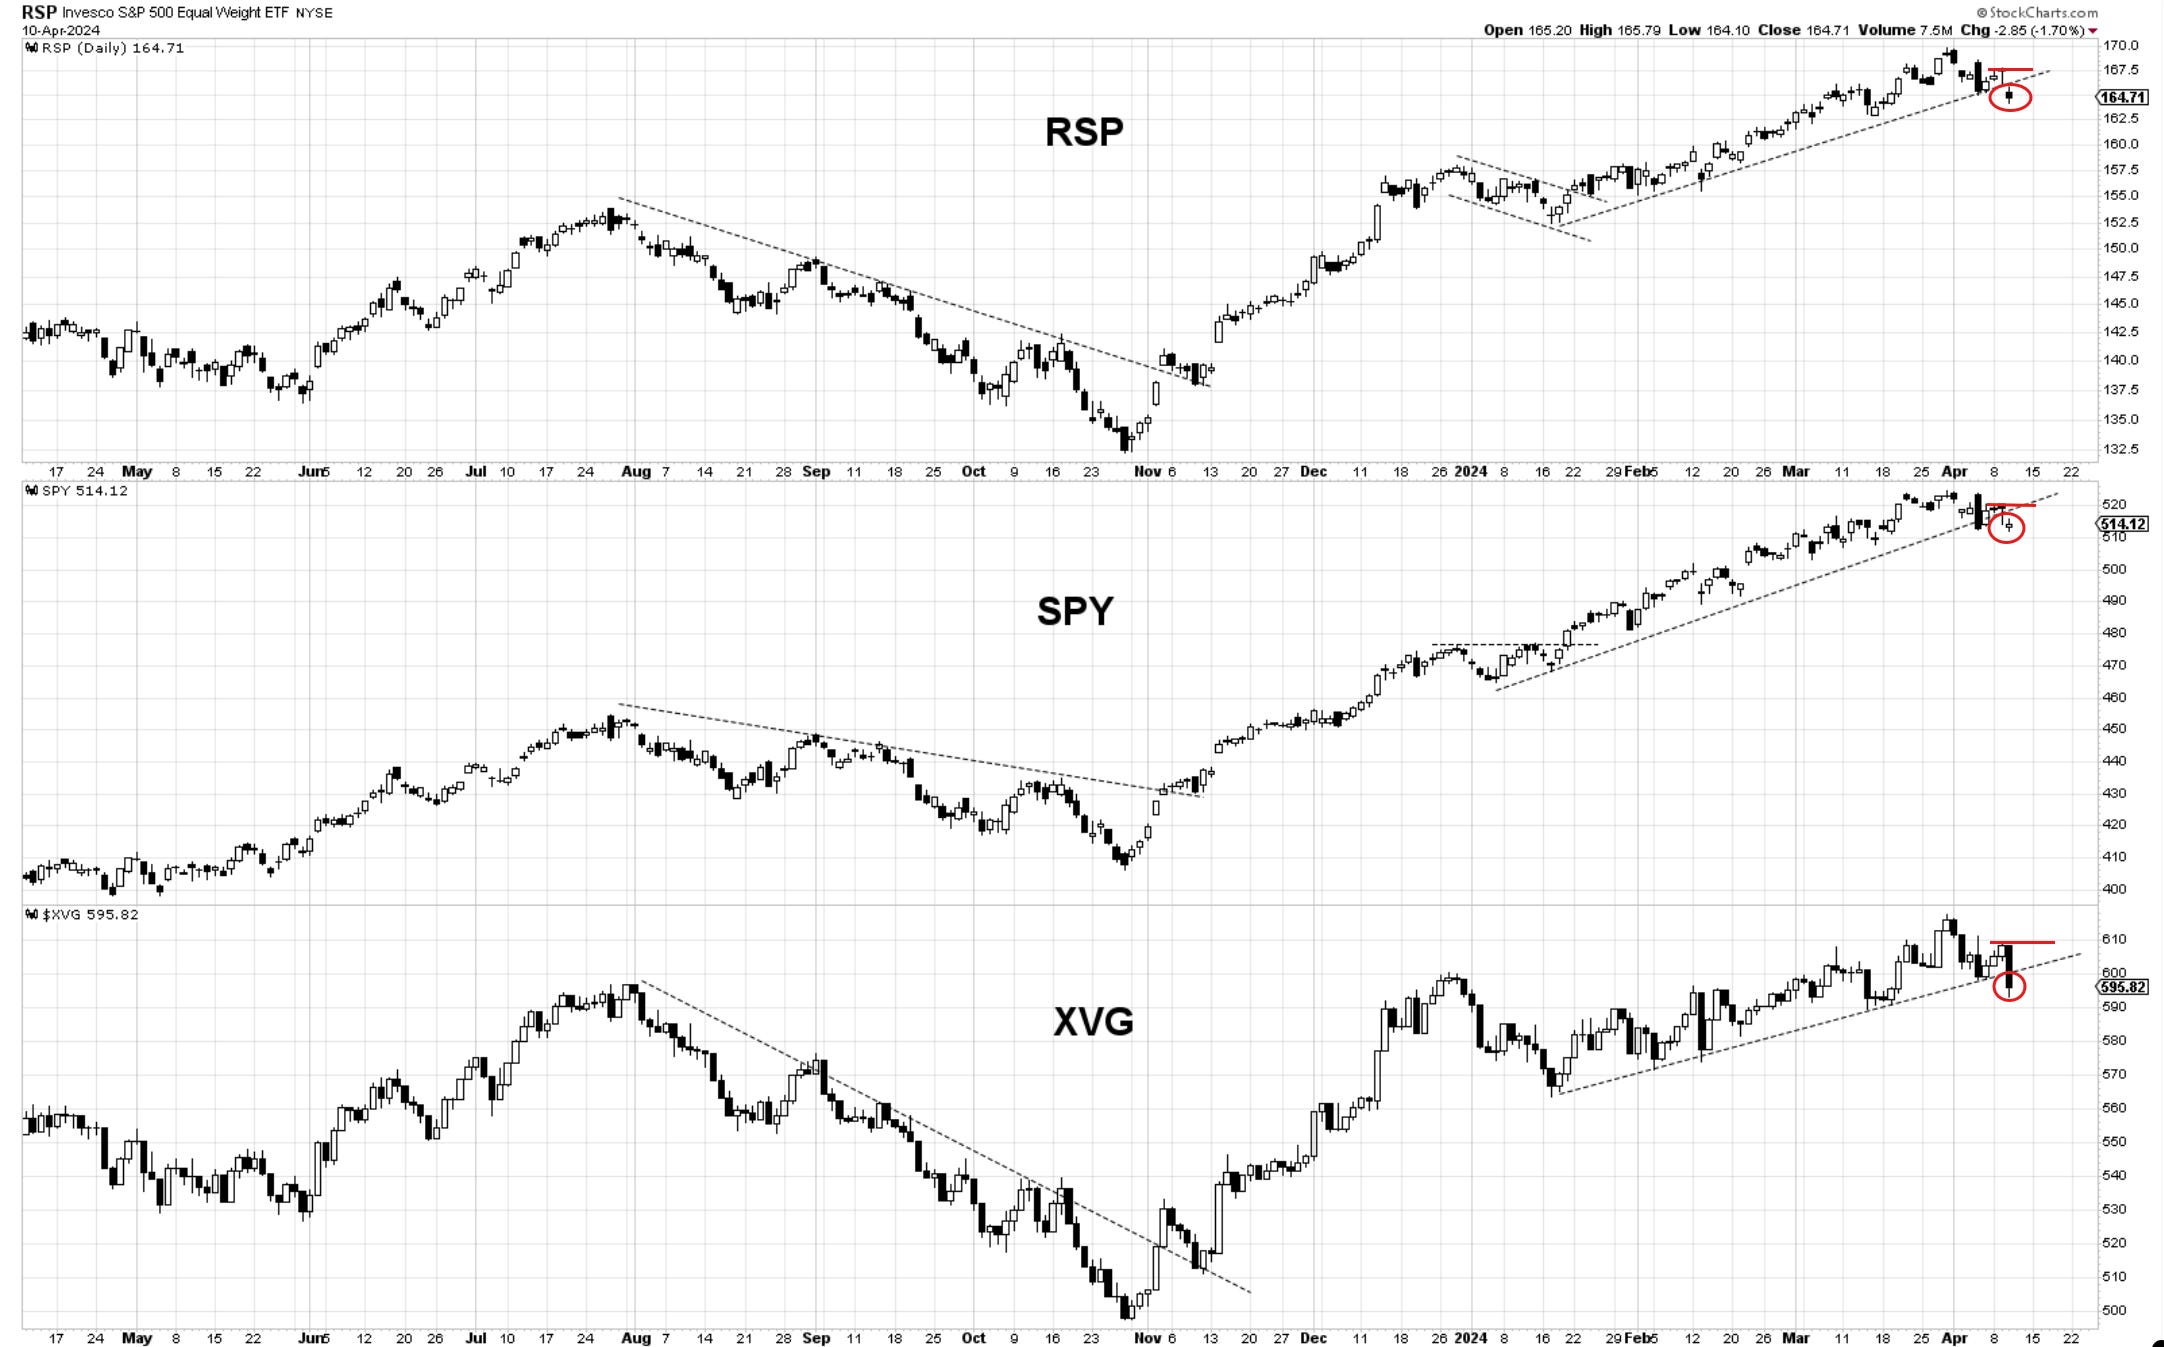
Bottom Line: The market is challenging an upward trendline and the 20-day MA. A break of both is not necessarily bearish, but it does suggest reducing risk exposure and raising cash. Upward breaks of the red horizontal lines would hint towards adding or re-initiating long exposure.