
The Daily Drip
Markets review, strategy and analysis
Note: The EW counts on the right edge are real-time, and they are prone to adjustments as price action develops. Elliott Wave has a fluid approach, is evidence-based, and requires constant monitoring of certain thresholds.
In the counts below, this (( )) = circle on chart
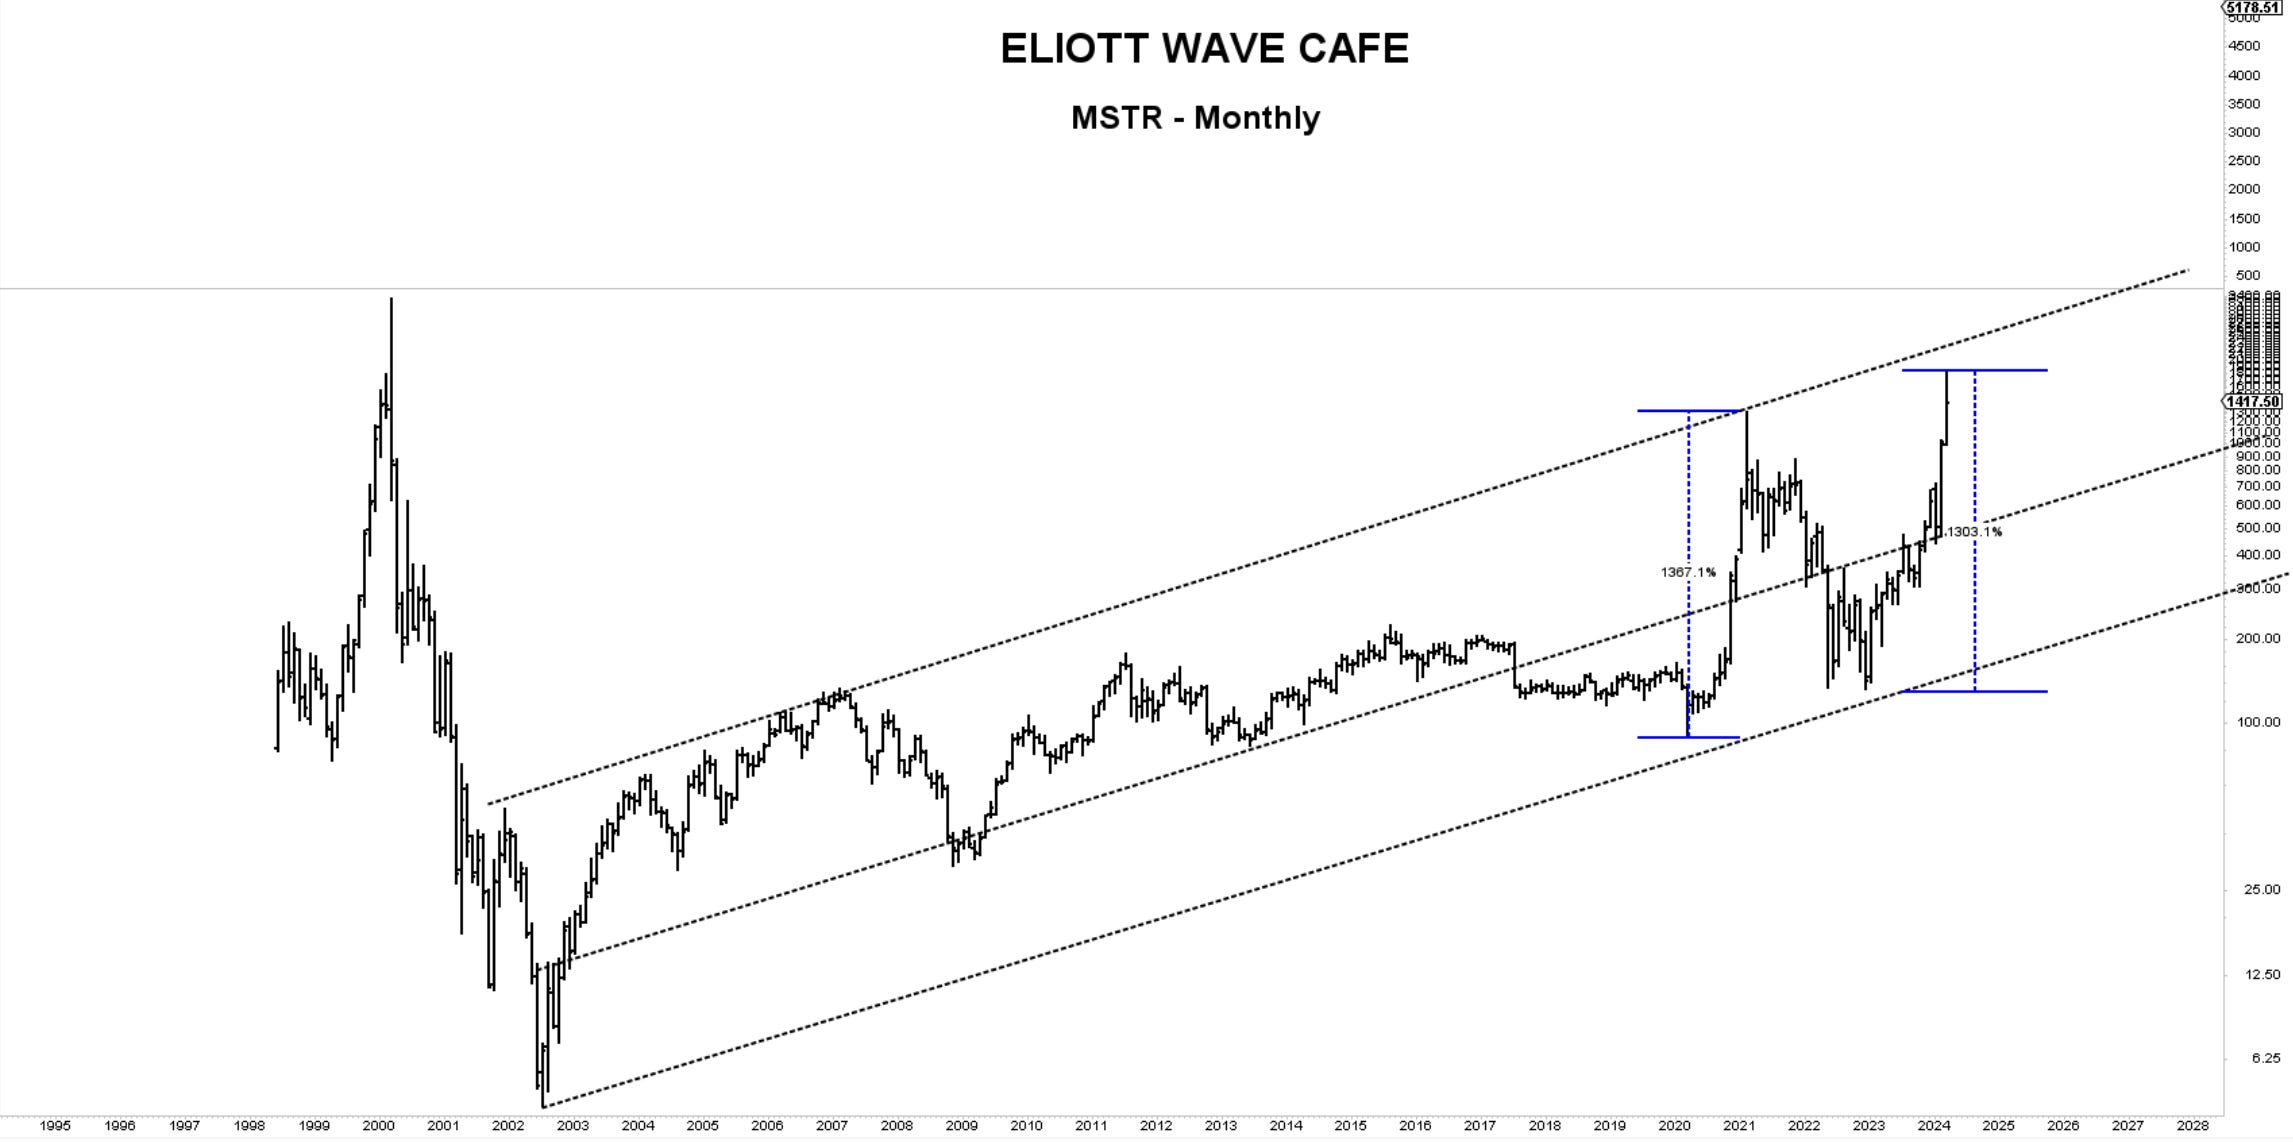
Chart of the Day - MSTR - Microstrategy in a monthly log view, expressing similar percentage advances.
In yesterday’s note, I discussed the action on the daily charts and the patterns at an hourly time frame. I mentioned how, after approximately seven days of sideways and corrective action, the SP500 has a tendency to react and make a breakout move. I have said how after a bearish move in an uptrend, you need a continuation to solidify the patterns, or else it remains vulnerable to further strength. In IWM, we looked at the 206.50 level to be offered if the market is serious about further weakness. We analyzed the dollar move and the count in yields, gold’s current small time frame count, and Bitcoin’s entries, targets, and alternative count.
In the video, we reviewed core charts, BTC behavior, and a stock with an intersting Elliott wave setup.
We have the Fed meeting tomorrow, and markets have staged bullish closes ahead of that event. There will be no rate cut, but he will get grilled repeatedly on how soon they will do it and how many. That is a guarantee. Expect whipsaws as always….
Let's dive into the charts below …
