Note: The counts on the right edge are real-time, and they are prone to adjustments as price action develops. Elliott Wave has a fluid approach, is evidence-based, and requires constant monitoring of certain thresholds.
In the counts below, this (( )) = circle on chart
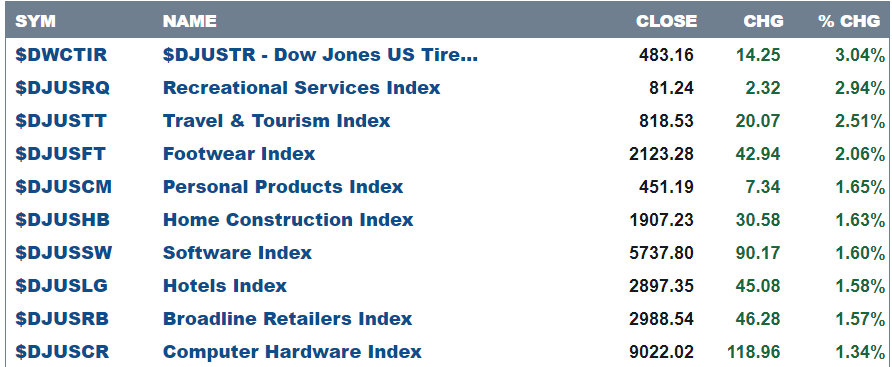
Here are today’s top 10 best performers out of 104 industries.
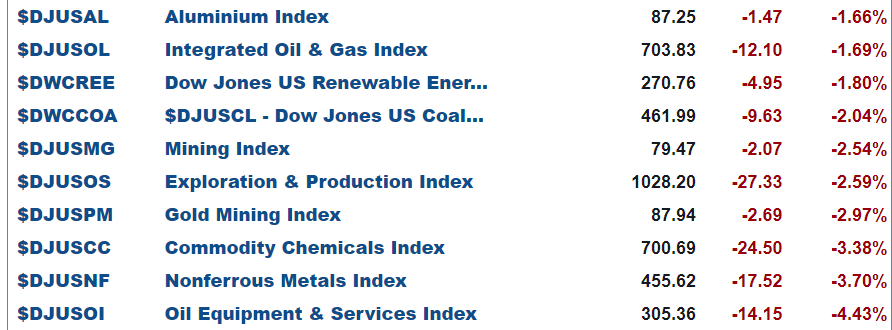
and bottom 10 …
SP500
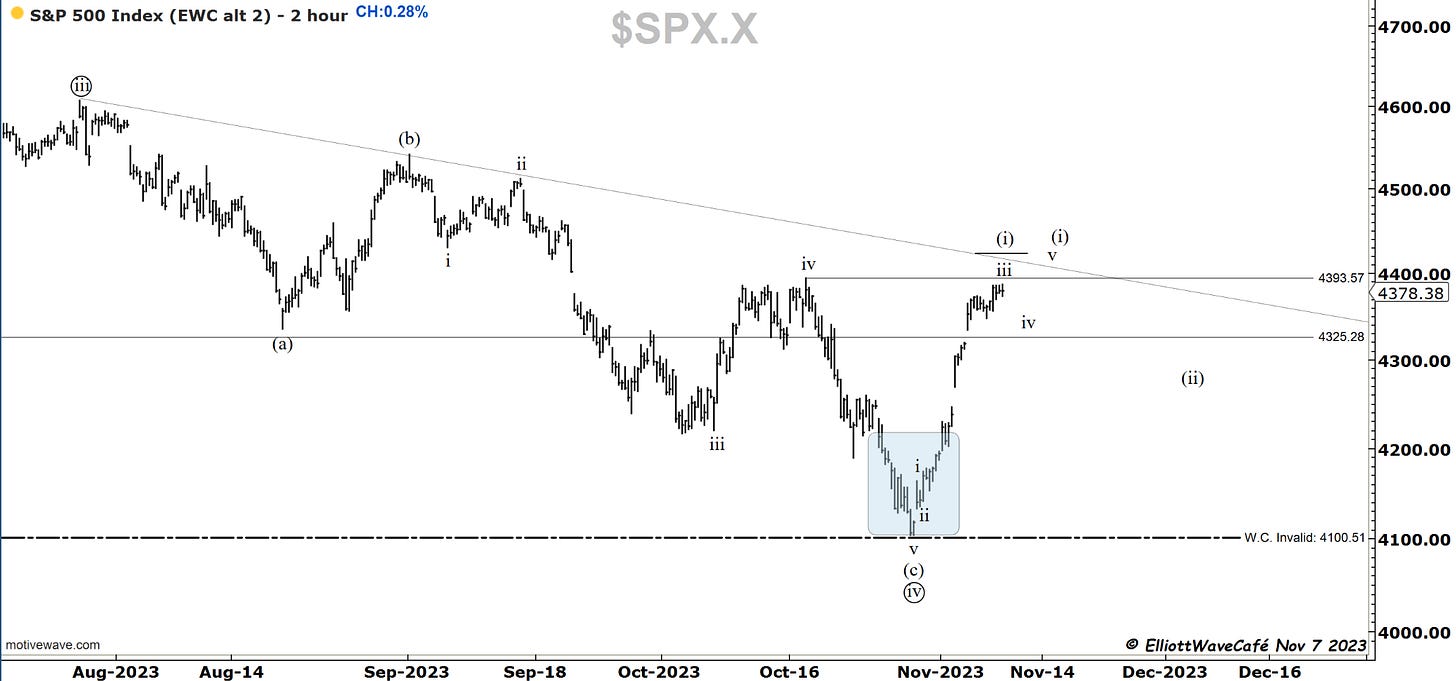
The market is getting tired with each passing day. The almost 7% rally in just a few days is taking its toll. The marks of this behavior are seen in the wave count with a strong 3rd wave advance followed by smaller magnitude waves in a final sequence of 4’s and 5’s. That’s my assumption up to this point. I am not saying the bottom will fall out but rather recognize a place where is likely we stall and digest the gains. As is the case with near-term tops, it could take a few days for the market to recognize it needs to step back before it can go forward again. That’s the natural progression of trends.
This market internal indicator called TICK compares the intraday number of stocks rising vs falling, and it shows how as we were making new lows, the institutions were buying, and currently as we’re trying to get higher, we have underlying selling. Wall Street is taking its gains. It’s not perfect, but it warrants to be looked at for further confirmations when compared to wave count structures.
Take a look as we’re pushing higher how declining issues are overpowering the advancing ones. It’s little clues like that can hint and confirm count structures.
In conclusion, calling a top to this move could be a bit premature, but the yellow lights are certainly flashing. If we break 4345, wave (ii) should be underway. I continue to hold plenty of longs, but I am preparing a few tactical shorts to take advantage of a potential correction. These trades have to be fast with lower leverage and never overstay your welcome.
Nasdaq100
Today’s move was a 5th wave. I am not quite convinced is that final 5th wave or if we have one more to come. But the message is clear. Reducing exposure and preparing for a correction is right. The depth of it remains to be decided and will look at the wave counts as they unfold. The highs from Oct 12 was 15,333.98 and the one from today was 15,335.44. The second chart looks at breadth on the 2h time frame as we’re making these highs.
As I have said on Twitter earlier today, I have opened a short-term long position in SQQQ to take advantage of the potential selloff. Some might want to wait for more confirmation, which would be a break of a trendline coming from lows, or a previous wave four low.
RUSSELL 2000
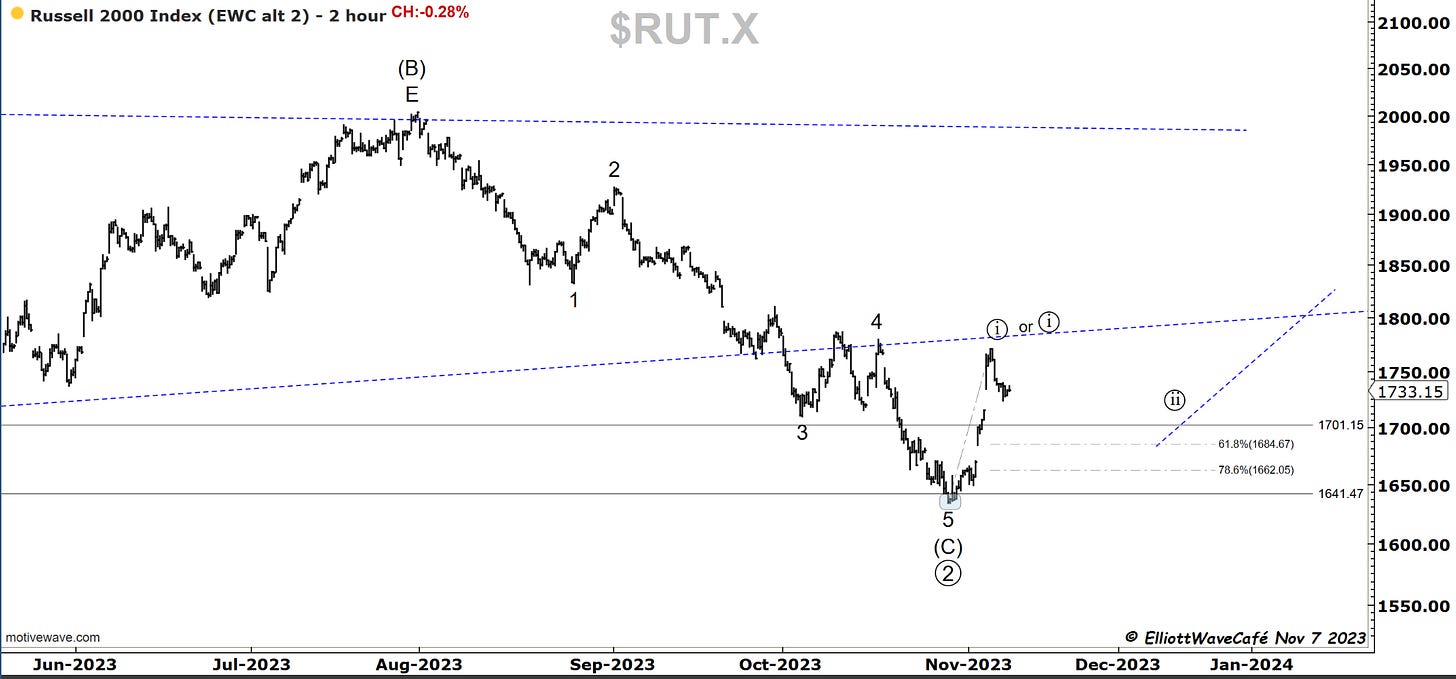
This index was once again the weakest over the past 2 days. I am monitoring the 61.8% for reactions. The wave ((i)) might still have some work to do, but not if we drop below 1700. That would be a clue that the initial thrust higher was completed and we’re dealing with a corrective pullback already. Since I don’t have a sensible read here, I am just observing and not taking any stances on it.
Dow30
I don’t think we have rocket science here in assuming that 5 waves should soon be over with an extended 3rd wave.
US Dollar and Yields
A bit of a strange action today from the mighty dollar that climbed +0.46% with an SPX that climbed +0.28%. Notice how these charts trade usually opposite of each other. Not saying today’s move is a major development in any way, but another little clue as to how risk is perceived underneath the surface.
These are the 10Y yields we have been watching for a while. That divergence played out already and I think we are in the next sequence of price behavior. Notice the climbing 50-day MA . I think there will be some fighting happening here from the bond markets. Rolling over and playing dead all of a sudden is not how it works. We need to continue to work thru supply and demand and create a more significant top in yields. A rally back to 4.77 could dampen the market rally further.
Gold
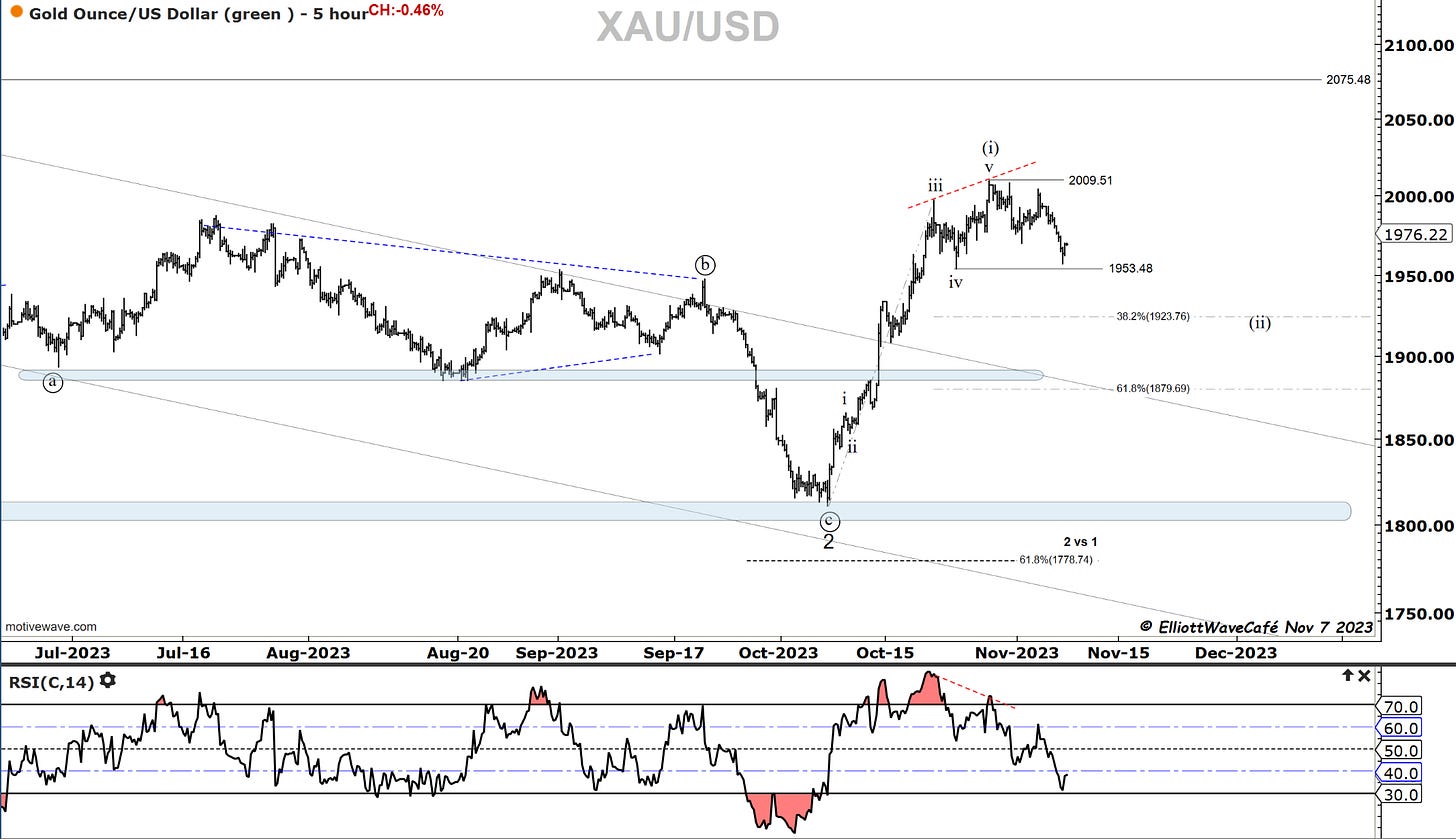
Gold has declined with more aggression today as per expectations. The drop from the highs seems short in both price and time vs the previous rally. Even tho I notice a 3-wave decline, I would expect further time is needed to complete this proposed wave (ii) correction. That prior wave iv is providing support as usual in correction drops.
Bitcoin
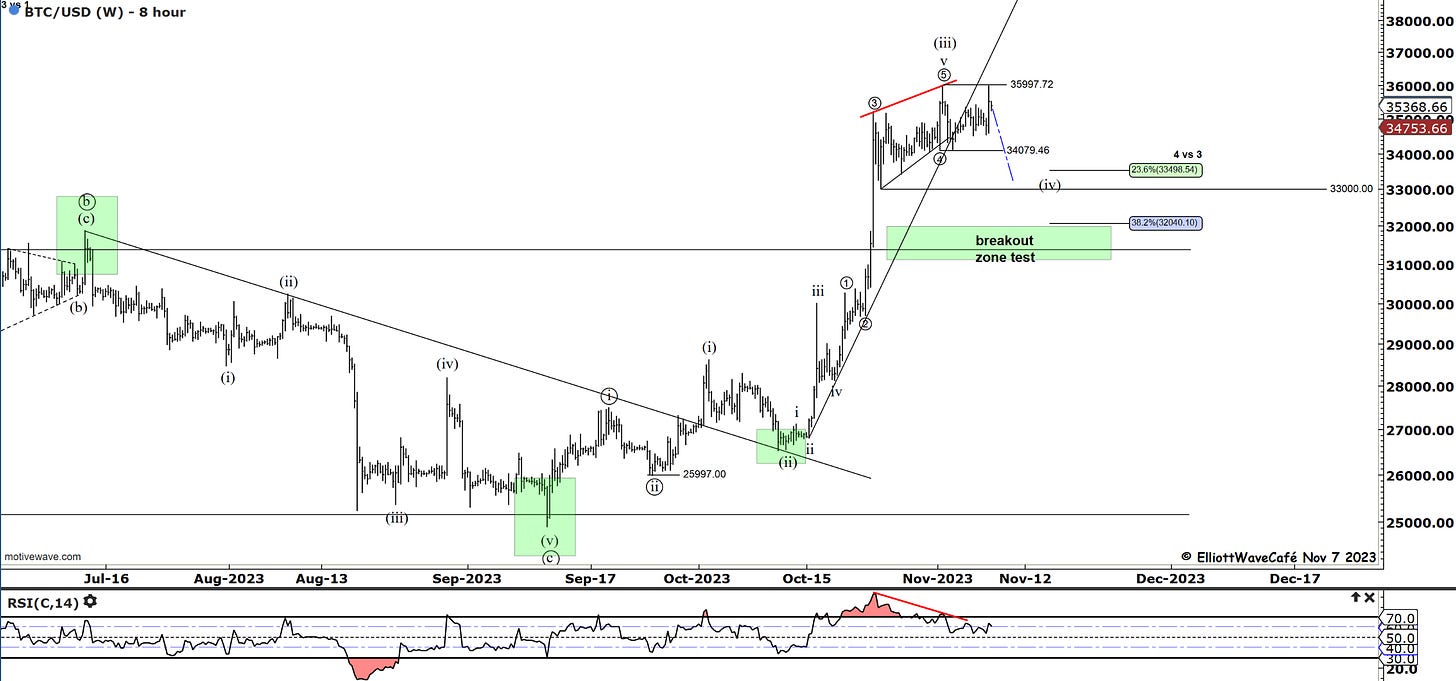
Prior BTC comments stand. Today bitcoin took another stab at the highs trying to clear 36k. My view remains that an appropriate correction should take place following that strong 3rd wave advance. Further gains should probably prove to be short-lived. If we started with an 1,2 1,2 from the lows in September, then the current market behavior is a series of 4th waves. In terms of proportions, they are still far from completion.
Bitcoin continues to struggle the upward momentum and has been doing so for about 2 weeks now.( 2nd chart). I continue to view the current behavior as corrective for a wave (iv) formation. By my metrics, we should fall towards the 33k zone. I will keep the seasonality charts for perspective along with the cycle at this point. Bitcoin’s stagnation is allowing the altcoin market to grab market share and that could continue even with BTC falling for a while. I am not an expert in crypto correlations or dominance so take my views with a grain of salt when it comes to alts-btc behavior.
Overall I think is right to remain long BTC as long as we’re above 31k. The current churn will run its course and a higher-leg will follow.
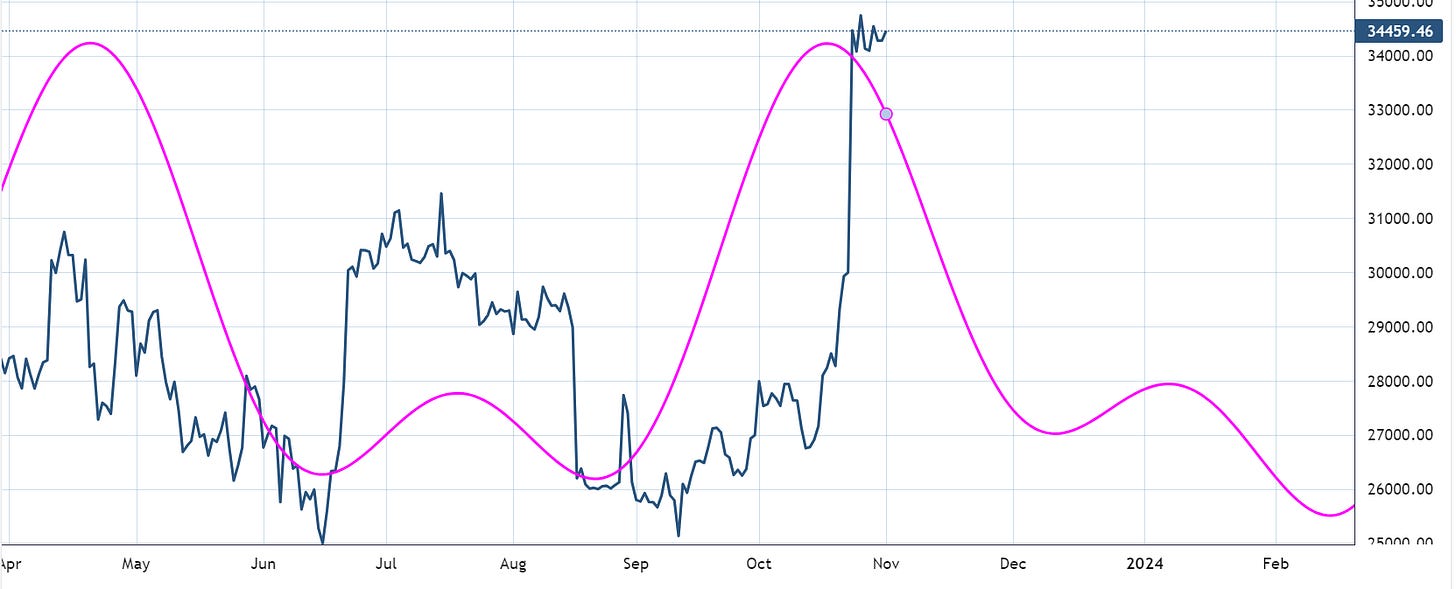
My cycle composite work suggests a period of upcoming weakness as well. Do not look at the price levels shown by the magenta line, but rather the time aspect of it.
Daily video coming up next,
See you tomorrow - trade well,
Cris
email: ewcafe@pm.me

