
The Daily Drip
Core markets charts updates and commentary
Note: The counts on the right edge are real-time, and they are prone to adjustments as price action develops. Elliott Wave has a fluid approach, is evidence-based, and requires constant monitoring of certain thresholds.
In the counts below, this (( )) = circle on chart
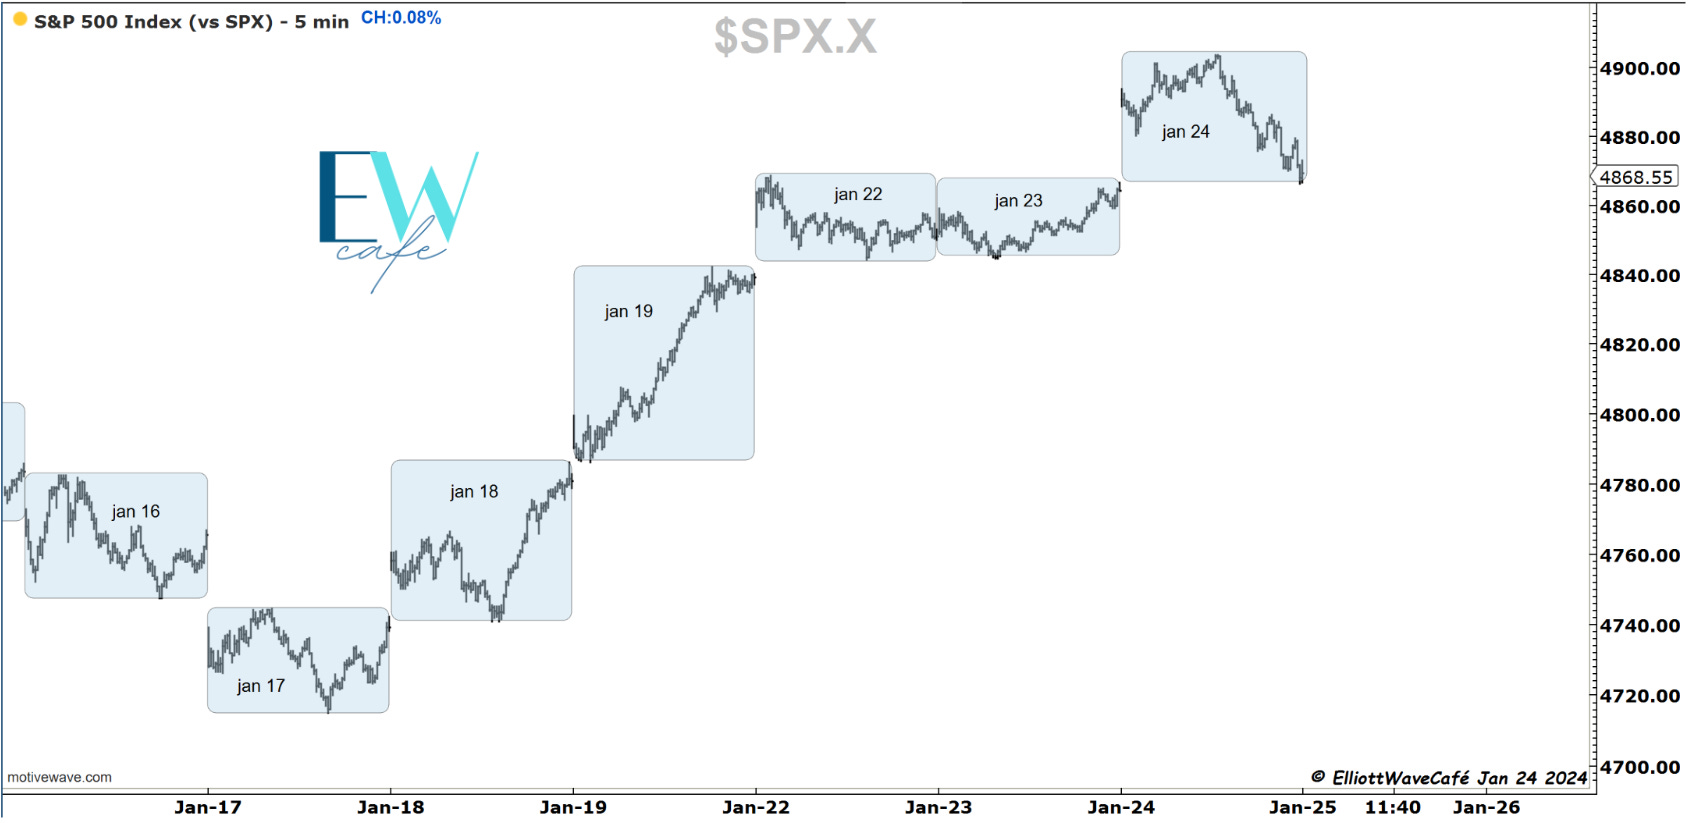
SP500
The market started bullish right off the gate with a large gap upwards. It continued to press higher until roughly lunchtime, after which some active selling took place, sending everything lower near the close of yesterday's prices. You could call this an upside failure, an important development in the near term. It means that bulls are not able to sustain higher prices, and we reverse lower into the close. Days like this need to have a lower continuation, and any rally attempts need to fade. It is the only way a signal like this can be trusted.
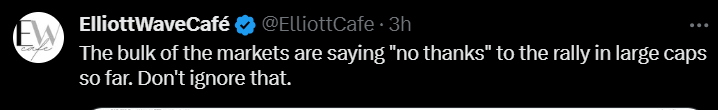
Right as markets were climbing to new highs, I made the following comment on Twitter
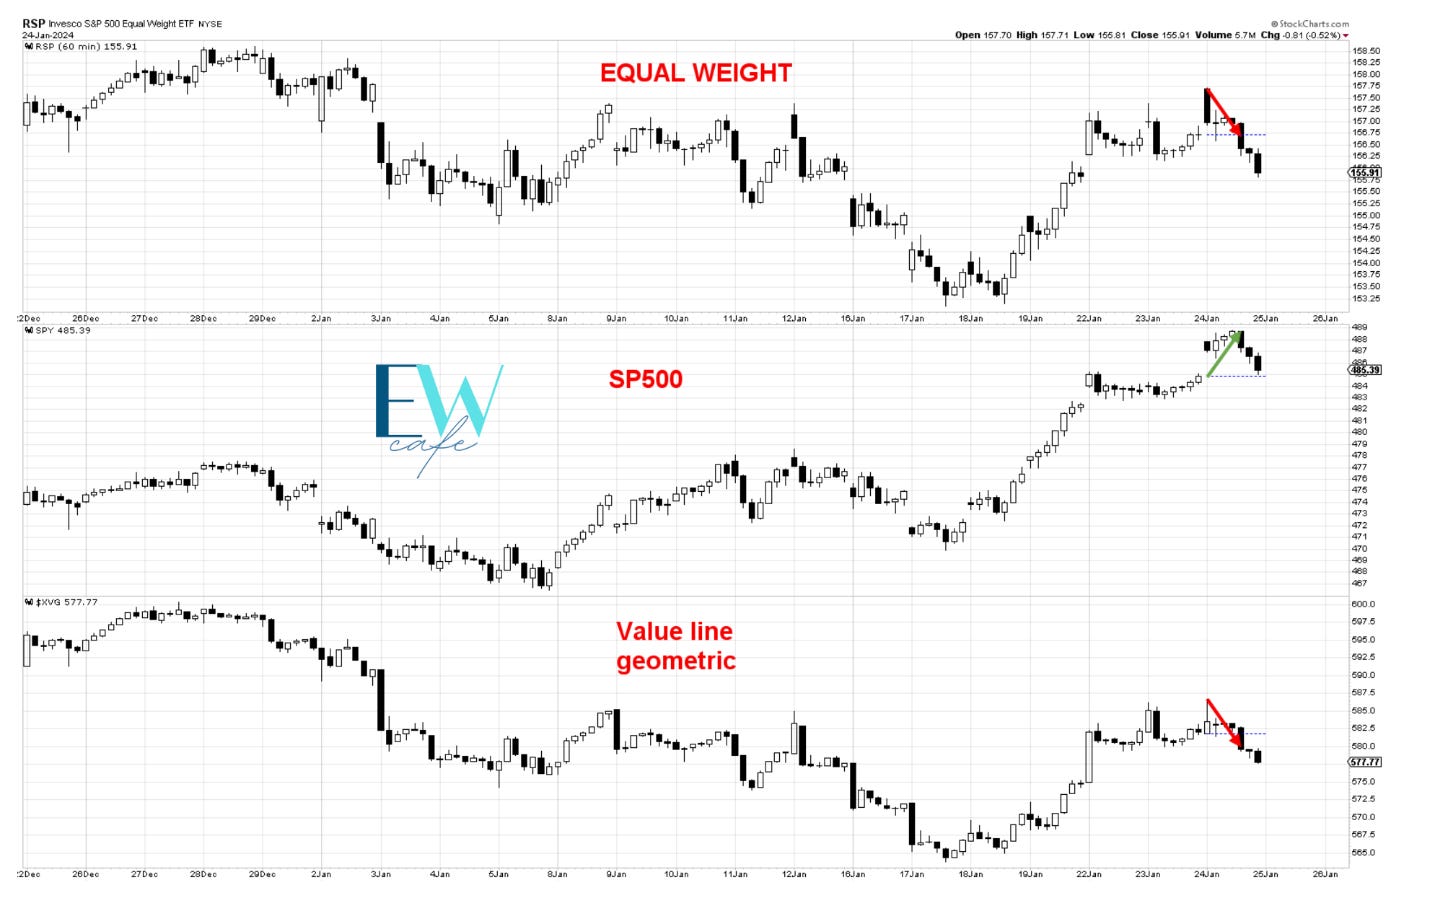
You can see what I was referring to in the picture below. The Sp500 was pushing higher without strong participation from the core market, shown here via the equally weighted RSP and the value line index XVG. It was putting in doubt the sustainability of the move. This is not an isolated incident; it has been happening since the year began.
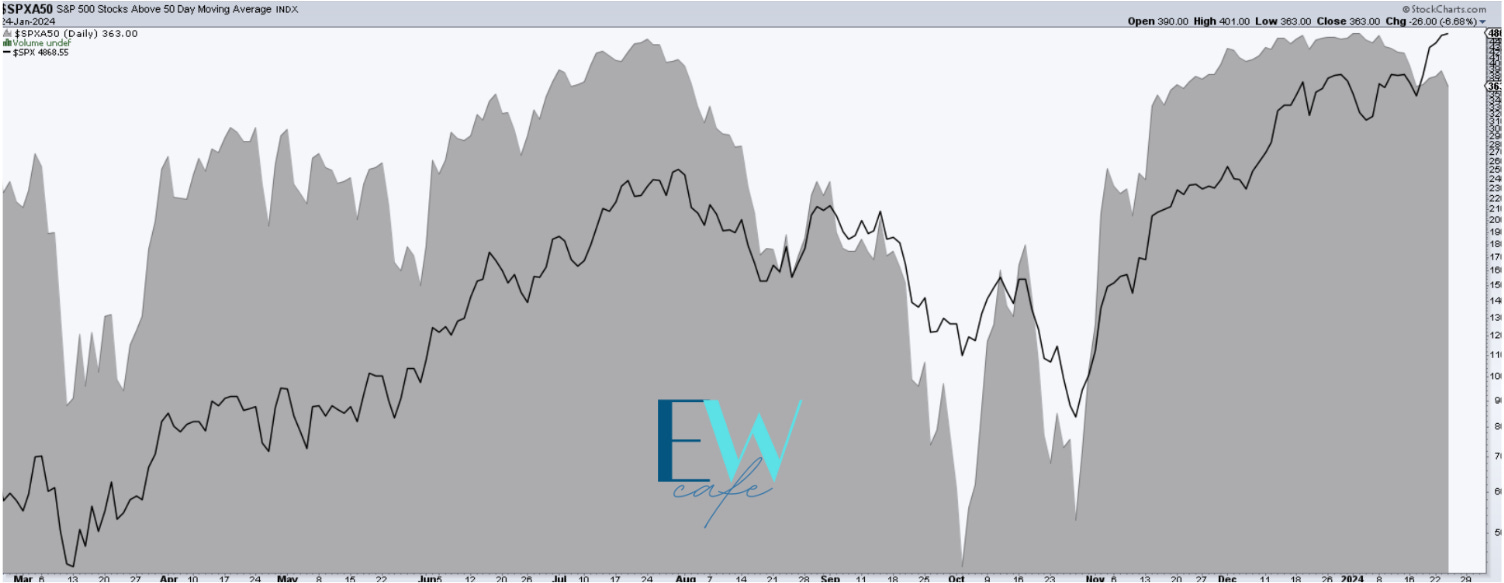
The dark area below represents the number of stocks above their 50-day moving average. The divergence with the price of the SP500 is now quite apparent. Notice how, at the lows in October, the number of those stocks was improving while the market overall was making new lows. It’s what gave me the confidence to put on the bullish hat when most were calling for Black Monday events.
For the past couple of days, I have been presenting this push higher as a 5-wave move, anticipating this push to new highs in wave v. Today we have gotten a slight taste of this being the correct approach. Further breaks lower below 4800 should solidify this call. We would be looking for a wave ((a)) to start forming.
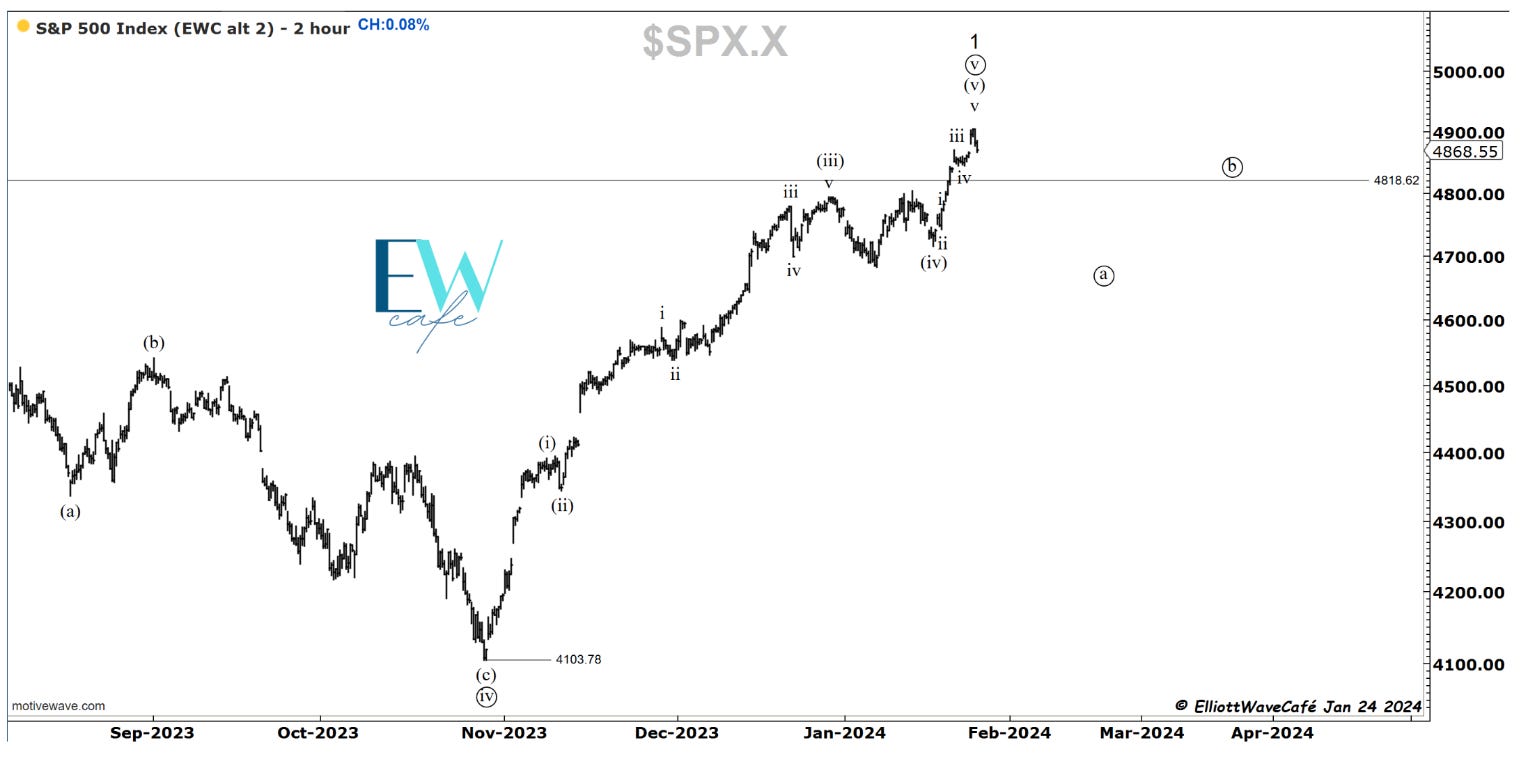
The bottom line is that the market is stretched mostly due to semiconductor names ripping and some large tech pull. The financials and health care, which are number 2 and 3 in the weighting of the SPX Index, are at their resistance zones and are not staging strong breakouts. So the question is, can tech pull on its own, or once it loses its luster, we get a larger selloff? Money needs to rotate in these other sectors to get a healthy climbing market. I will show you one more thing:
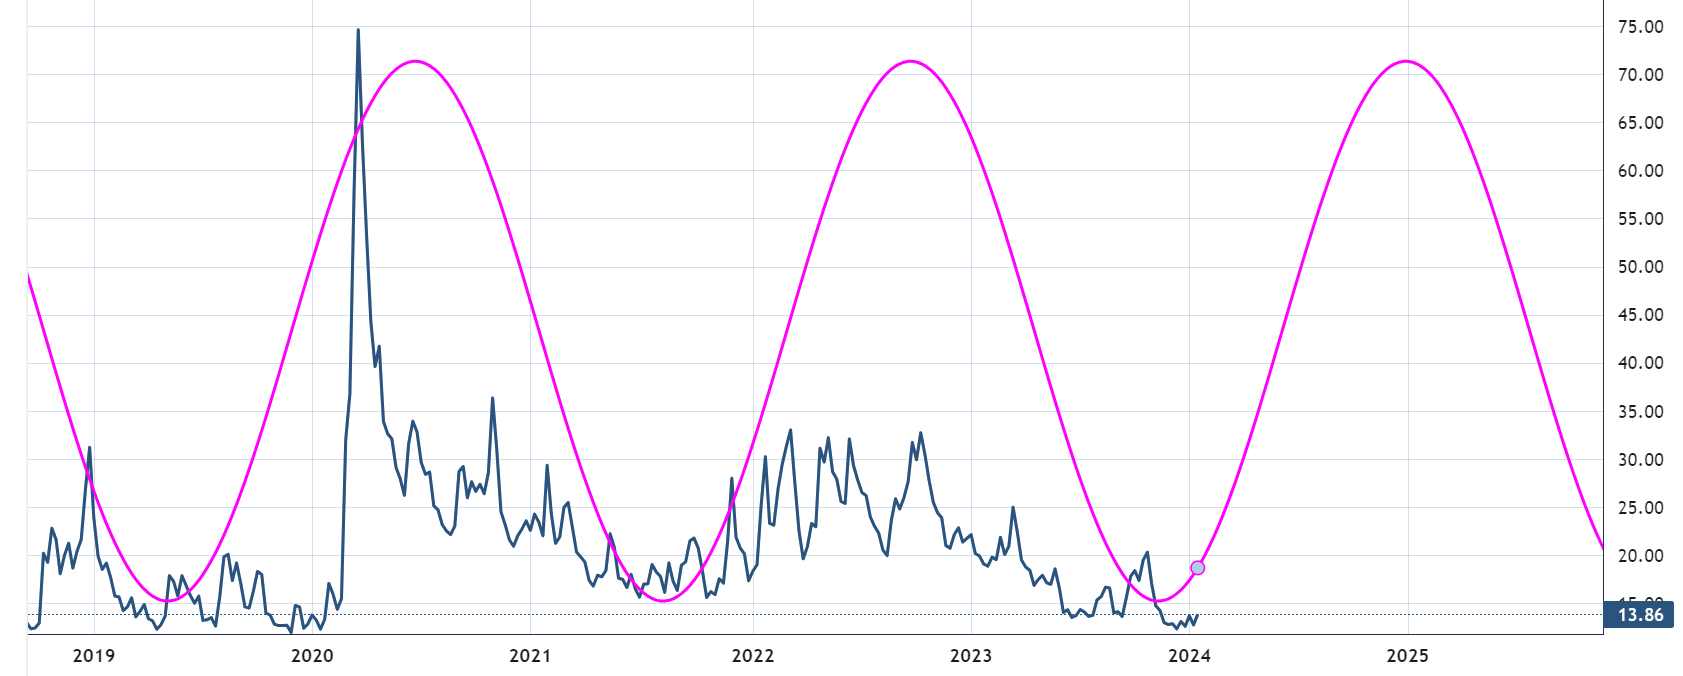
Here is the VIX weekly cycle; it is due for some serious upswing during 2024. How will it happen I have no idea. How high will it go? I have no idea. What I do know is this: if we’re getting into a higher volatility environment, it won’t be to the upside in risk. High volatility means downside price action in risk. Just a thought. Cycles are not perfect. This is the current active 120-day cycle.
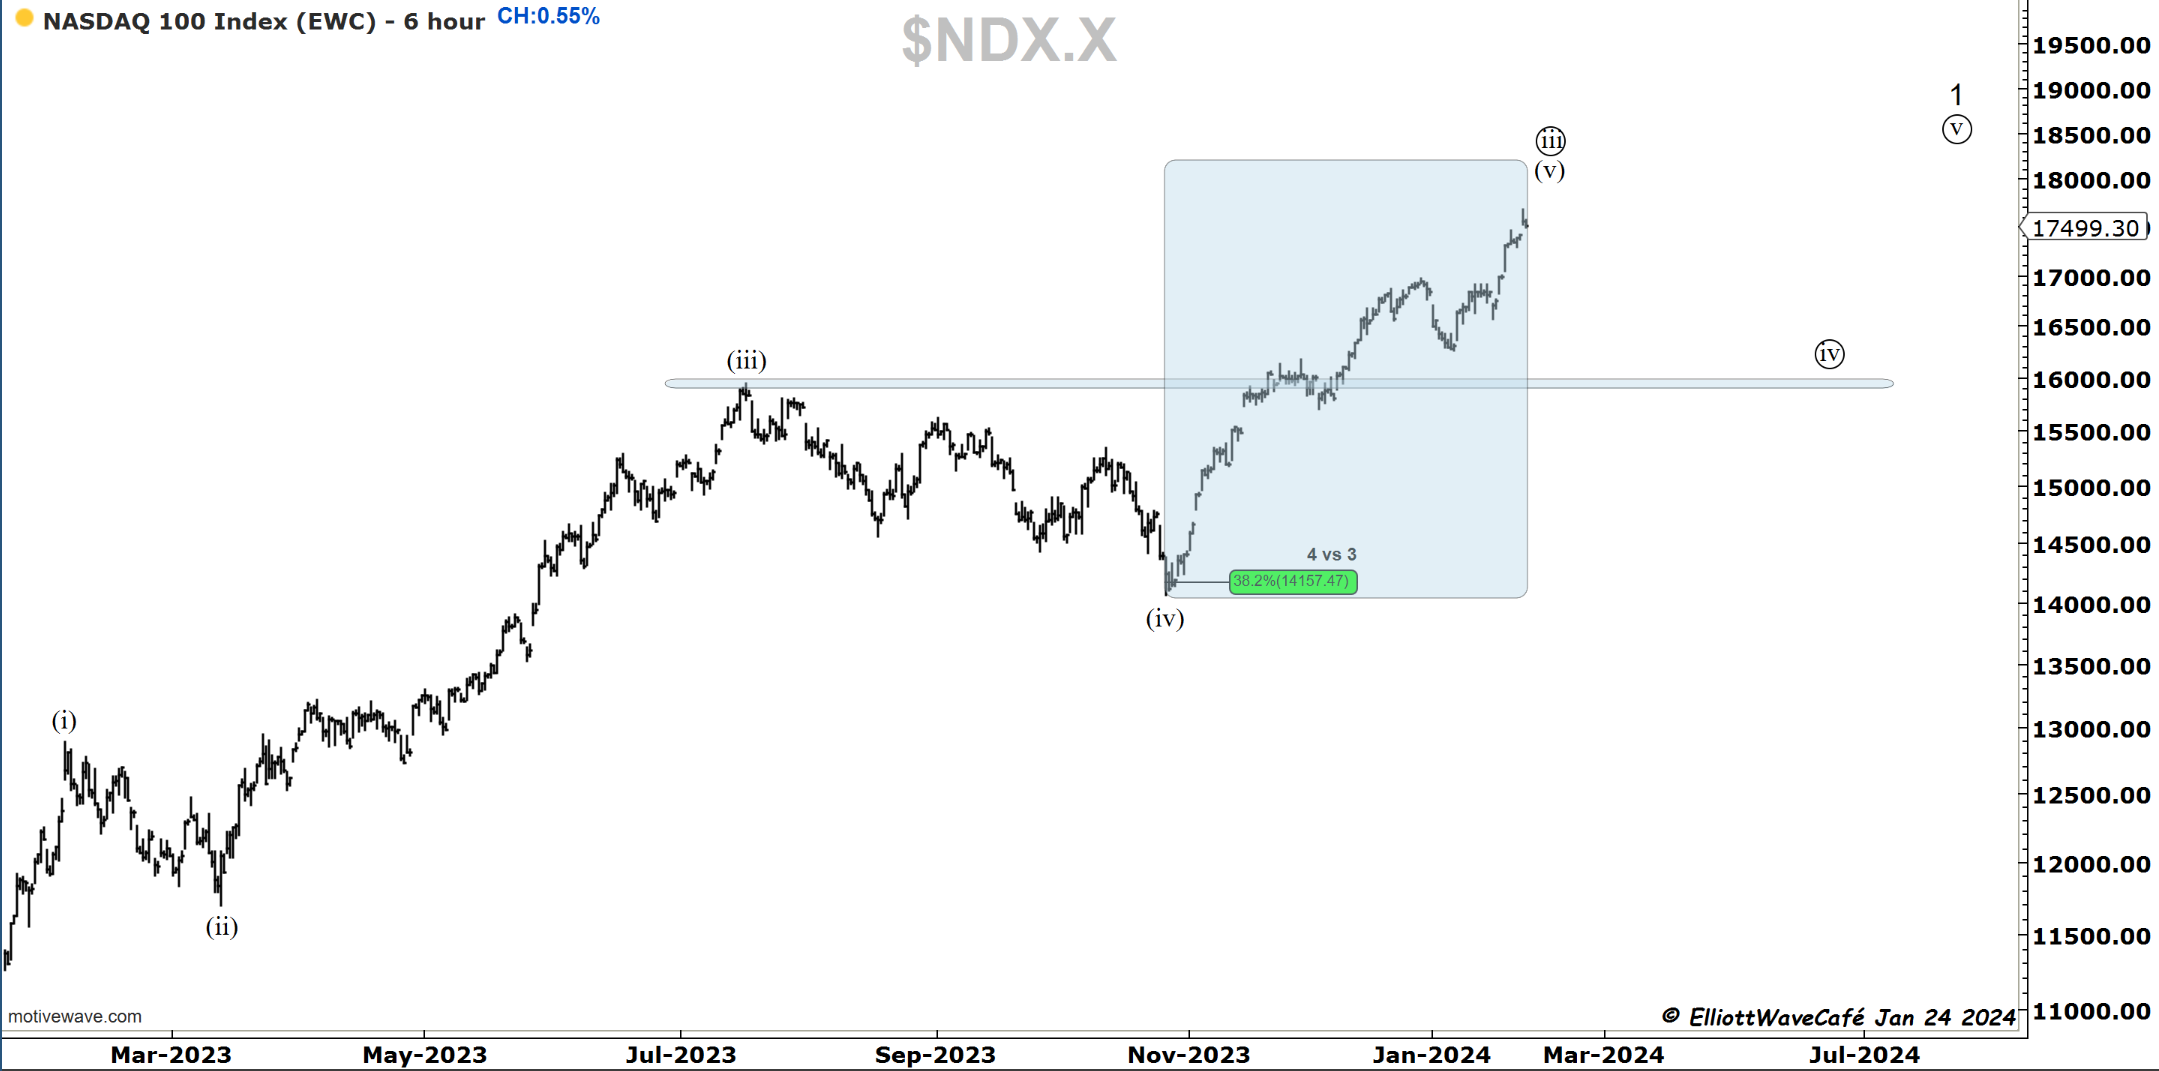
Nasdaq100
I will be honest with you. From an EW perspective, the structure in blue does not appear complete. The wave in the middle is the smallest. That unqualifies it as a third wave, and it creates issues at the current juncture. It appears that a few more legs higher would be needed to give us a cleaner view. If the market breaks below 17k without going higher first, we will have some labeling issues. I'm looking forward to seeing how this resolves and if today’s closing selloff is enough to trigger anything bigger, or it will quickly get bought up, and we will travel up again.
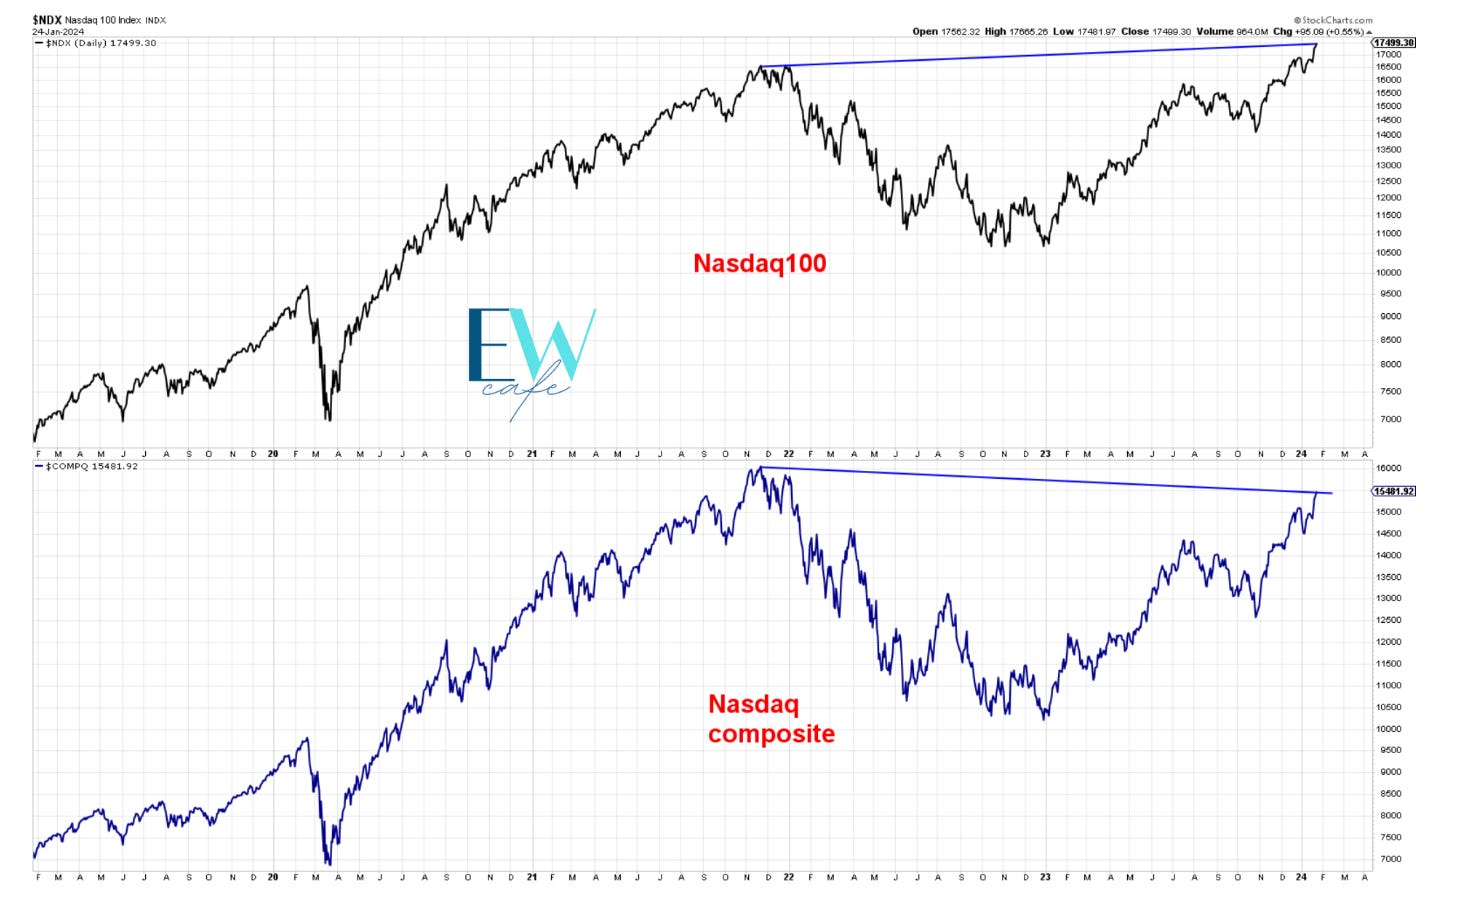
Something to think about below. The top panel is the top 100 stocks in the Nasdaq, and below, we have the rest, 2400. Not to say that the index won't follow suit higher, but for now, it hasn’t, and it warrants attention. You can see the same type of divergence if you look at Dow vs Transports, something I have displayed here several times.
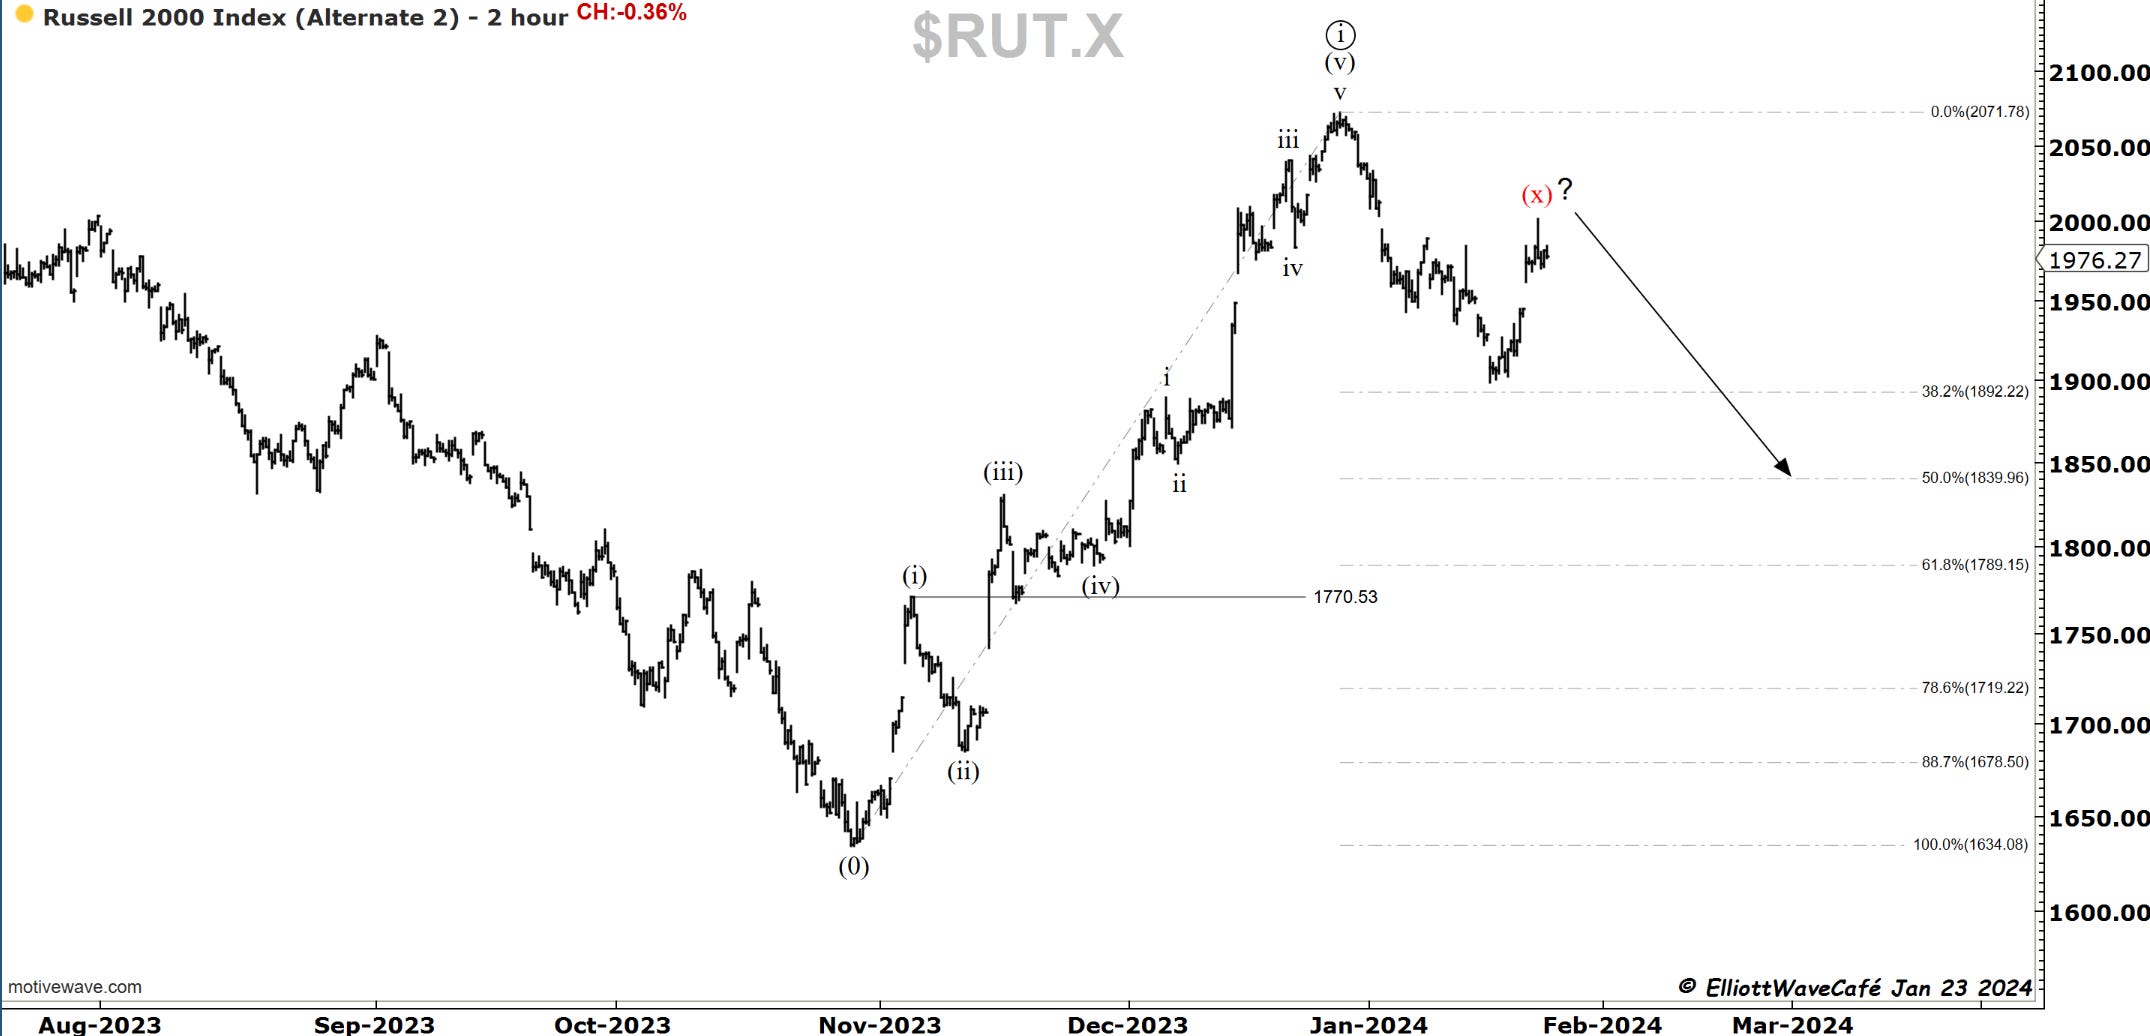
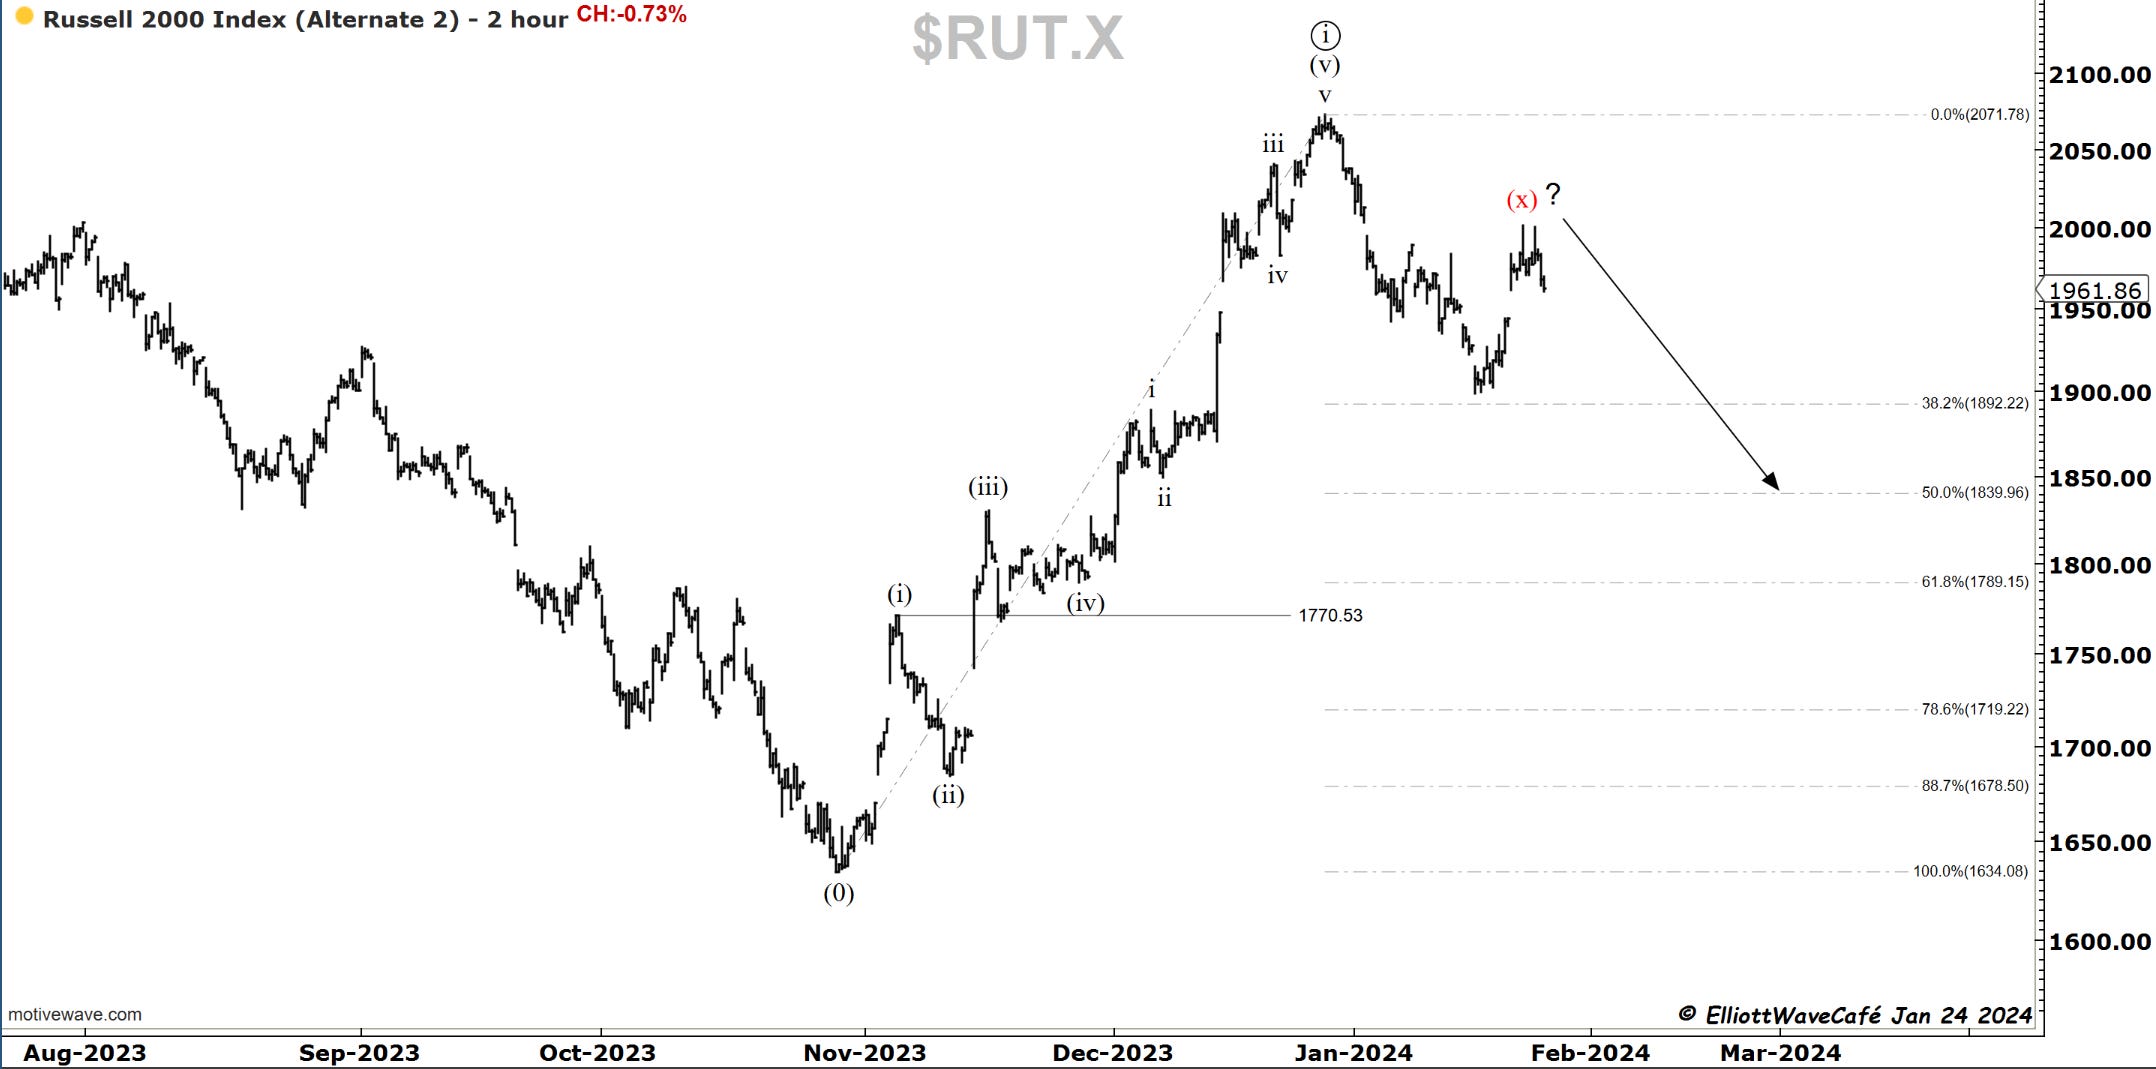
RUSSELL 2000
Yesterday, I presented the X-wave idea. Today, this market continued to act weak, and we ended up about 75bps lower. It's still a timid move that’s not very convincing yet, but if we lose 1930, I would be willing to say we’re onto something. Small caps were just not able to get off the ground. It probably has to do something with a rising yield environment.

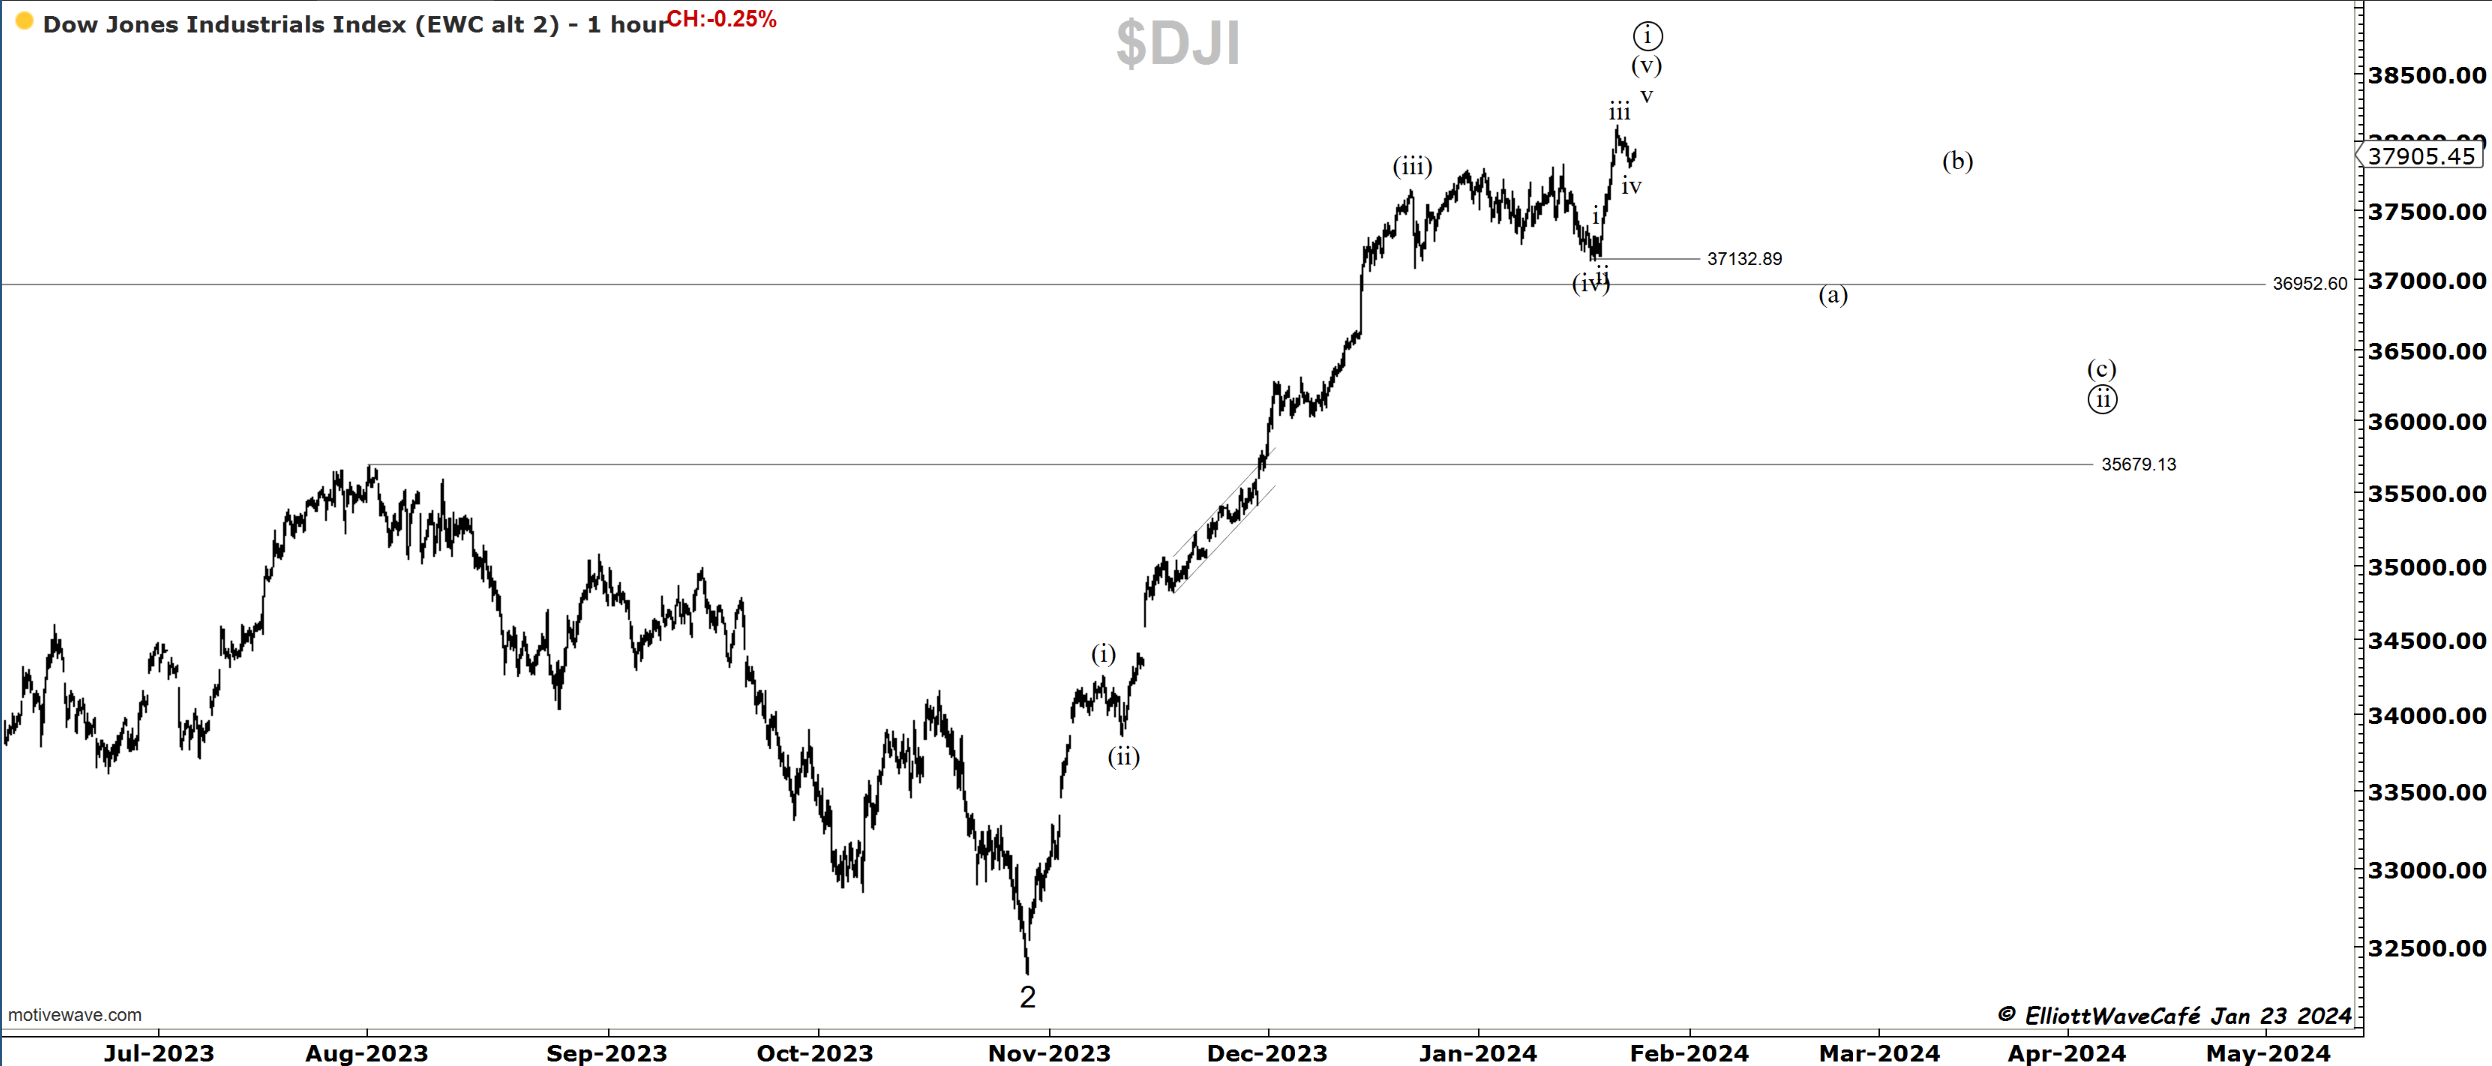
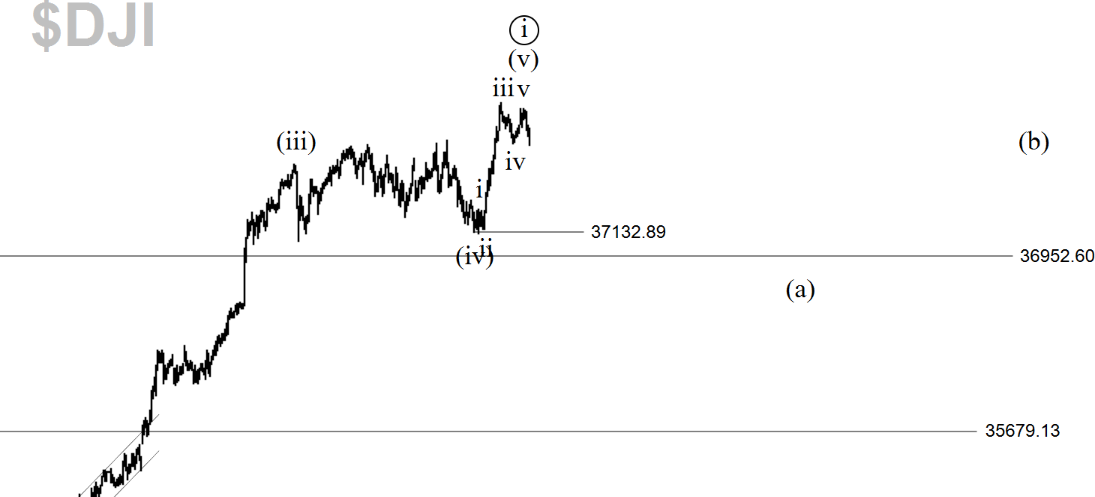
Dow30
Here are my comments from yesterday: Dow was negative as well, but it seems that one more push higher would terminate a 5-wave impulse. Then, we would look for a breakback below 37,800. I have sent an alert out today to members about opening short positions in this market.
In the second picture, I think we got that small fifth-wave push. I continue to see Dow as having the cleanest and most convincing 5-wave structure of all indices. My confidence in the short positions is high. A break of 37,132 will only grow it.
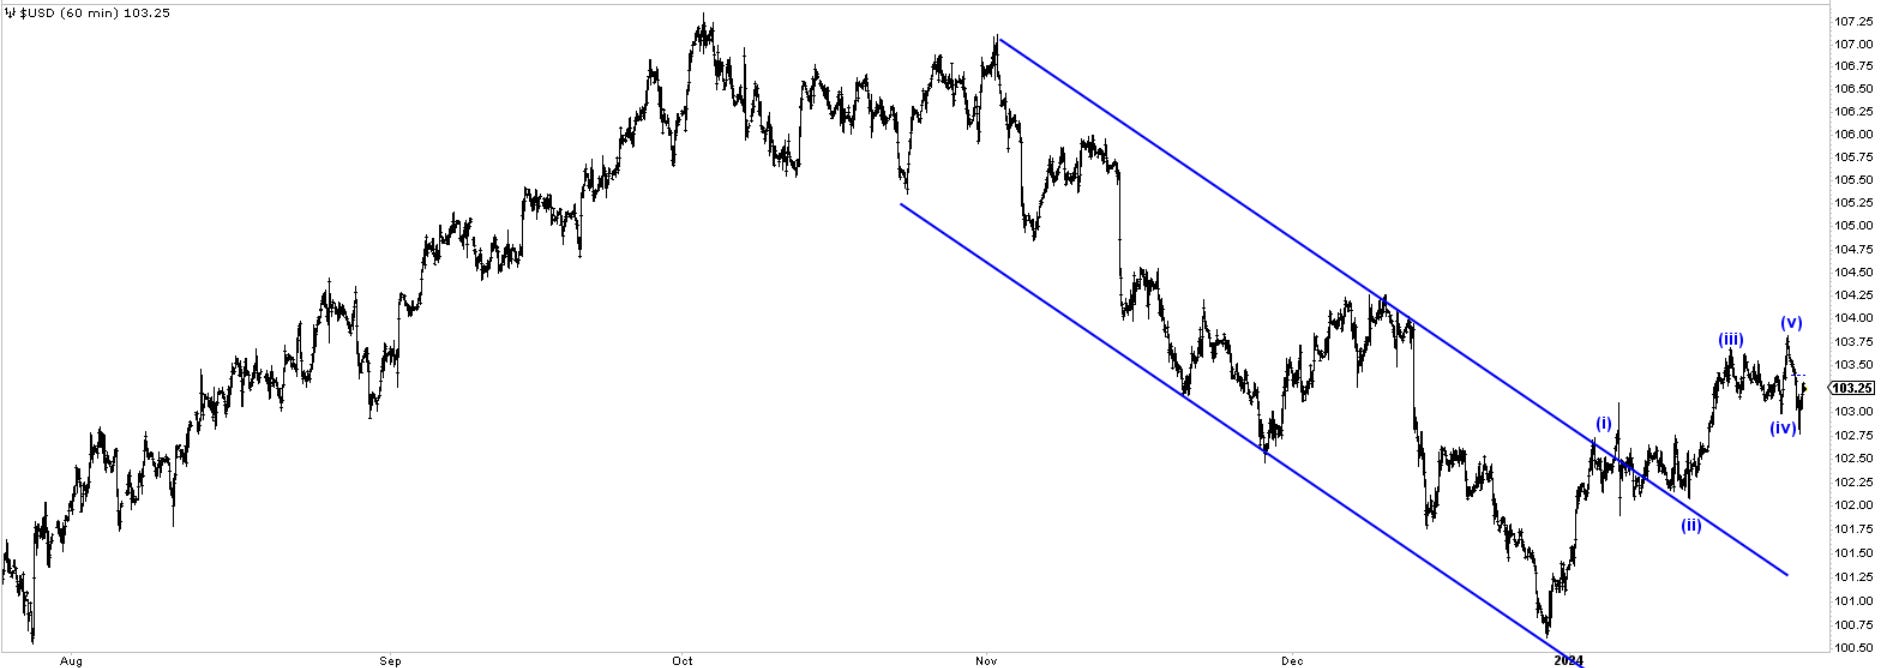
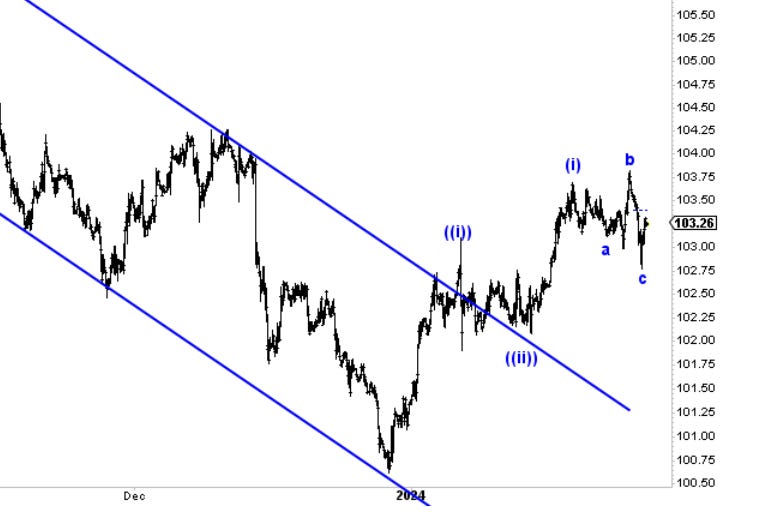
US Dollar and Yields
The dollar took a small beating after what seemed to be a 5 wave move up. We touched on that yesterday. It was followed by a quick recovery with risk selling off, but not enough to dismiss the idea of an ABC pullback. That would be the first chart. Based on that, any selloff should continue towards 102 levels.
The second chart shows how a quick expanded flat can form in wave two at the lower degree. Let’s keep an eye on this. If we break back above 103.75, I think we’ll have our answer.
Bitcoin
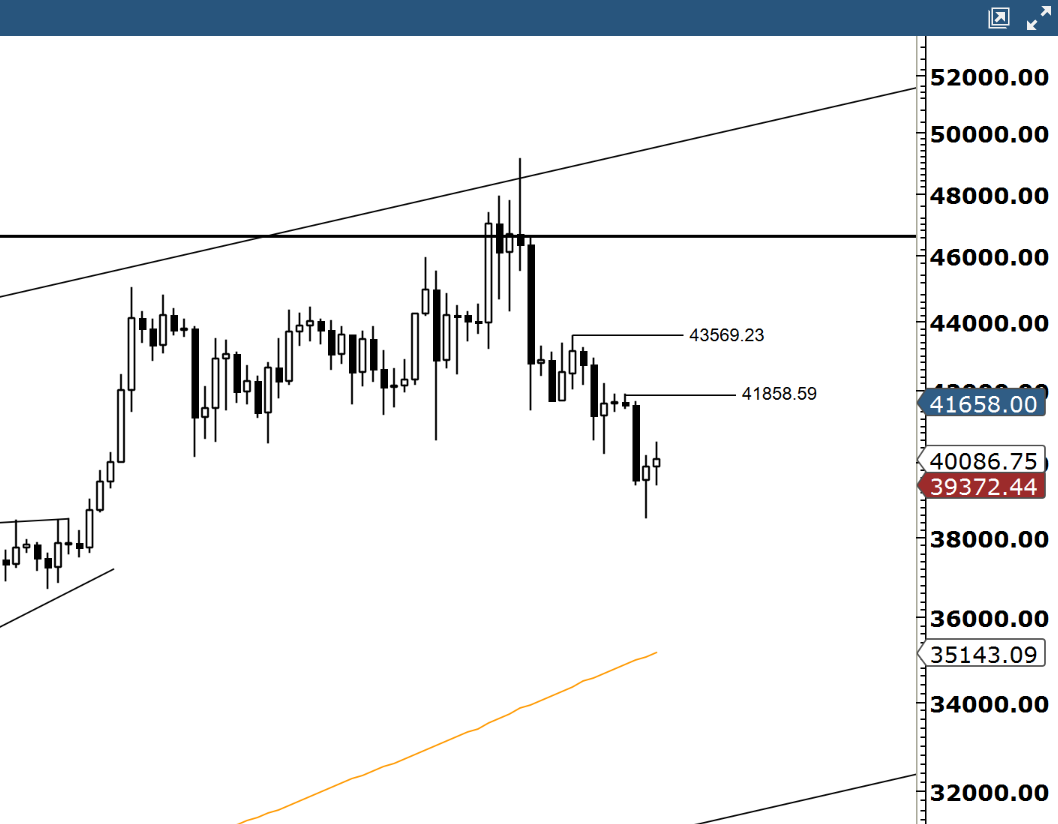
Bitcoin selloff has stabilized a bit but has yet to have a meaningful recovery. We continue to display a series of lower lows and lower highs from the channel top. I have reduced my short exposure a bit down here. The down sequence seems incomplete still, so I'm not sure if we’re ready to stage a (b) wave rally just yet.
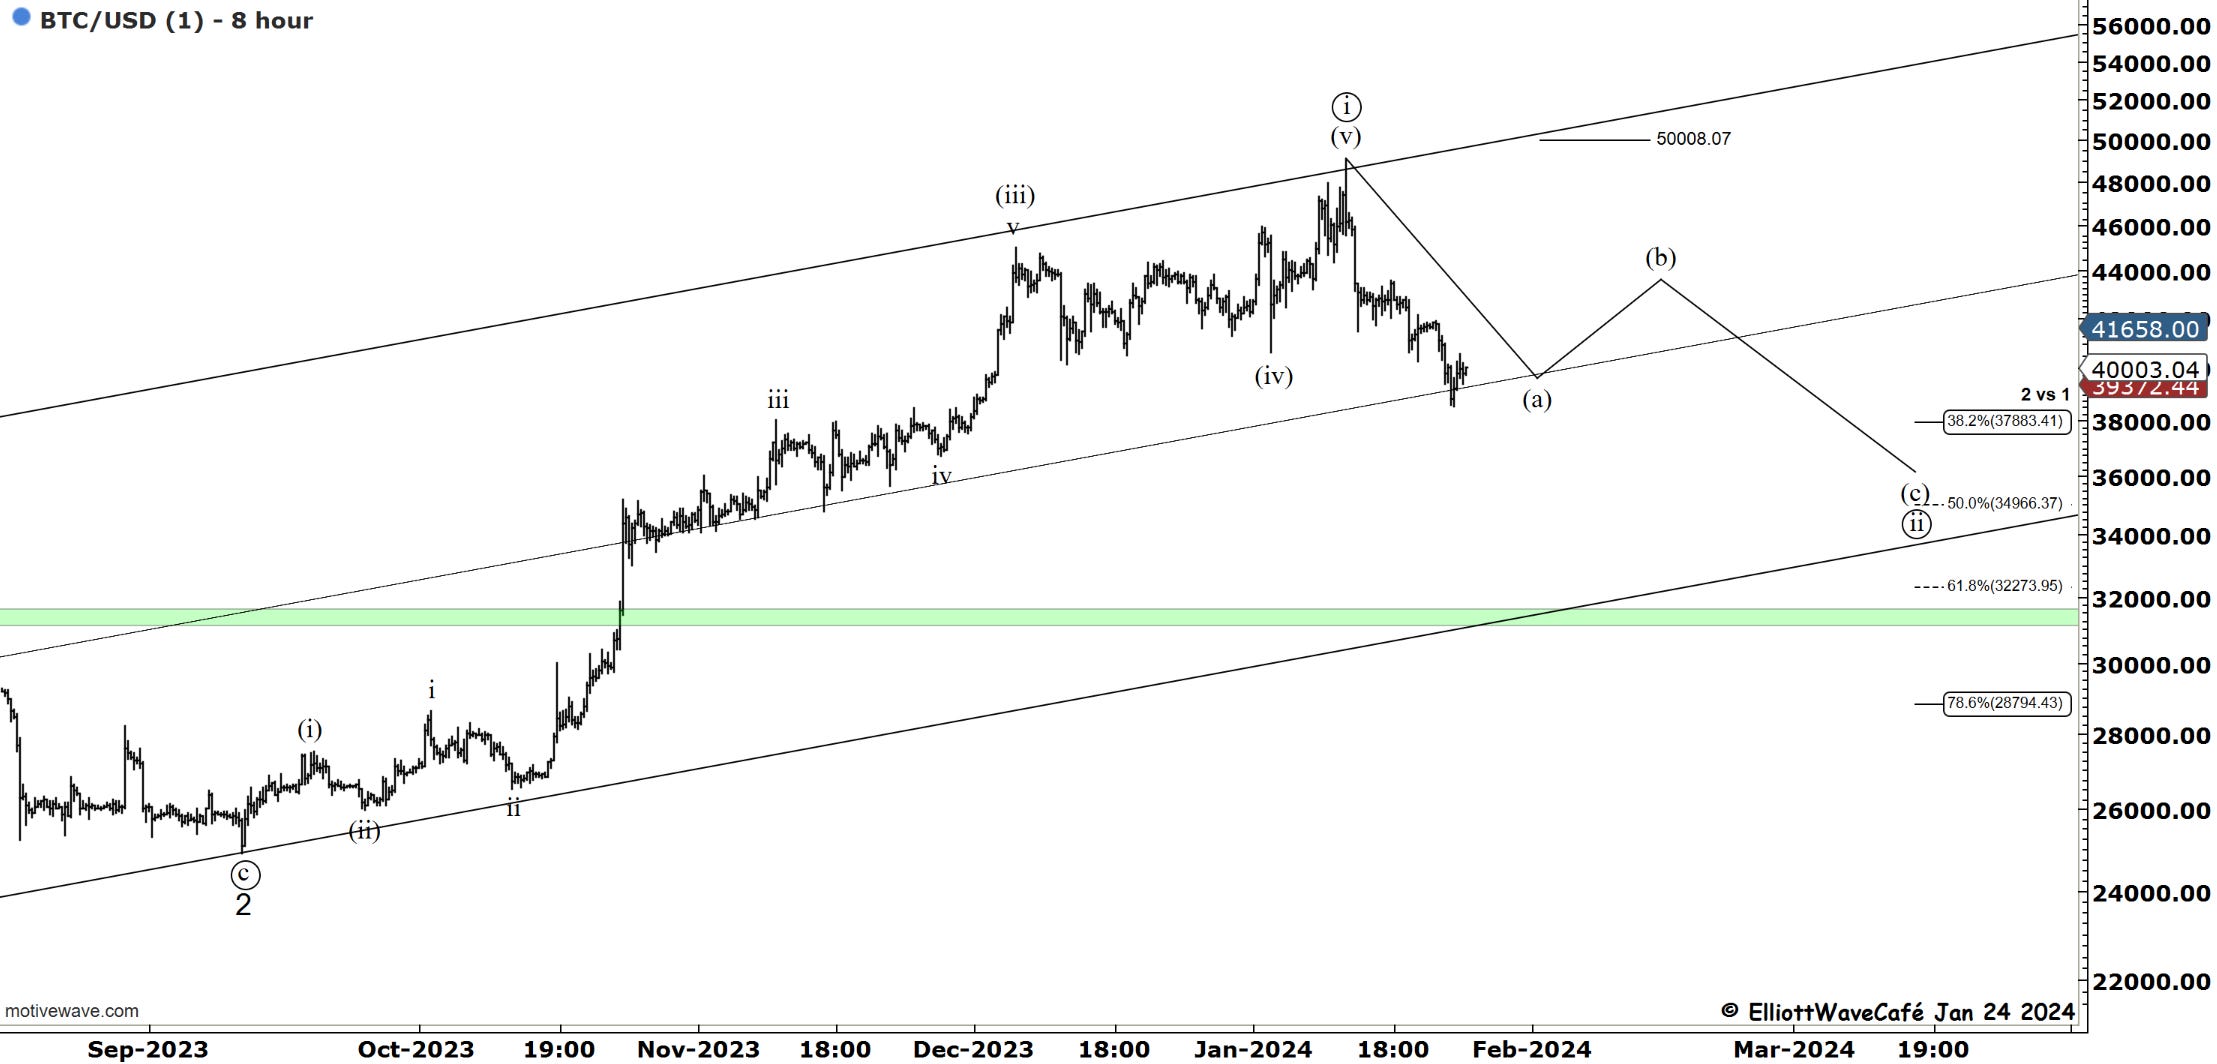
Sellers will likely show up again near 41800 and then 43500. If those levels get taken out, we can discuss the (b) wave. For now, it's still a bit premature. By the way, as a suggestion, trading B waves is a pain in the but. Stick with the A waves and even better C.
“Double shot” Daily member video coming up next,
If you’re new to Elliott Wave or need to refresh, there is a 7-hour video course with downloadable slides under The Coarse tab on the website.
Have a great day wherever you are! - trade well, and don’t forget to subscribe and drop a like if this letter helps you in any way.
Cris
email: ewcafe@pm.me