
The Daily Drip
Core markets charts updates and commentary
Note: The counts on the right edge are real-time, and they are prone to adjustments as price action develops. Elliott Wave has a fluid approach, is evidence-based, and requires constant monitoring of certain thresholds.
In the counts below, this (( )) = circle on chart
SP500
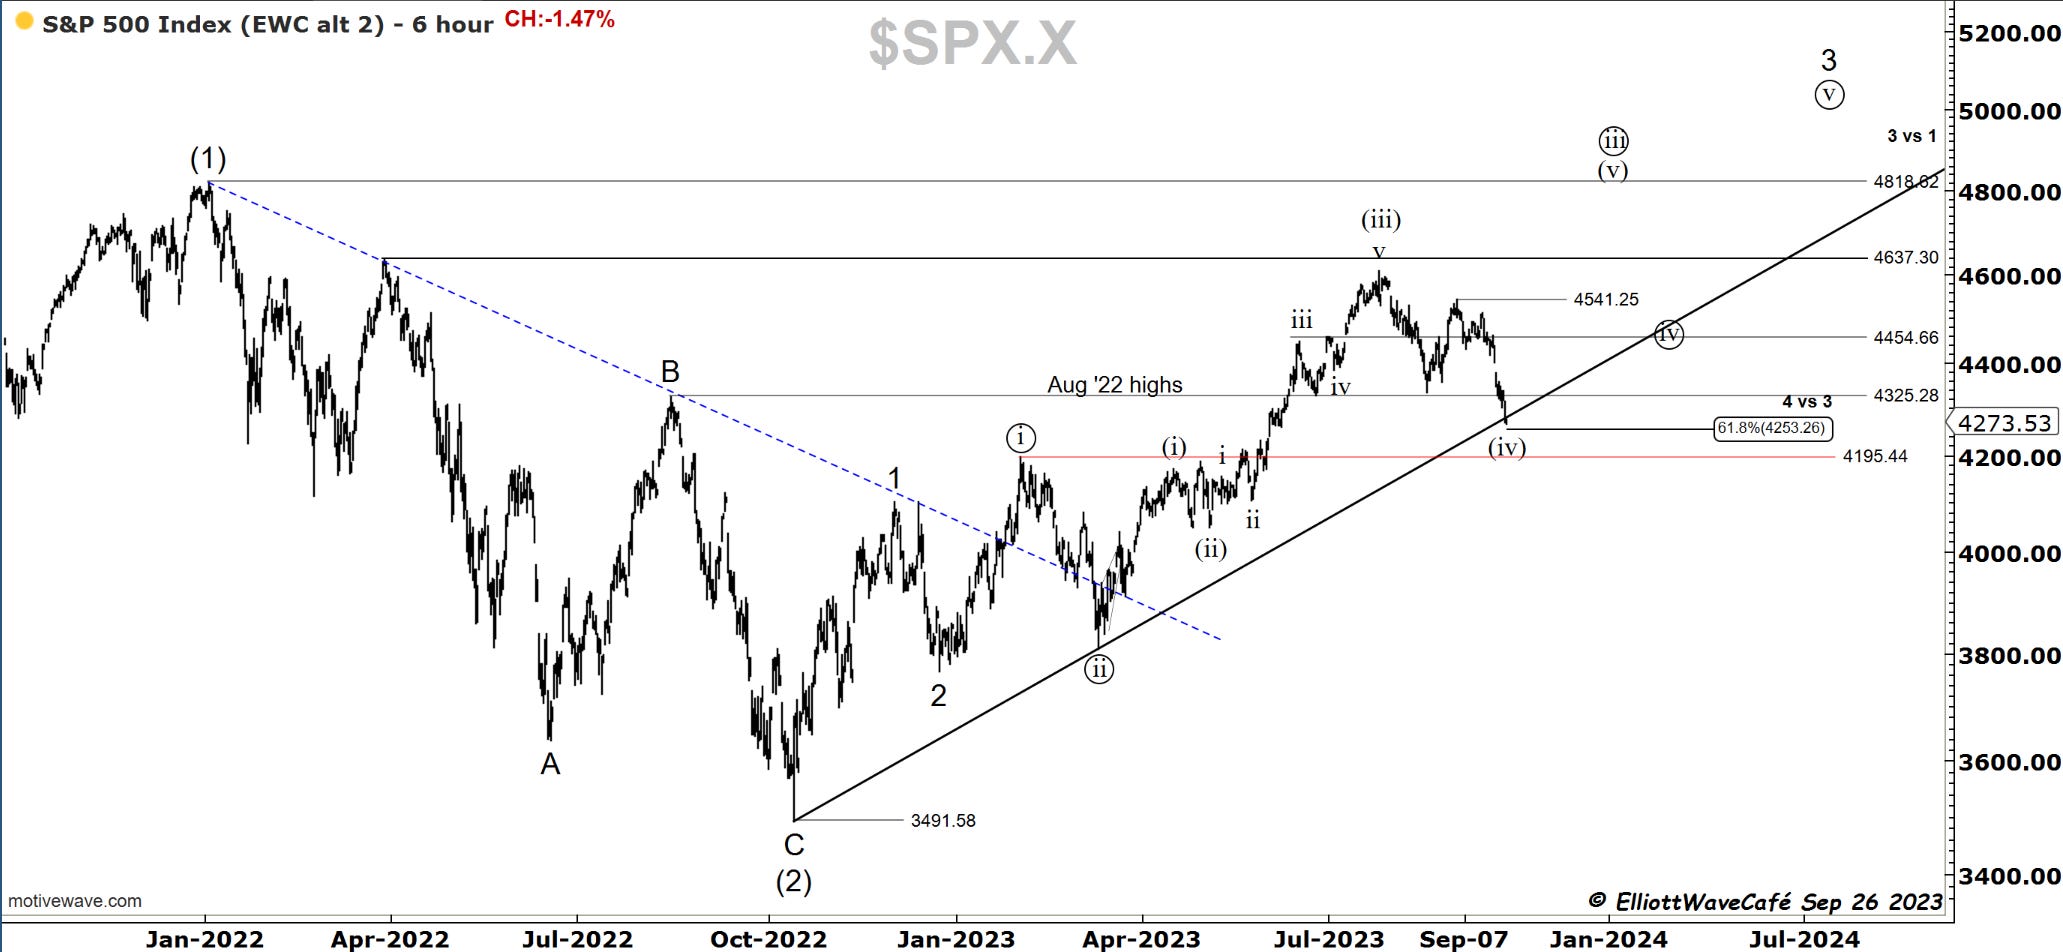
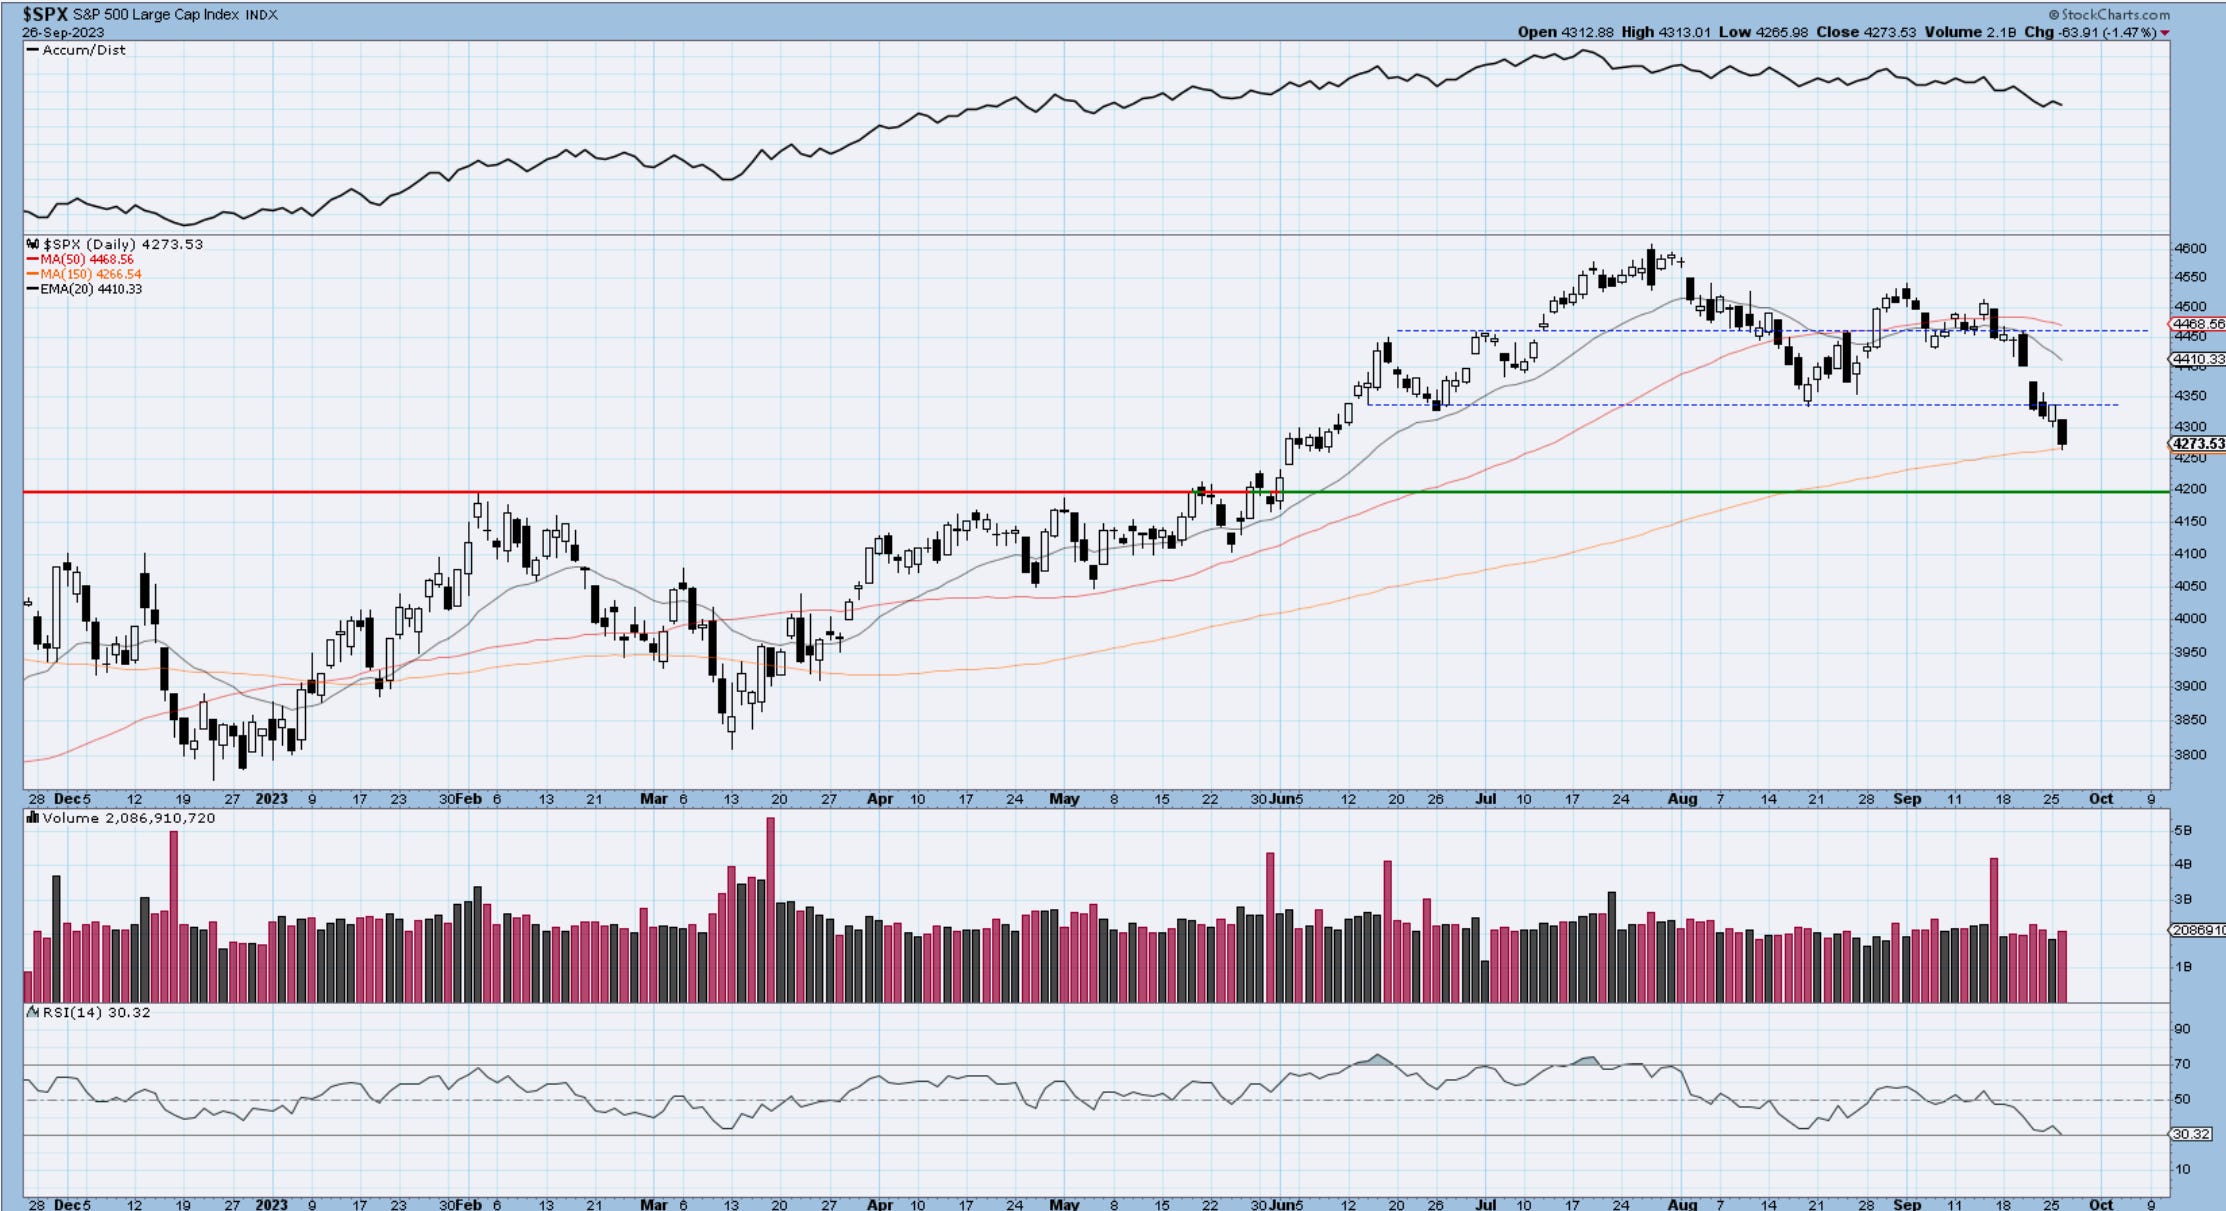
We gapped lower this morning and did not really look back throughout the course of the day. We are now very close to that very key 4200 levels. We broke out of that zone at the beginning of June. The 150-day MA rests here as well. If we get below those levels we have one more defensive stance for the current count and that is the top of wave 1 ( with wave 2 being a running flat instead of ((ii)) ). No evidence yet of price stabilization but we’re getting very close to it. Those levels will offer great risk/rewards for anyone trying to put some money to work. I see it as a decent fighting zone going forward.
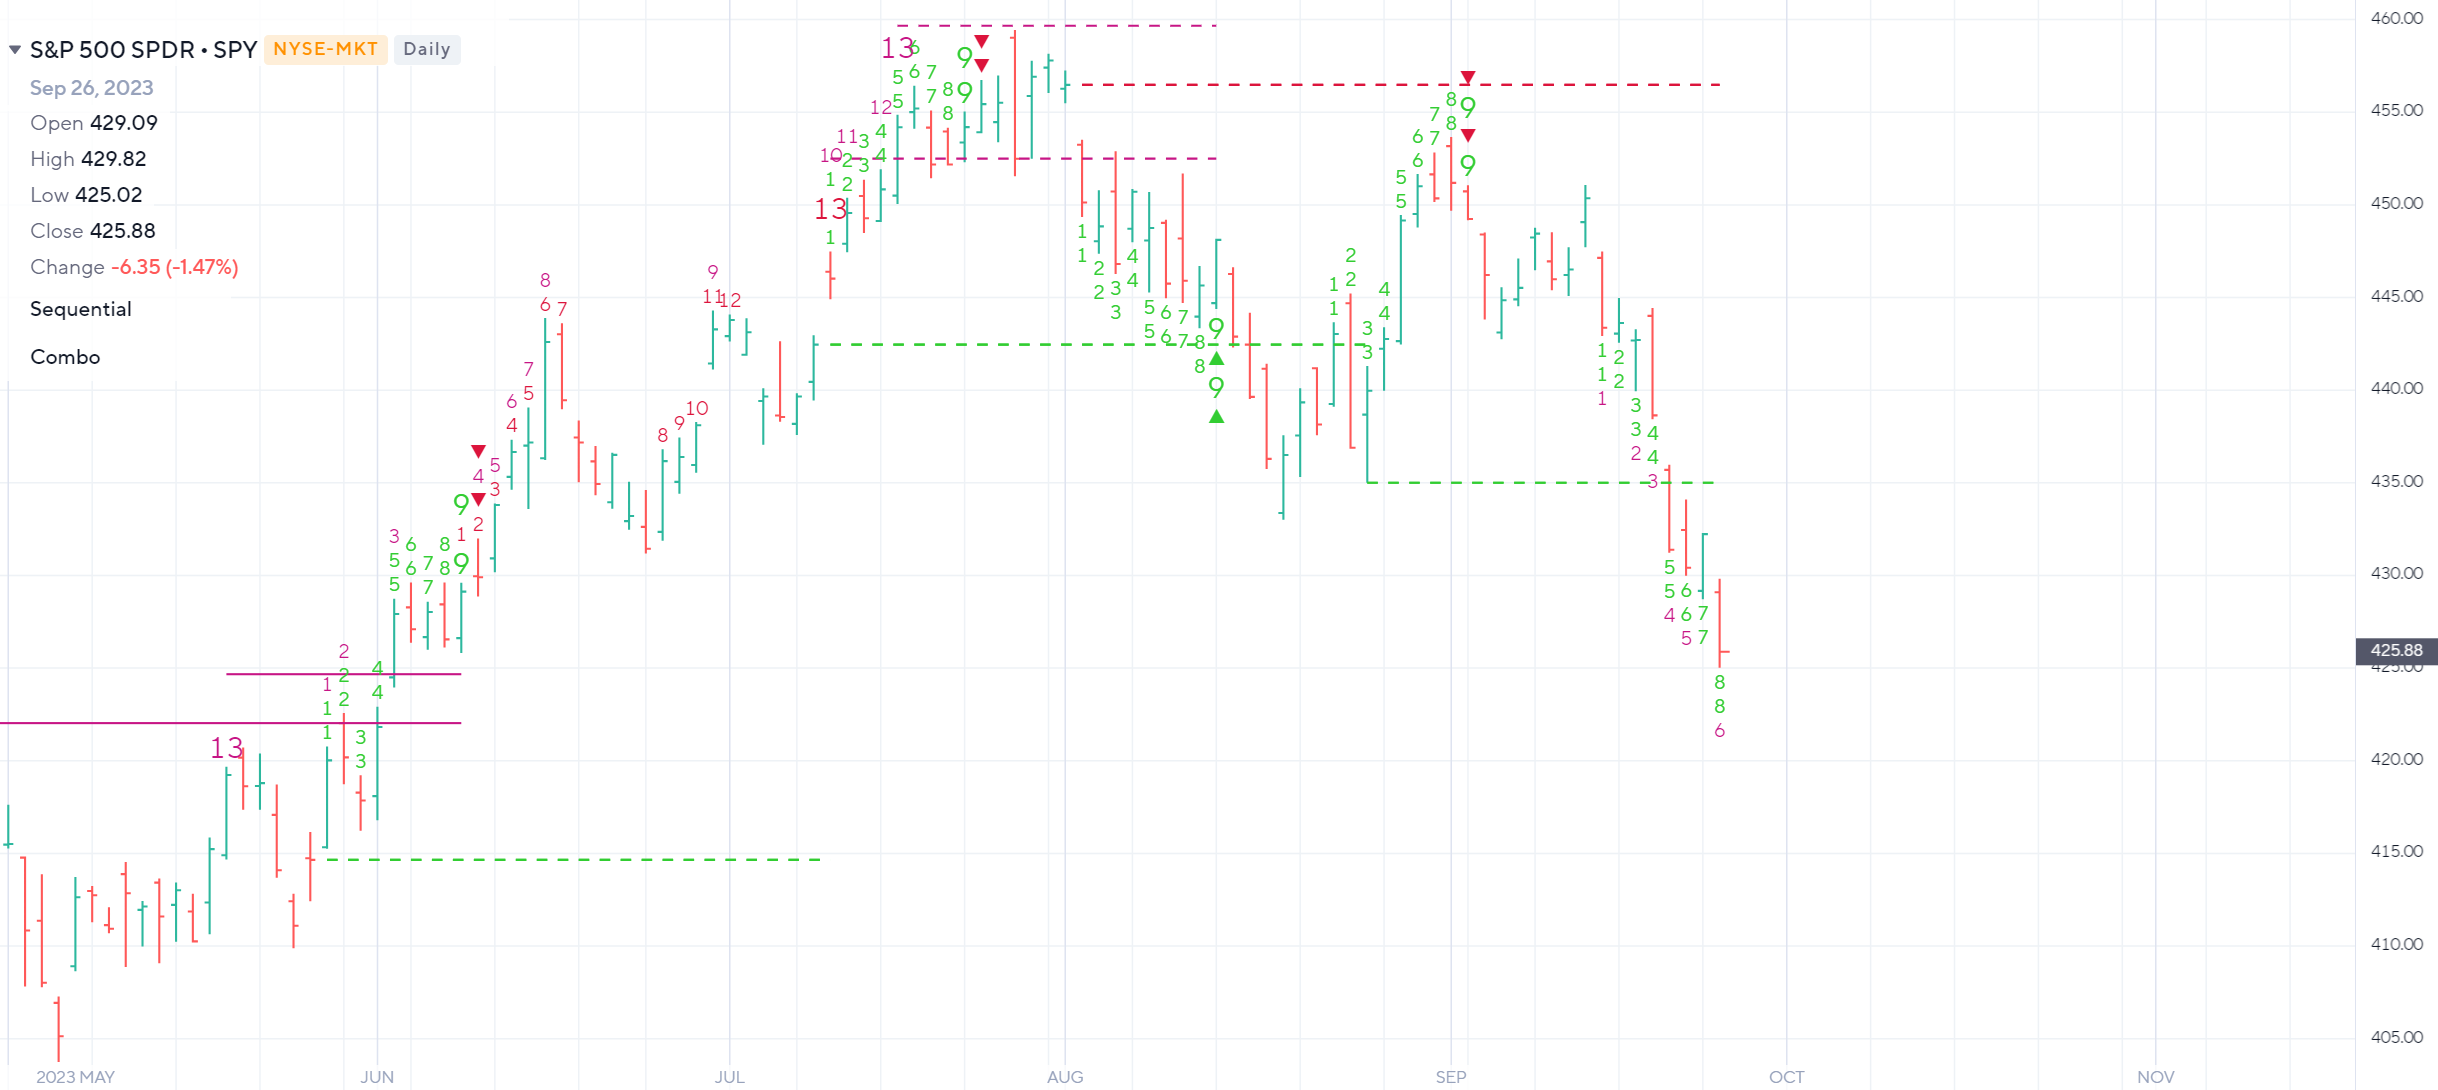
The 3rd chart shows the DeMark countdowns exhaustion and we are within a day of posting a 9 buy setup. It usually leads to a few days of upside and then we will see from there. It could just be the buildup of a 4th wave, with one more drop to go before the real rally higher begins.
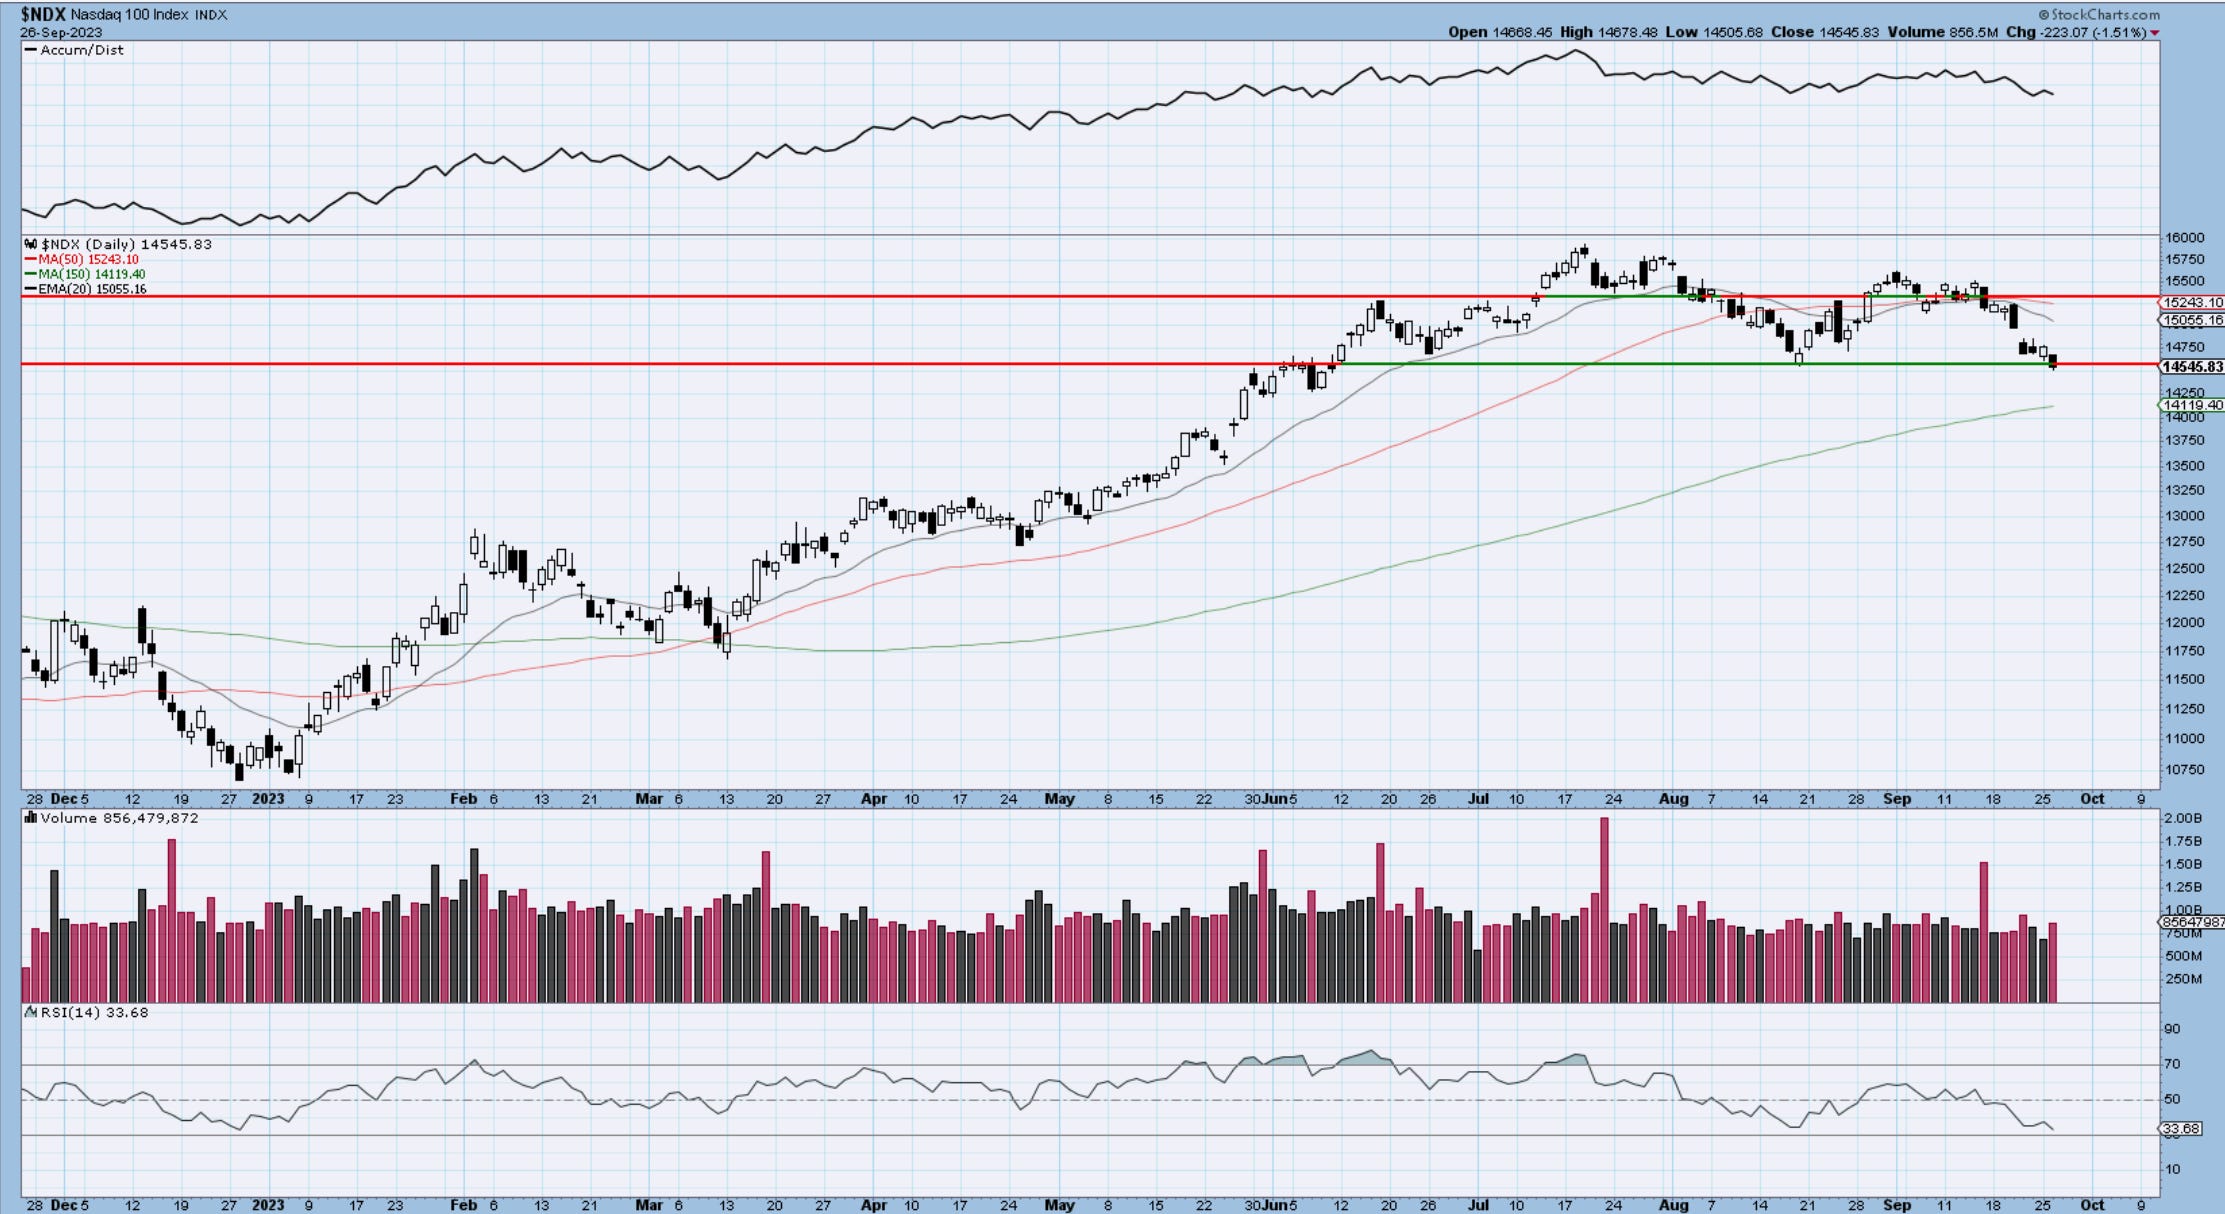
Nasdaq100
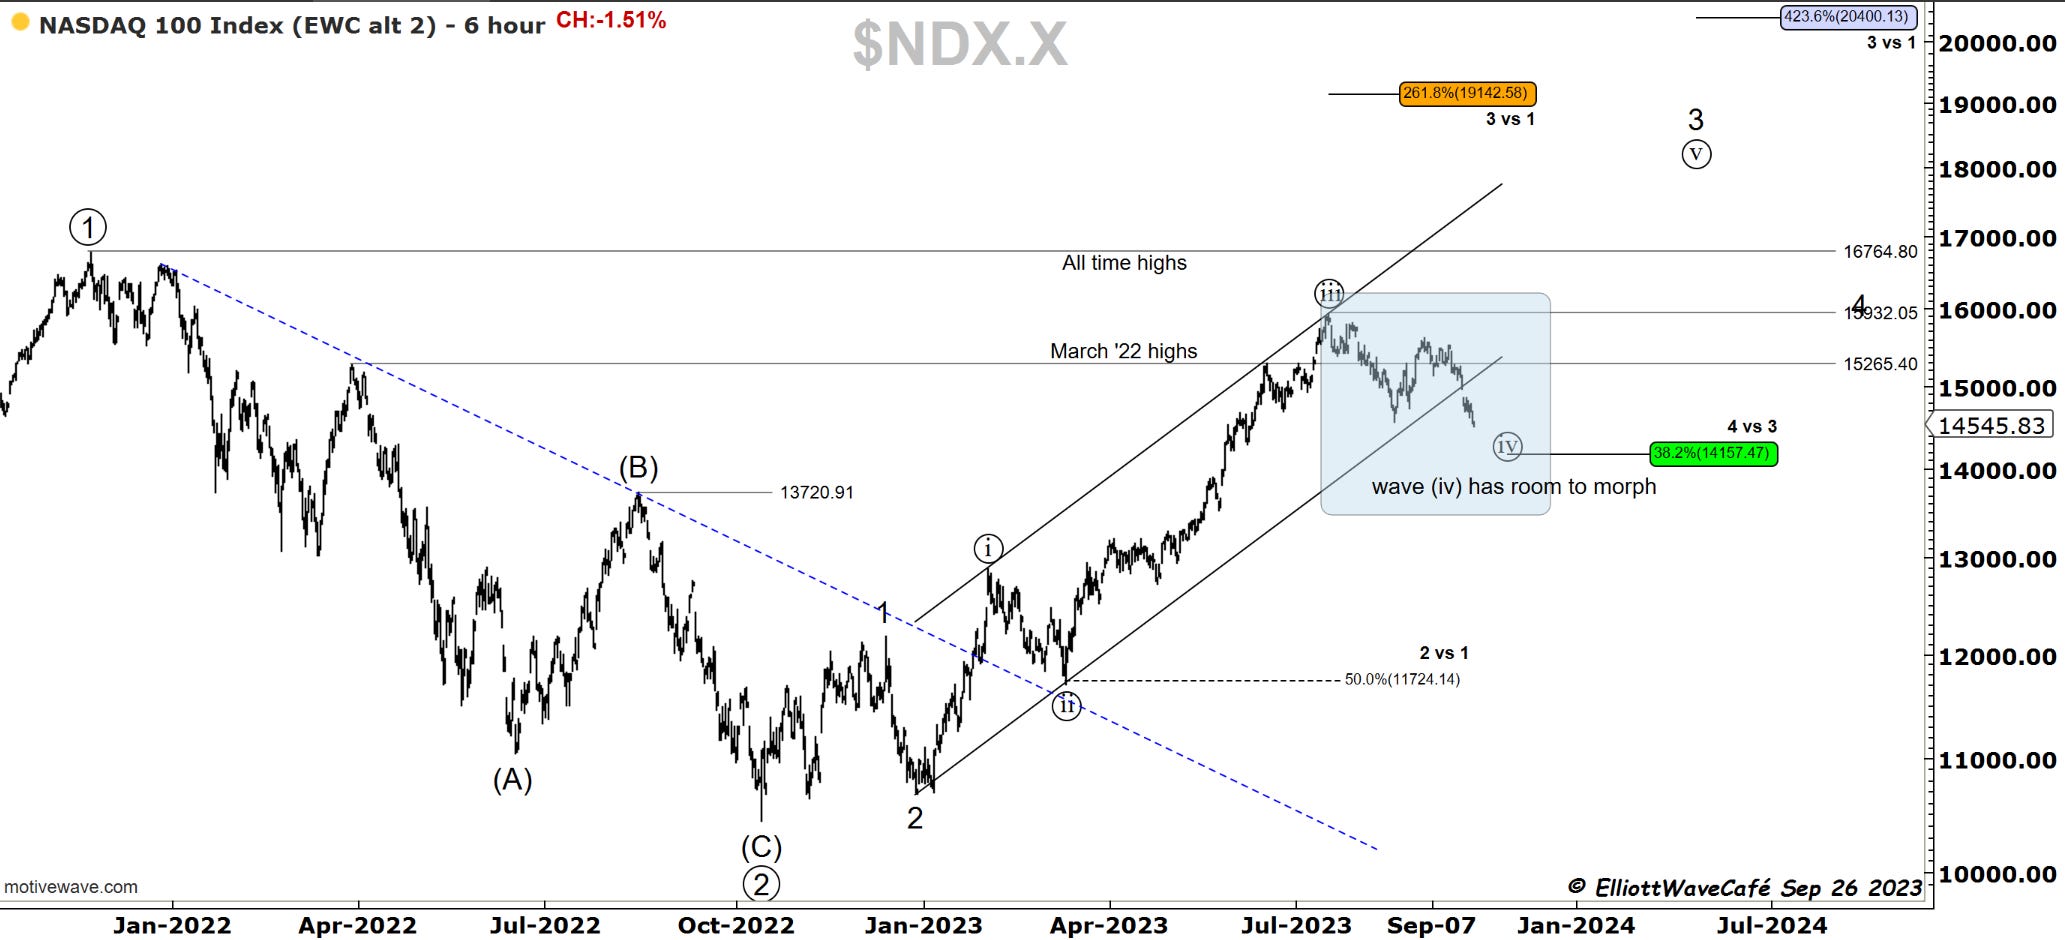
I have adjusted the count here to one higher degree. It is clear that the correction size has become quite large for it to still be part of a lower degree (iv). Since wave ((iii)) was very strong there is room and appeal for this wave ((iv)) to unfold. The .382 sits at 14,157 and just above the Aug ‘22 highs.
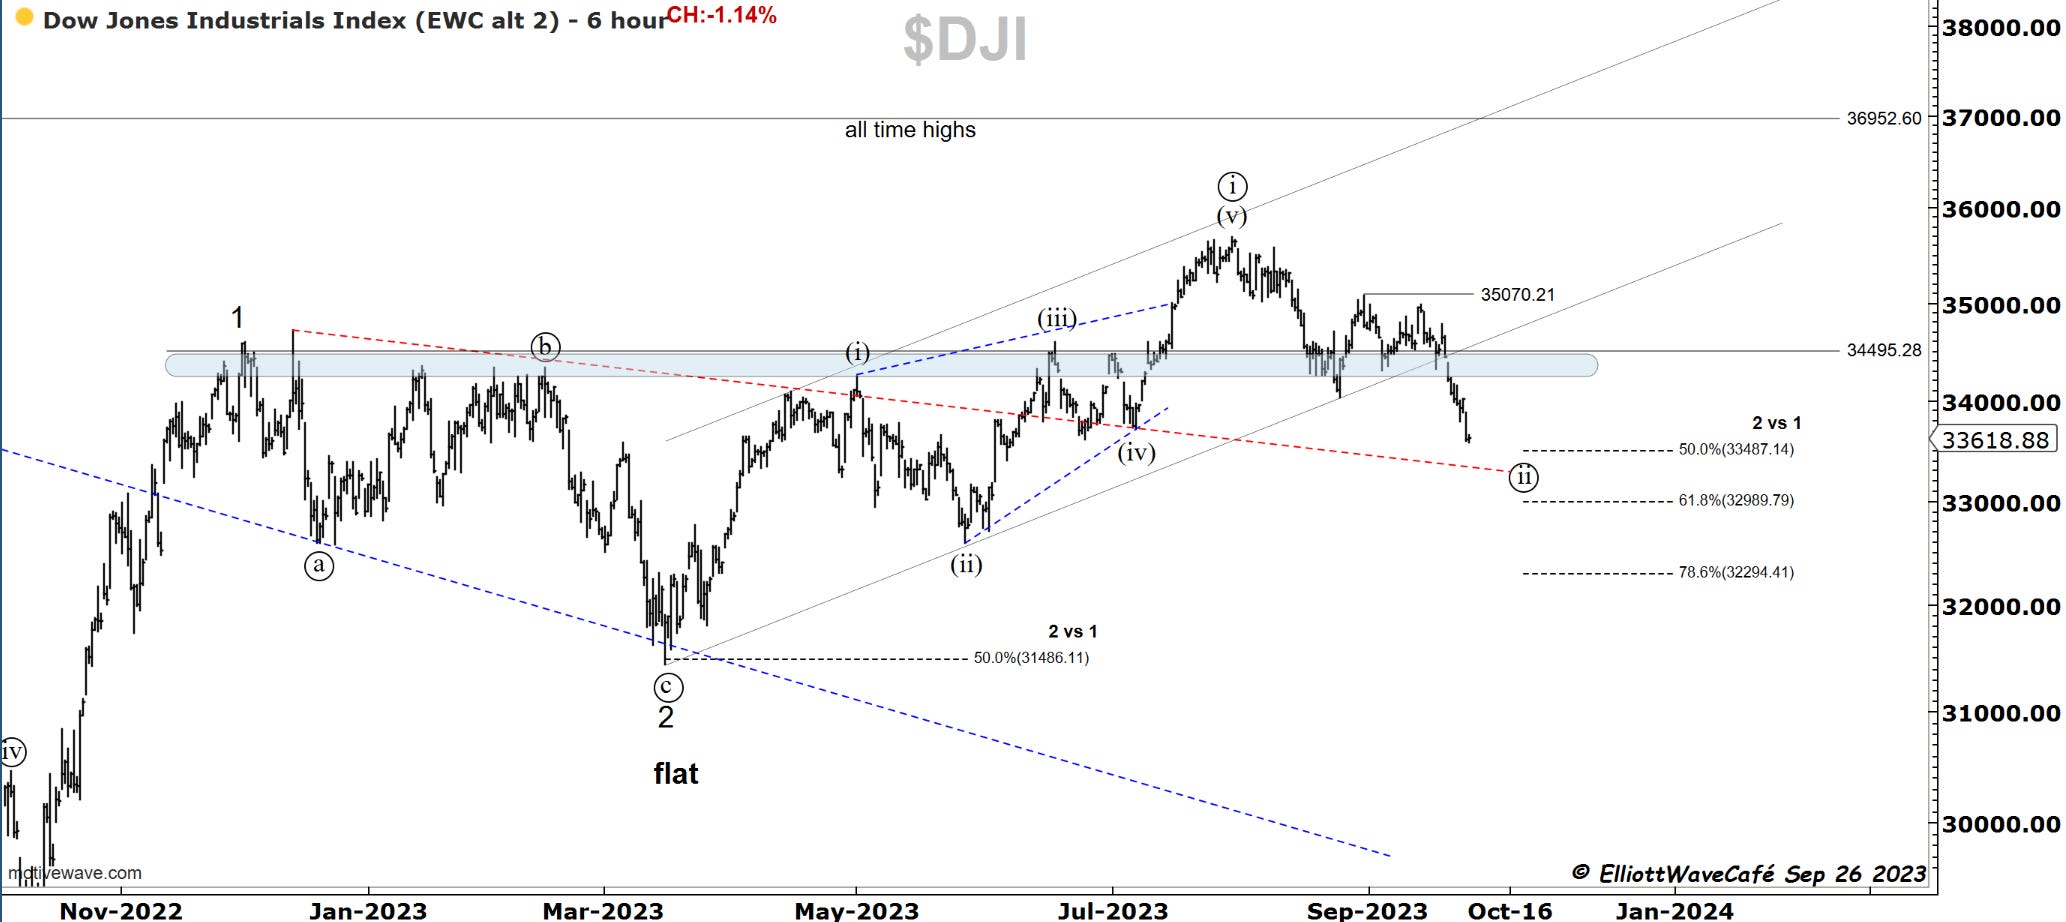
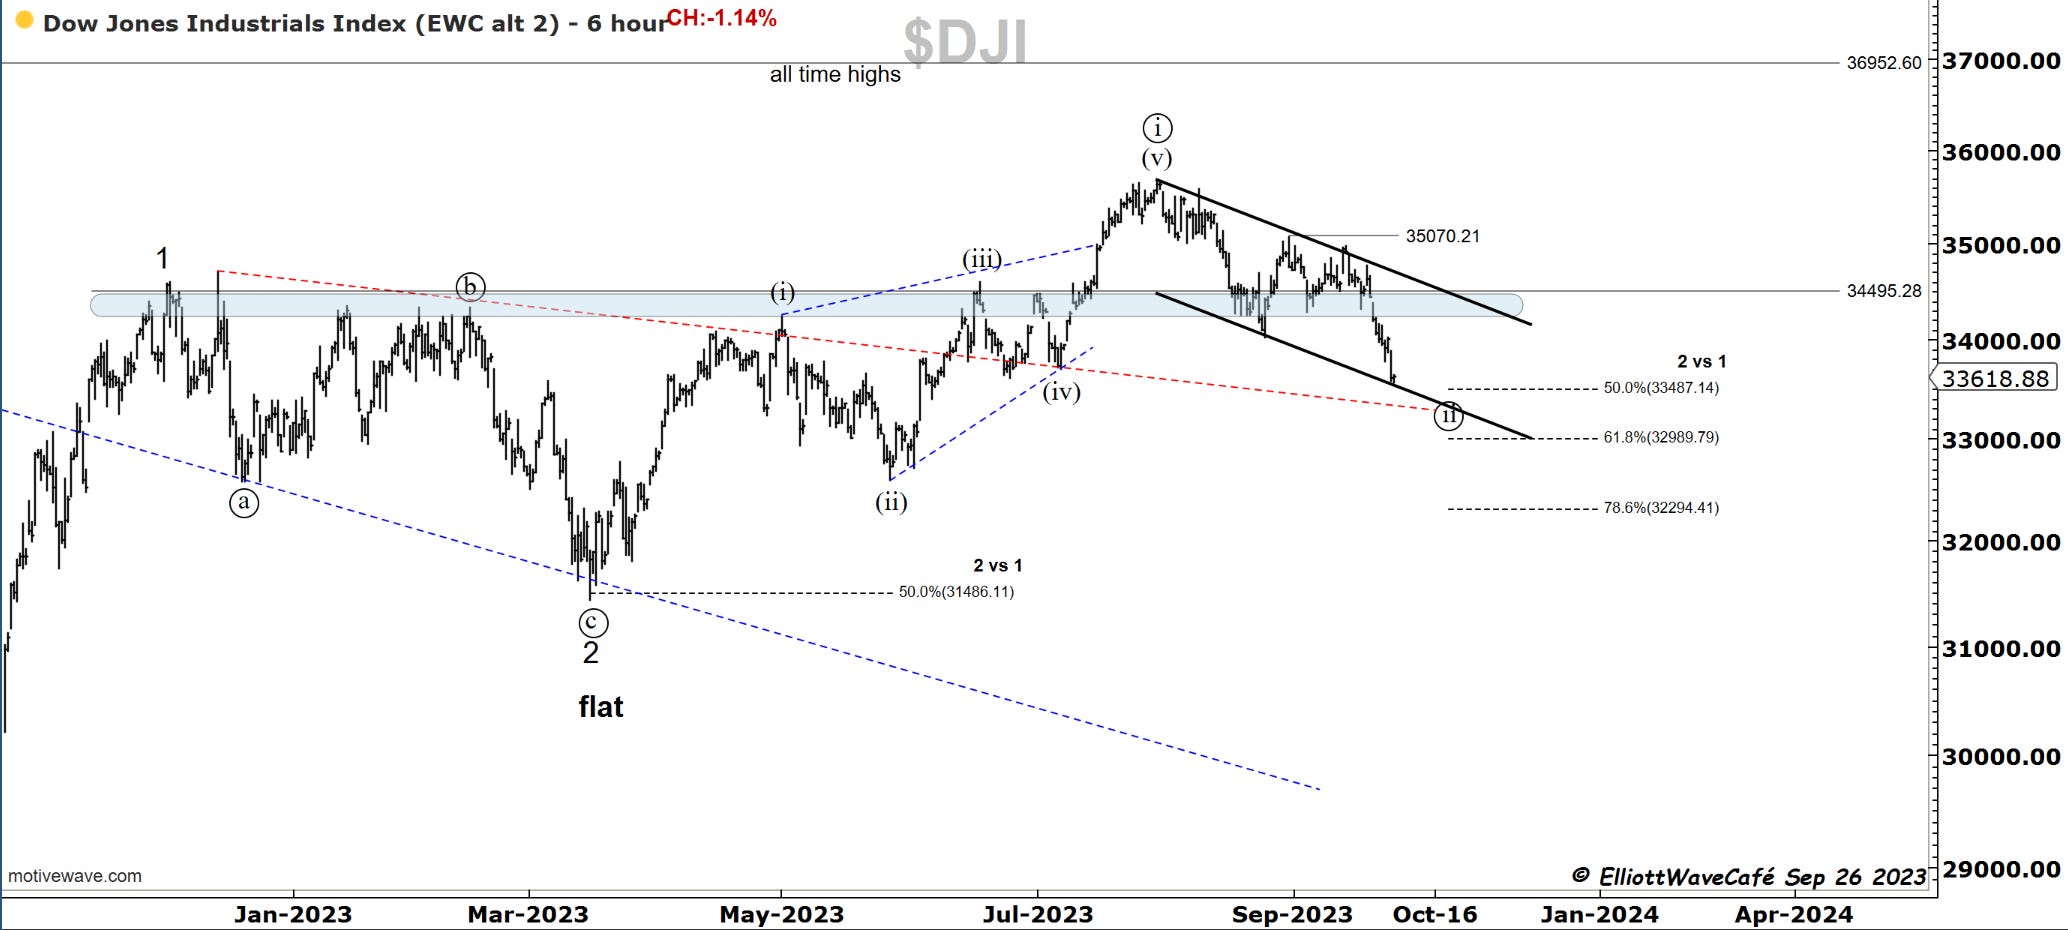
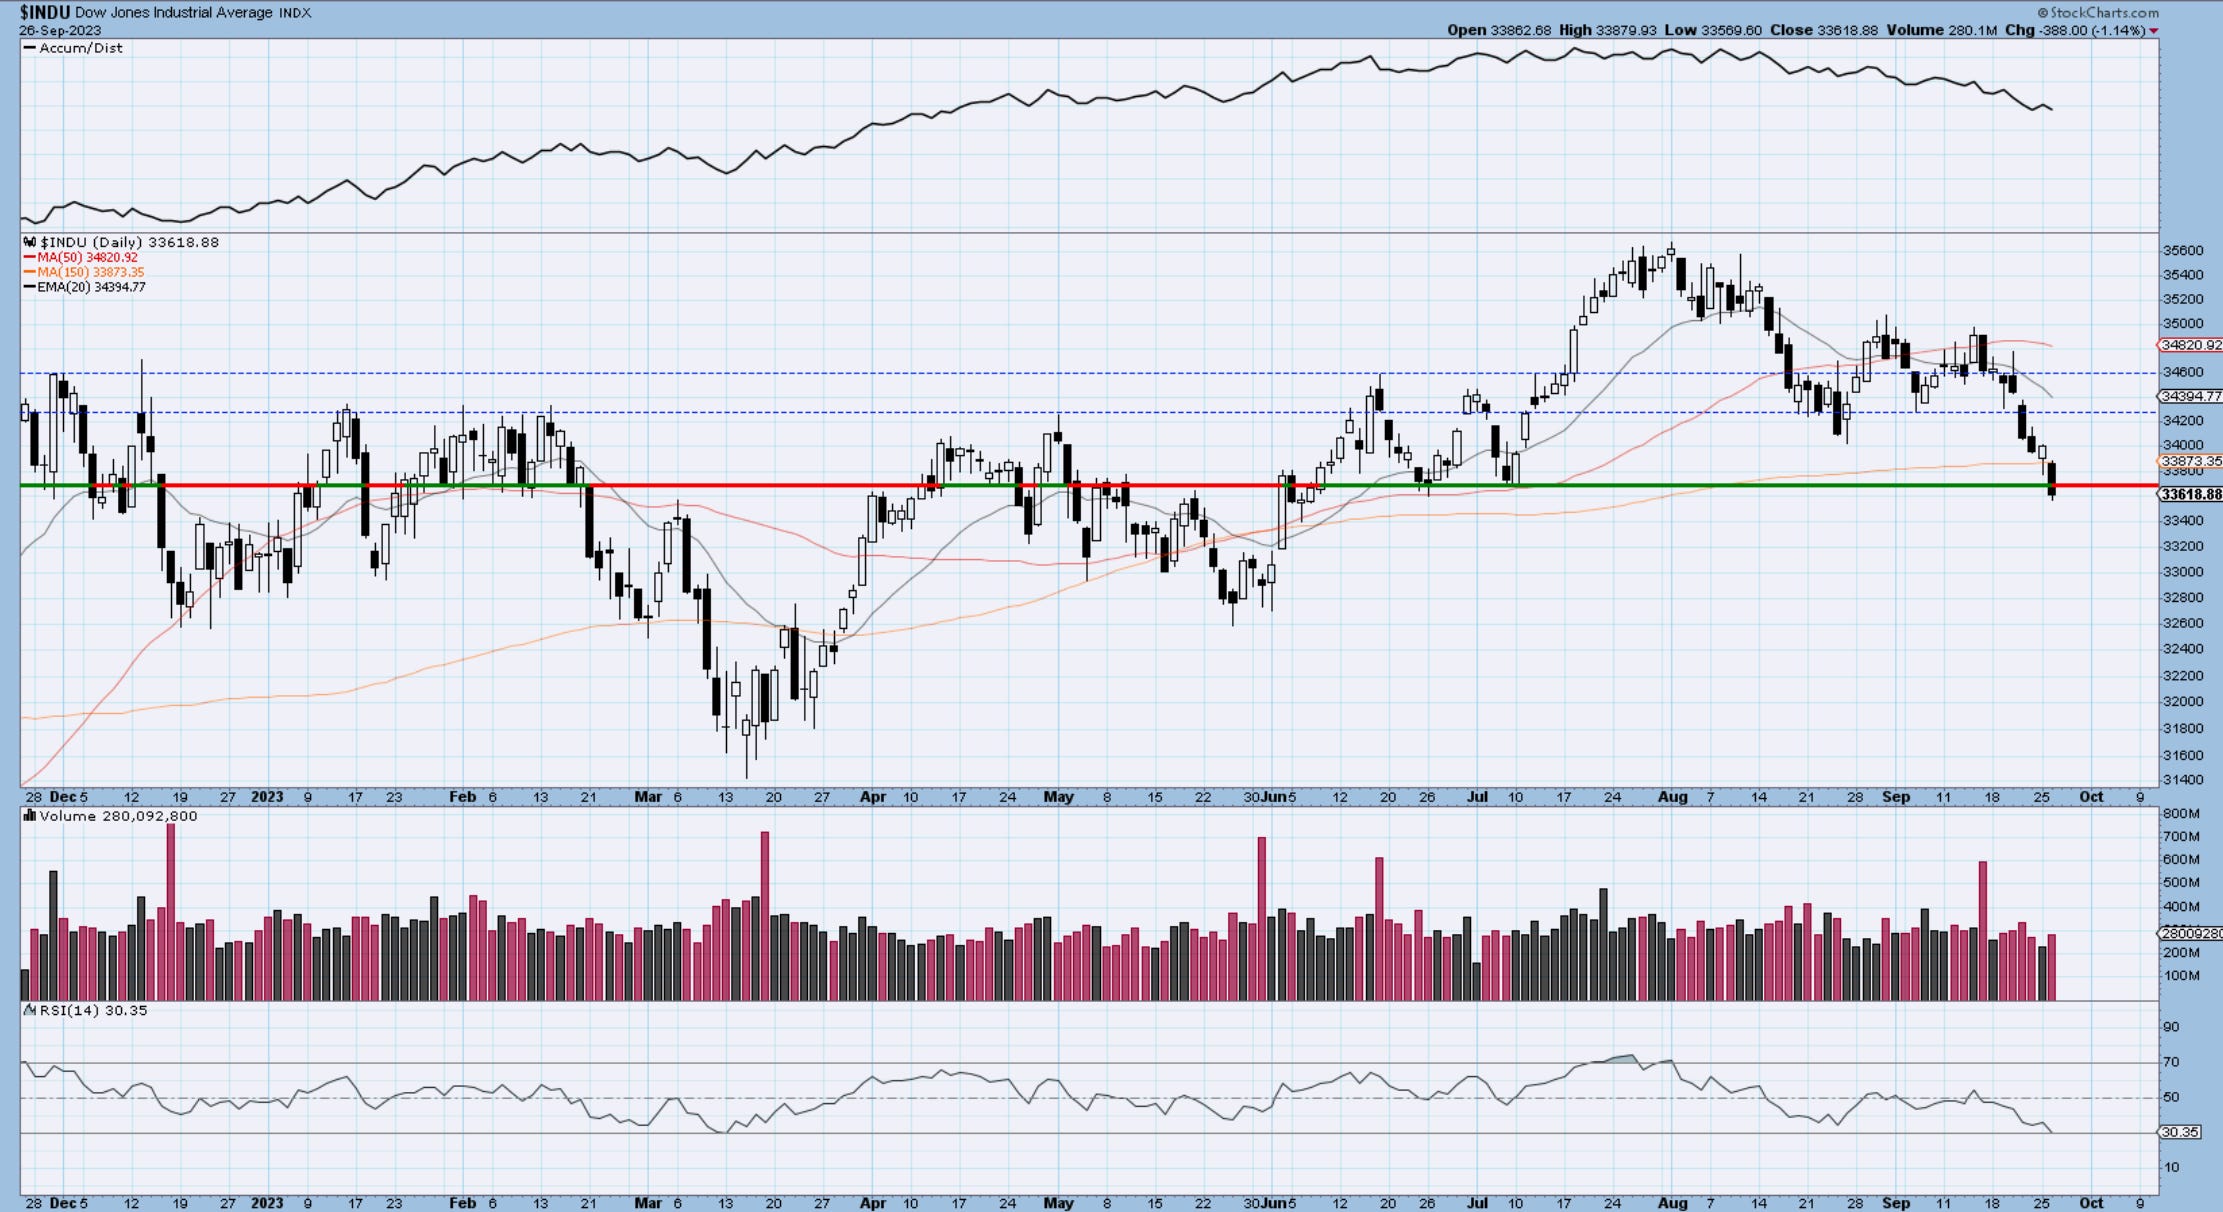
Dow30
Dow sits now at about 50% of the entire rally from March. We seem to be missing a wave 4 and 5 on the latest decline, which suggests we could hit 61.8 before a meaningful bounce. I continue to favor this for a wave ((ii)). Check out the nice lower channel touch on the 2nd chart.
US Dollar
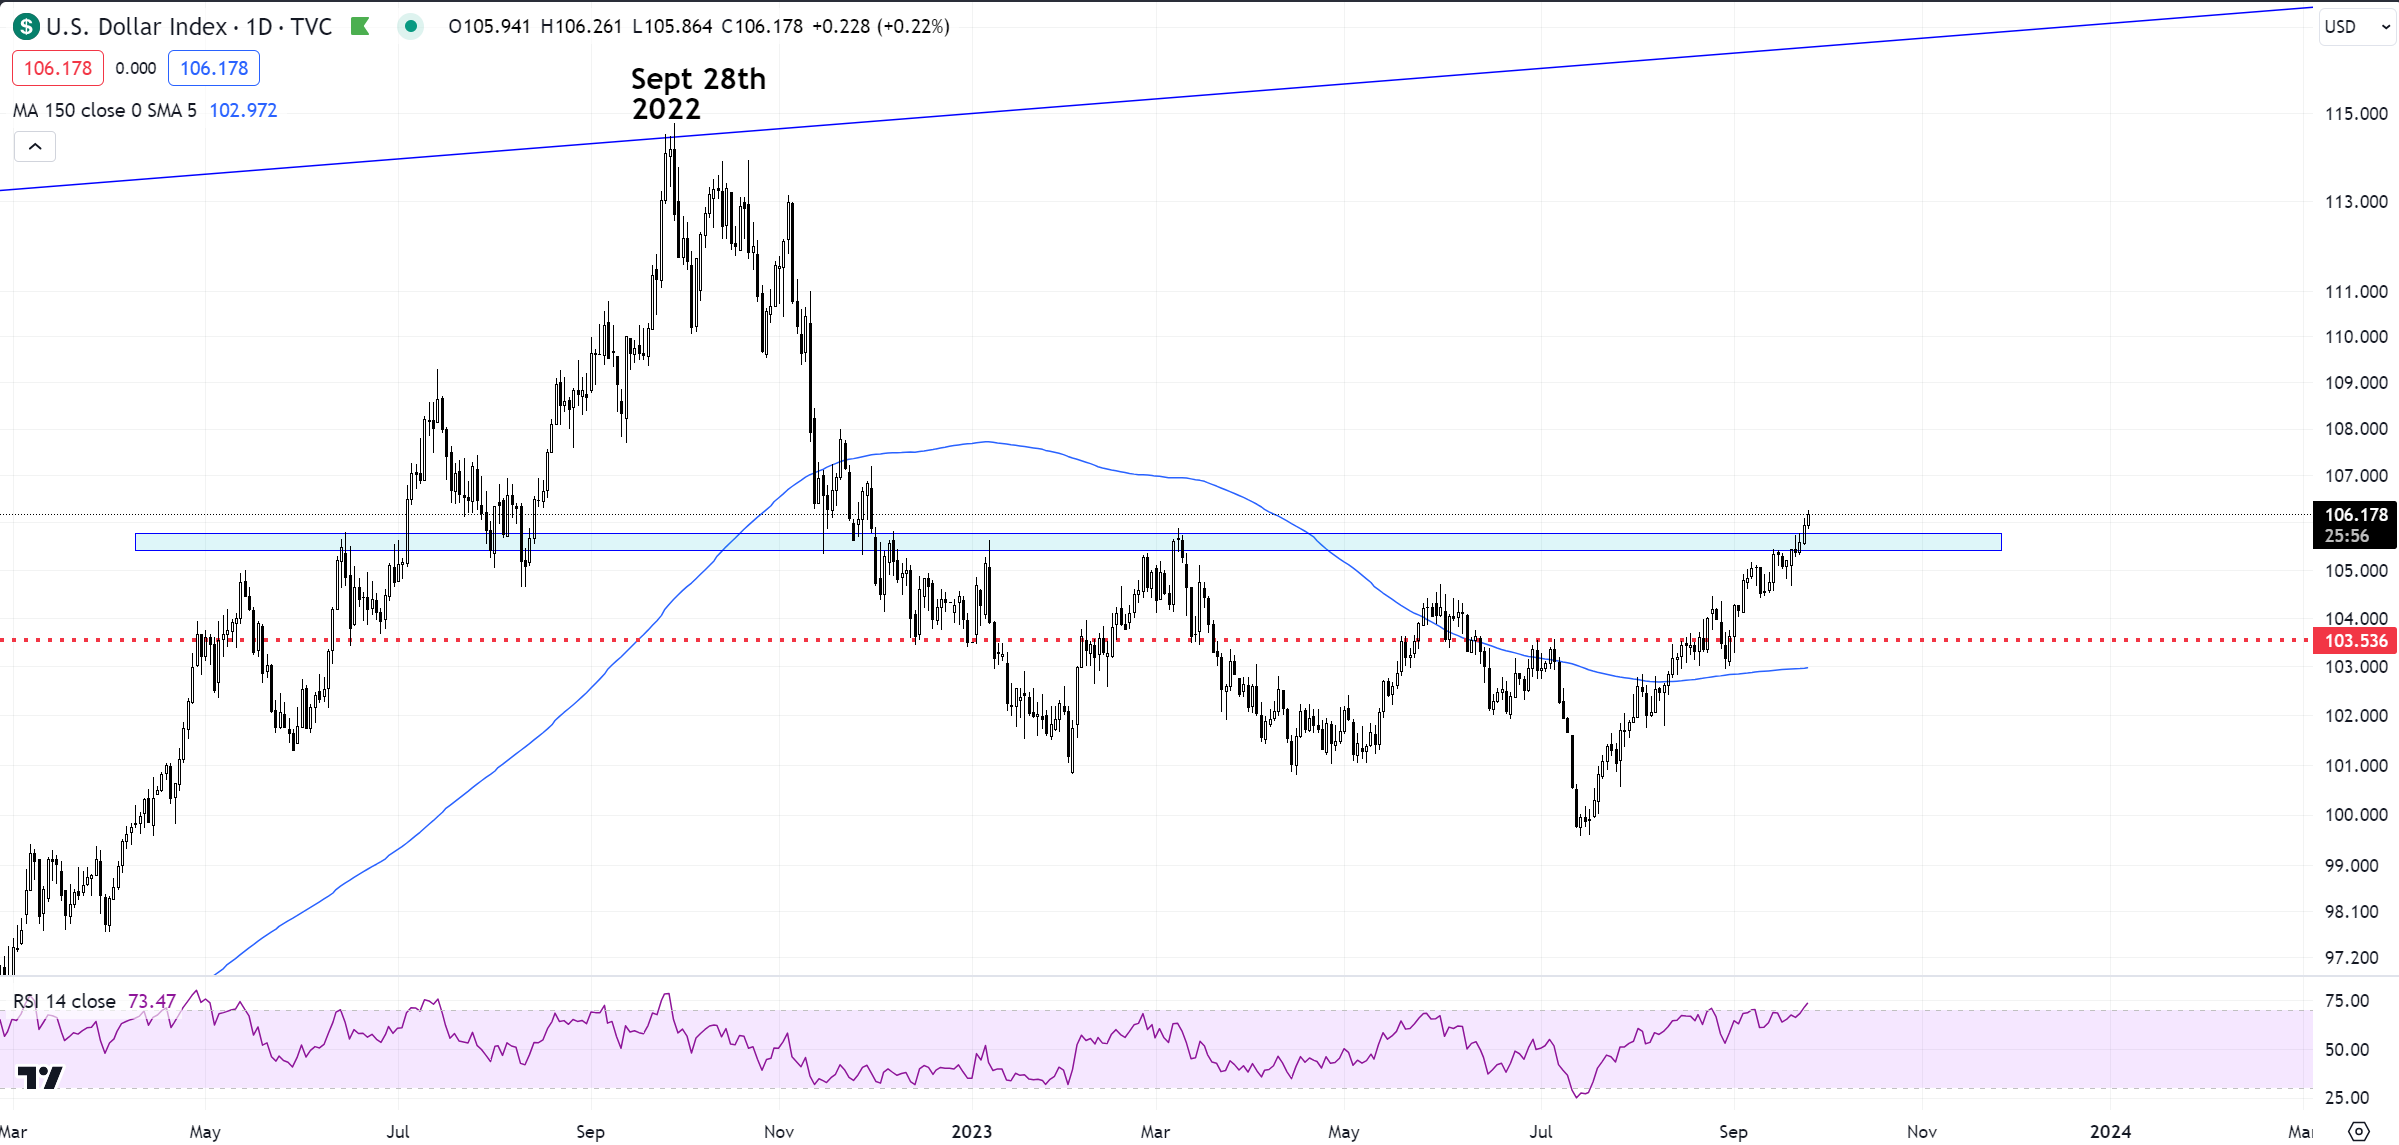
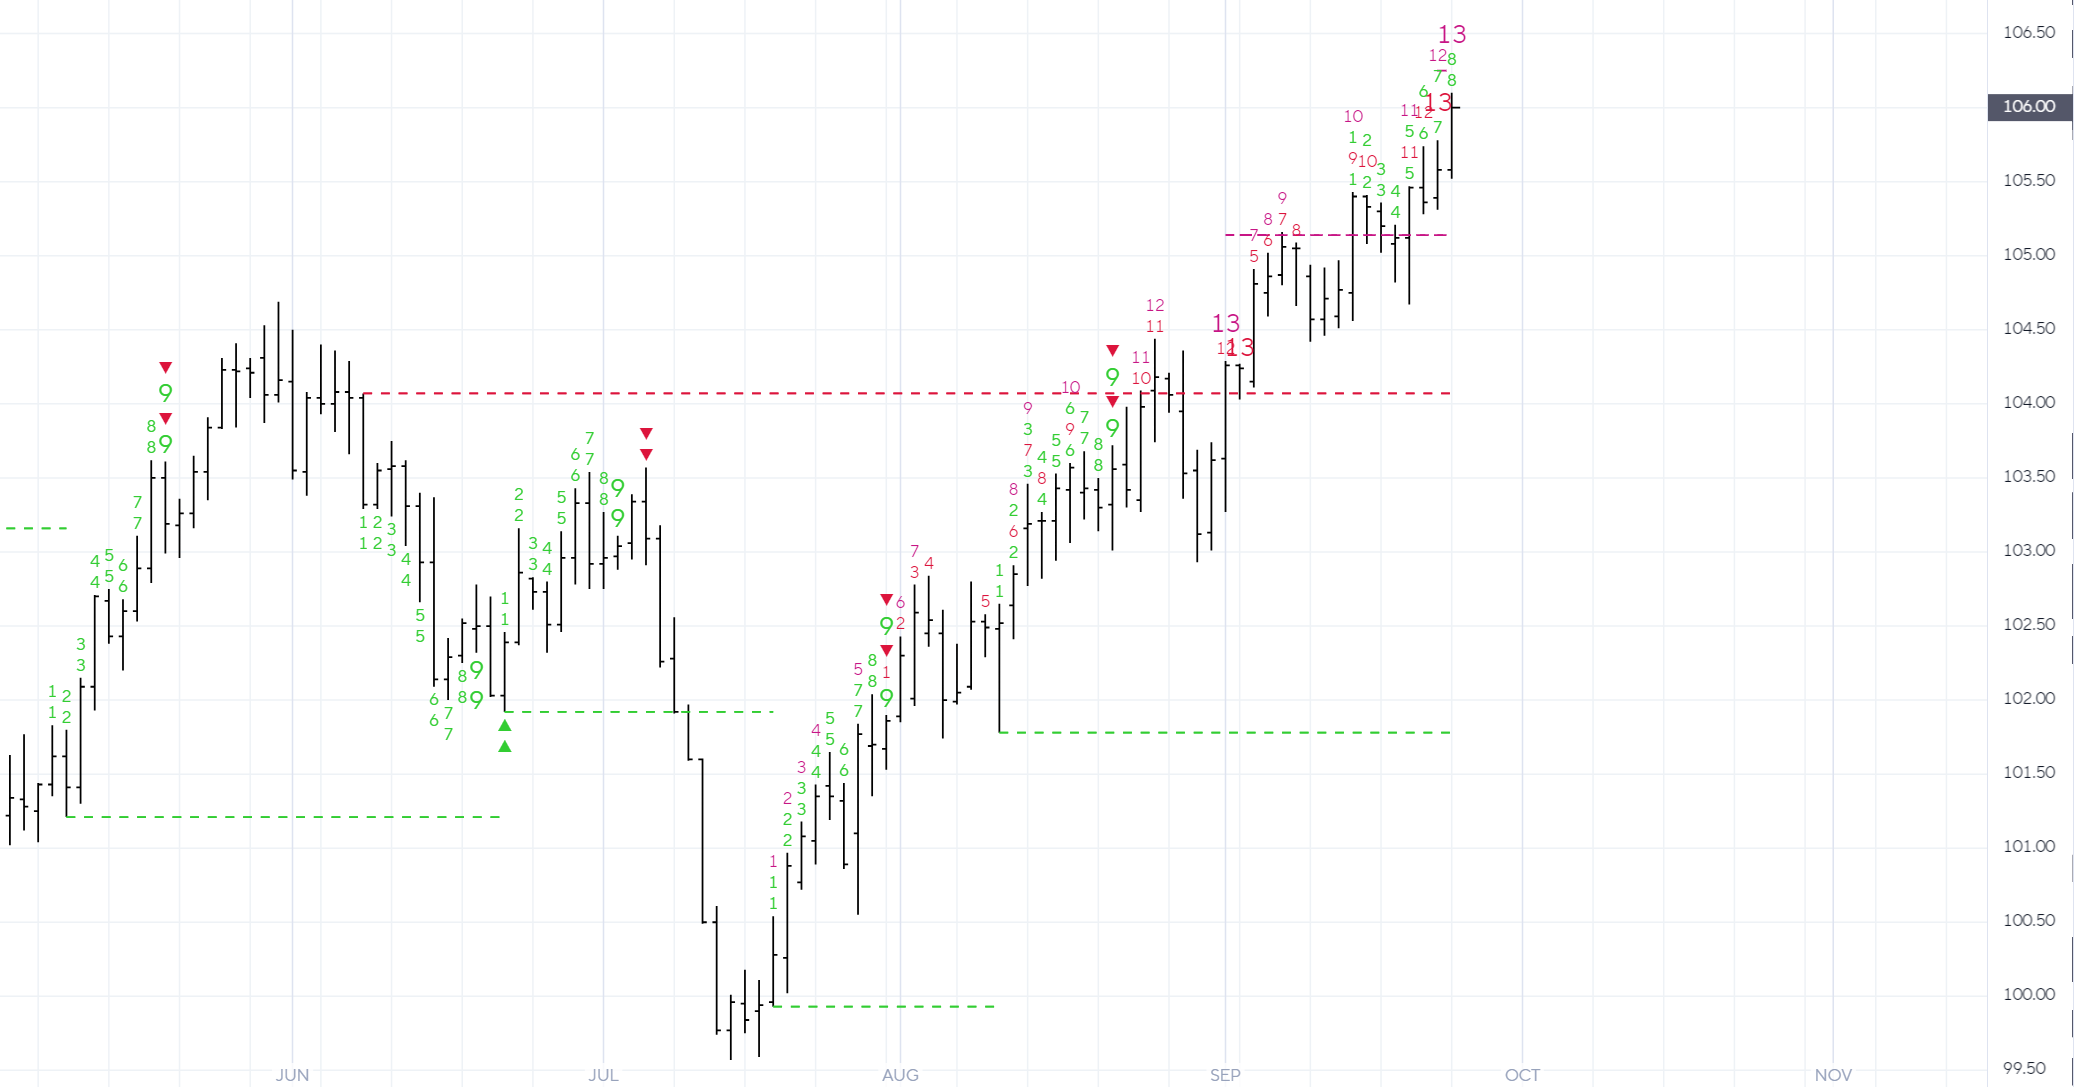
The dollar is now within a day of its 1year top anniversary from Sept 28th, 2022. Interestingly enough, we’re getting exhaustion signals from DeMark just as we’re breaking out above the resistance zone. We will need some price confirmation to secure the top but this index is key to some relief in the risk on trade. Yields have been strong but only belly of the curve and the long end, not the short end. Let’s see how this plays out.
Gold and Silver
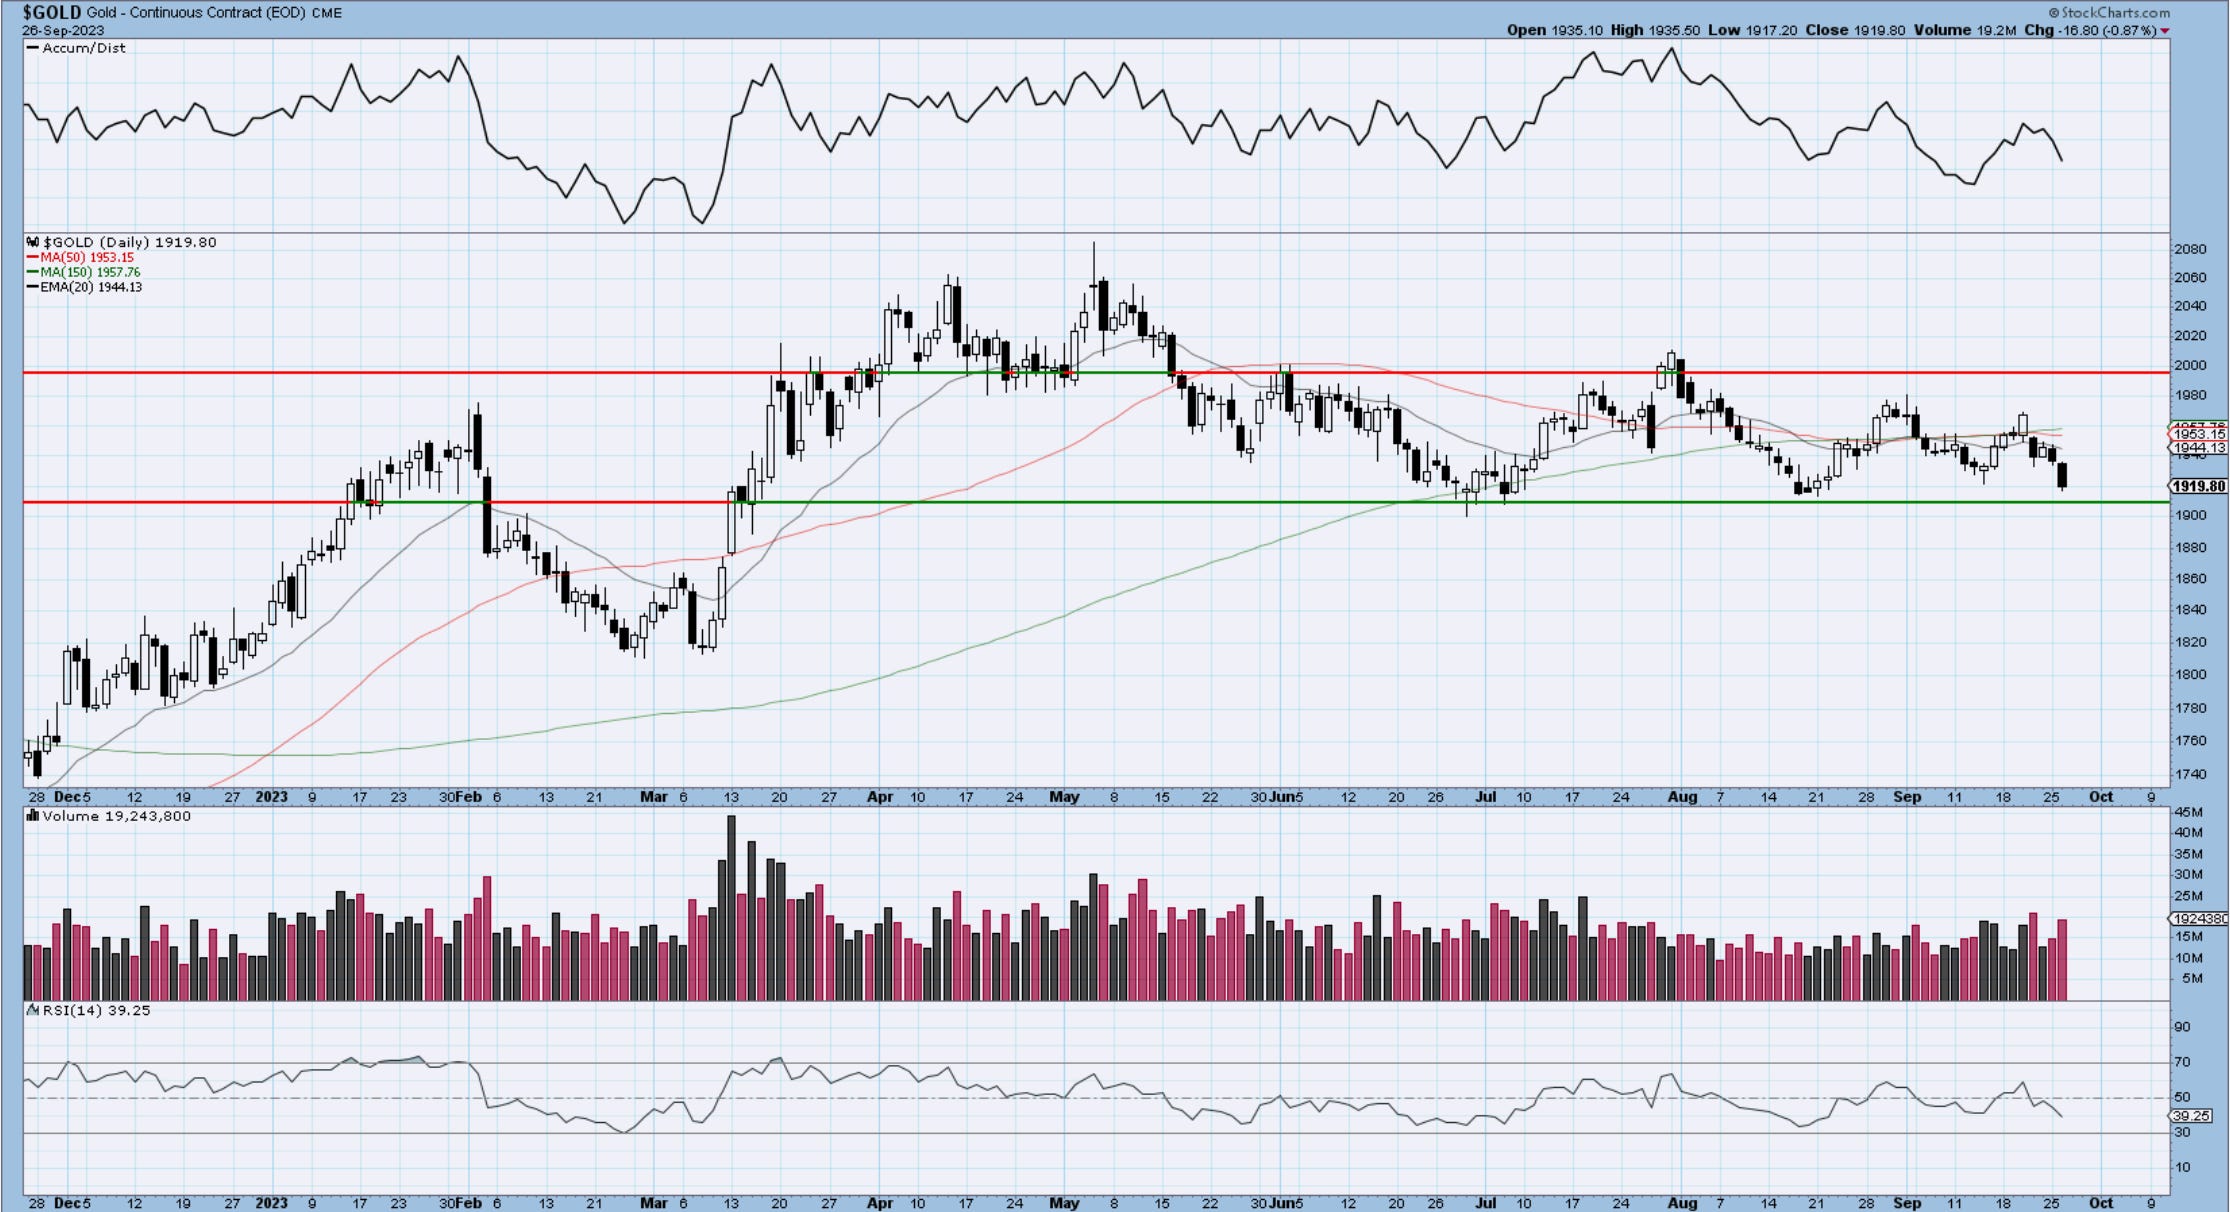
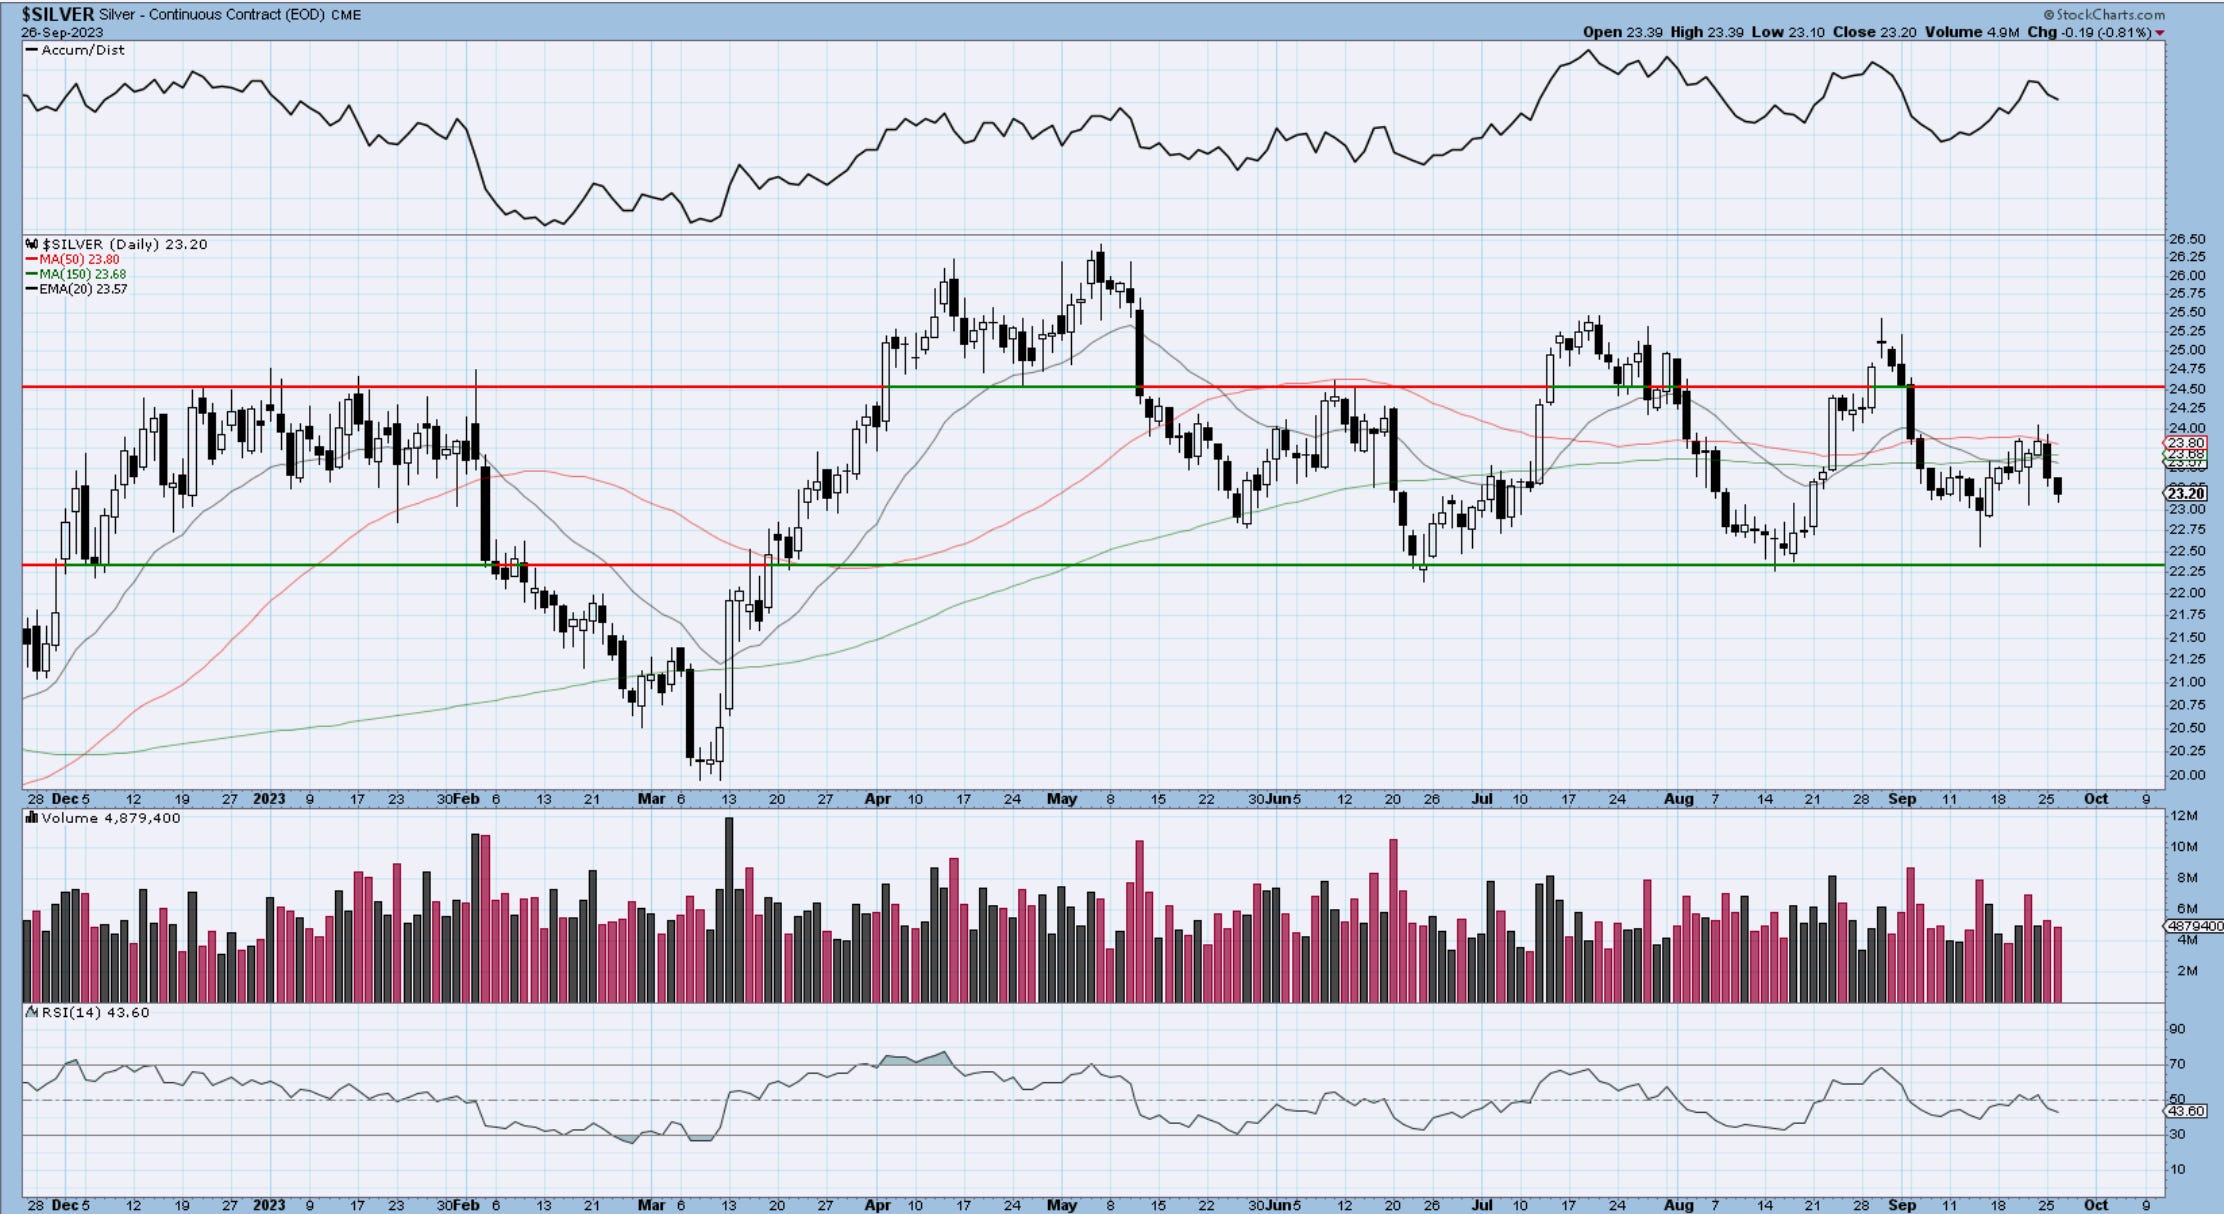
Some further selling in metals today with USD strength but approaching key support zones. If they can hold here for a few days, it would be worth looking at the long side for a trade.
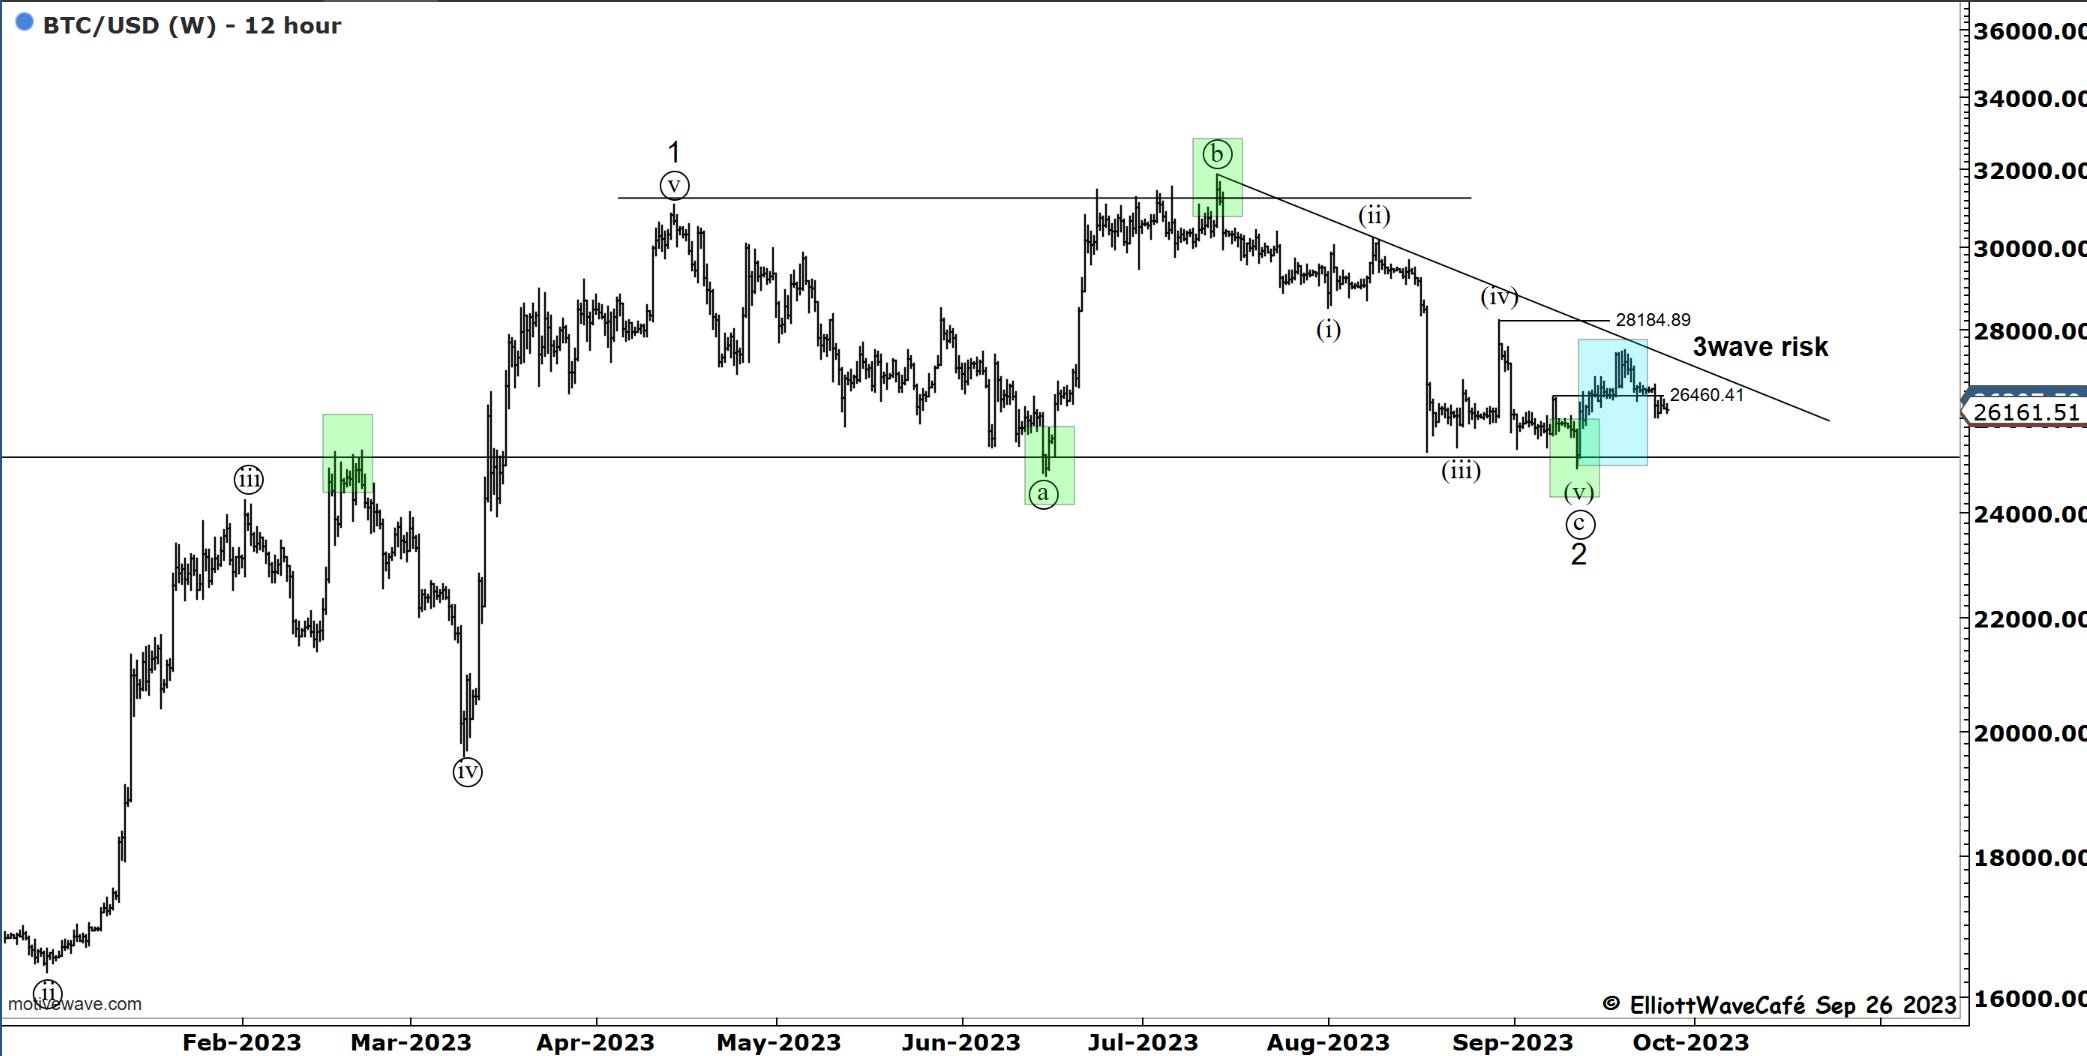
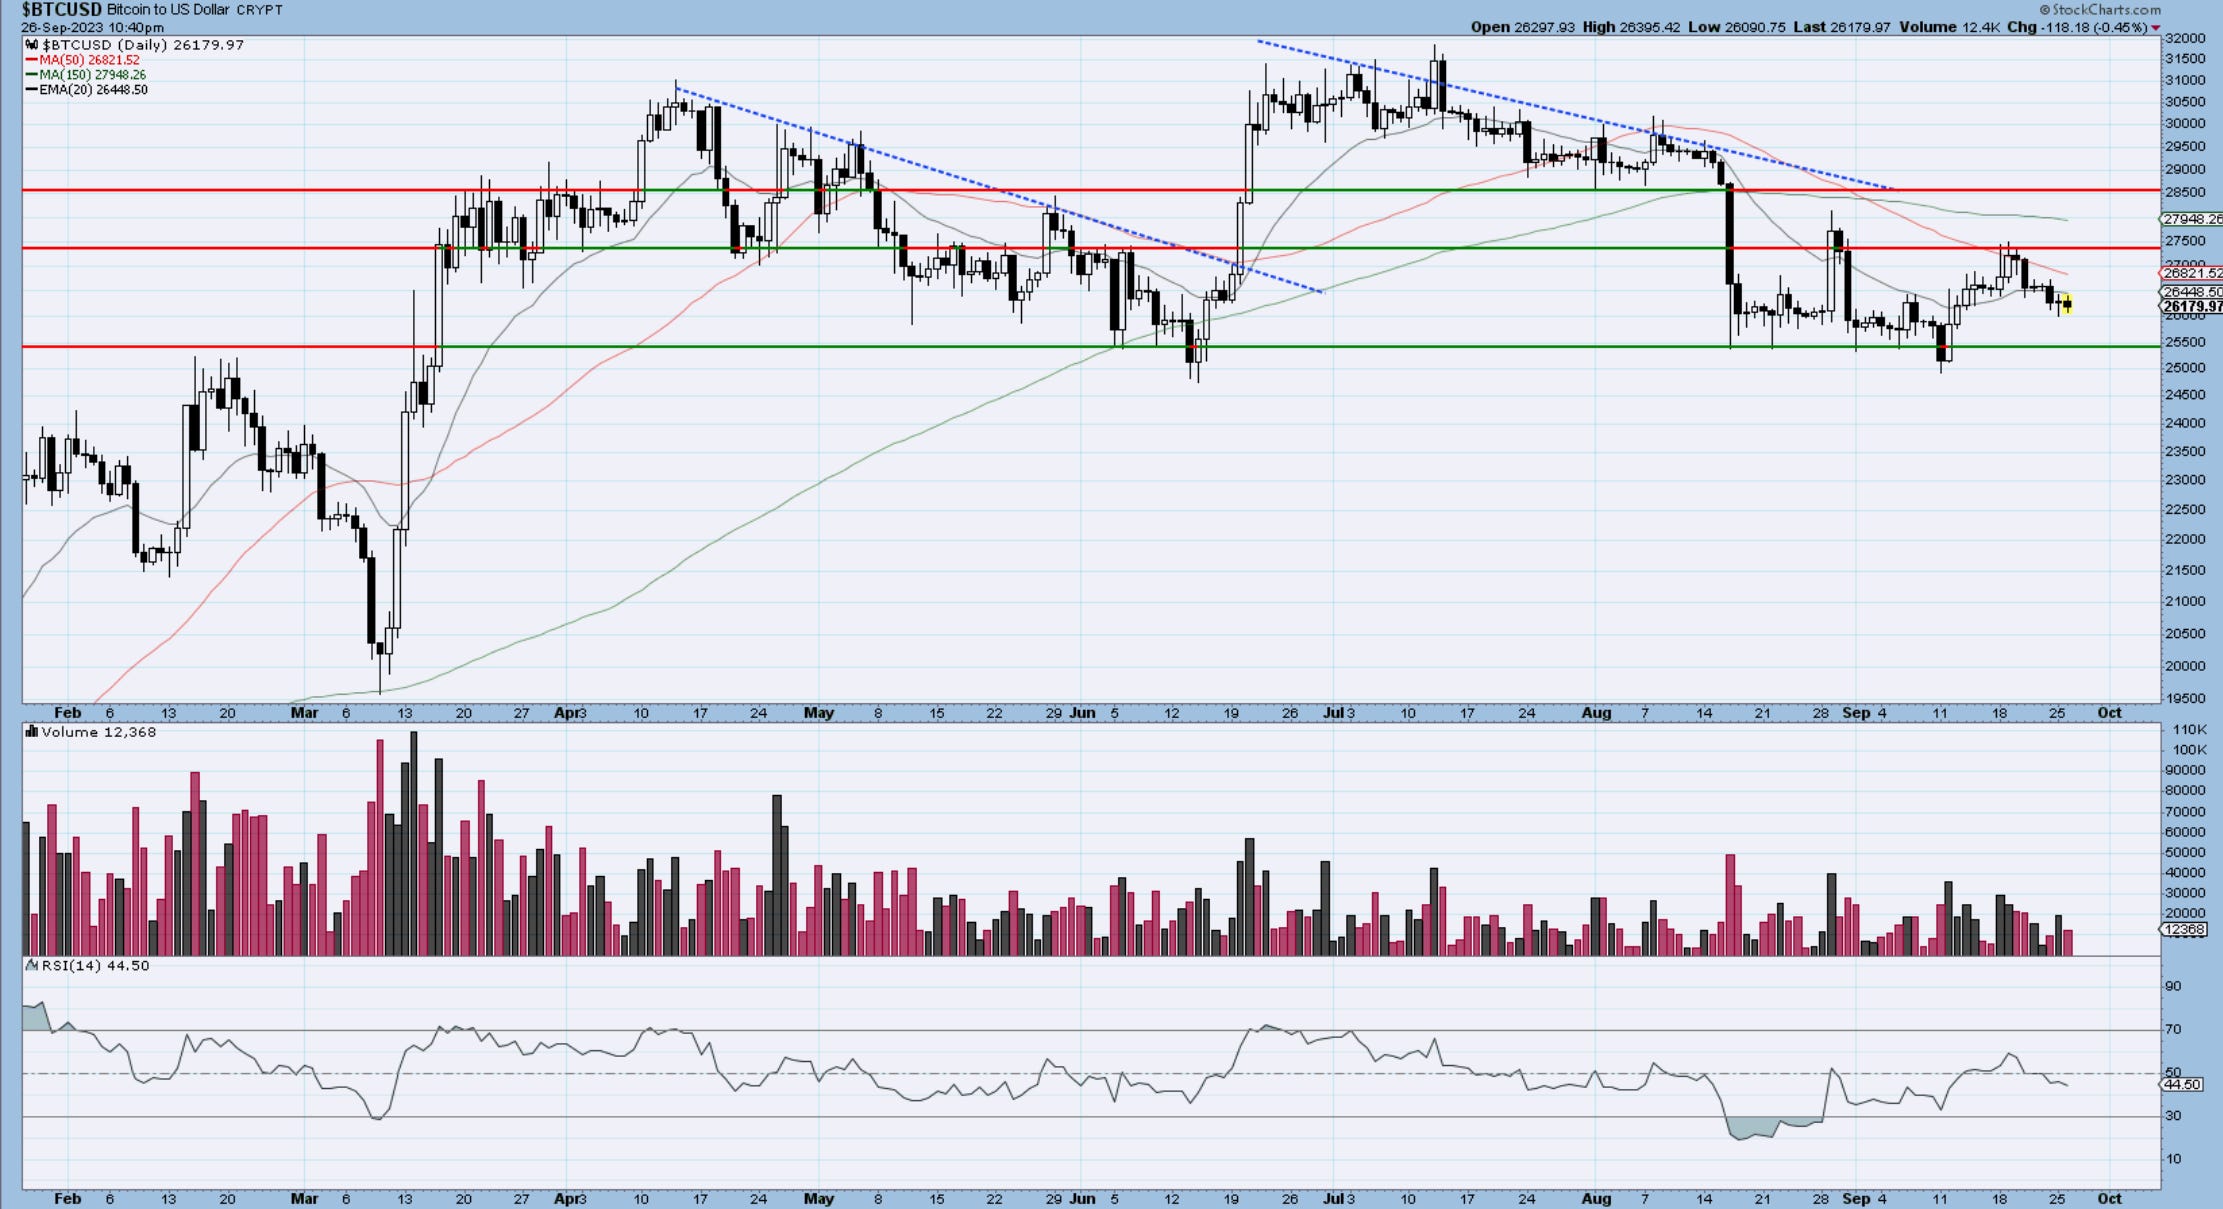
Bitcoin
Bitcoin remains quite calm in the face of all this equity selling. The 3wave risk is still there and would suggest a break of the 25k is ahead. However, that has not taken place and I am curious to see how BTC behaves in case equities give us a few days of upside. If BTC bounces then we know the risks are to the upside for a larger breakout.
See you tomorrow- trade well,
Cris
email: ewcafe@pm.me