
The Daily Drip
Markets review, strategy and analysis
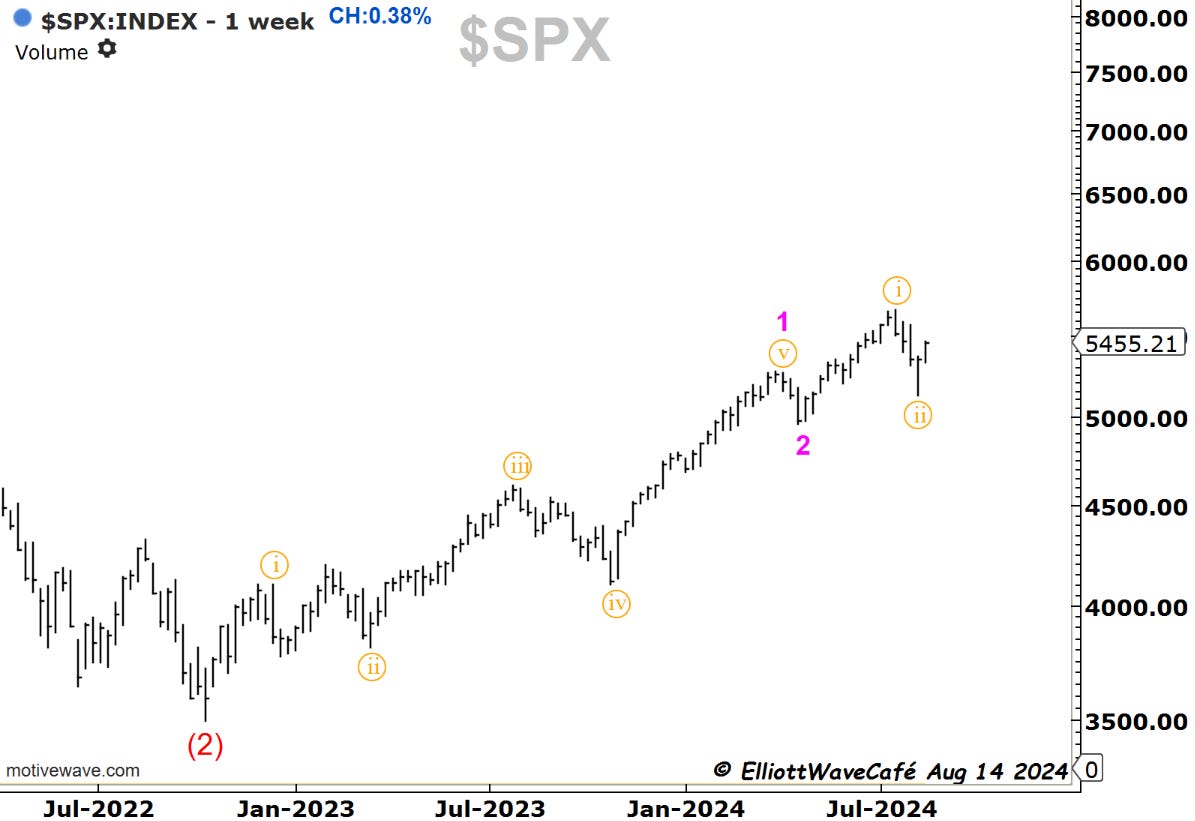
SP500.
There was a small gain of 0.38% after an inline CPI number.
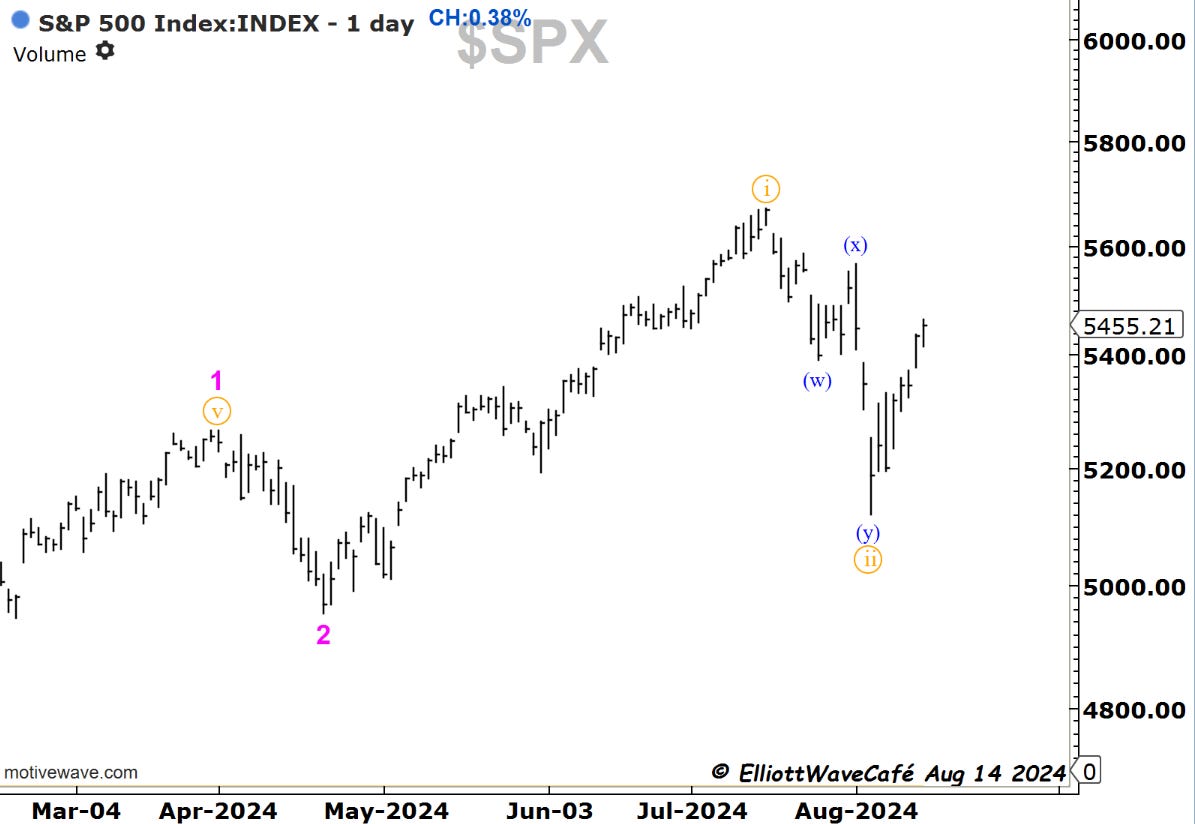
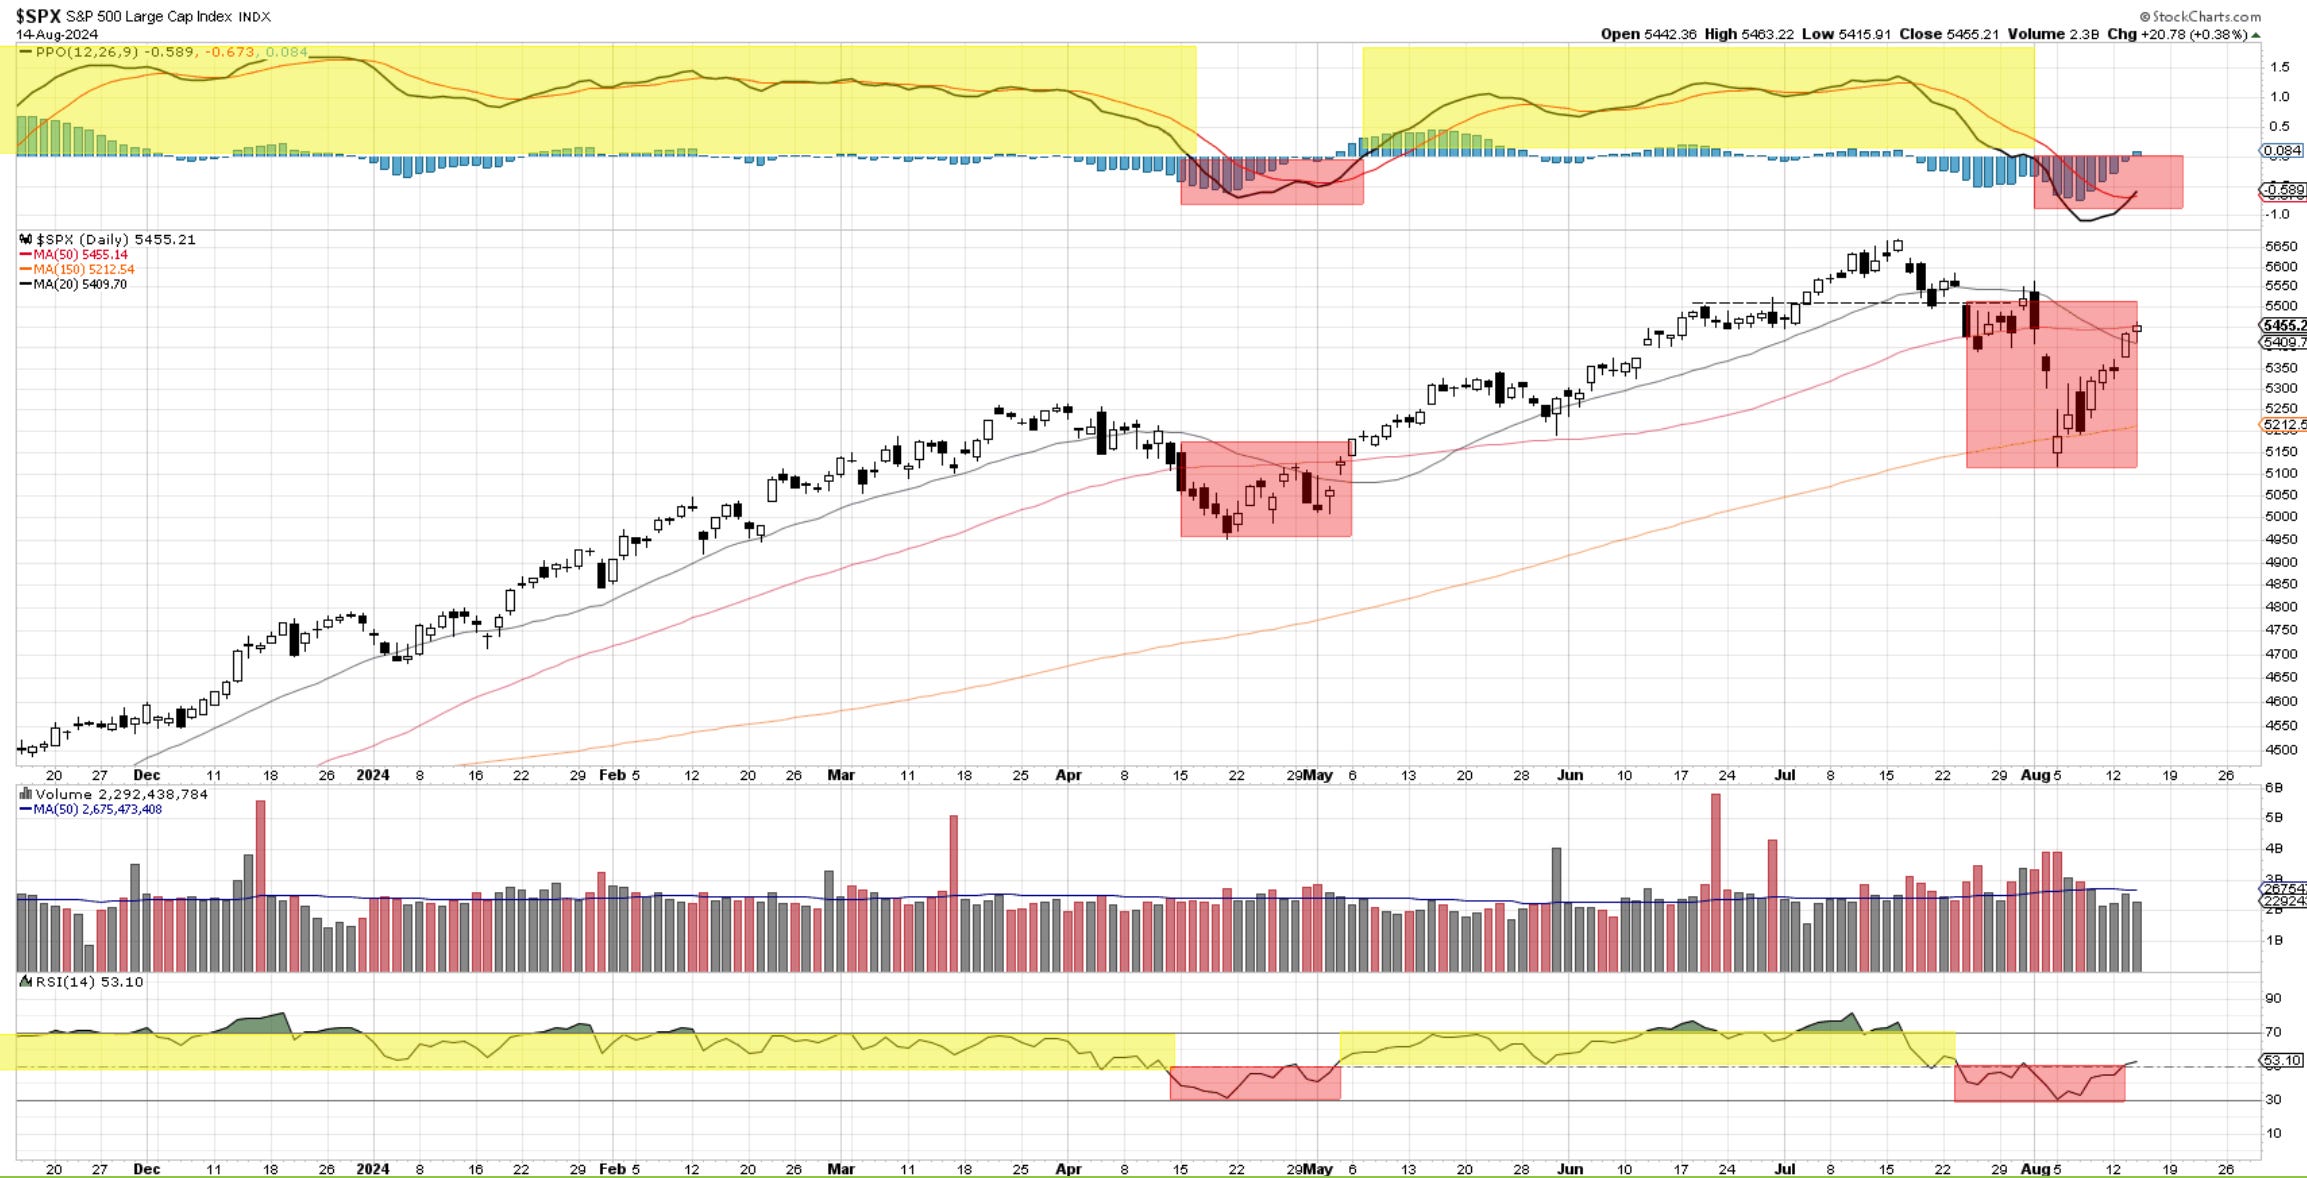
The three waves from the July 16th highs are evident, while on the weekly chart, we can see the close near the top of the range. These are positives, along with today's low being above the 20-day MA. The daily close is also near the highs of the day. The RSI has crossed briefly 50.
There are a couple of things to mention regarding overhead supply. The 50day MA has not yet been taken. The retracement has now reached 78.6% from the wave (x) high.
I have further increased my bullish exposure with the purchasing of shares in NFLX ( mentioned in chat) and KLAC today.
To give you an overall look at my holdings, they are:
MAGS, AAPL, CAVA, GEV, NFLX, MELI, ANET, PLTR, and KLAC.
If we can get above 5566 I will consider further raising my long exposure.
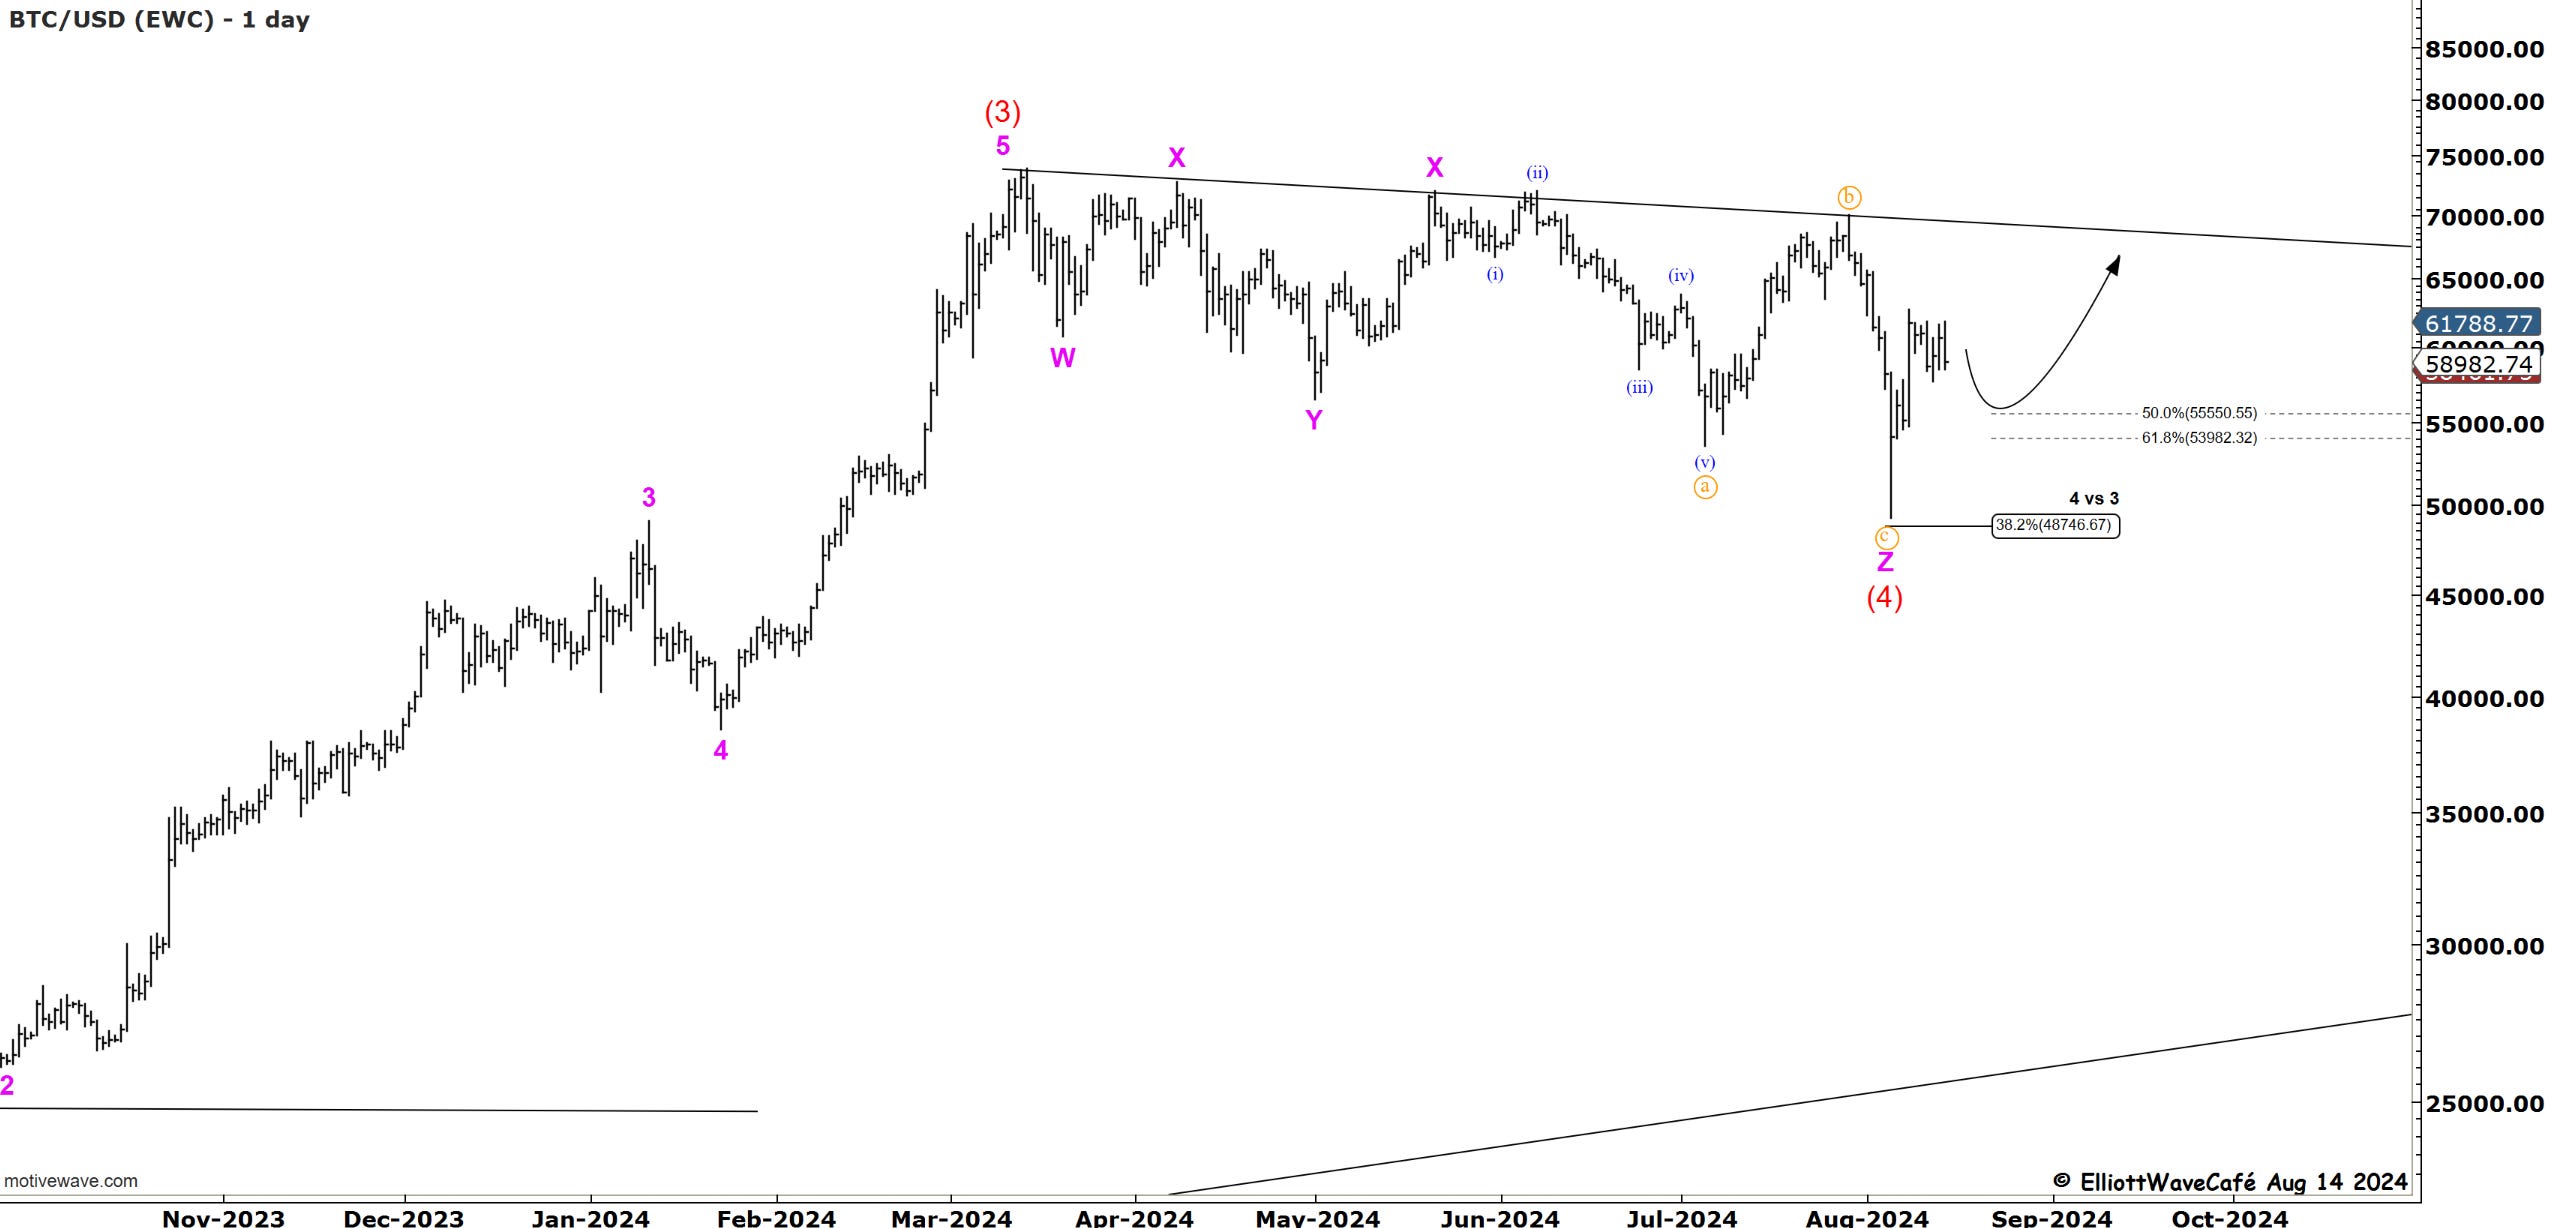
Bitcoin with weekly wave structures below with the wave (4) idea. Notice the pullback into the 38.2% typical for 4th waves. Then we see the daily structure in complex correction wxyxz. We then have an impulsive rally of the lows which creates an expectation that wave (5)red could be starting. Ideally we want to stay above the 50 or 61.8% retracement for a wave 2. 54k would be the lower limit of that range.
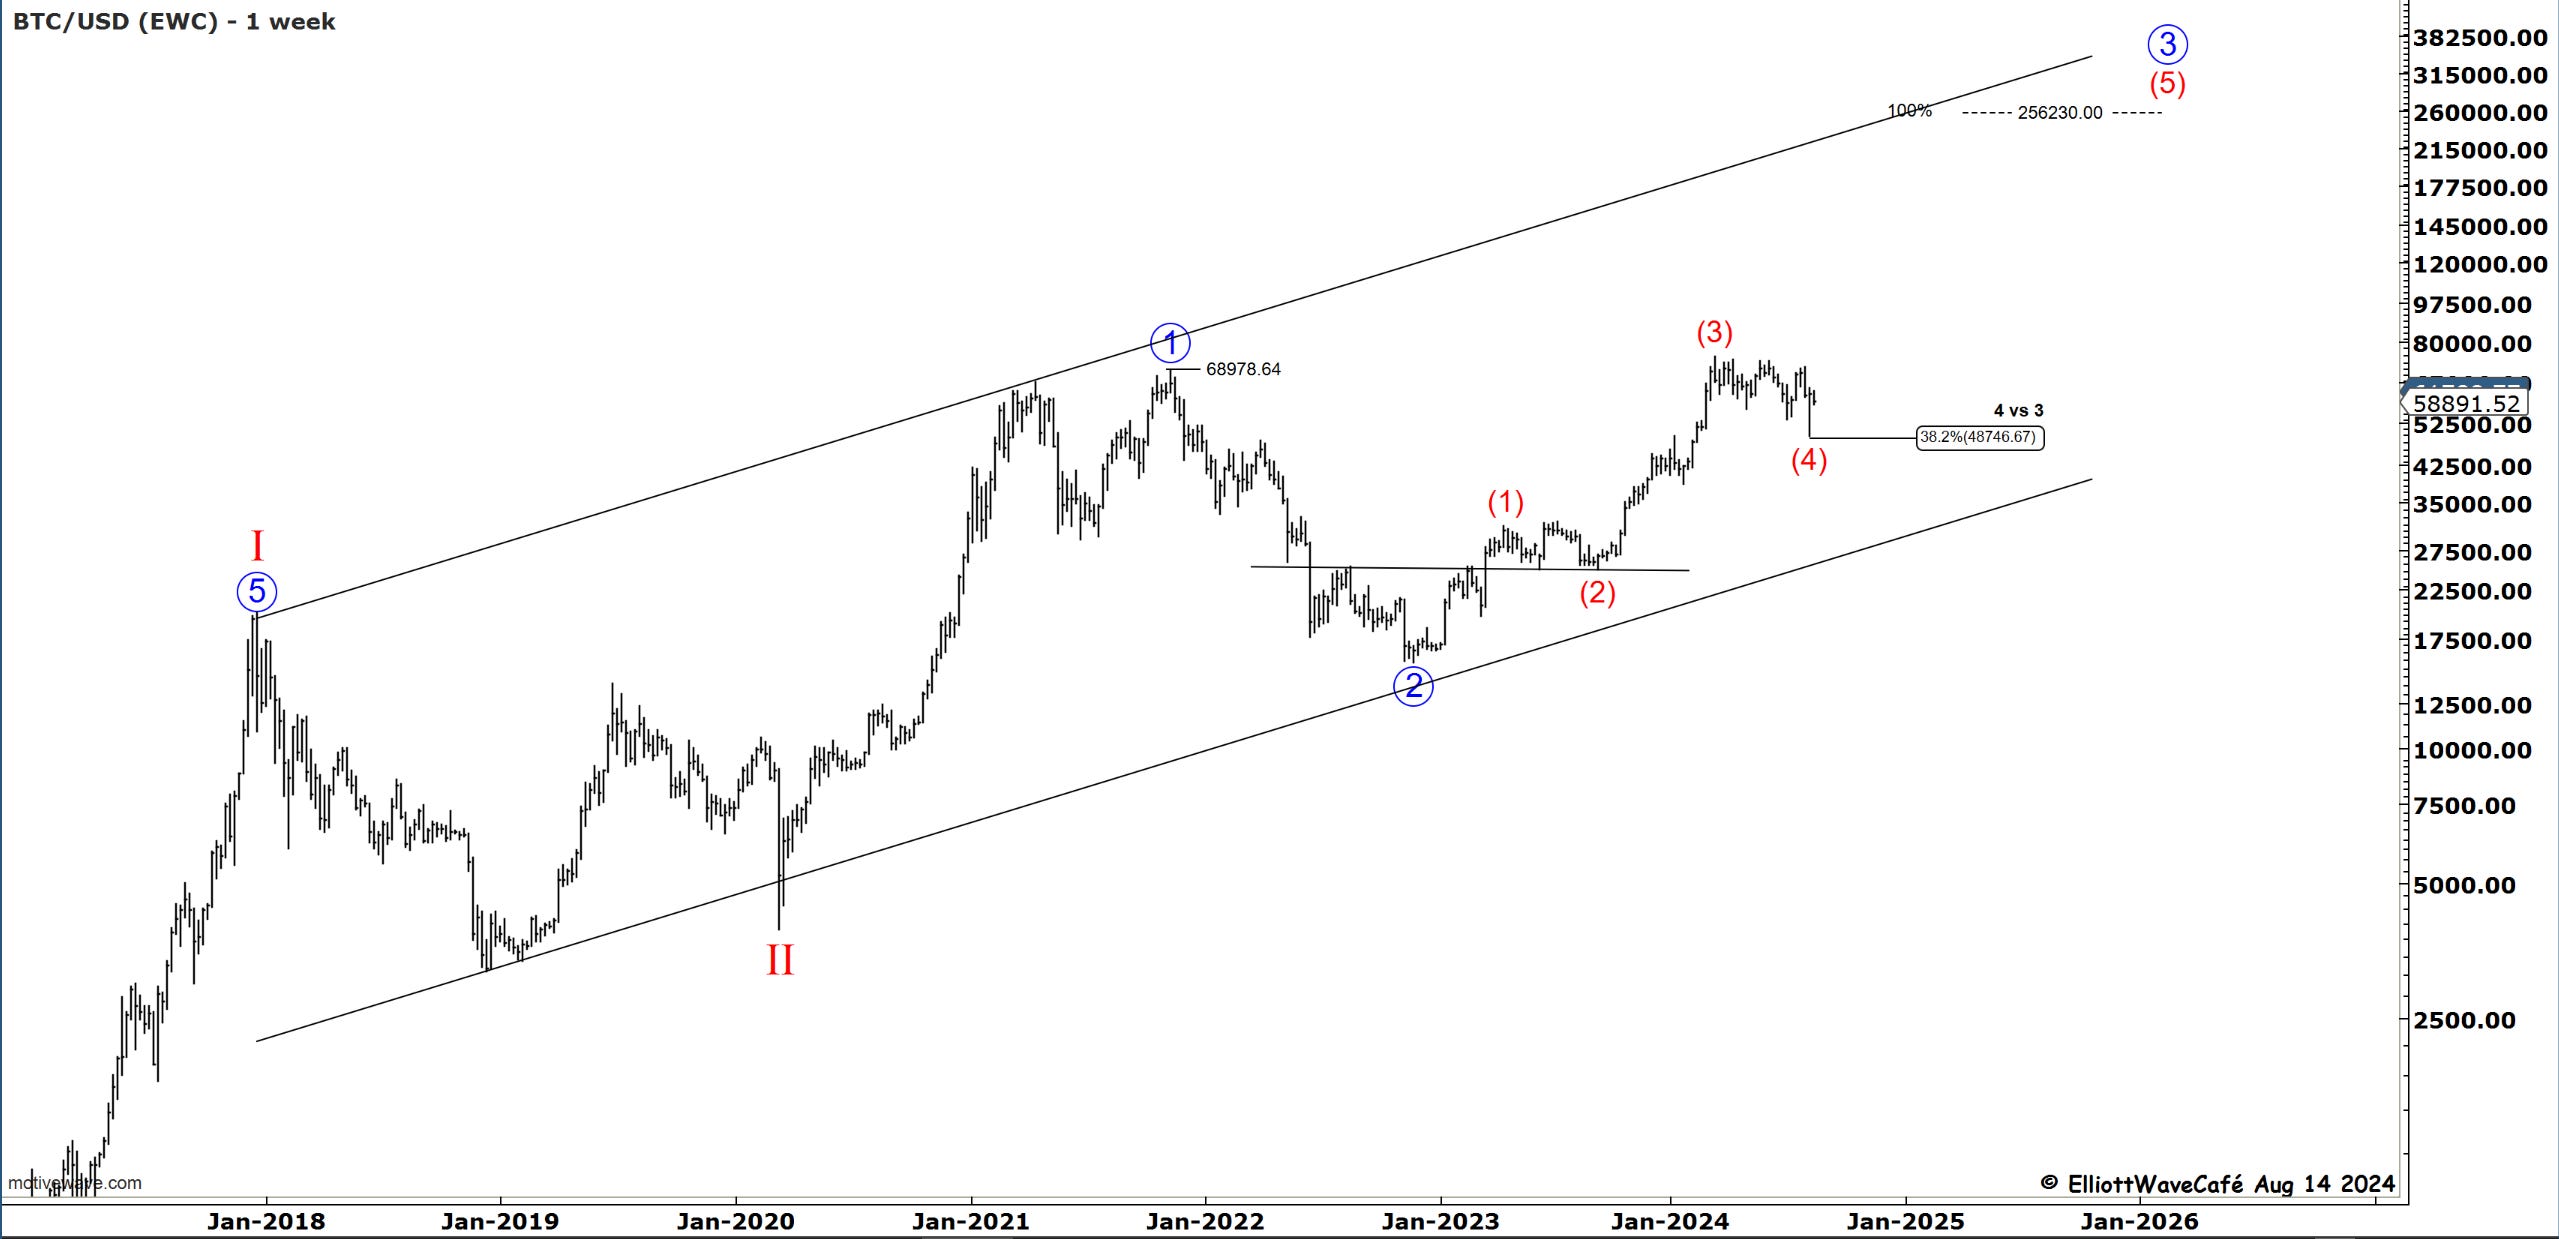
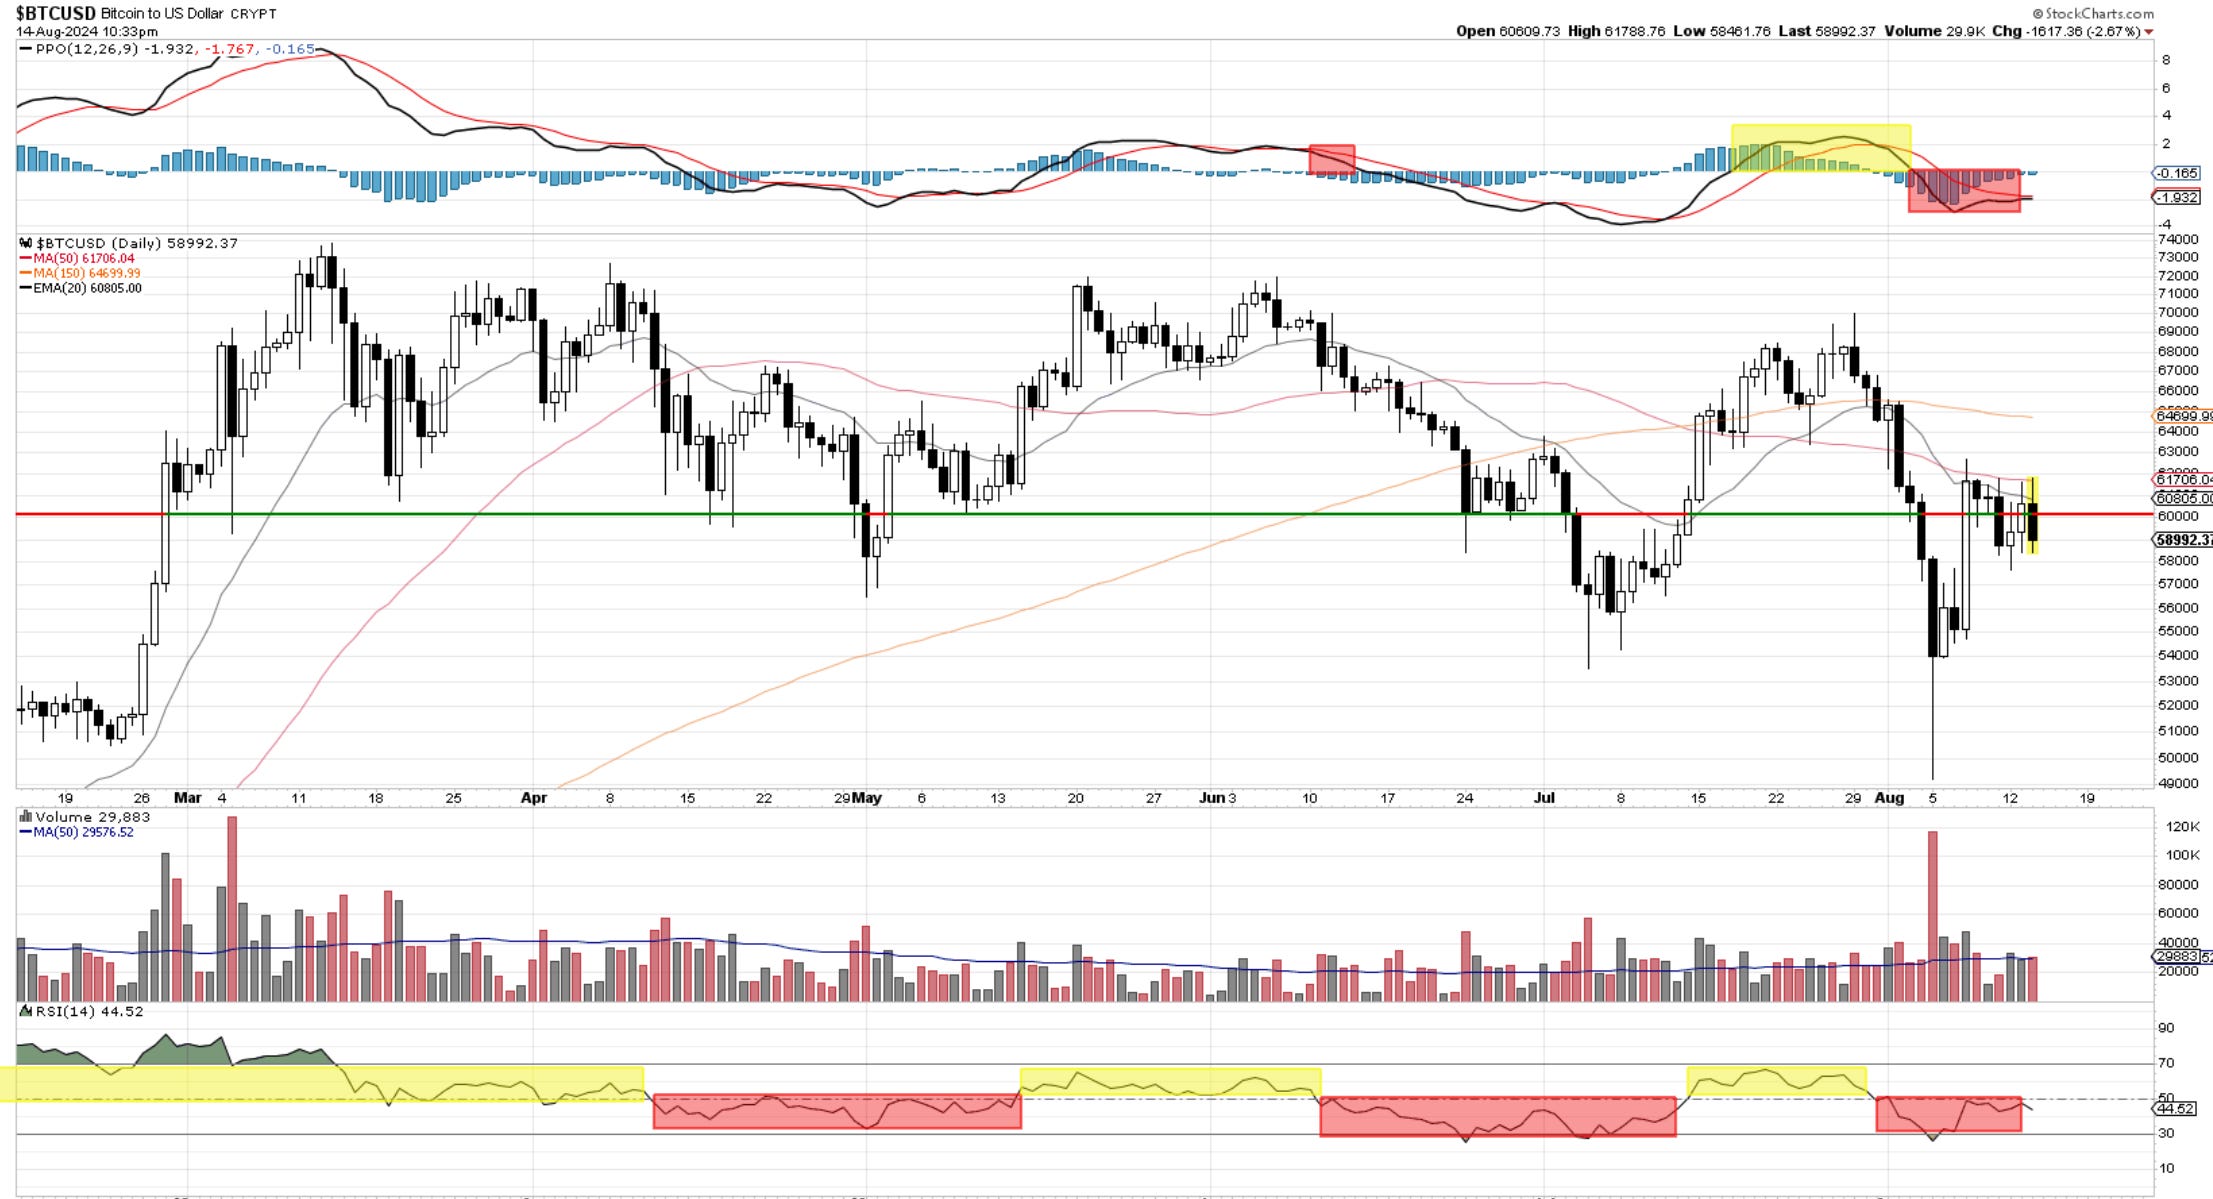
The technical page is still weak, with prices staying below 60k and moving averages. Both RSI and PPO are not ready. The message from the market here is to continue waiting for a better setup.
For those wanting to chat with fellow traders, the link is below.

Thanks for reading.
Cris
If you’re new to Elliott Wave or need to refresh, there is a 7-hour video course with downloadable slides under The Coarse tab on the website. Requires a yearly “Founding Member subscription.” You can find it HERE.
Cris
email: ewcafe@pm.me