
The Daily Drip
Core markets charts updates and commentary
Note: The counts on the right edge are real-time, and they are prone to adjustments as price action develops. Elliott Wave has a fluid approach, is evidence-based, and requires constant monitoring of certain thresholds.
In the counts below, this (( )) = circle on chart
SP500
After an ugly close on Friday, we gapped higher by about 50bps at the open and continued with buying until closing positive +1.2%. There was an avalanche of bearish tweets and comments at the end of the week, so not surprised at all about today’s price action. Here are some of them that I flagged on Twitter:

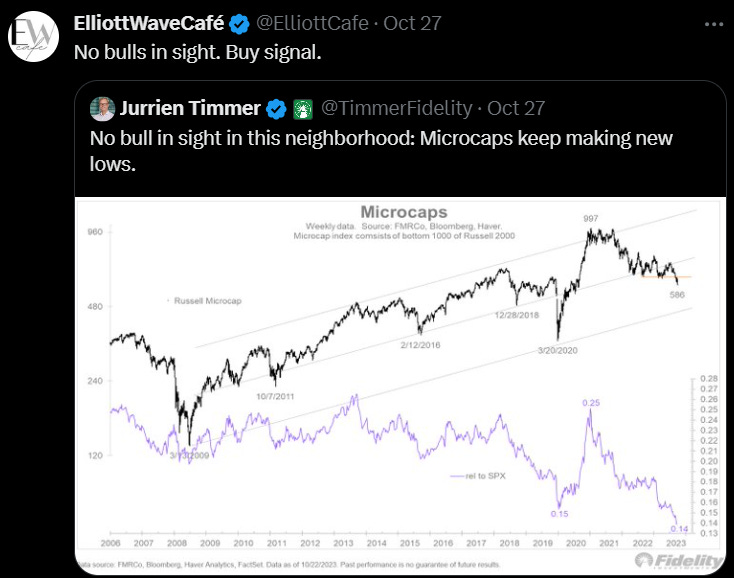
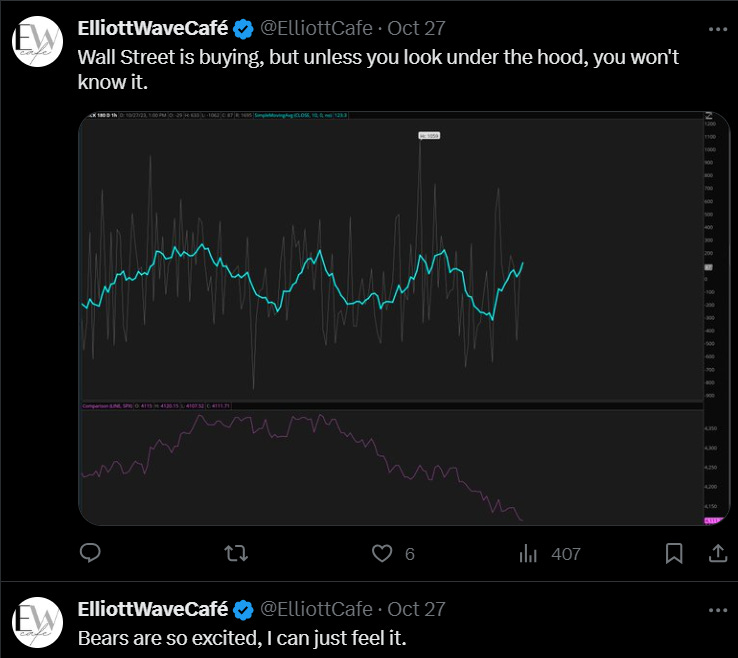
These are just a few, I am sure there are tons more where those came from. Not taking a victory lap by any stretch, just pointing out how sentiment works over and over again. But Wall Street was buying underneath, as I showed by the TICK intraday buying divergence.
One day does not a trend make, so there is still plenty of ground to make up until we get out of this correction. But today’s buying might be a start.
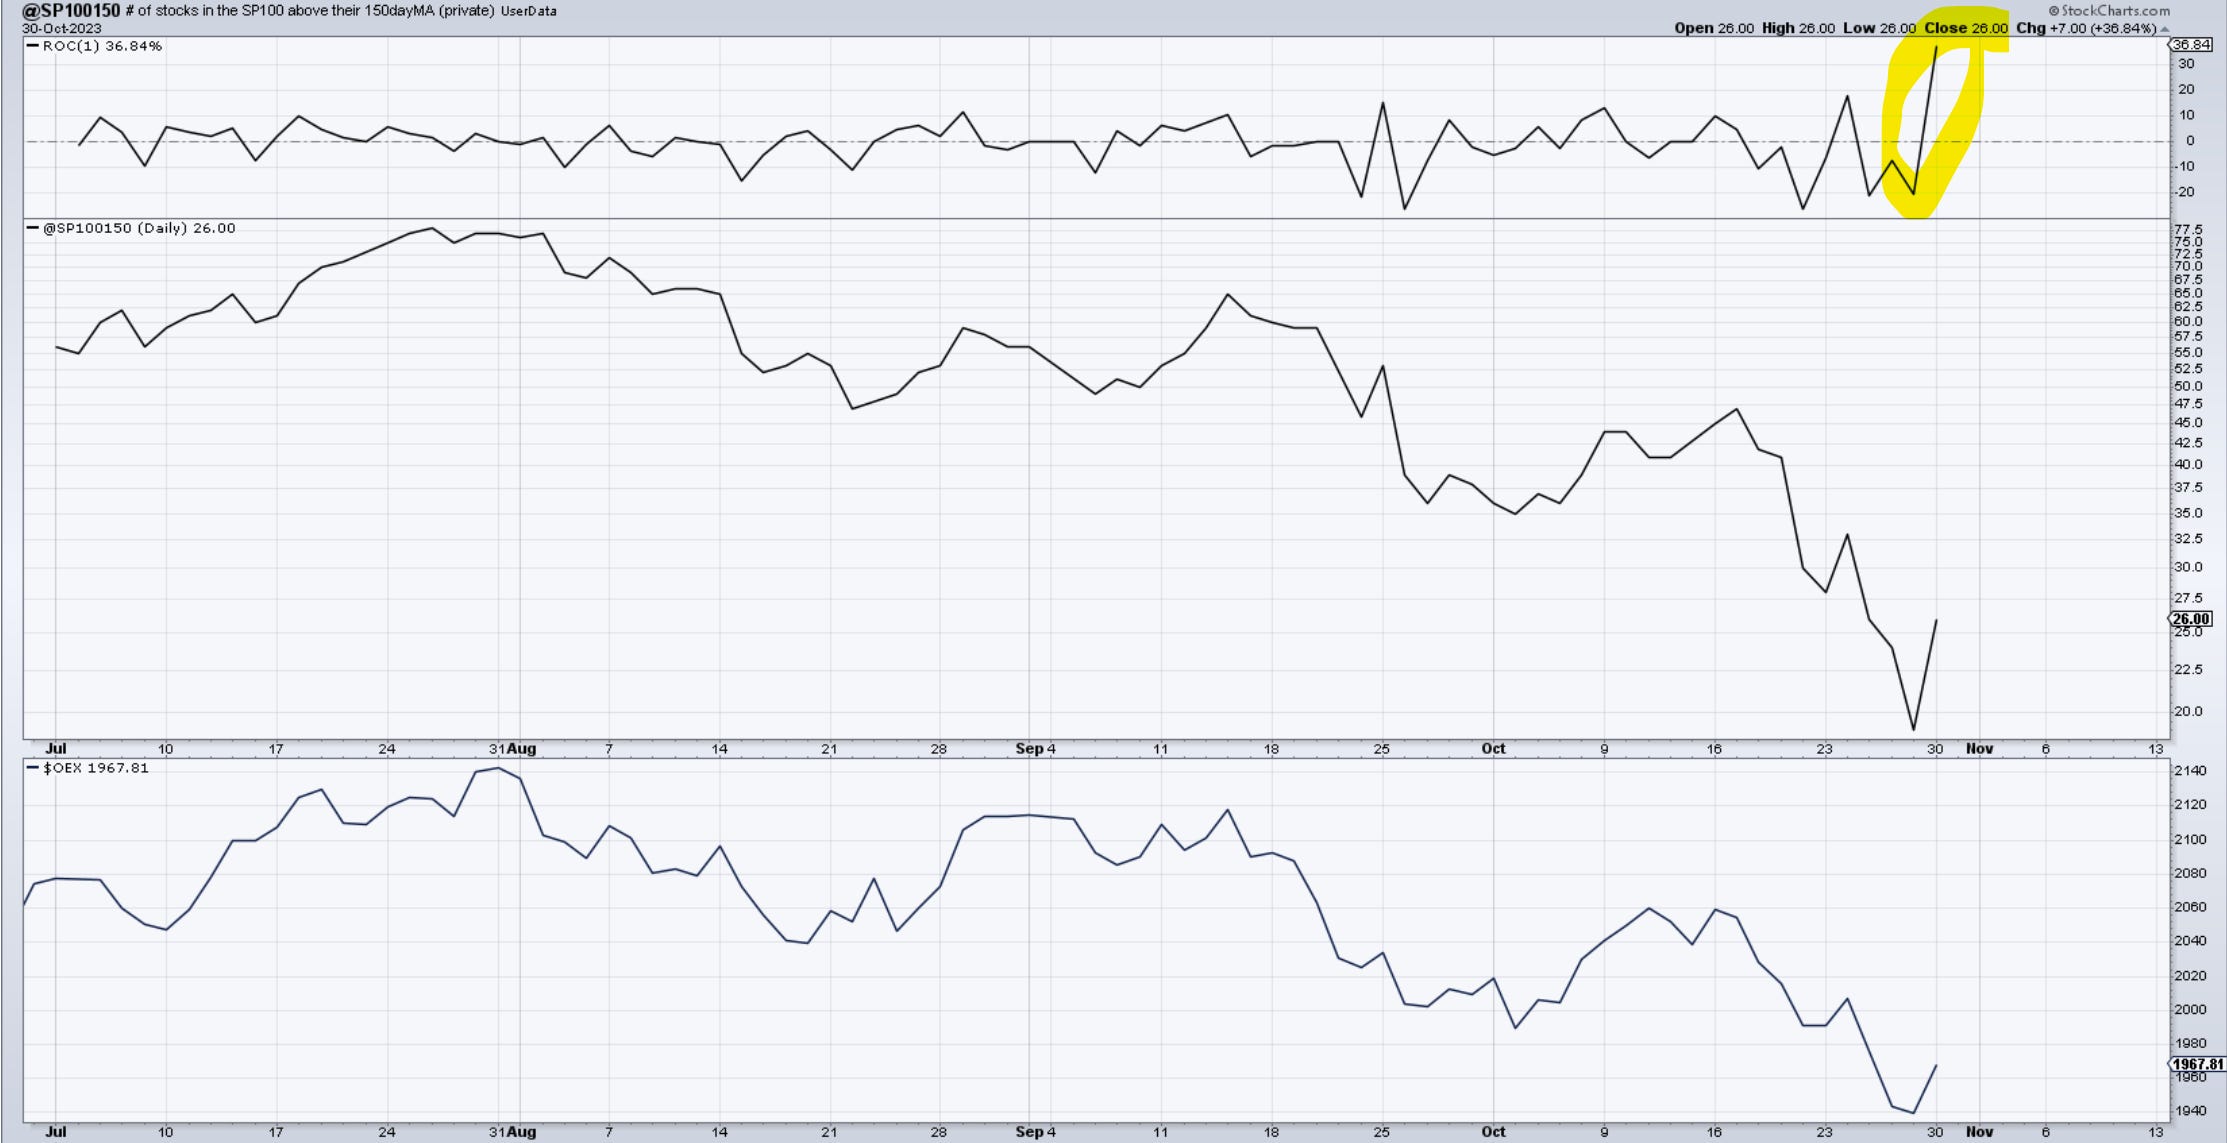
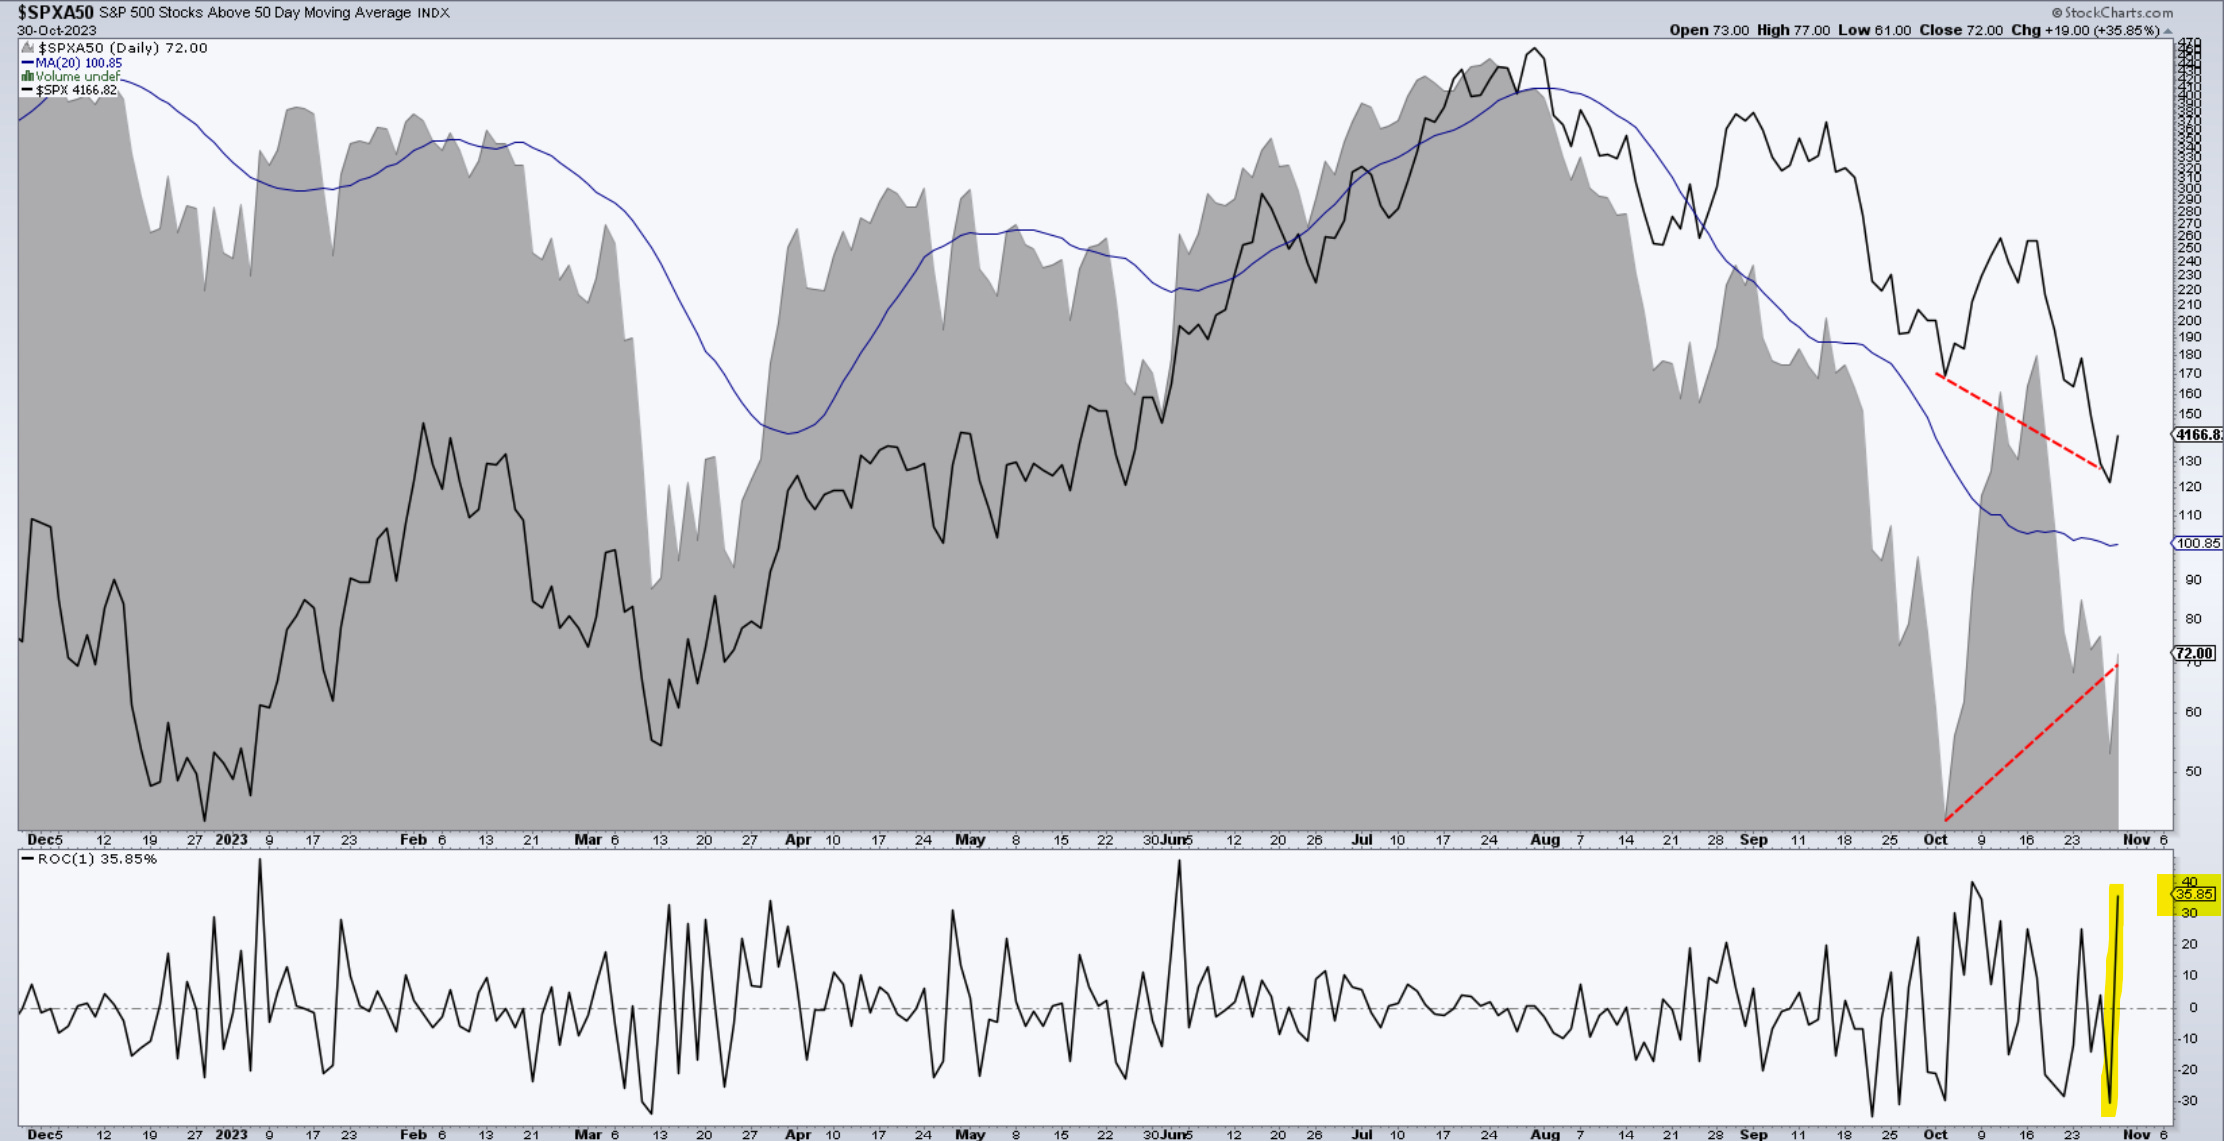
Here is a 36% daily increase in stocks rising above their 150-day MA in the SP100 and a 36% increase above 50day.
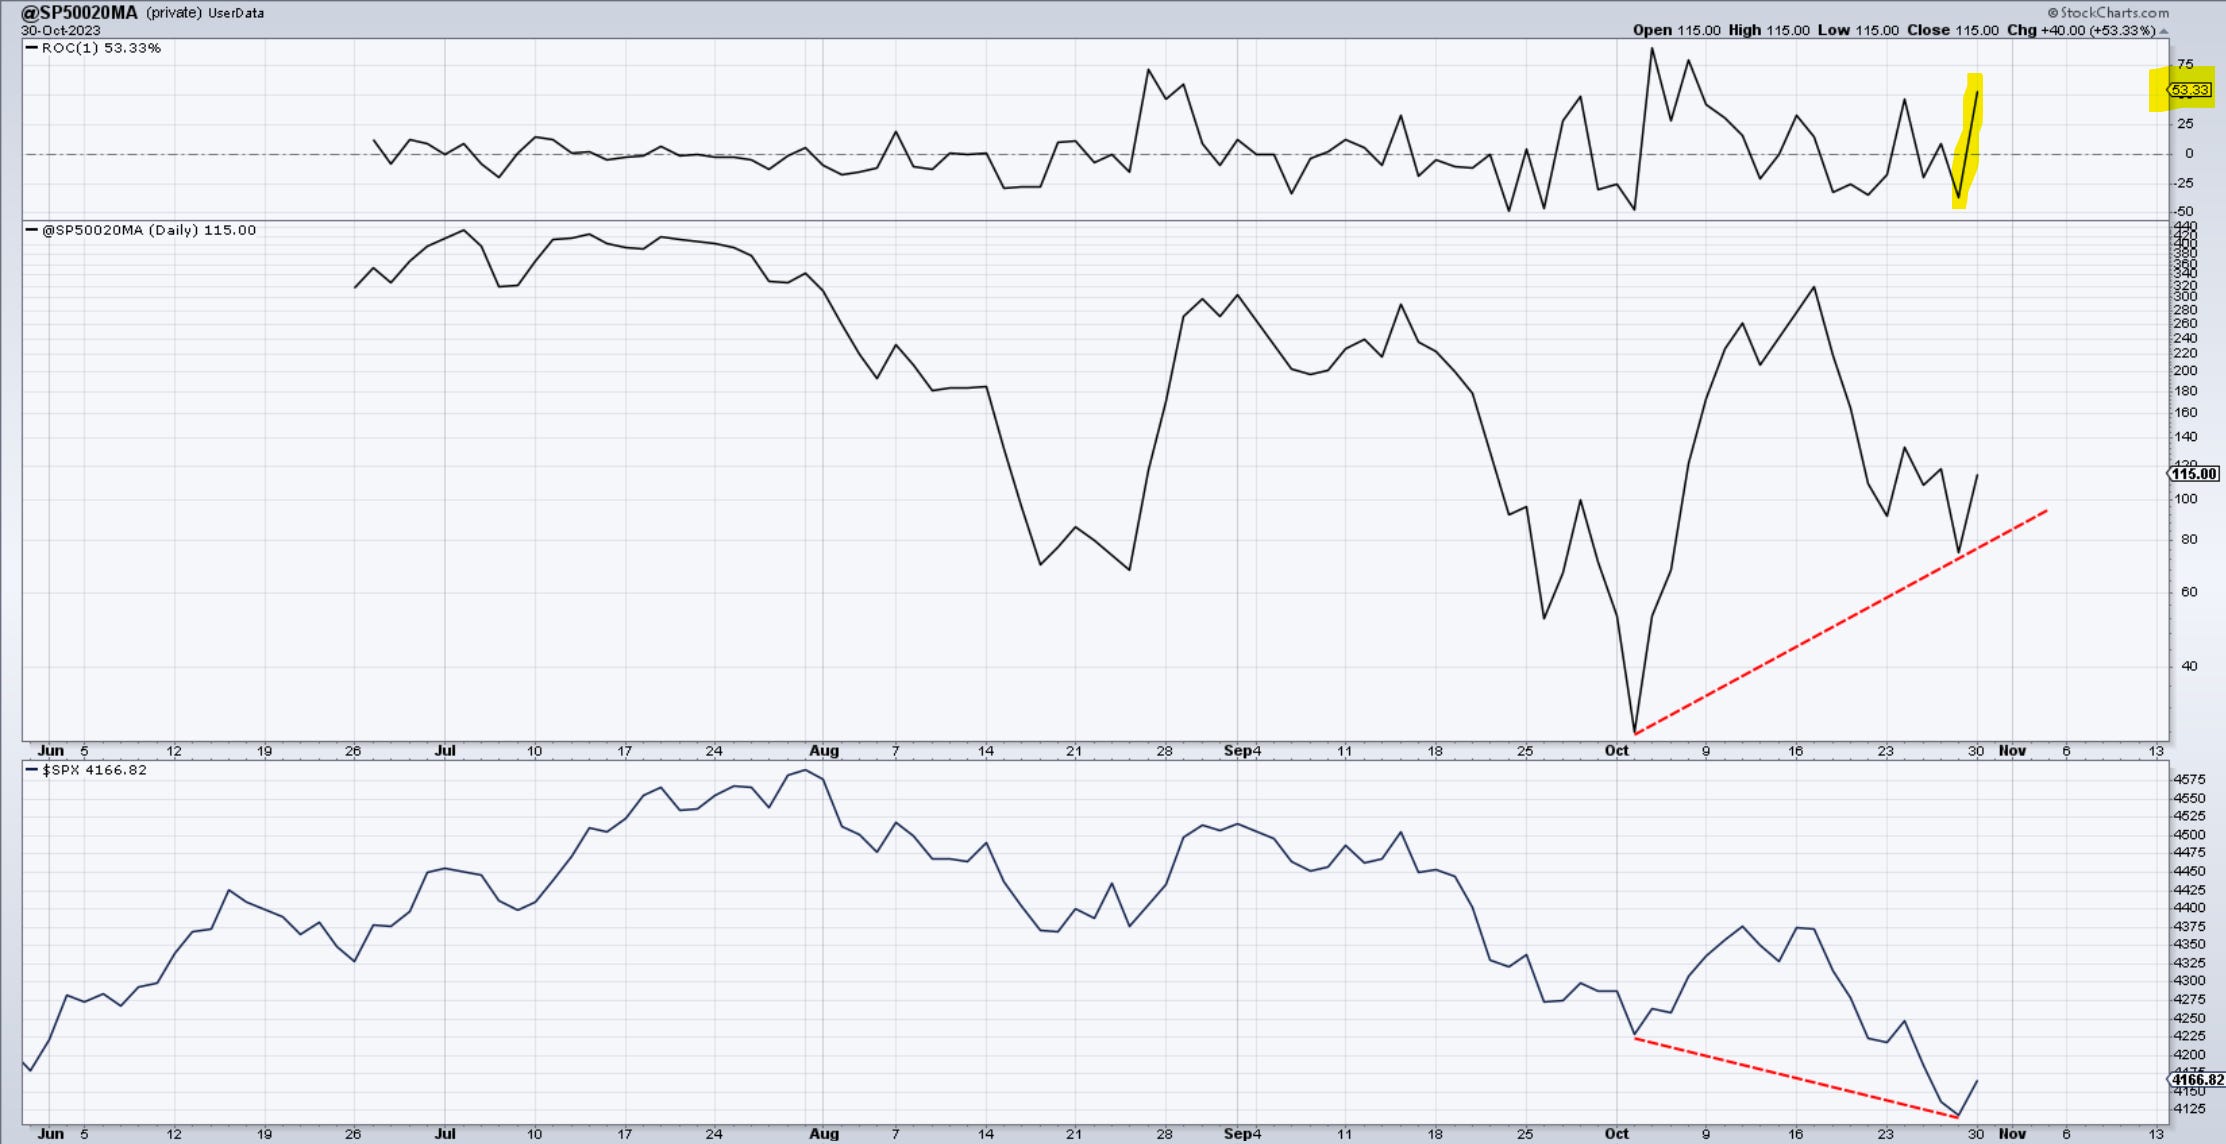
Here is a daily 53% jump in the number of stocks above their 20-day in the Sp500.
Unless this was some sort of severe short-term covering, I would dare to guess there should be a continuation of this behavior at least for several more days. Let’s not forget we’re entering the most bullish period of the year, looking back multiple decades.
The index stopped just above 4100 the high from Dec 2022. The count remains valid as a wave ((iv)) but looks very deep. The way we rally from here, if we do, and how we overtake 4400, will speak to the next steps in the market. 4200 is the first hurdle here and needs to be taken out quickly by the bulls. Multiple failures won’t bode well for and speak to a market that’s still in distribution. I will be looking for 5 waves up on 4hr and 6hr charts to confirm the low.
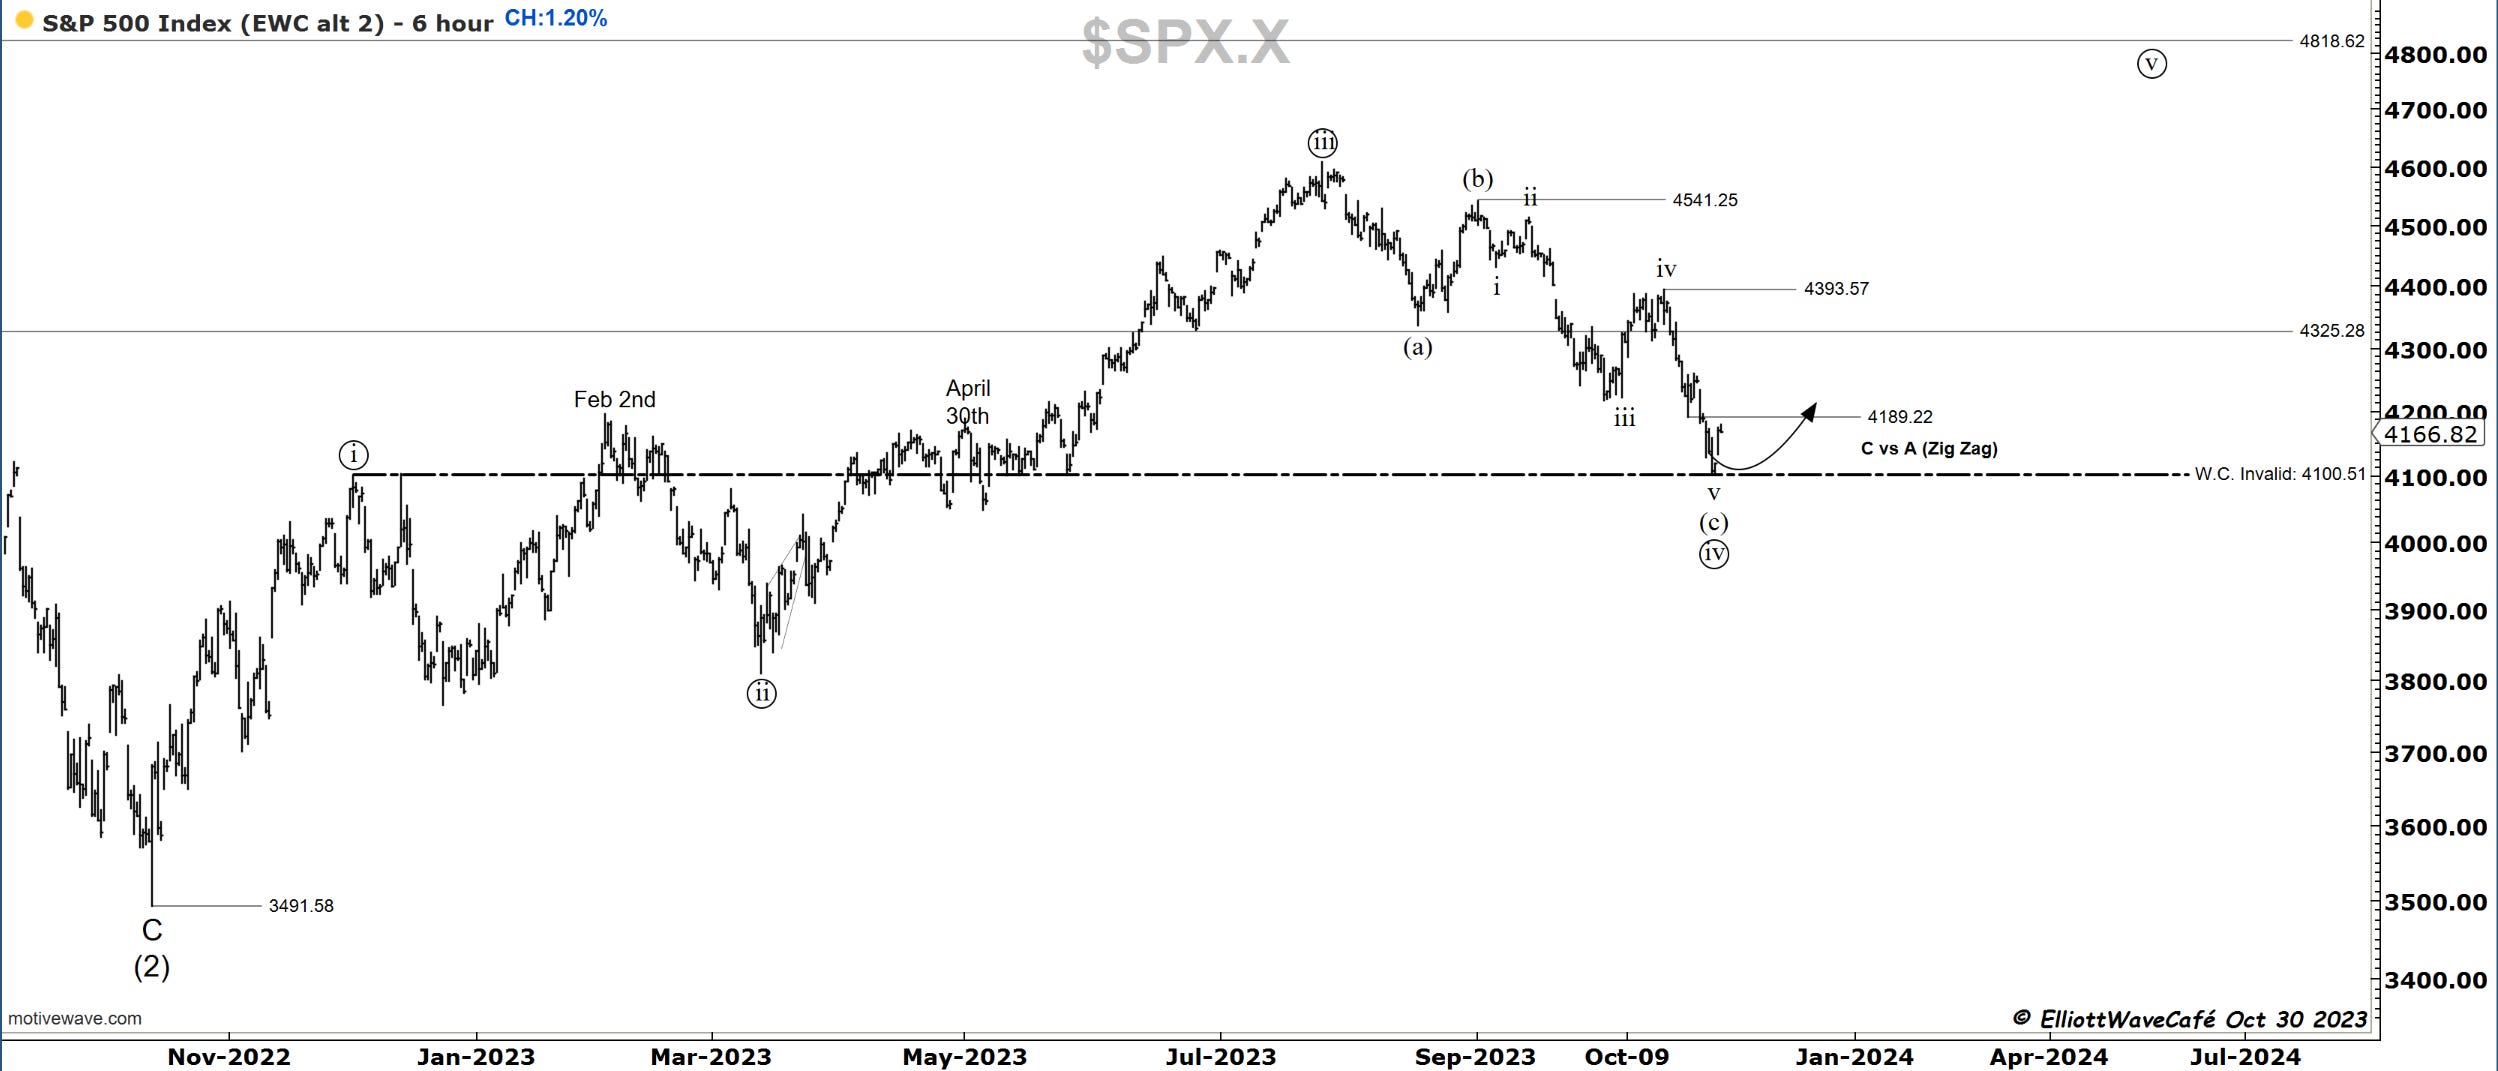
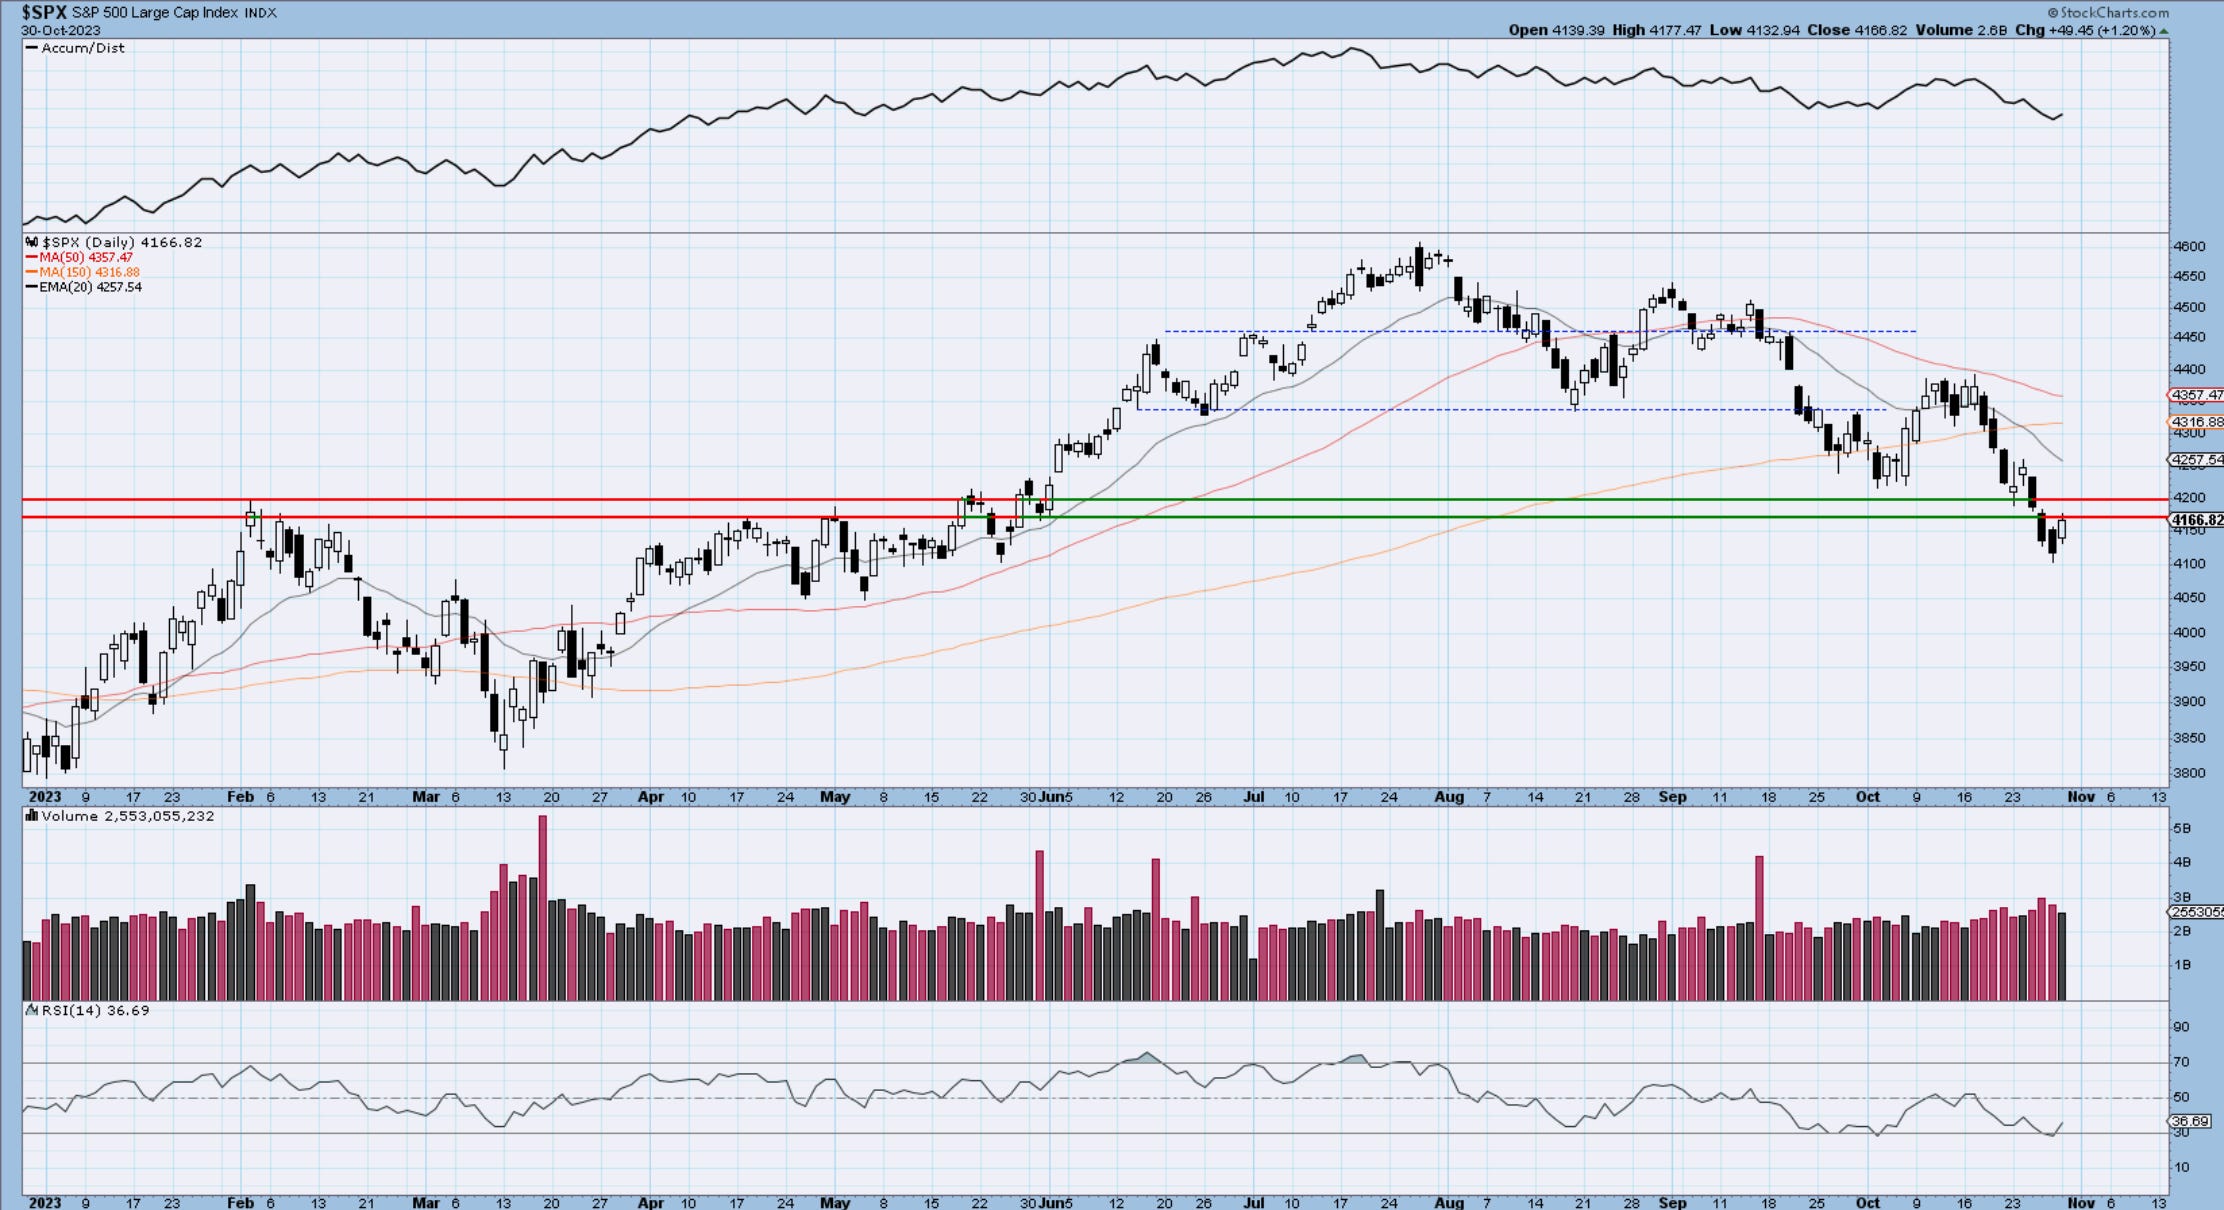
Some comments from last week’s note “There is underlying evidence of breadth divergence, seasonality, rates peaking, dollar stalling, and even appetite for crypto risk. While there is more price evidence needed to establish a better call for a stronger low, I think the bulk of the selling is in the final stages, and the window for price recovery is getting wider. “
I stand by this and will continue to monitor the signs going forward.
Nasdaq100
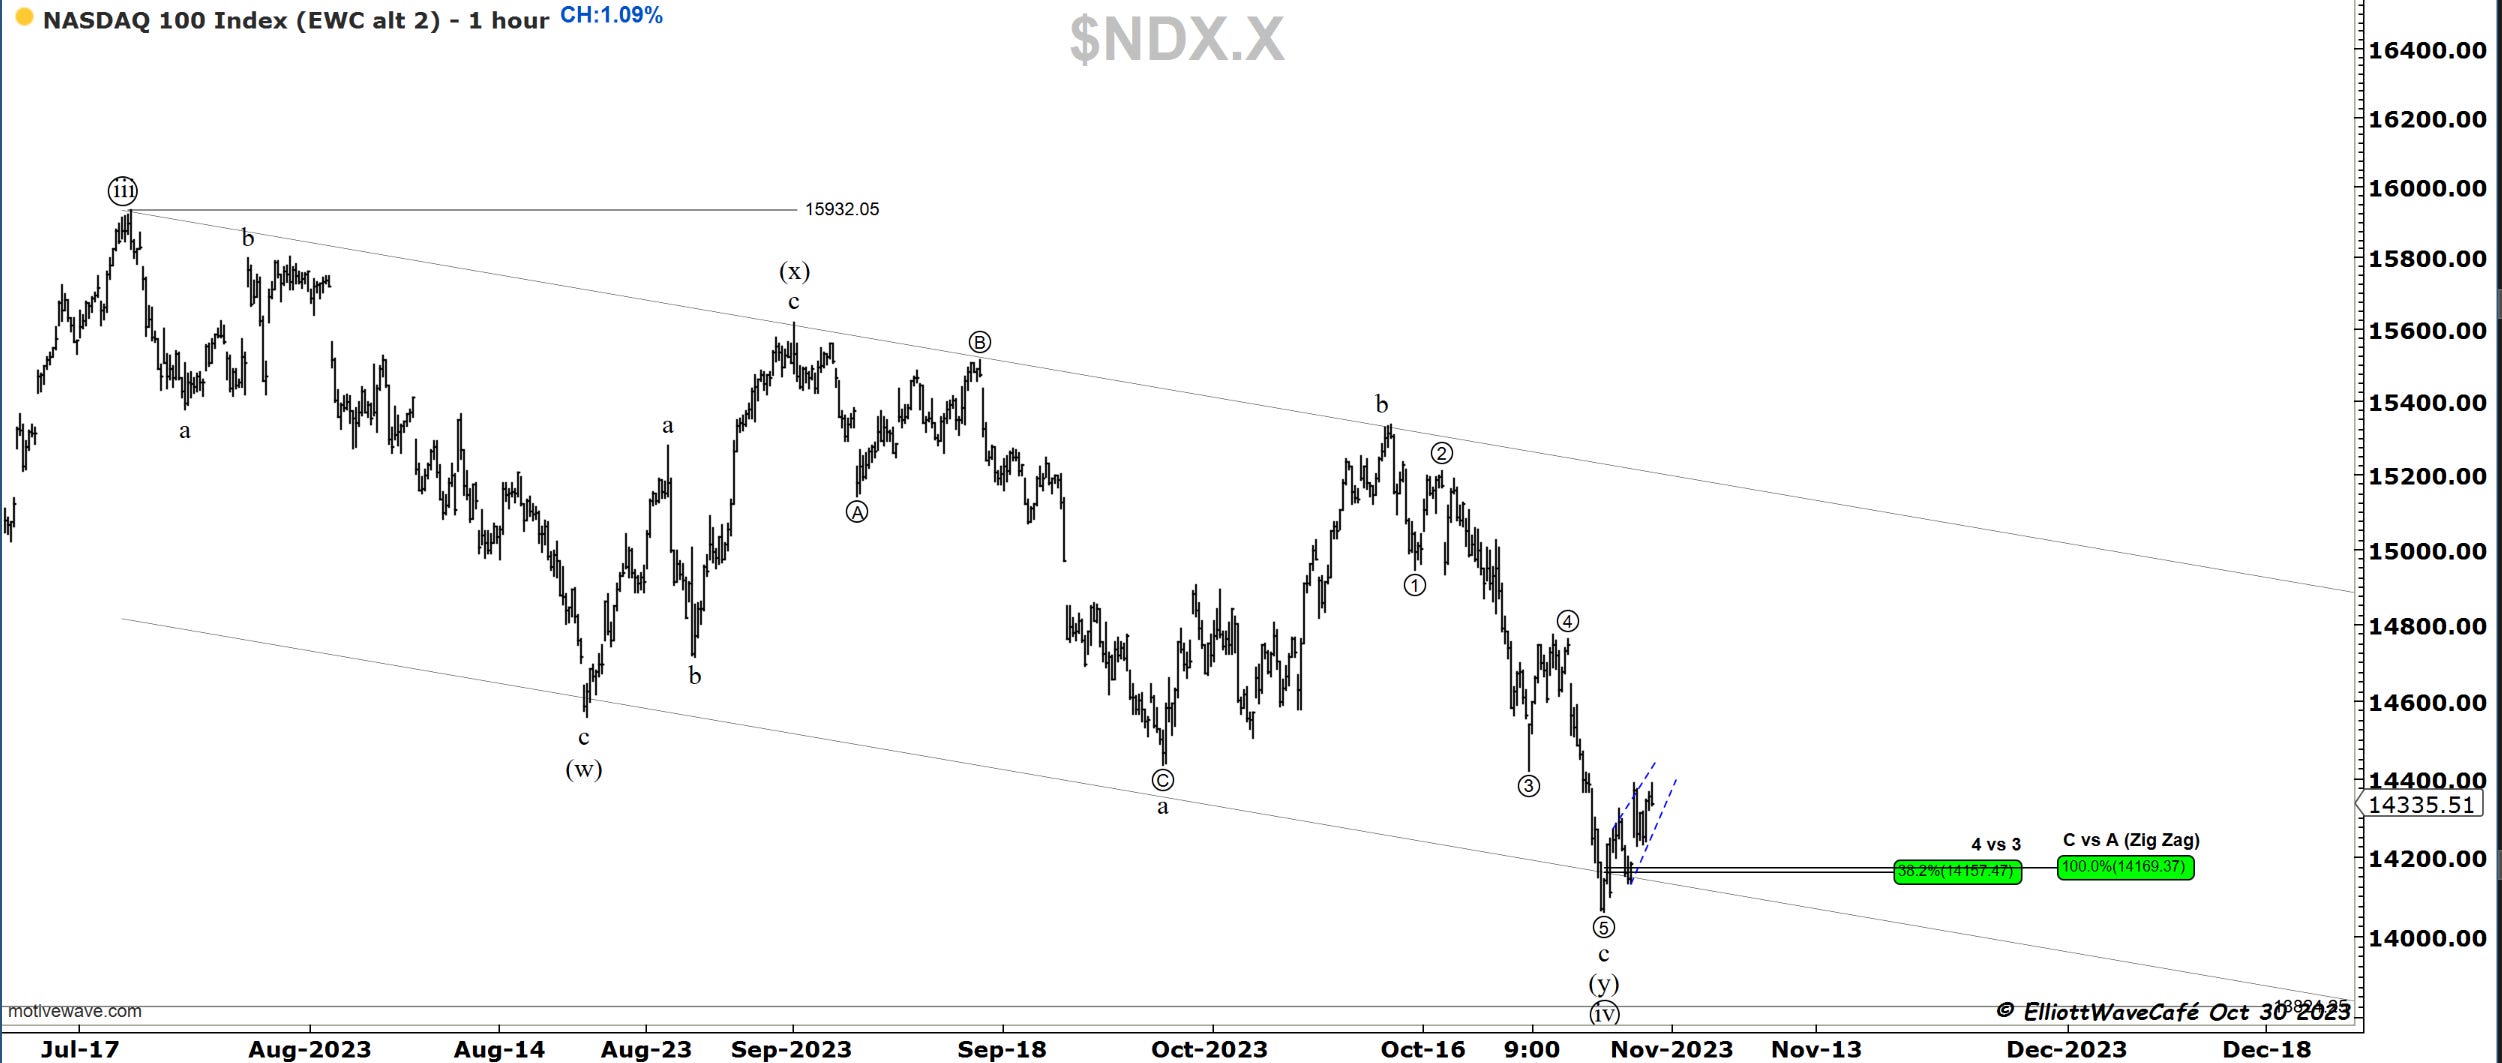
Prior comments remain - a 1% rally today, green shoot but still insufficient in being convincing. 2nd chart building a possible diagonal.
The Nasdaq correction is becoming clearer. We seem to be in double three formation, where the first (w) was a zigzag followed by a flat in wave (y). We have also hit the 38.2% for a standard wave ((iv)) throwback. The Aug ‘22 highs are also just slightly below. Notice on the second chart the 100% equality of c vs a .
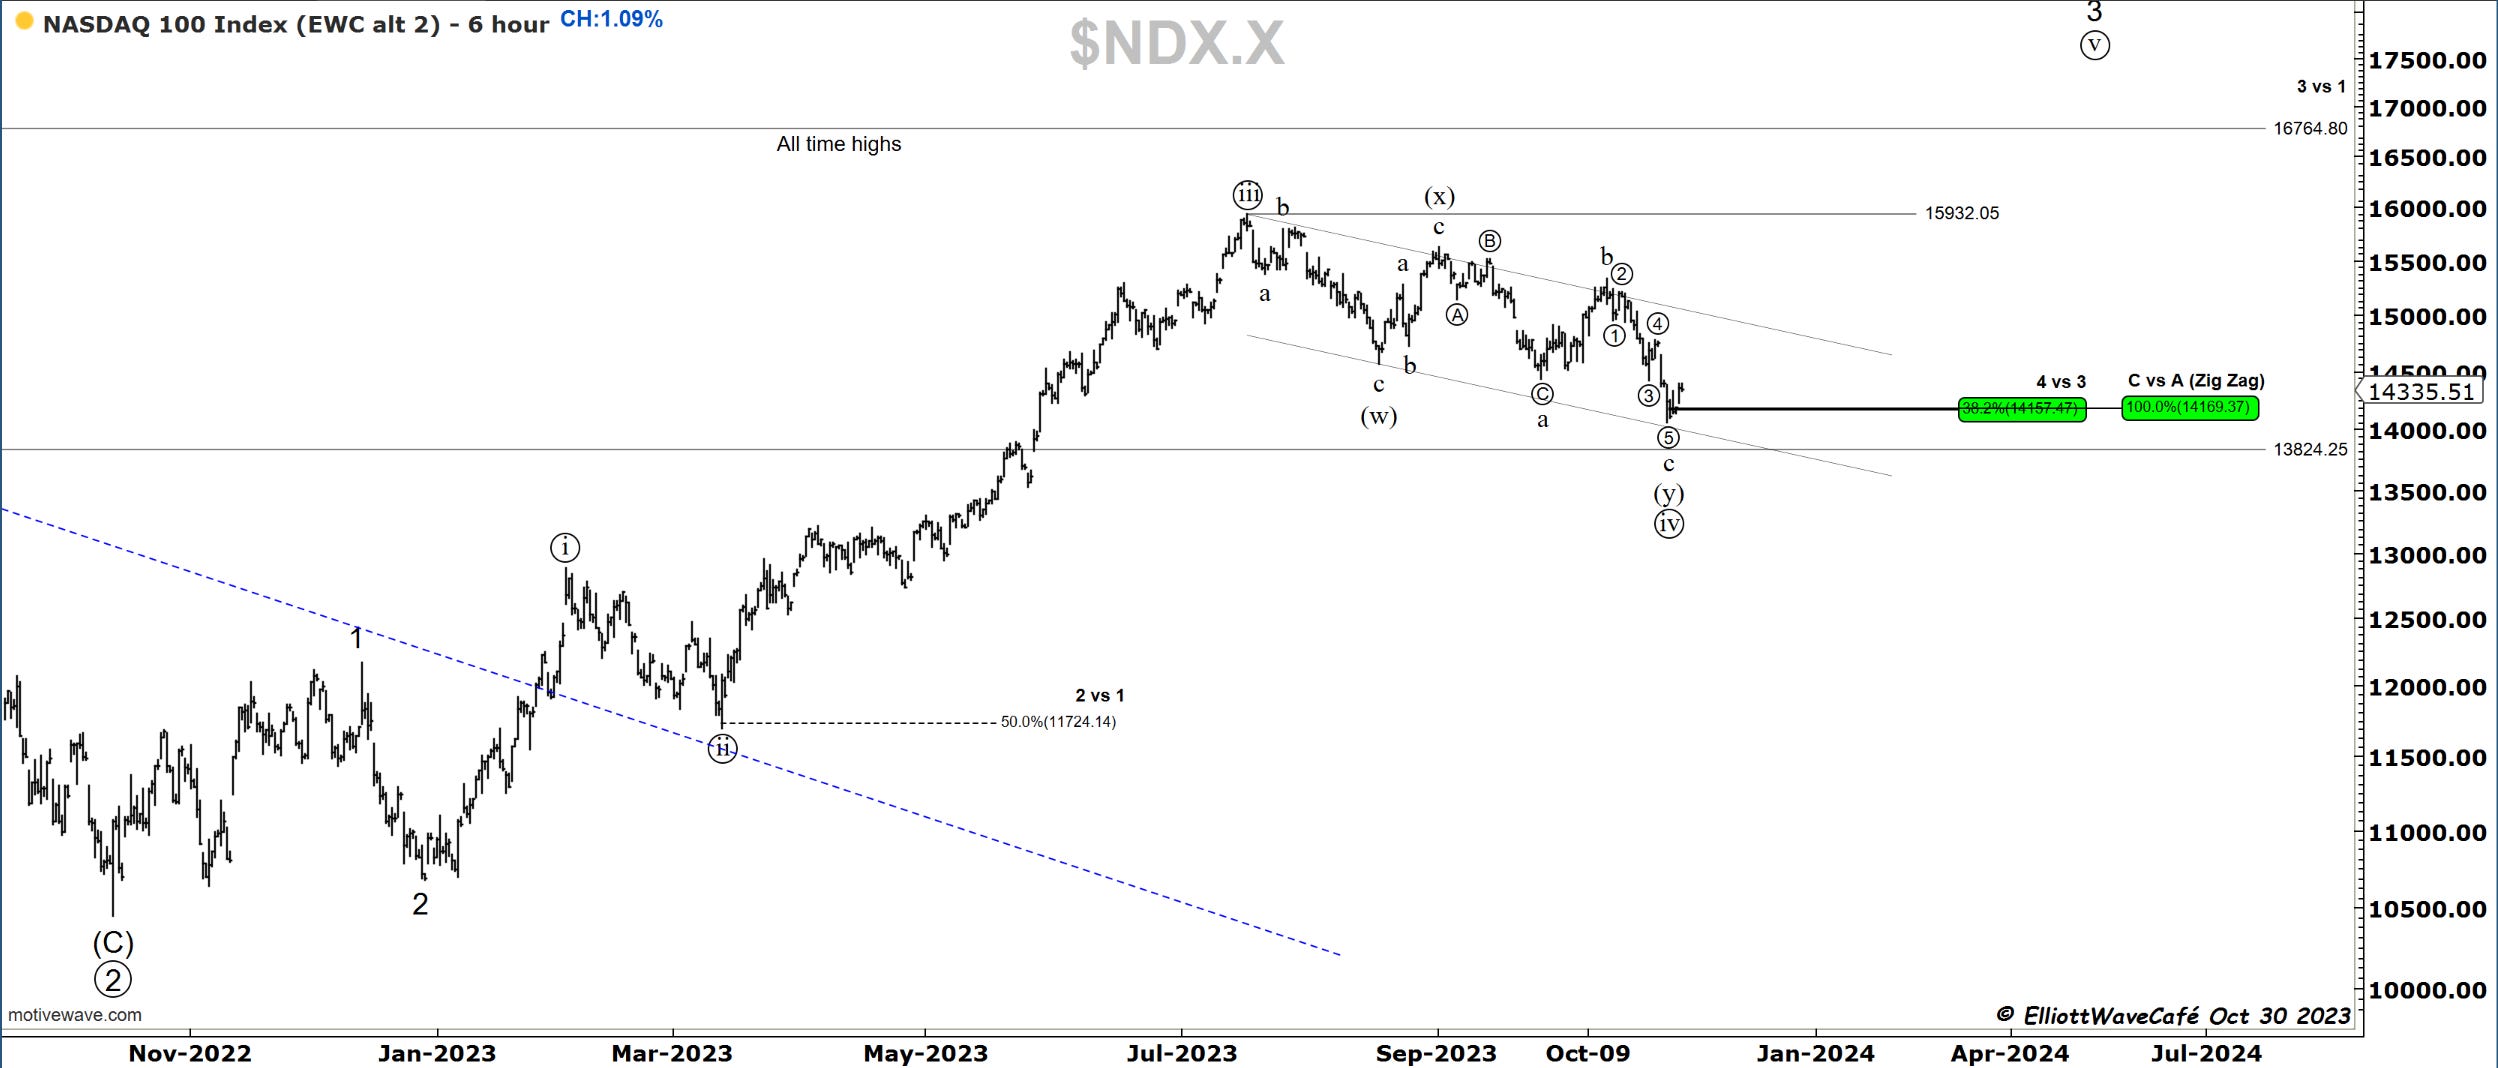
The jump from the lows here is still overlapping, so it can be a leading or just another correction.
RUSSELL 2000
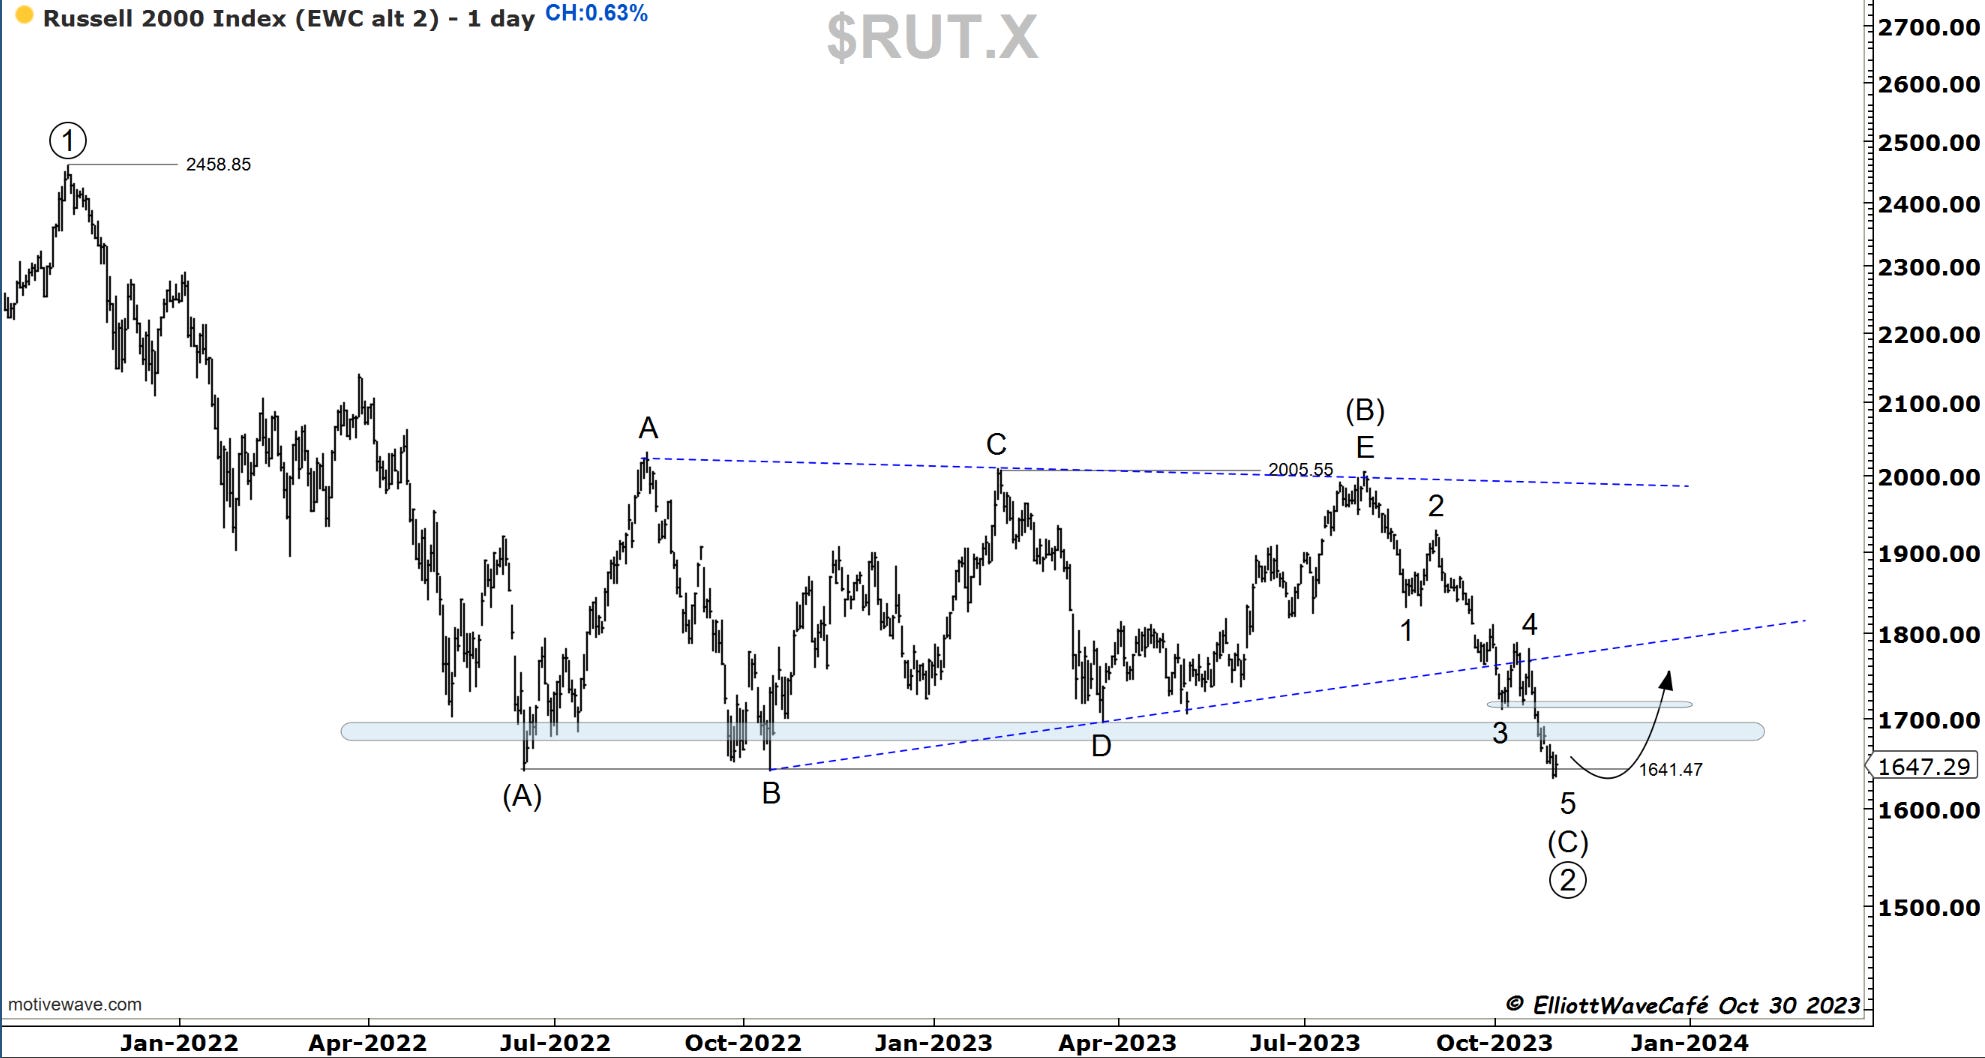
Russell dropped below last year's Oct lows and has now satisfied the requirement for completing (C) wave of a zigzag. Today’s action was still a bit weak. Let’s see if it manages to get back above 1700. Usually, these breaks have a tendency to punish late sellers for a while.
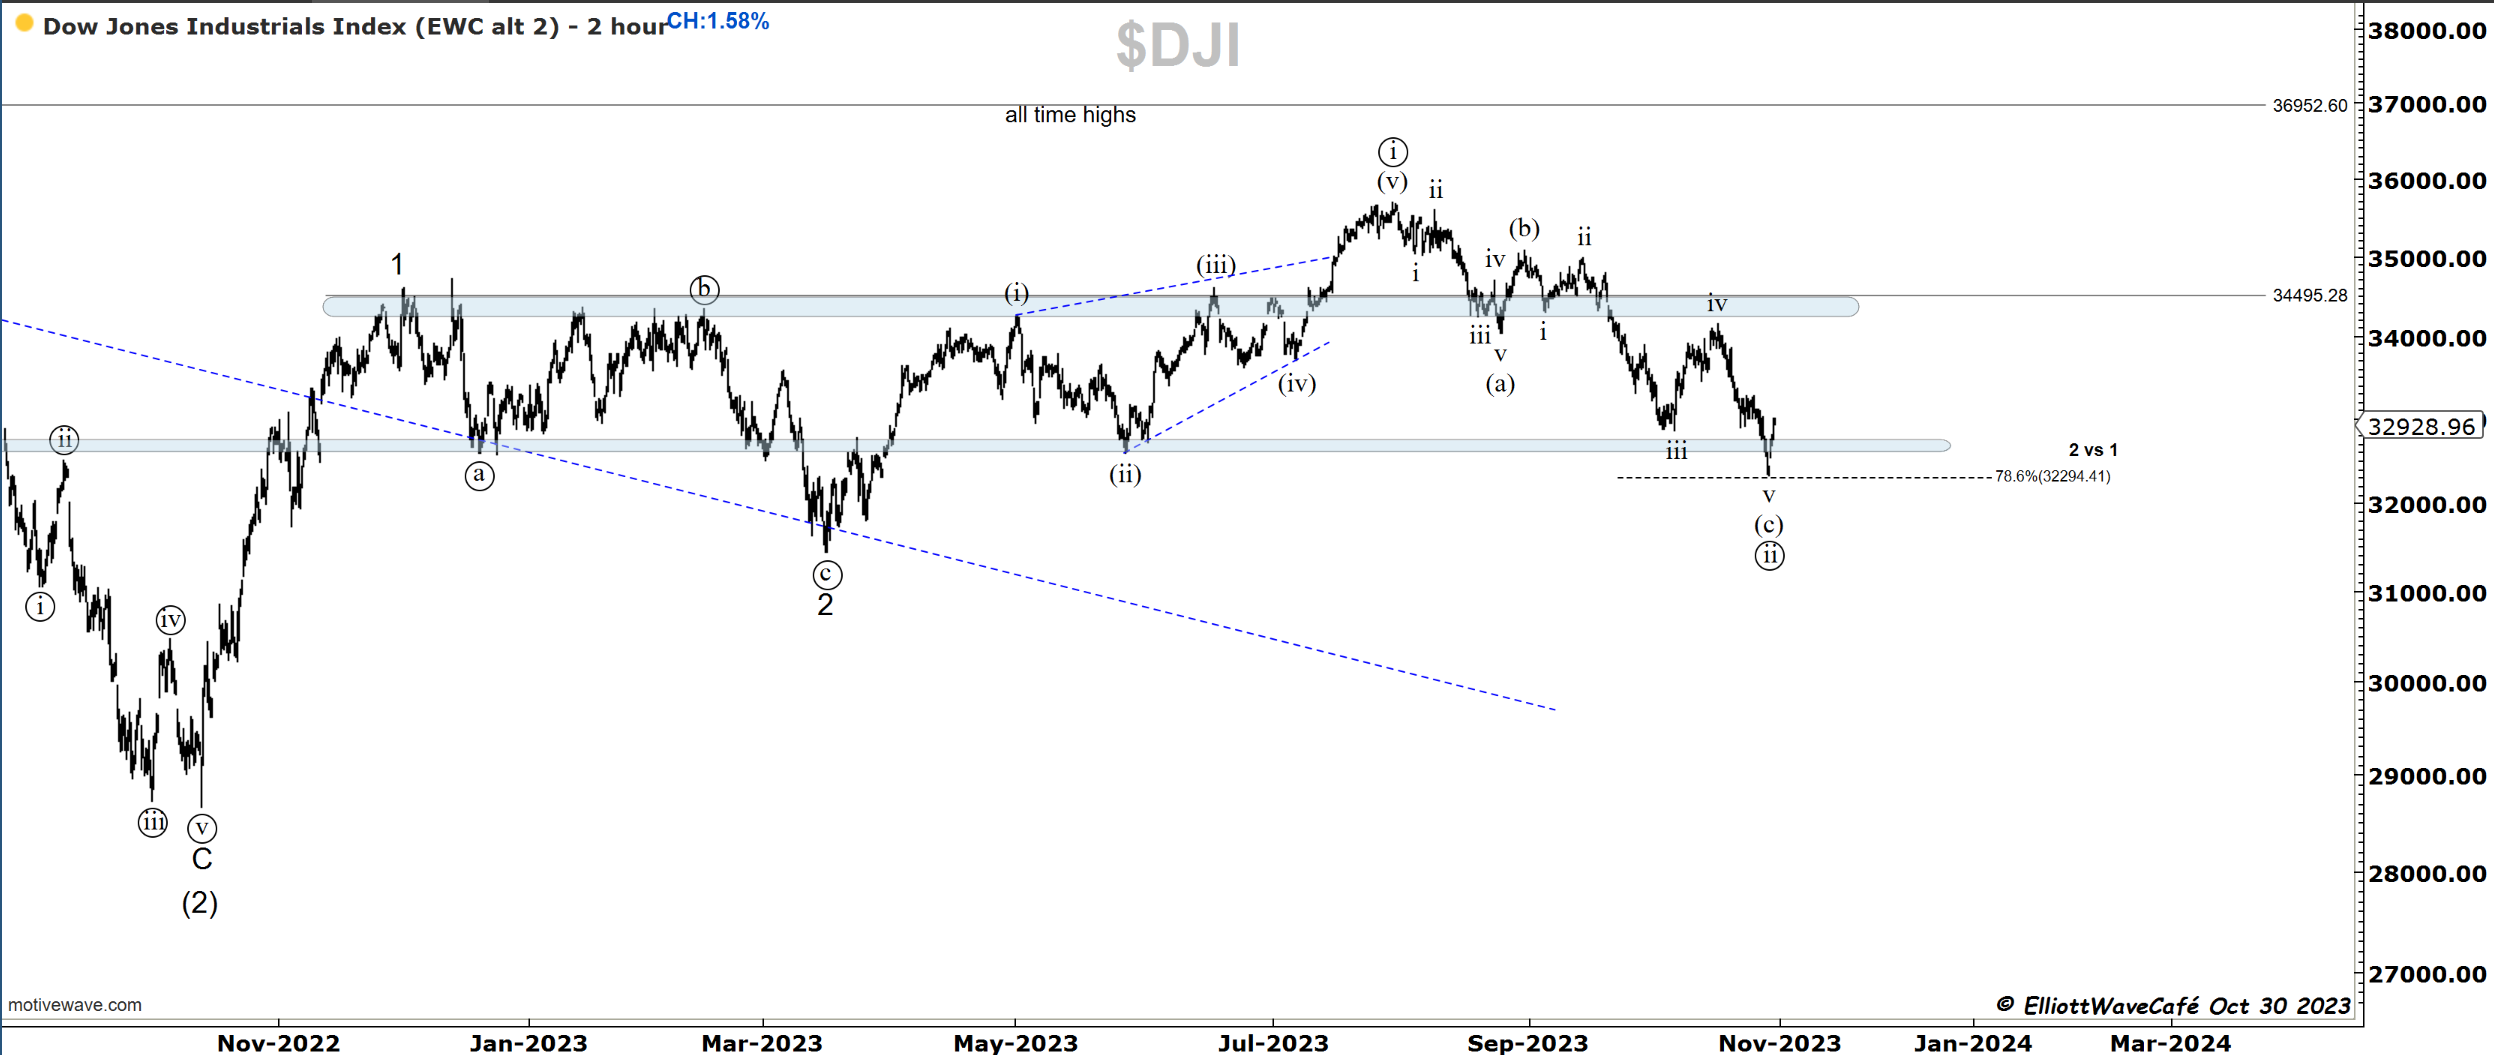
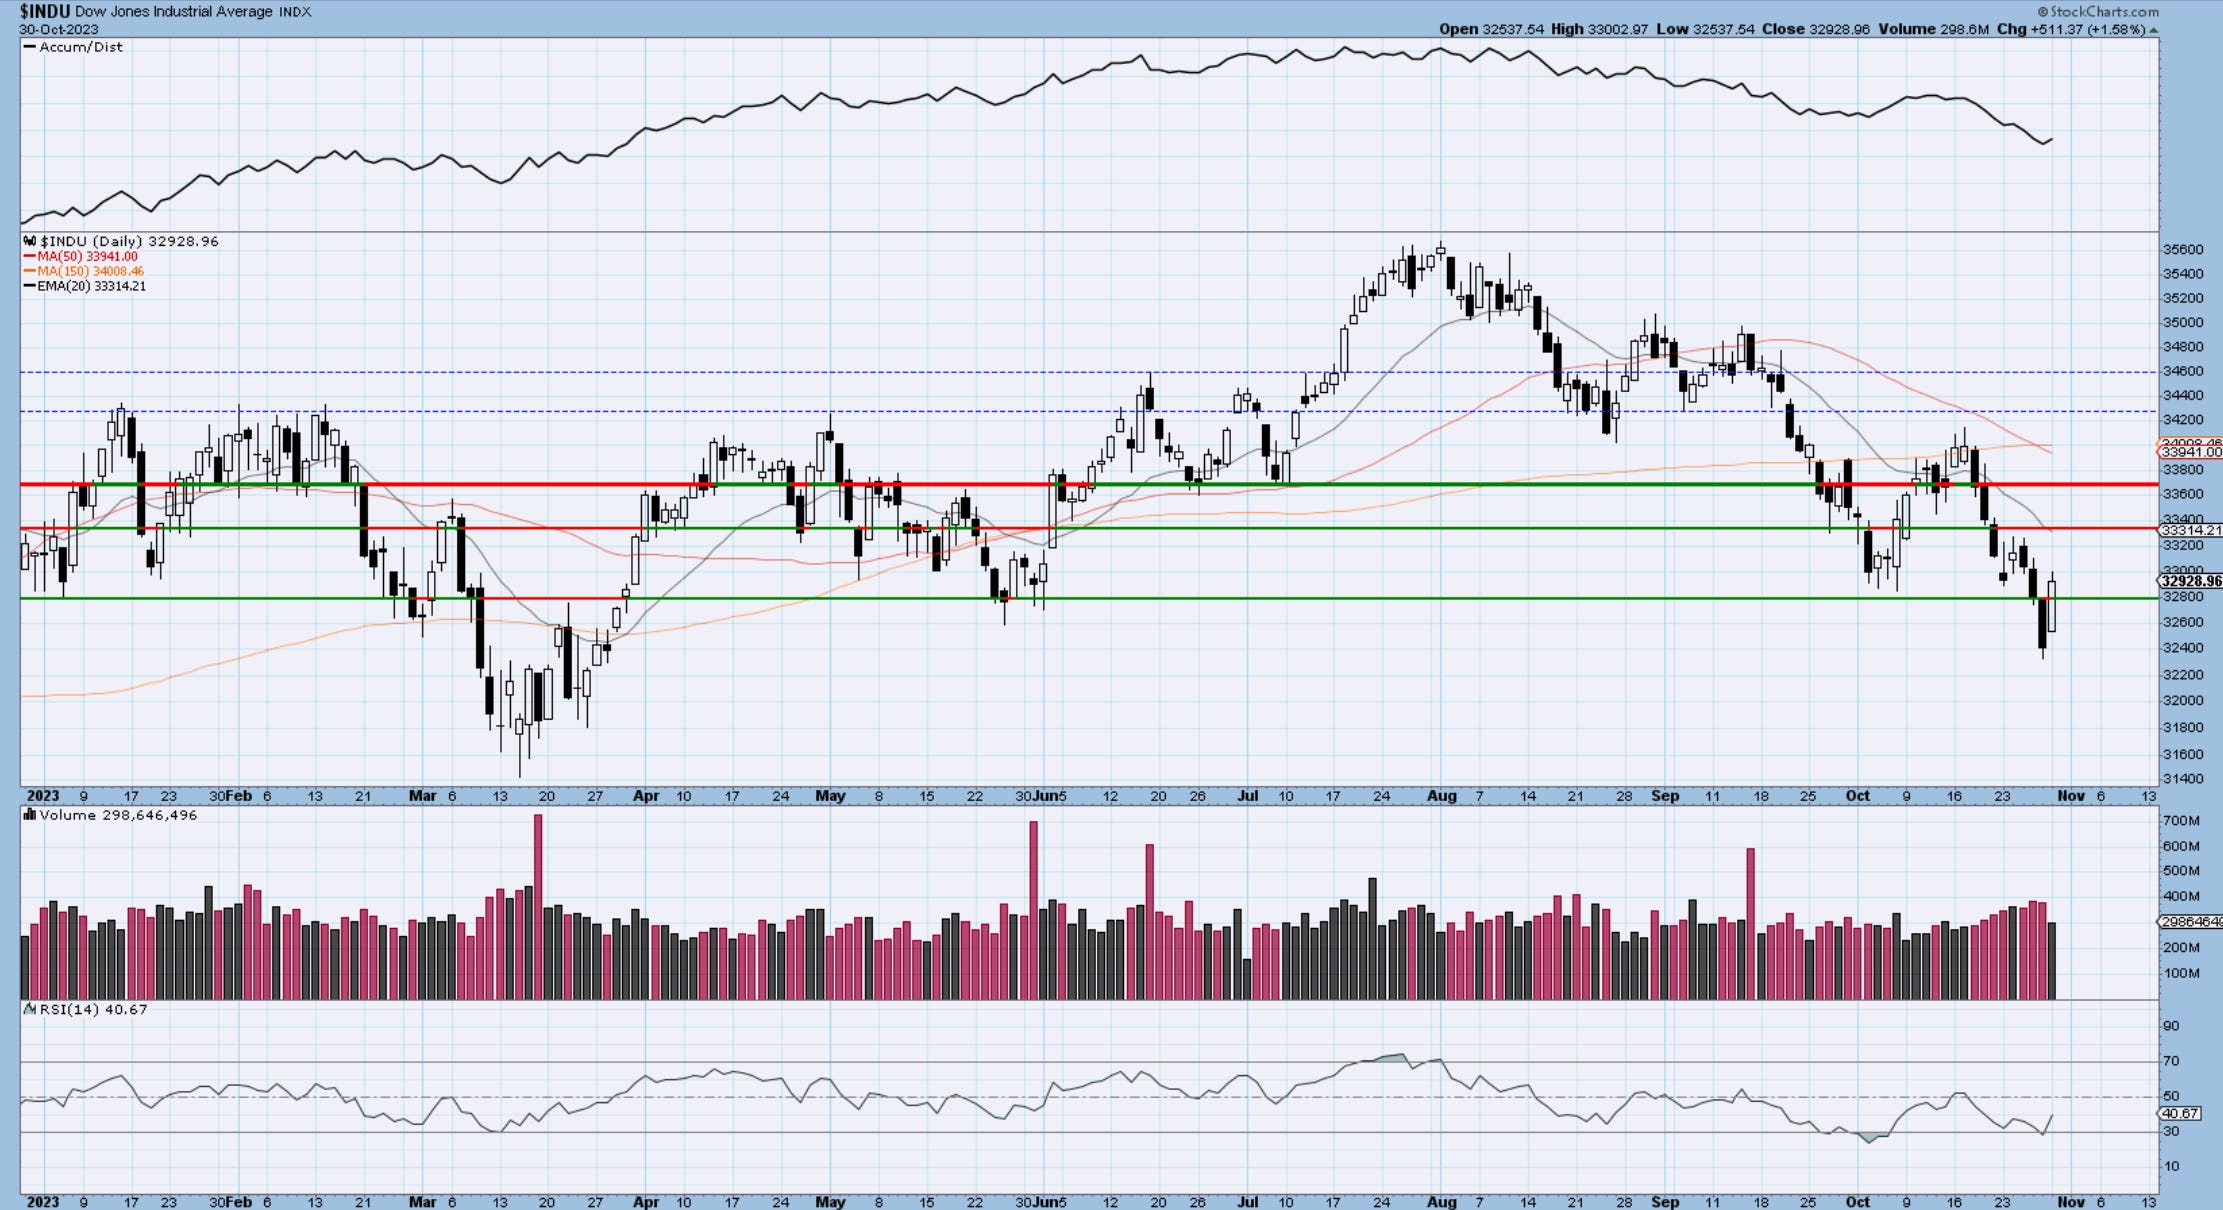
Dow30
Quite a performance from the Dow today after it touched 78.6% on Friday. Being back above broken support it’s quite a positive development and can make one argue about the completion of this declining leg. Let’s see 5 waves up and will get further confirmations.
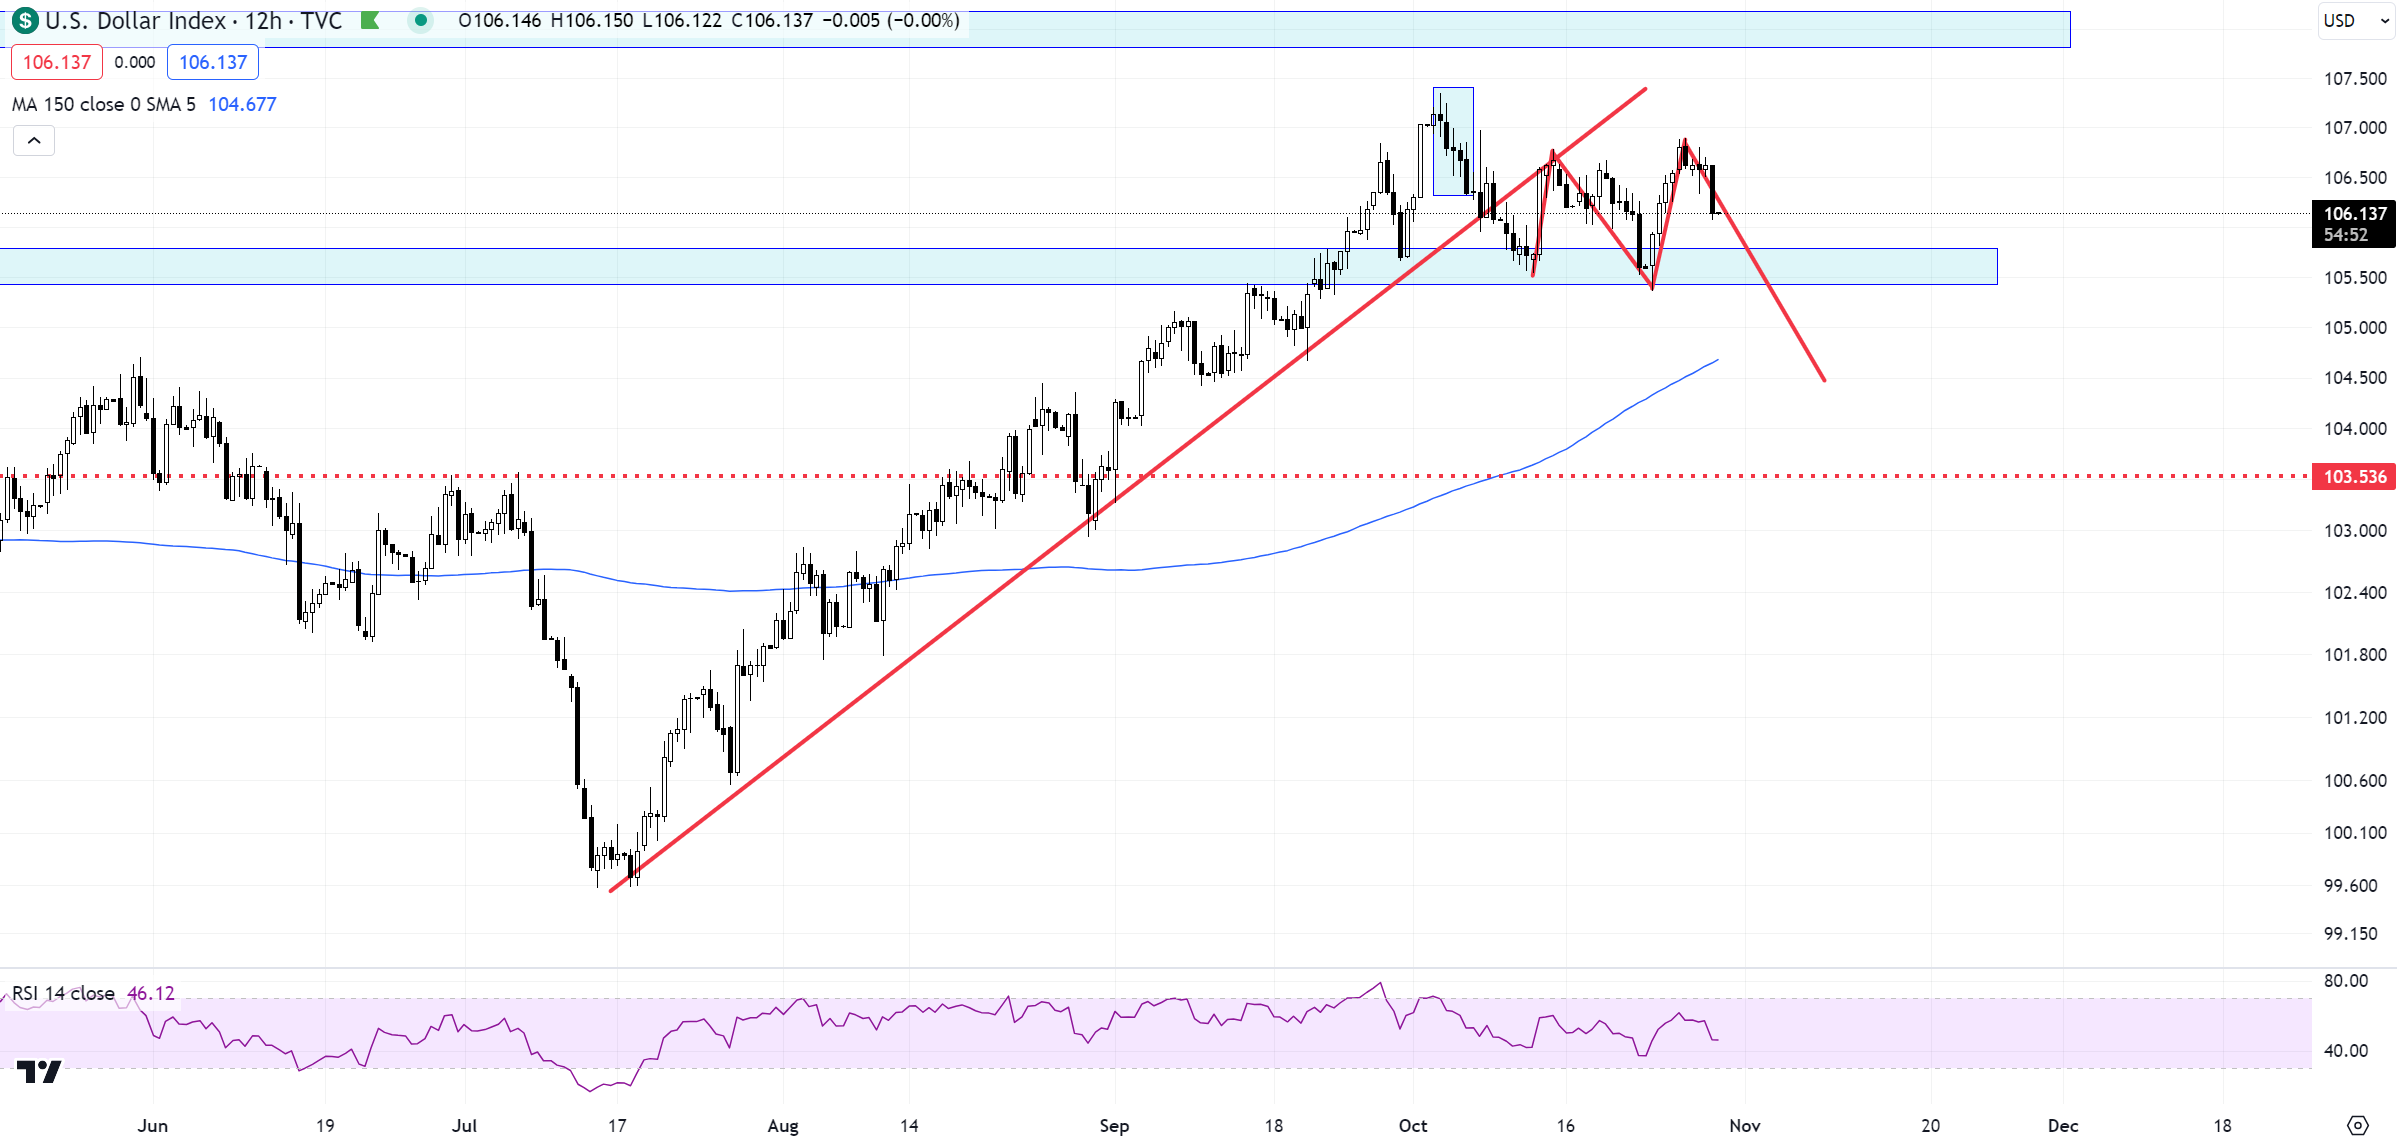
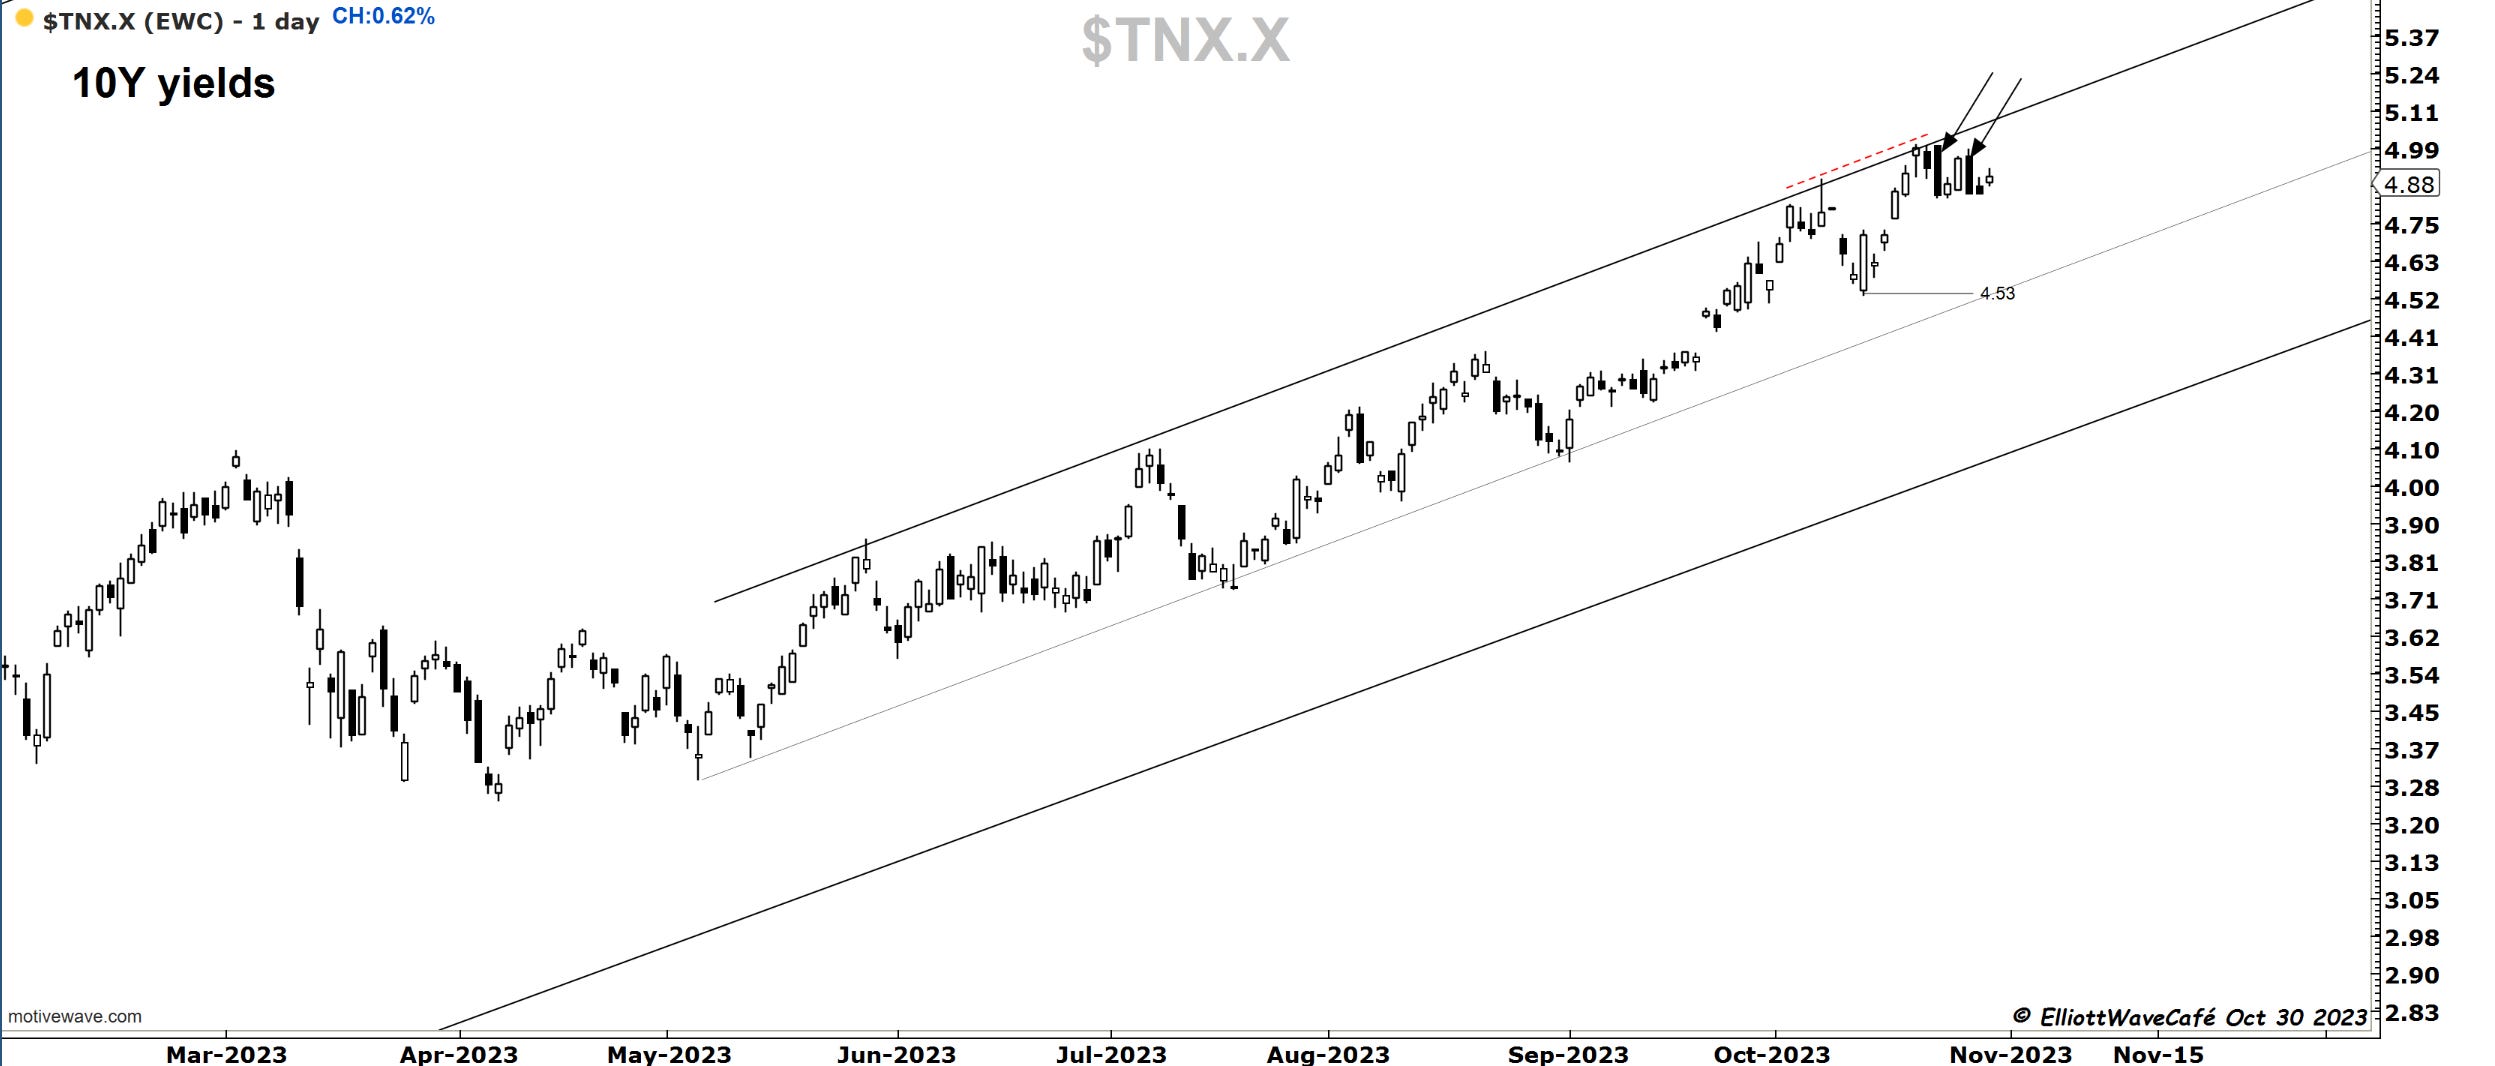
US Dollar and Yields
A loss in the dollar index confirms today’s buying in equities as being real. The dollar behavior since October began, was nothing short of non-confirming the fear everywhere else. It should be a gauge on every trader’s radar, if nothing else, just for judging how it behaves when other markets are throwing tantrums.
Just pointing to 2 rejection days in 10-year yields. I know they’re waiting for the Fed on Wed, so really not expecting much until then. I continue to view them as being in a topping process.
Gold
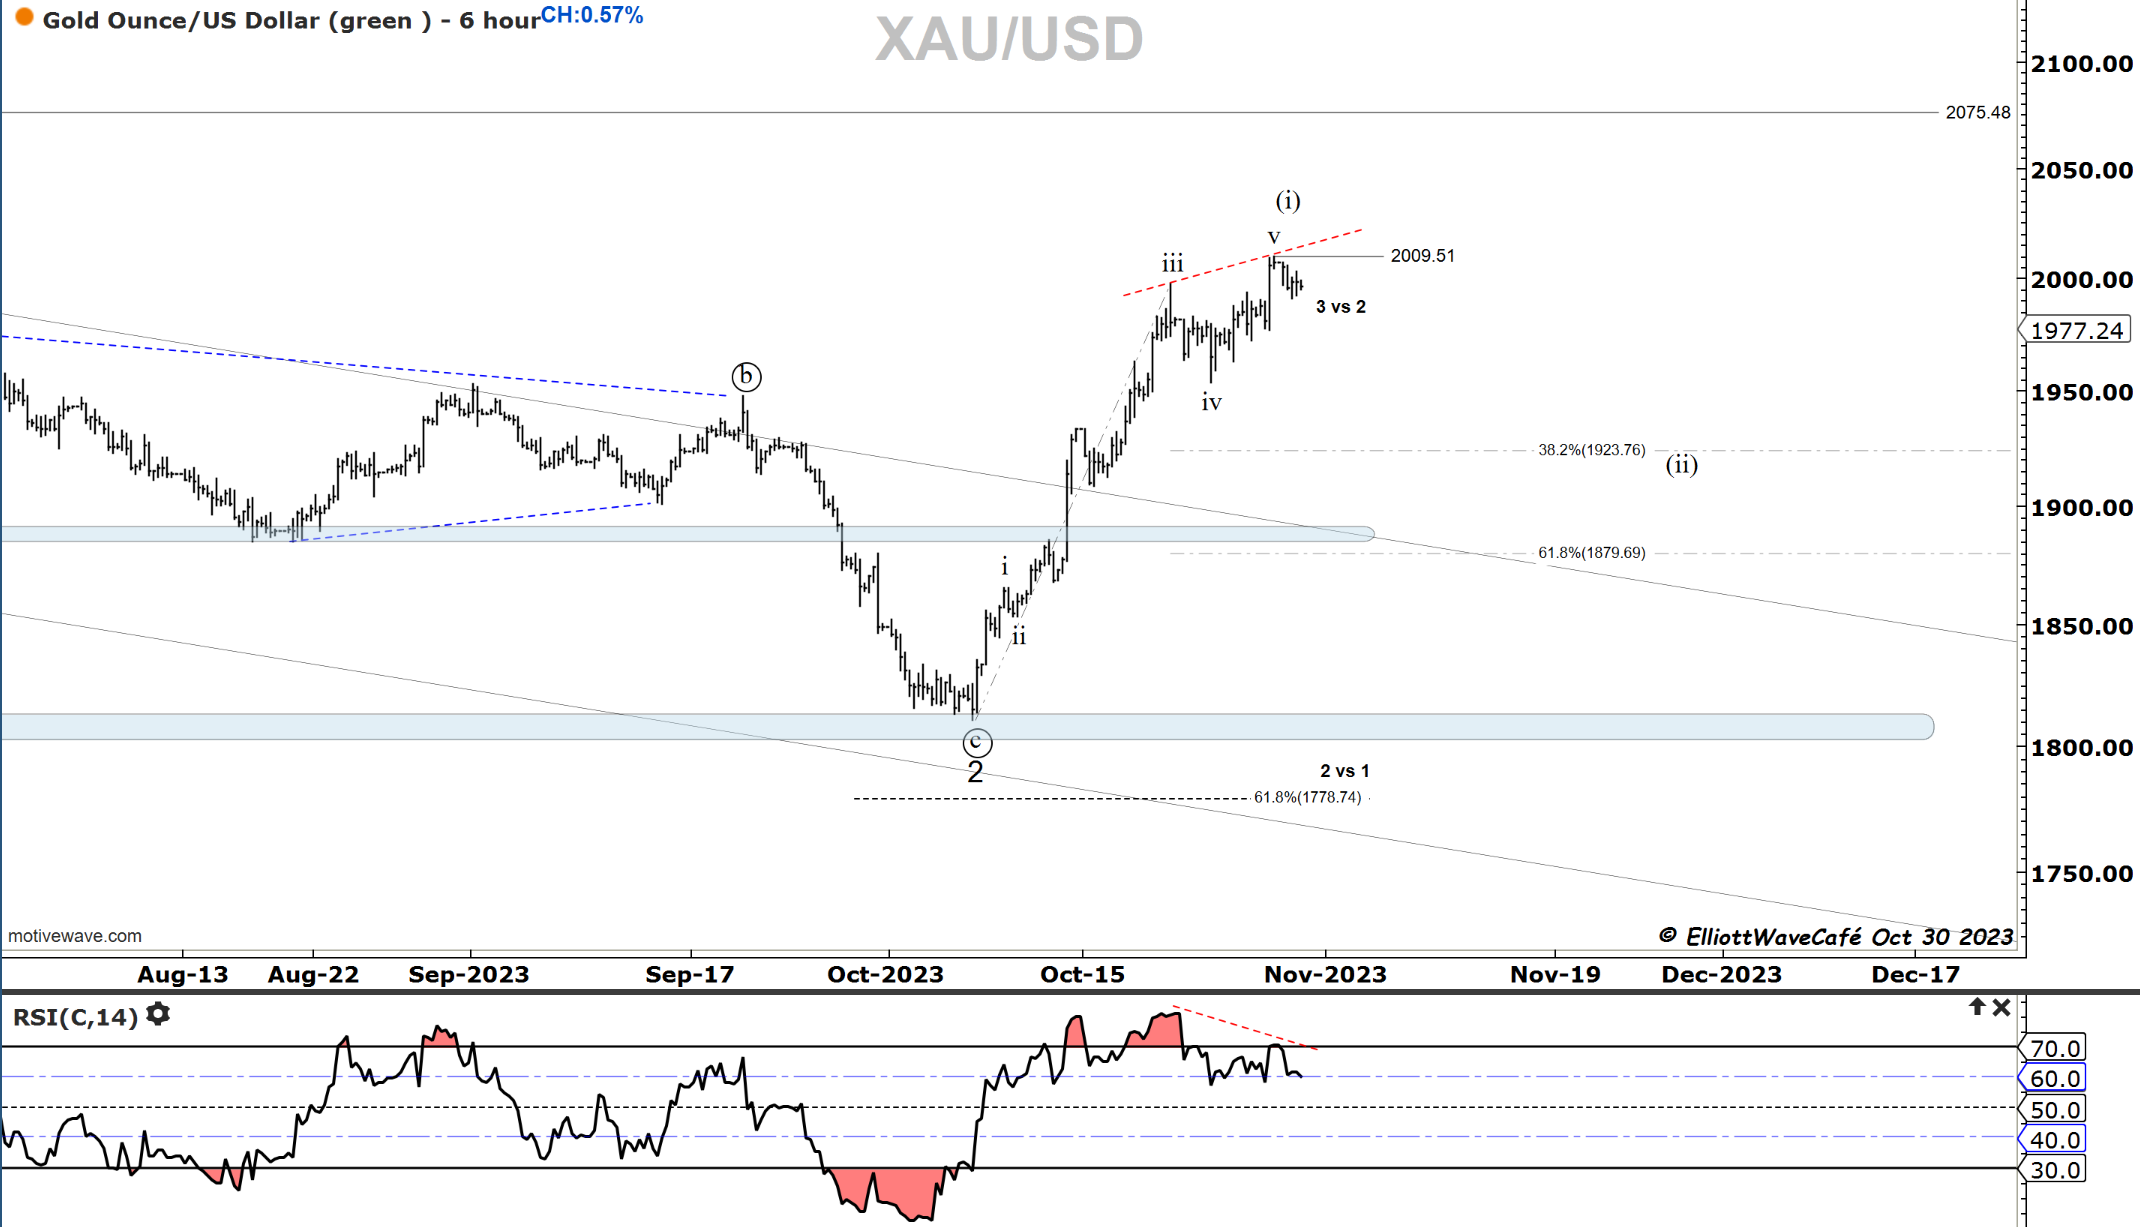
Gold is trying to rally but the rate of ascent is slowing. I can see a possible 5-wave move with divergence in RSI. Let me just say that being long here is playing with a bit of fire. Once a wave (ii) pullback unfolds the odds will be back in bullish favor.
Bitcoin
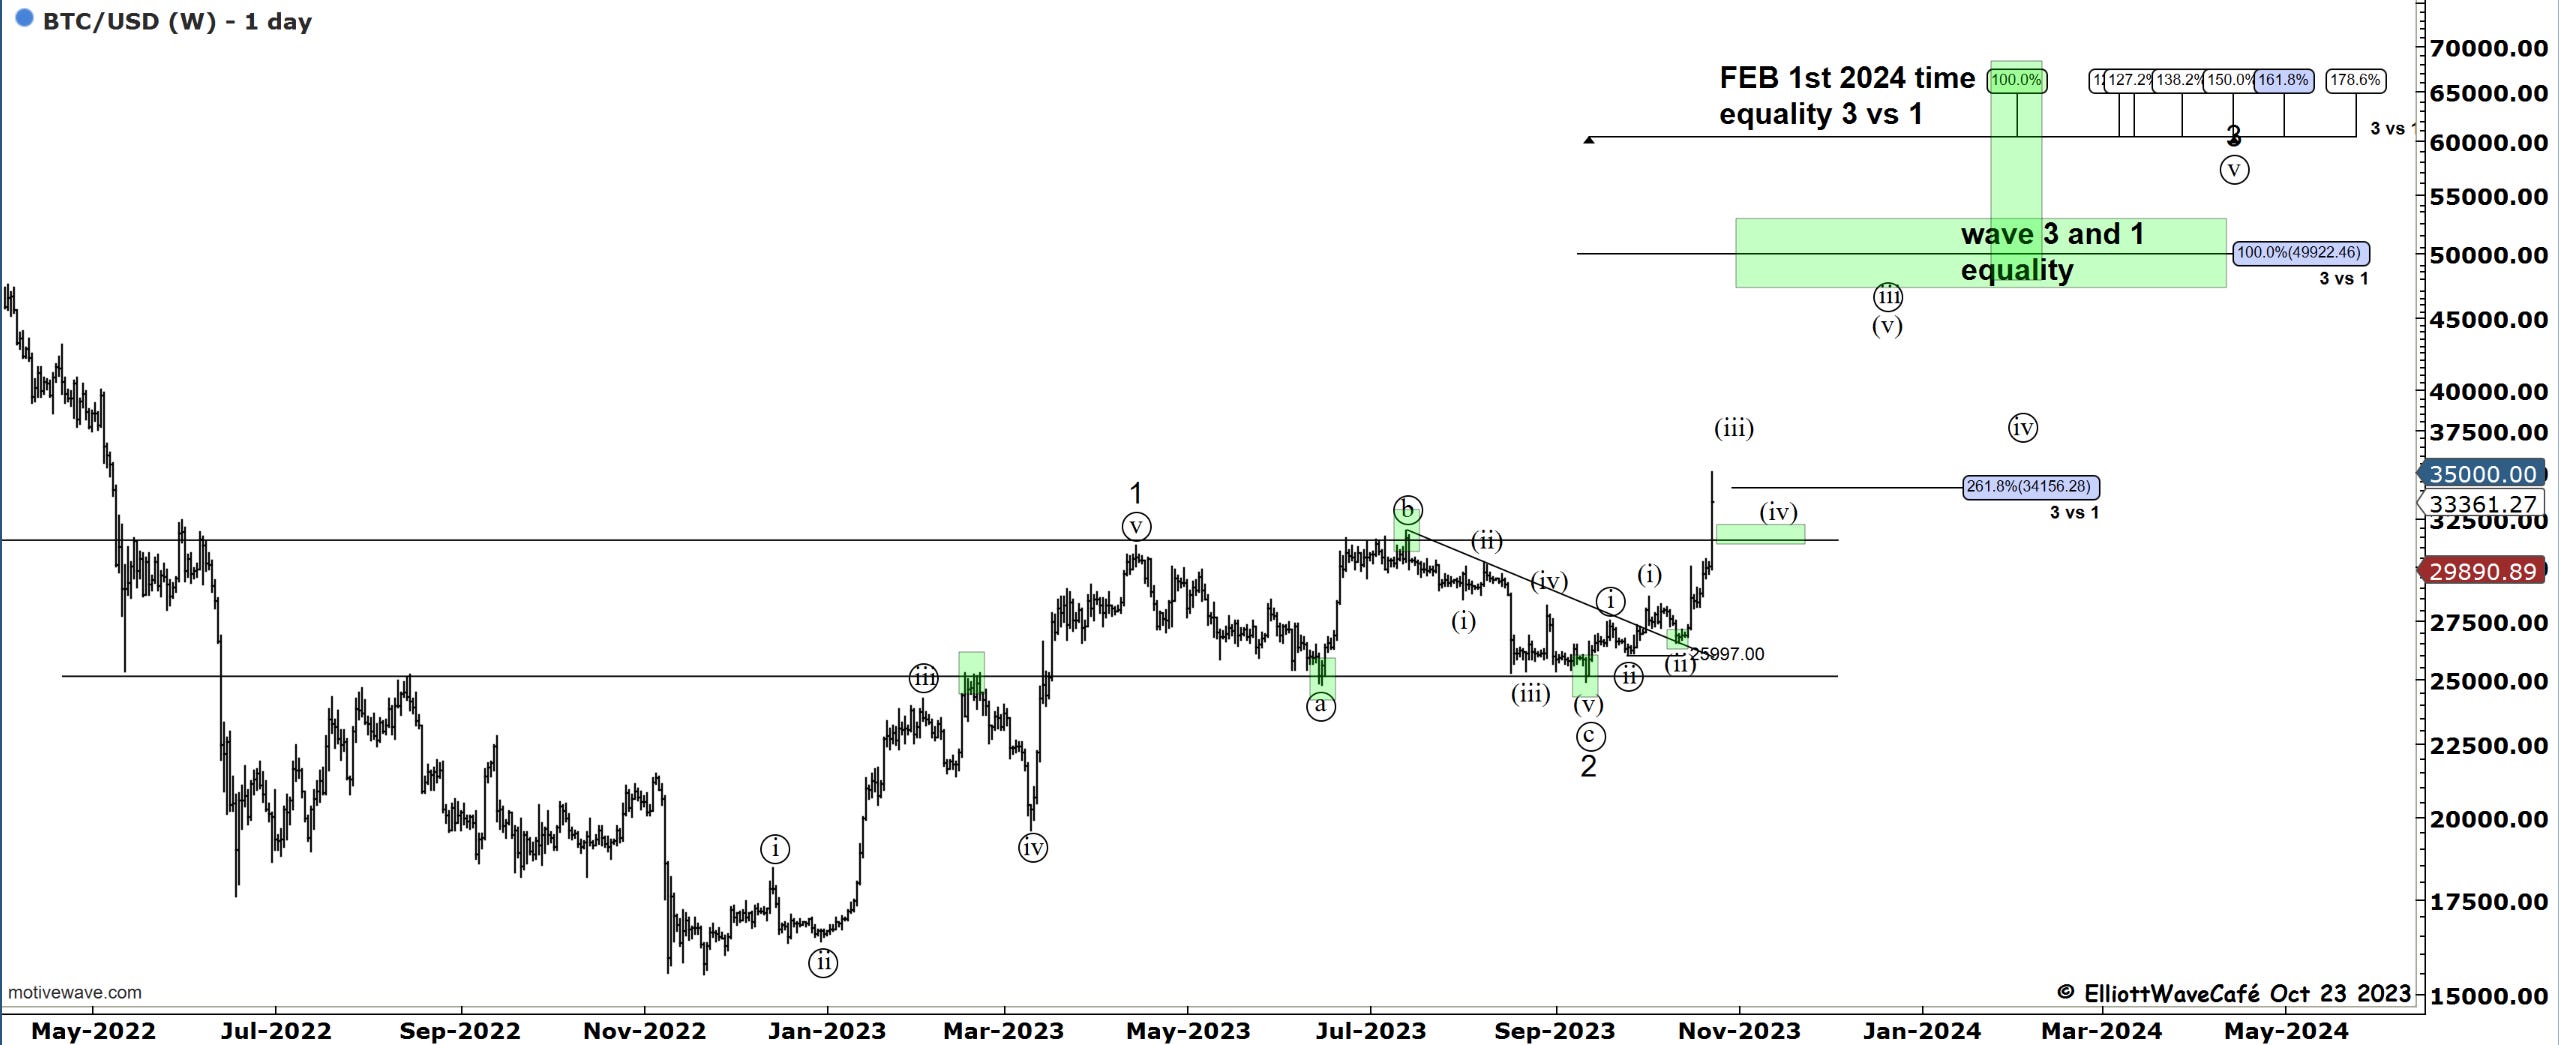
The weekend was met with further sideways action, a totally normal behavior after a strong 3rd wave advance. A brief move higher if it happens, will mark the end of wave (iii). I am considering the option of it being completed and we’re already currently in wave (iv). Both scenarios require further patience until the corrections run their course.
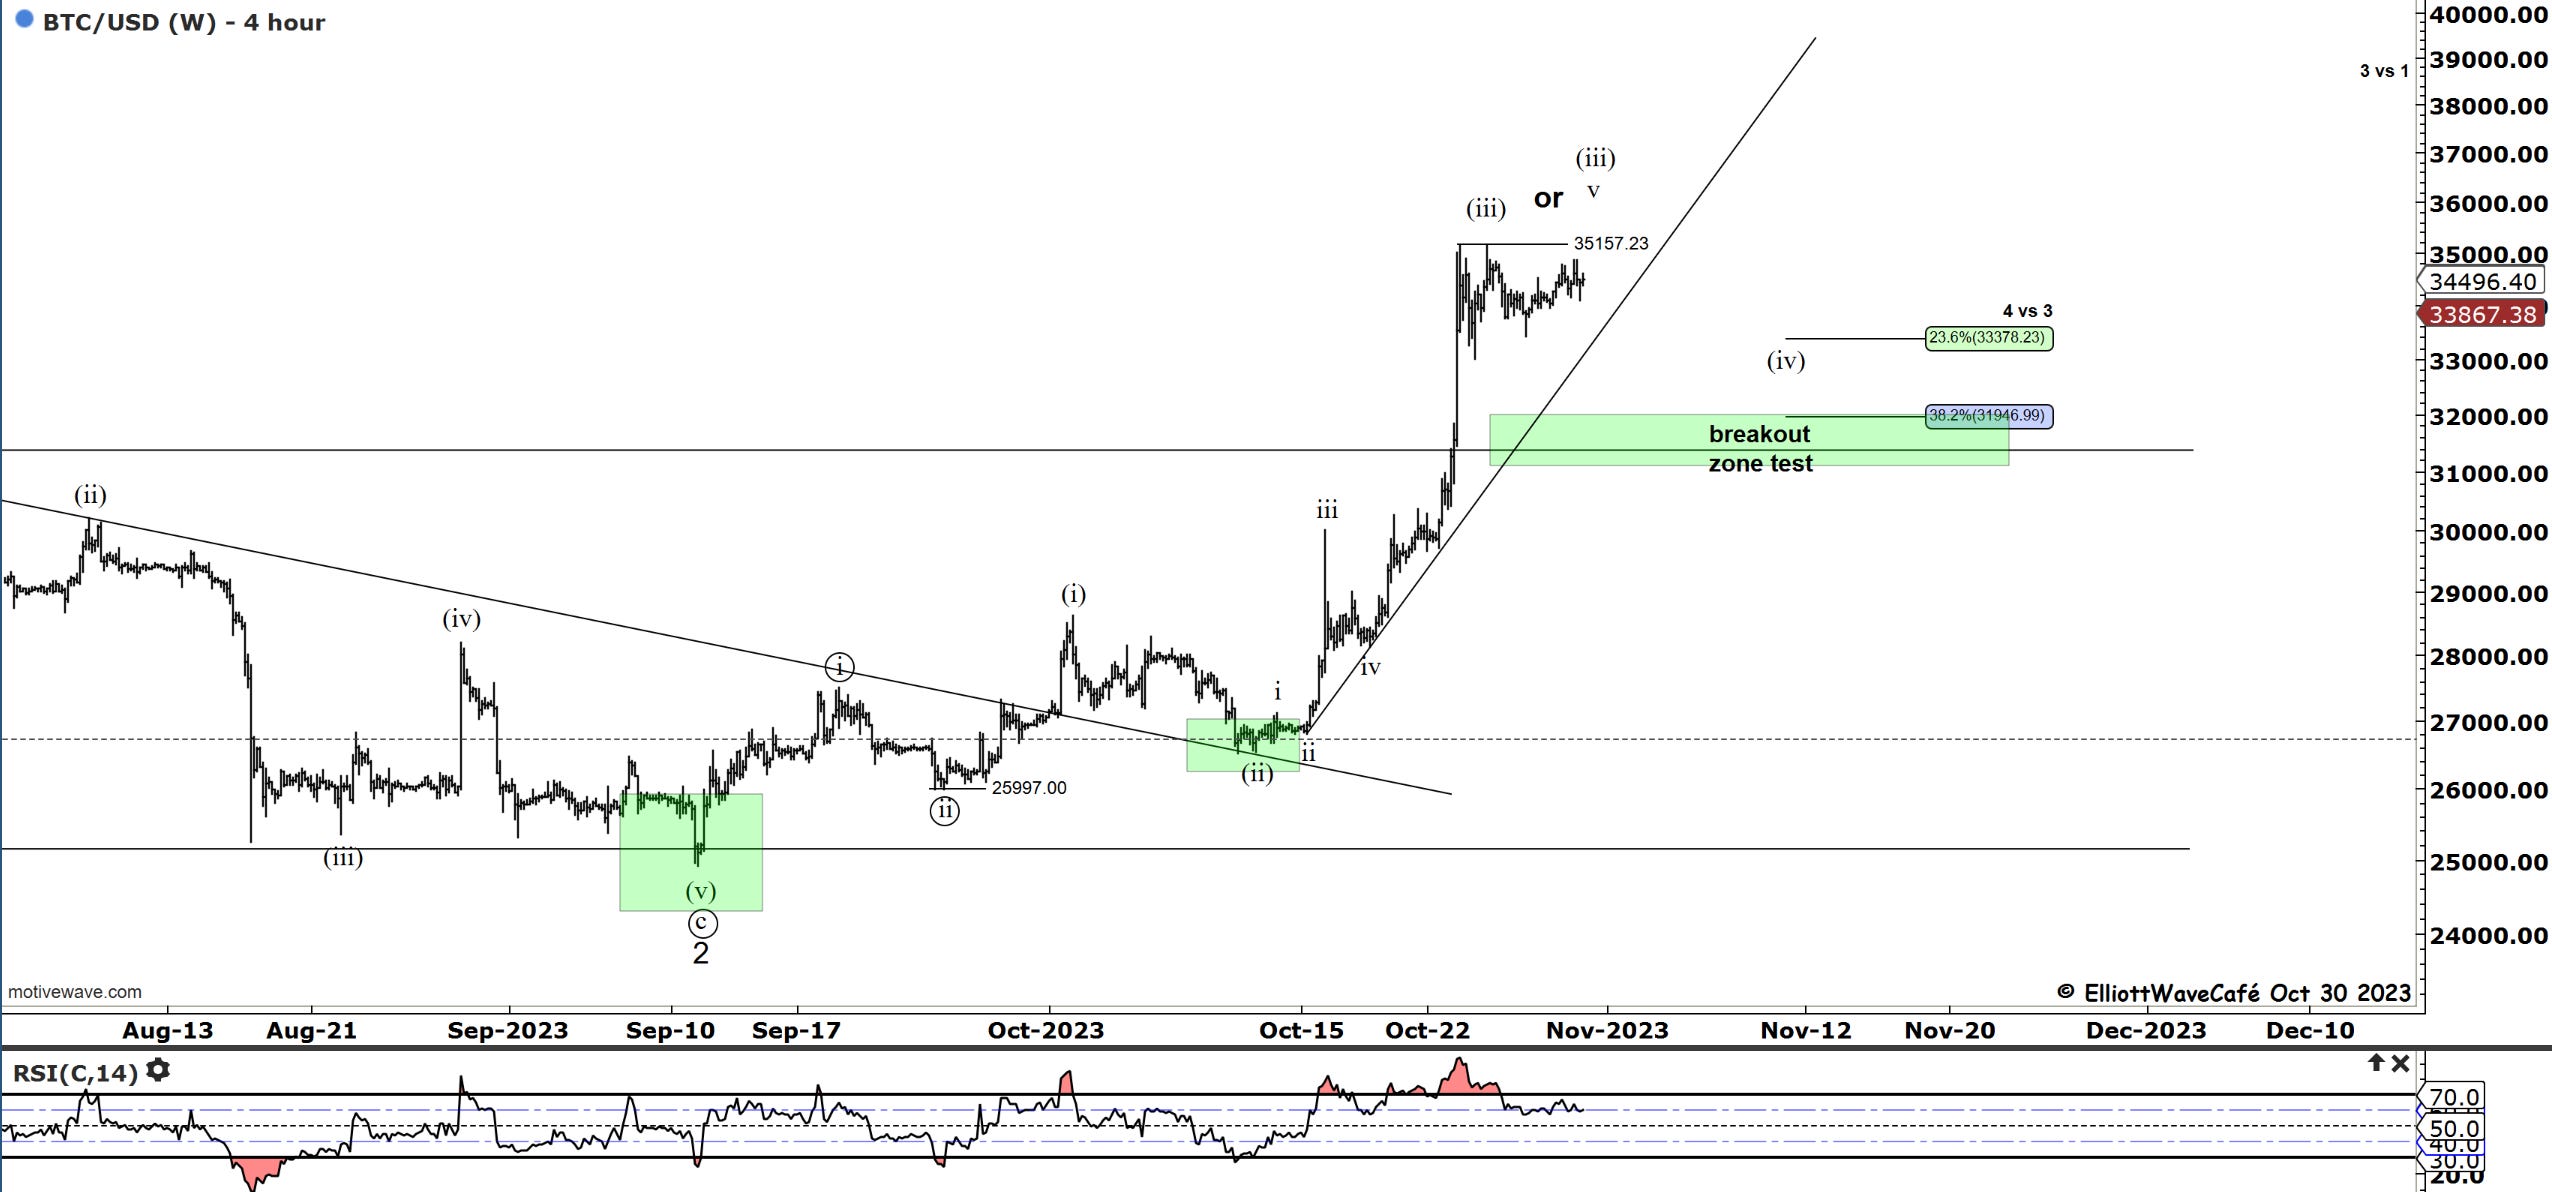
The larger trend is still at hand and will eventually lead BTC towards 50k in the months to come. Remaining above 31k until the next leg higher develops, is very important in maintaining trend confidence.
Daily video coming up next,
See you tomorrow - trade well,
Cris
email: ewcafe@pm.me