
The Daily Drip
Markets review, strategy and analysis
Note: The EW counts on the right edge are real-time, and they are prone to adjustments as price action develops. Elliott Wave has a fluid approach, is evidence-based, and requires constant monitoring of certain thresholds.
In the counts below, this (( )) = circle on chart
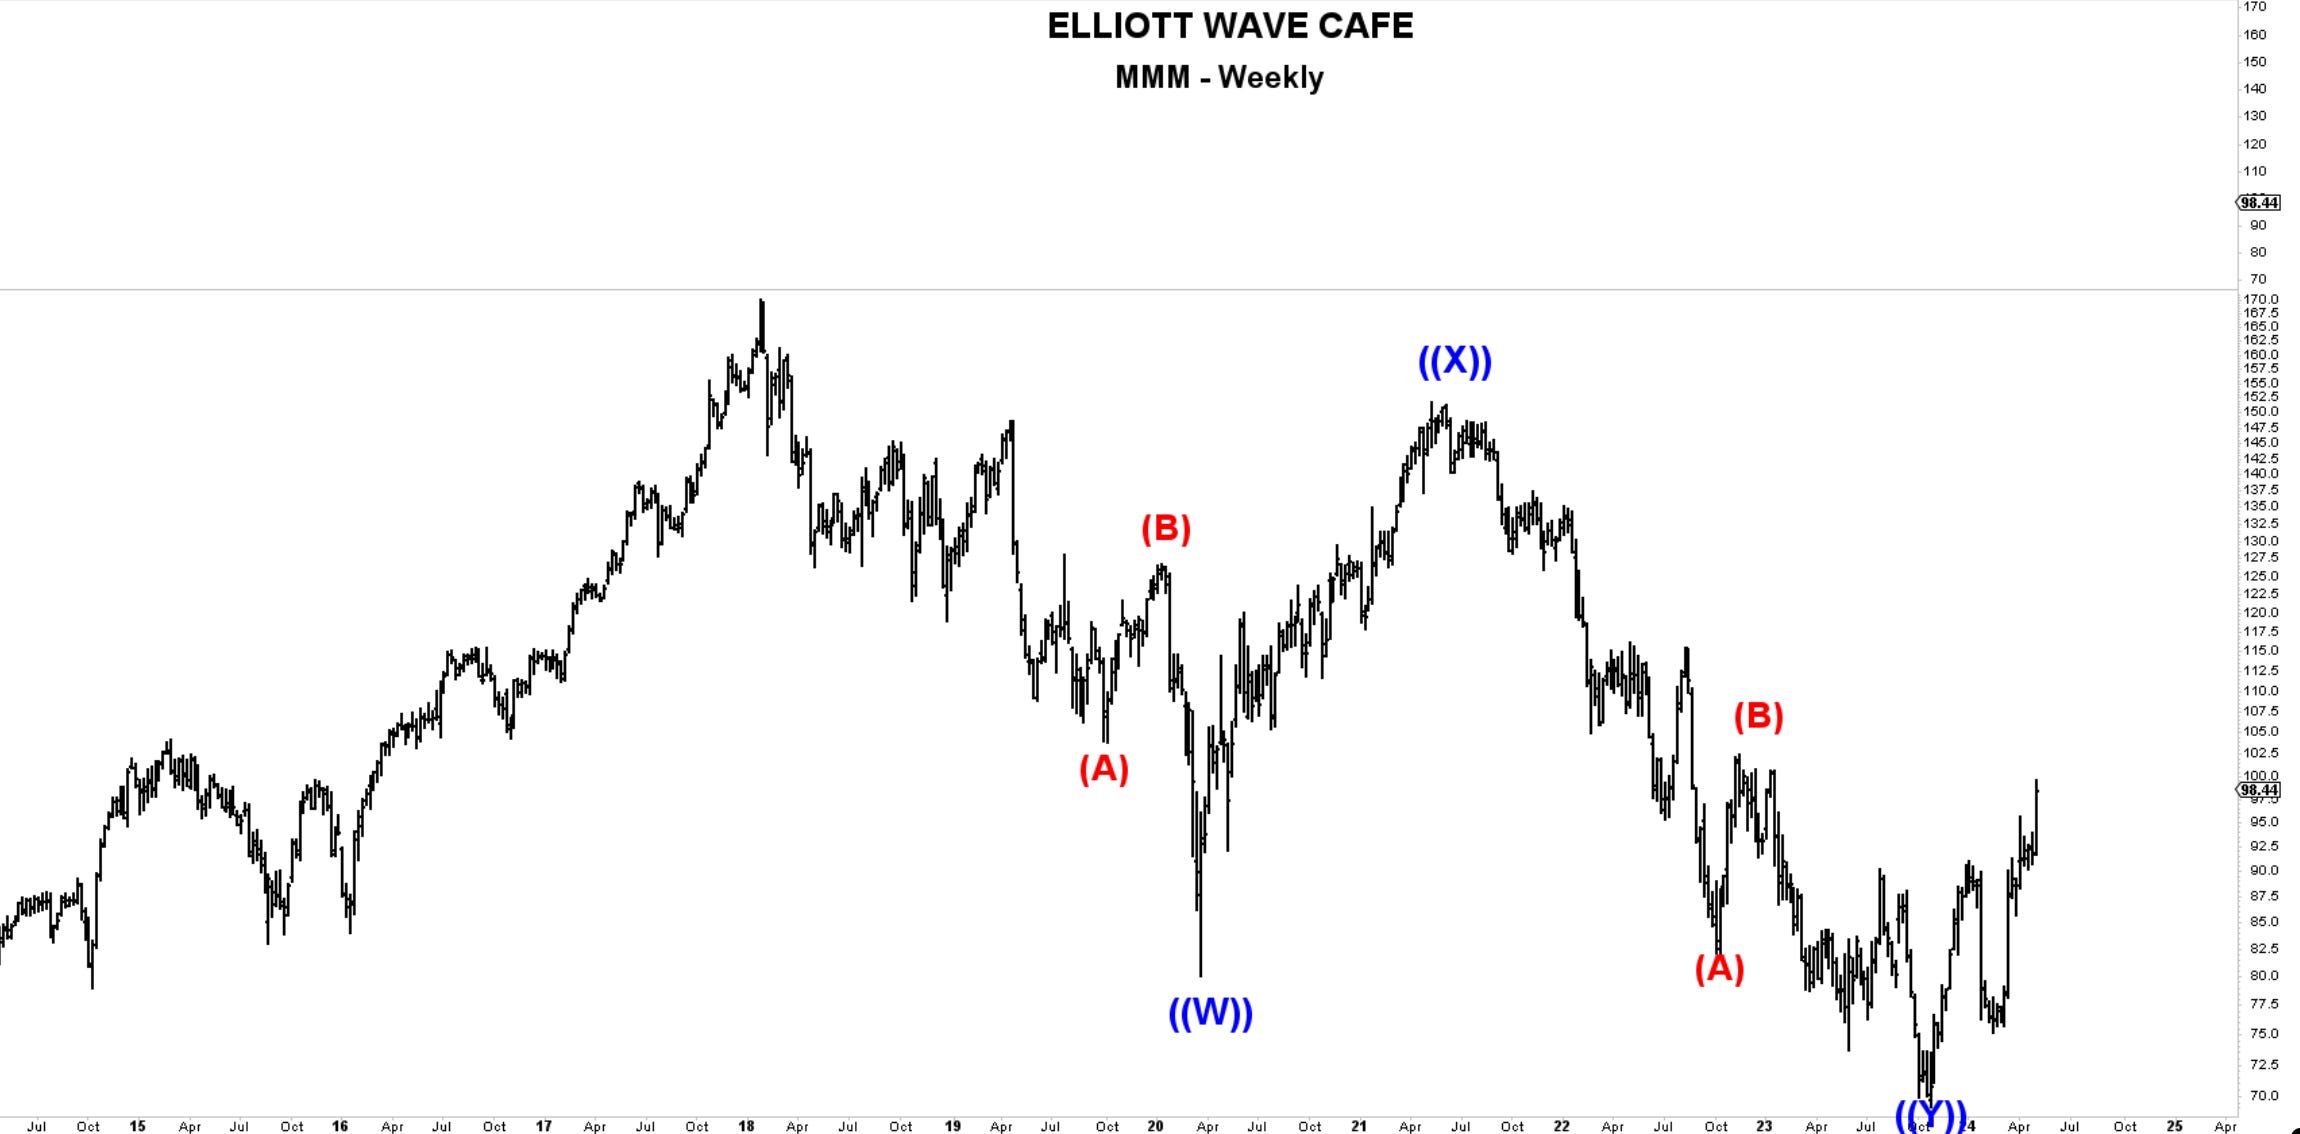
Chart of the Day—MMM— Discussed as Chart of the Day on March 13th, MMM makes the cut once again with the push higher following earnings. The wave count suggests a complex correction has taken place. I would look for higher prices ahead by using 80 as the cutoff level for this time frame.
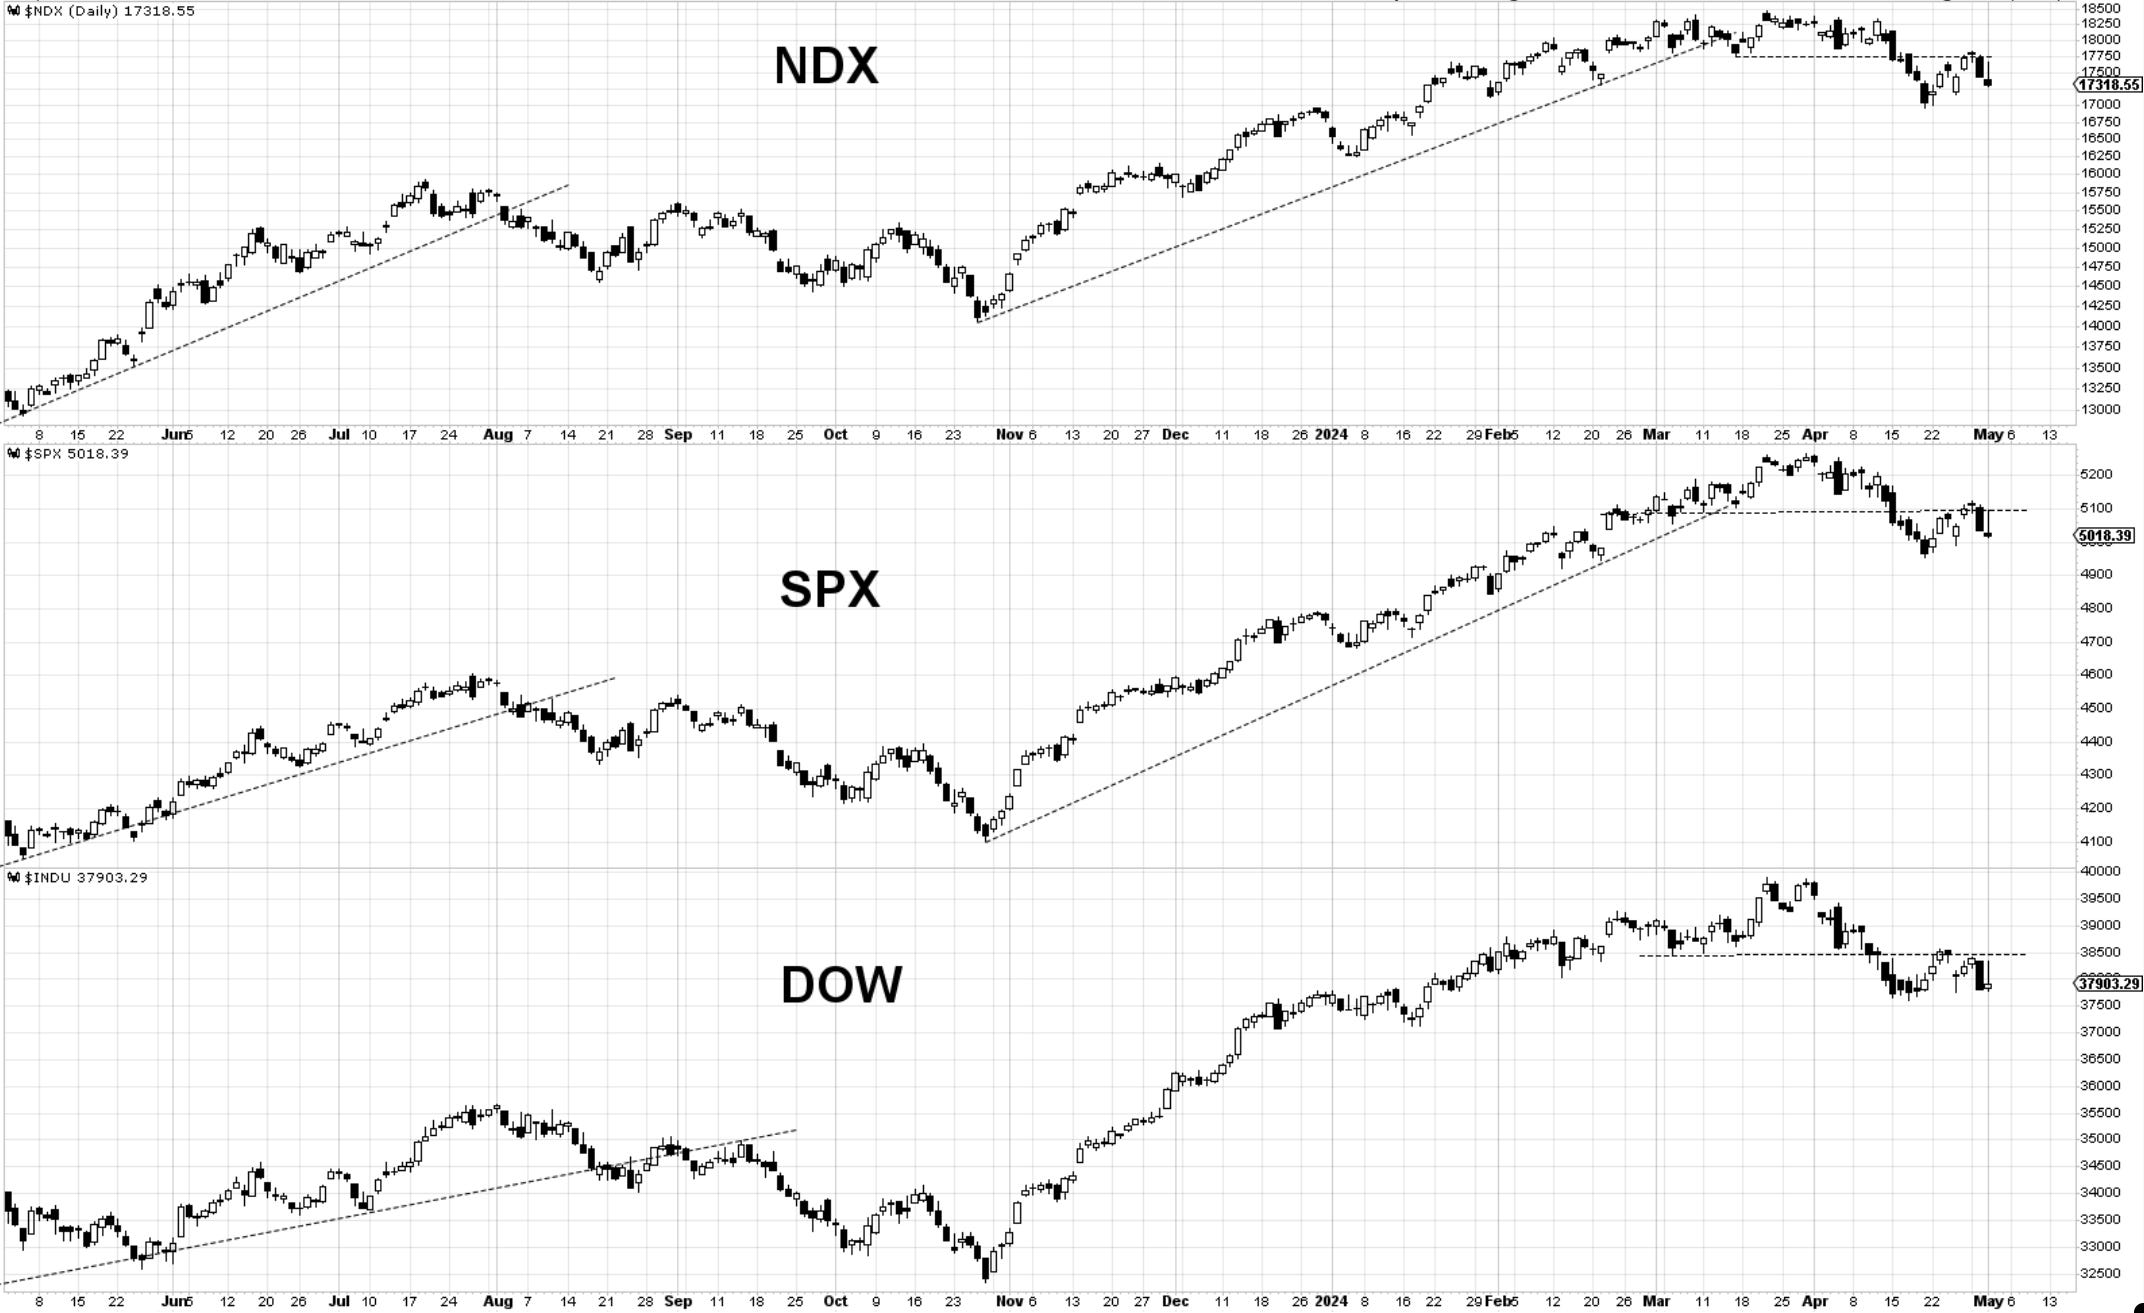
Bottom Line: The market remains in “sell the rally” mode. The FOMC announcement and press conference led to a good rally, but it was met with sellers at the previous zone of resistance. Thus, we closed near the lows, suggesting further weakness could be expected. Unless the price trades above those dotted lines, reduced long exposure remains a priority.
Let’s now dive into charts and further analysis below… then the Double Shot daily video.
