
The Daily Drip
Markets review, strategy and analysis
Note: The EW counts on the right edge are real-time, and they are prone to adjustments as price action develops. Elliott Wave has a fluid approach, is evidence-based, and requires constant monitoring of certain thresholds.
In the counts below, this (( )) = circle on chart
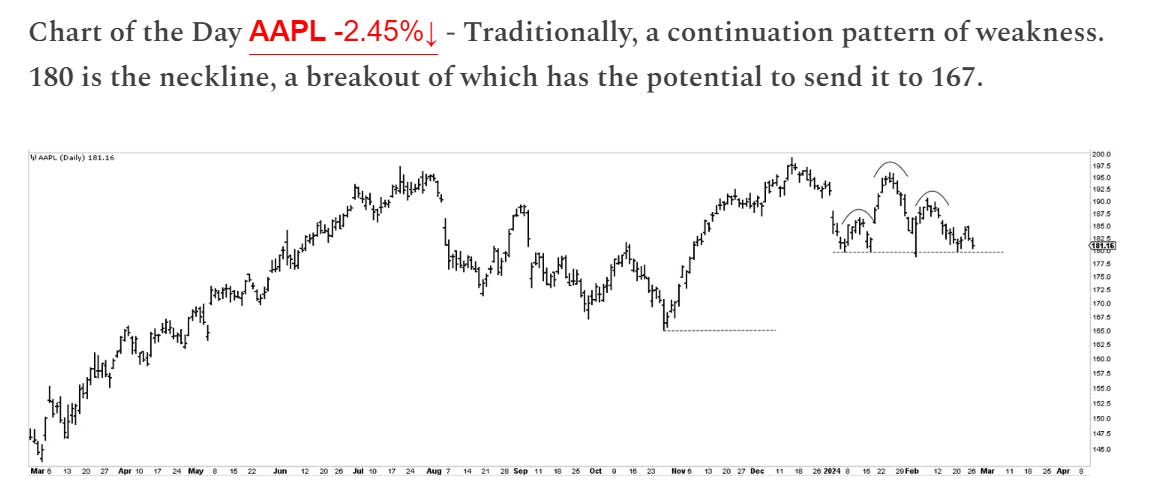
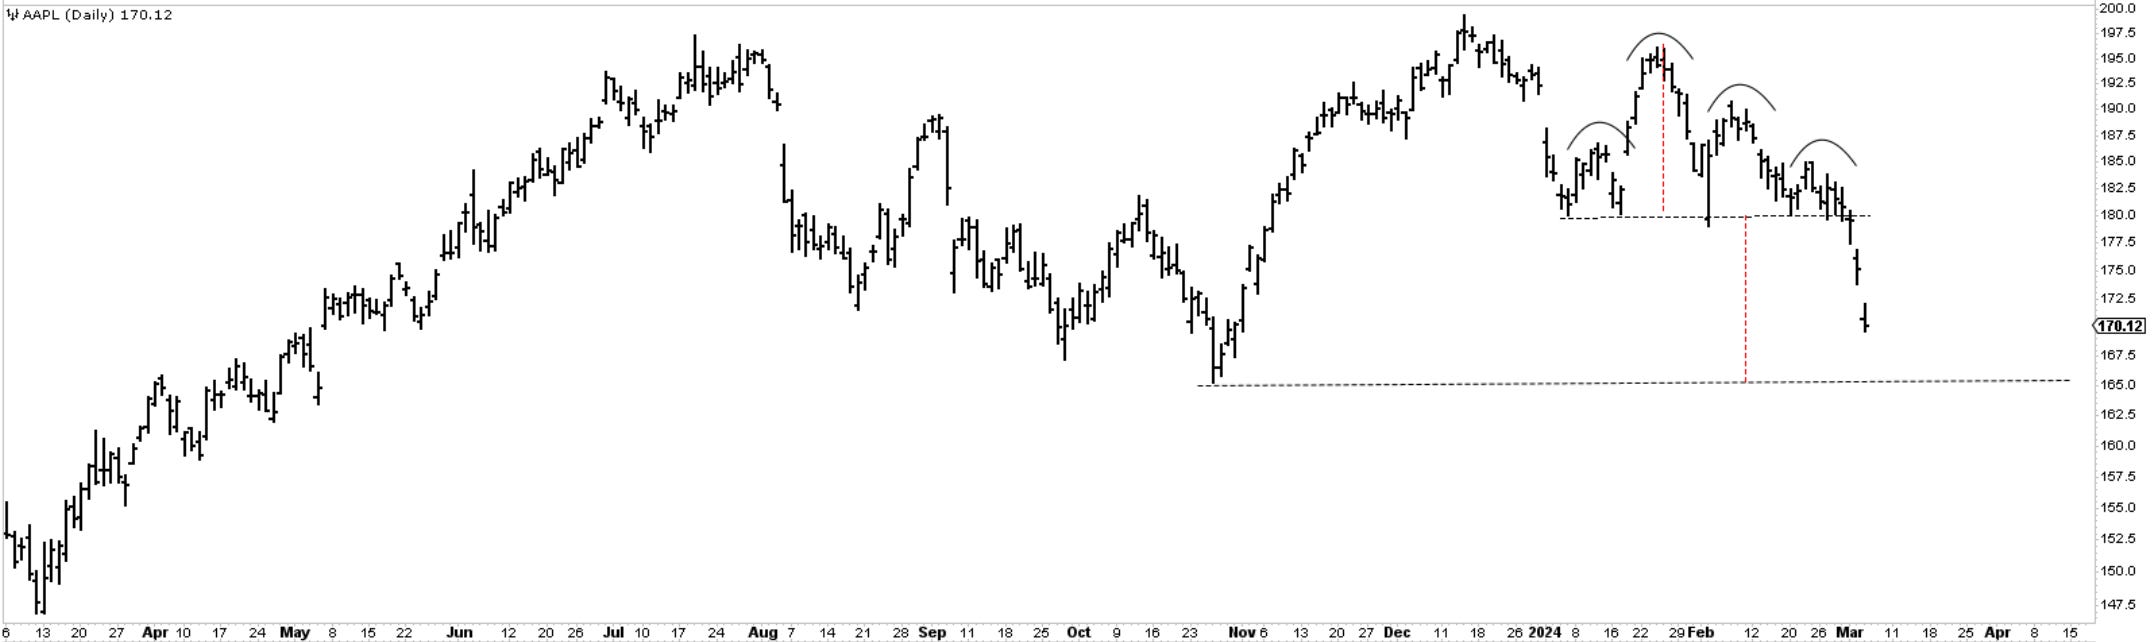
Chart of the Day AAPL - Presented this chart and note on the Feb 26 issue . It hit 169.62 at the lows today showing a simple bearsih pattern in display. 165.24 is the low from Feb 26th. It is likely to get hit over the upcoming sessions.
In yesterday’s note, I mentioned a few things
The active composite cycle of 180,124 and 80 days points to some weakness over the next 6 weeks after failing to respond at the data observed late December and January.
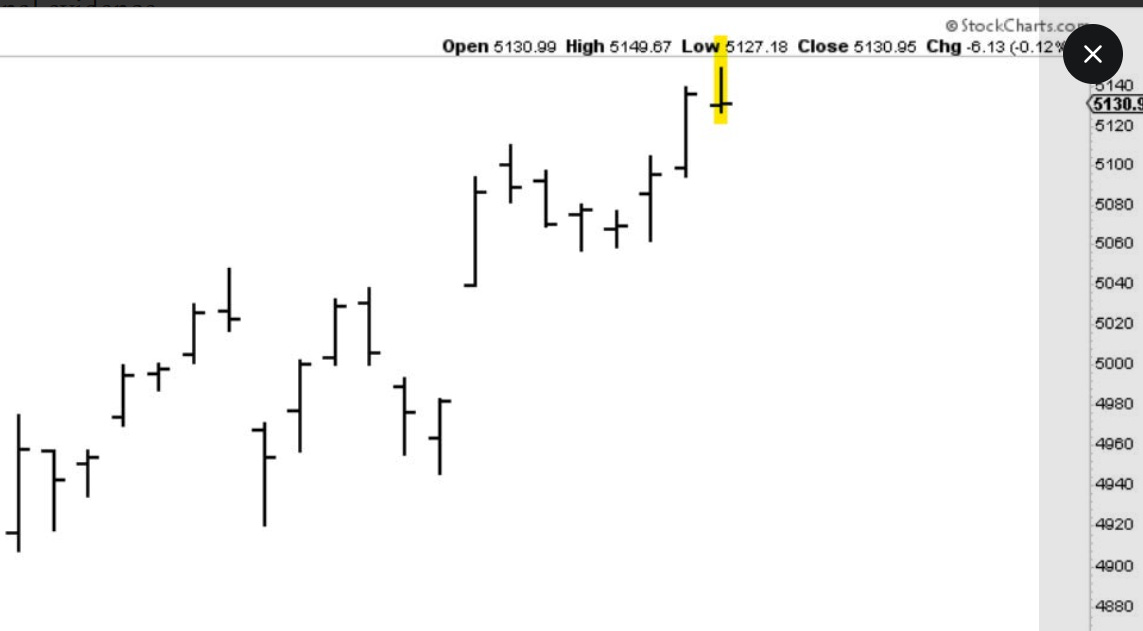
Everytime bears take charge and close lower at the end of the day one must pay attention. The evidence of trend exhaustion is still small, and we need to see more to start thinking a correction is upon us. A break of 5100 would be additional evidence.
Another interesting “caution” signal comes from the DeMark indicators that point to buyer exhaustion on both weekly and daily chart with 13 counts visible on sequential and strict combo.
Head on a swivel here as we’re entering the depths of March after failing to correct during what historically is a weak February.
Will this be the beginning of a larger correction or another place where dip buyers will show up?
I will go over the chart evidence next, but here is the SP500 yesterday and today regarding the second note above referring to bar/candle analysis.

Let’s take a look at the charts below and review SPX, NDX, IWM, DOW, DXY, GOLD, BTC
Daily video following as well…
