
The Daily Drip
Markets review, strategy and analysis
Note: The EW counts on the right edge are real-time, and they are prone to adjustments as price action develops. Elliott Wave has a fluid approach, is evidence-based, and requires constant monitoring of certain thresholds.
In the counts below, this (( )) = circle on chart
This is the last report of the week, have a great weekend! See you Monday.
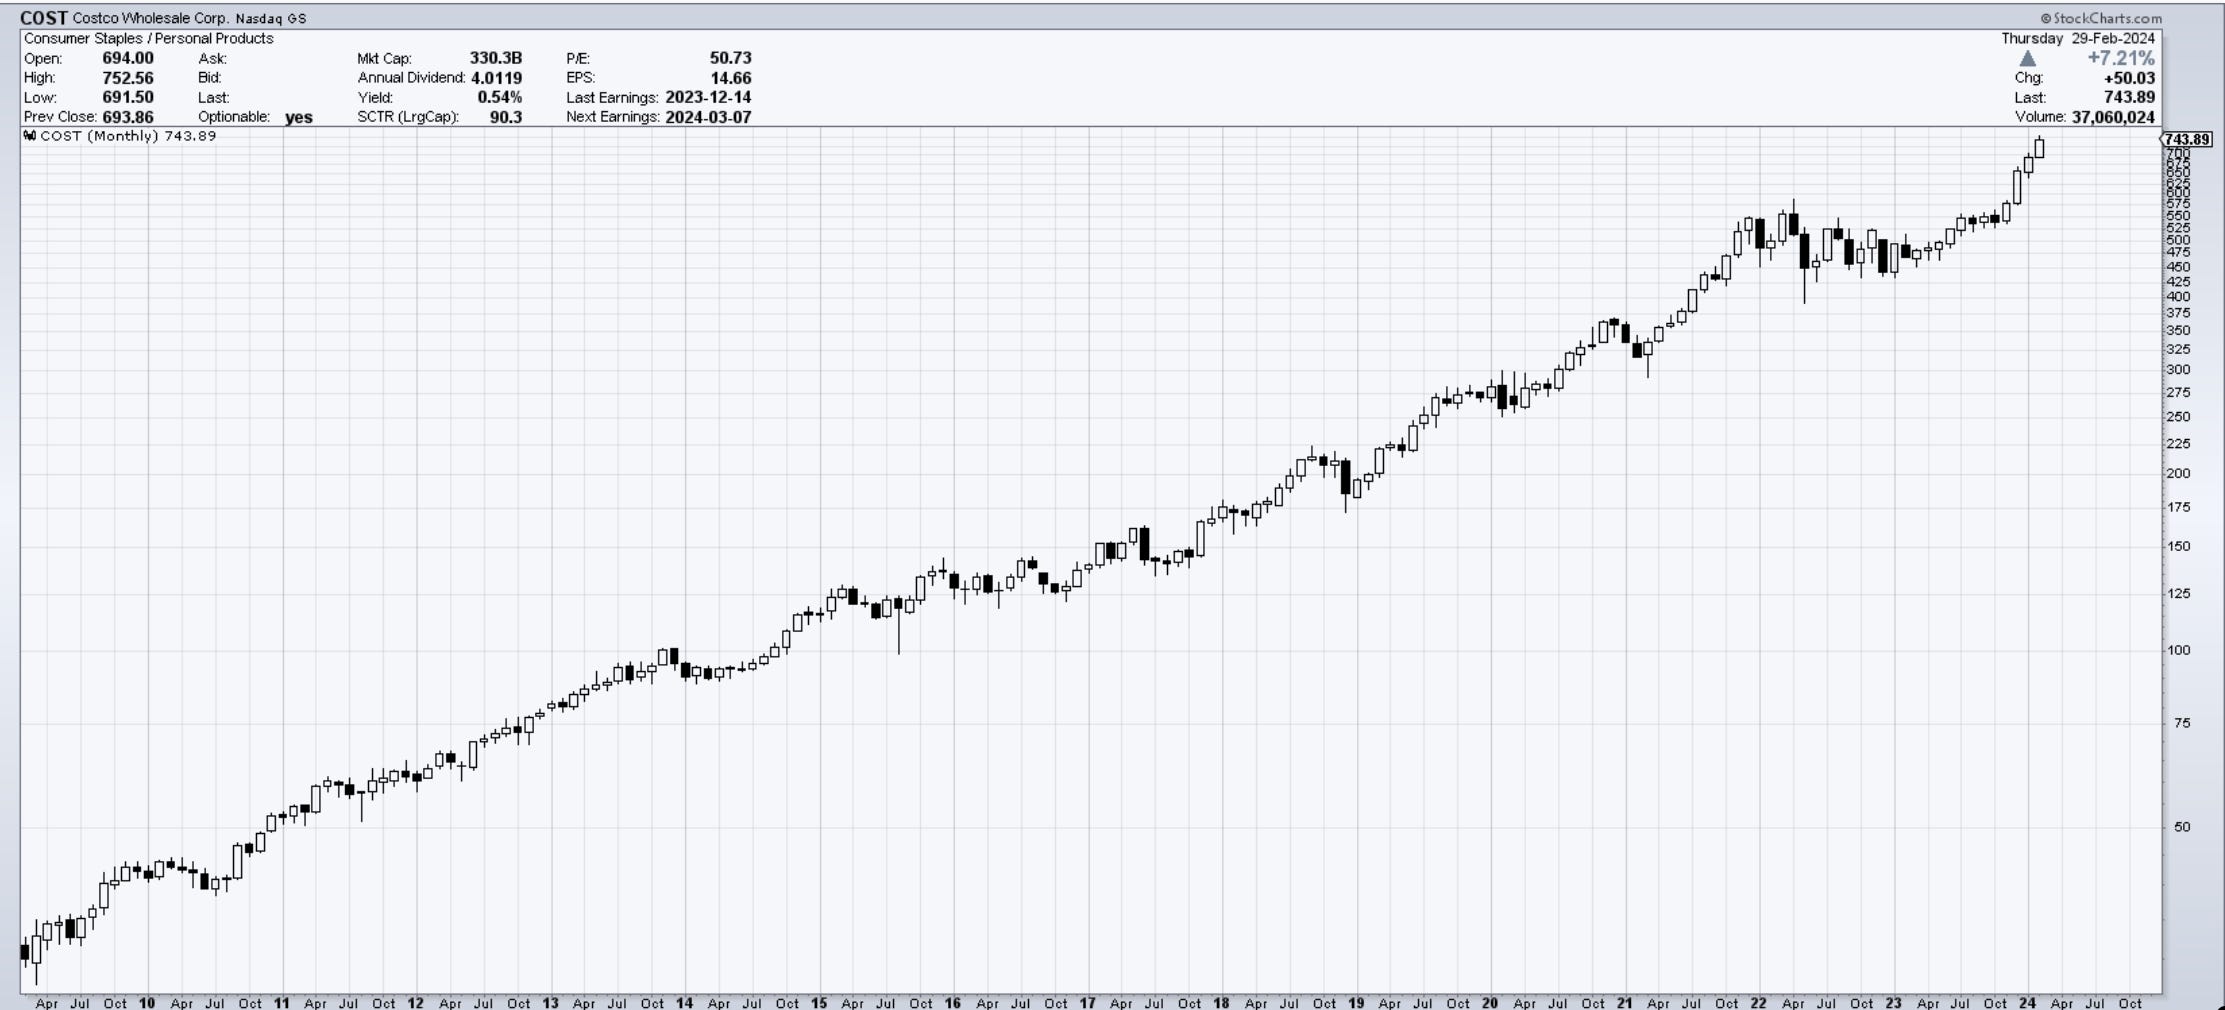
Chart of the Day COST - A simple business model that continues to work. Charge on memberships and sell items at cost. Everyone wins.
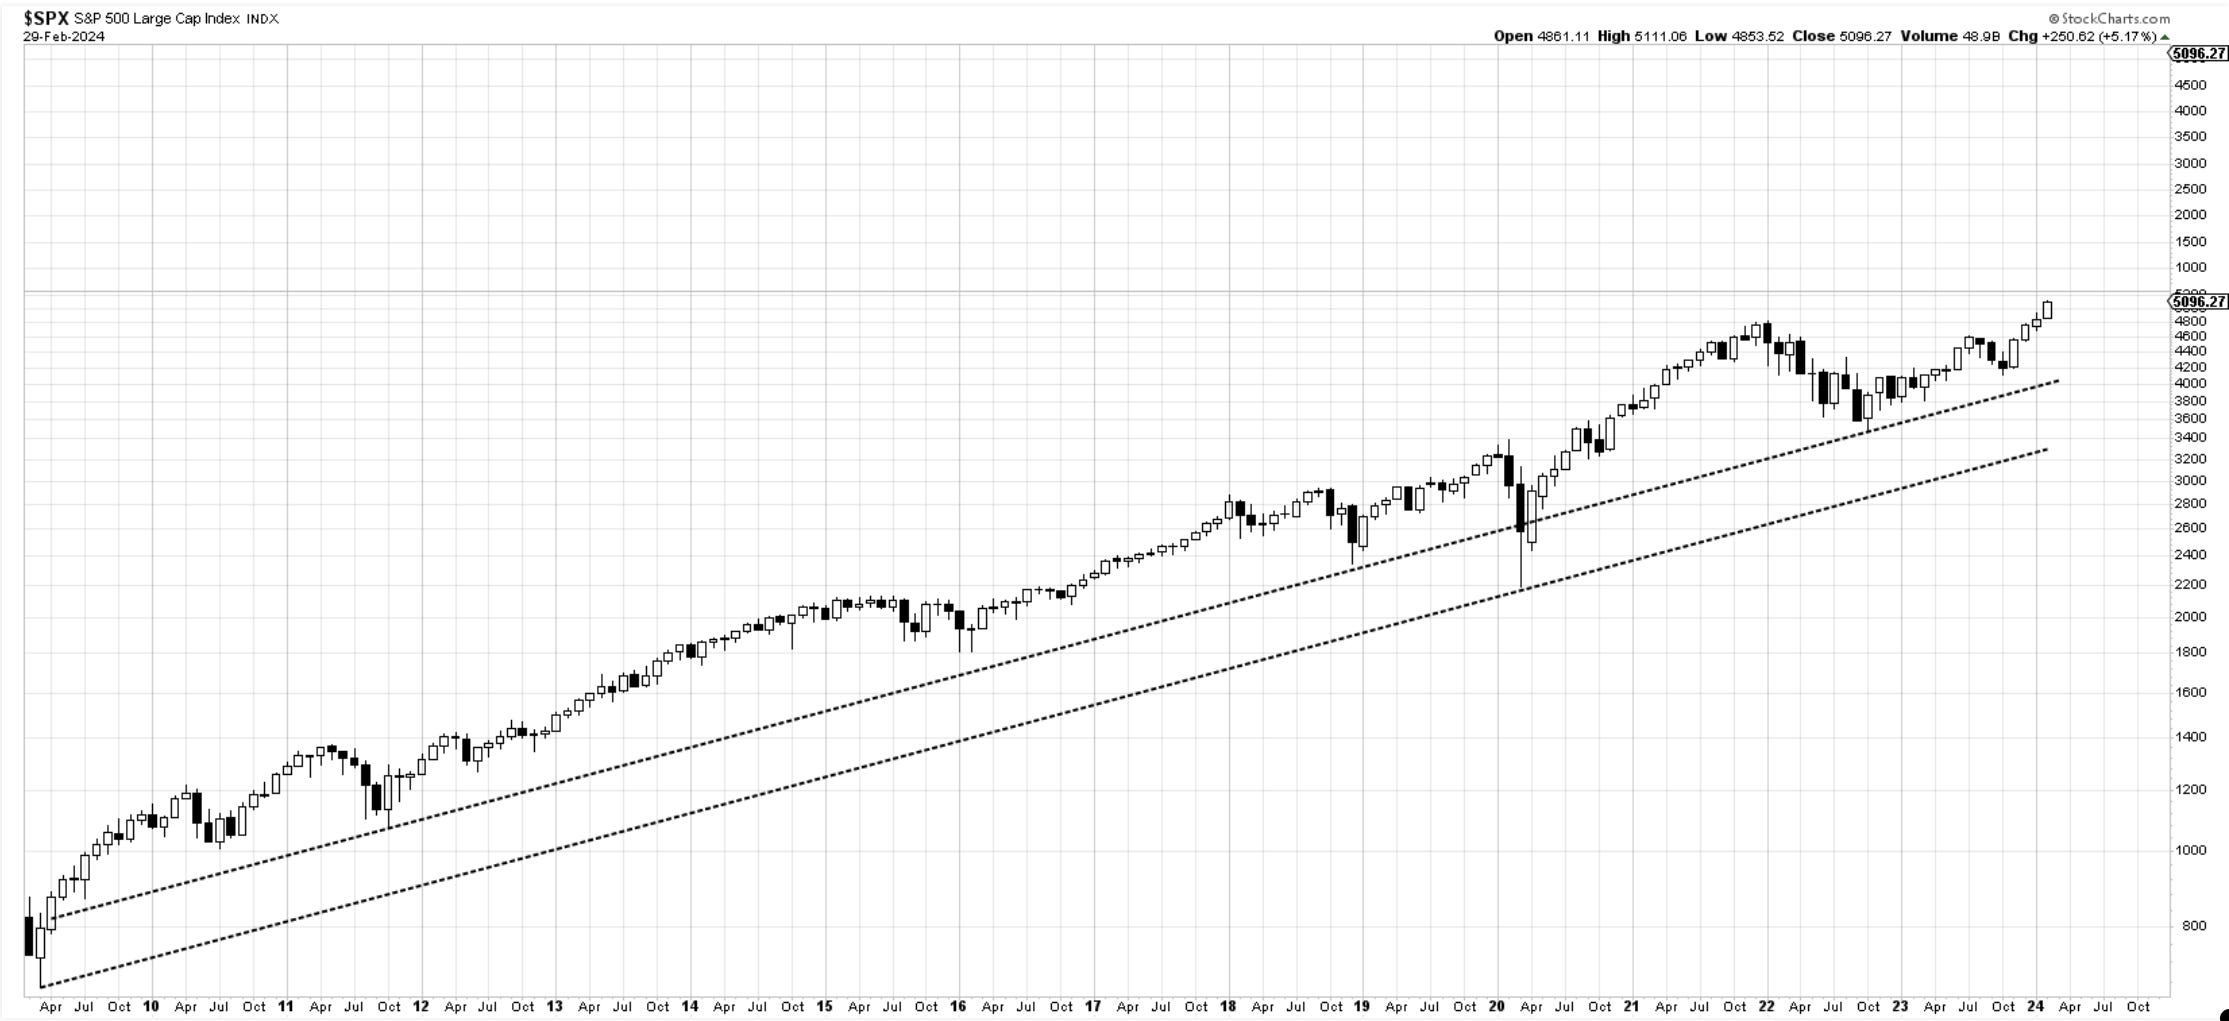
SP500
Let’s take a look at some monthly closes. You can see below the chart of SP500 in a continued uptrend. The bear market of 2022 lasted ten months, and we have now closed a second consecutive month to new all-time highs. Since overtaking the highs from January 2022, we are in a new bull market regime. We have spent four months of higher consecutive closes and closed within 5 points of the high of the current month. This type of price action is encouraging and suggests one must continue to remain invested and look for higher prices. This time frame is not on most trader’s radar. Yet, it provides extremely useful information about the market's direction and which way it is usually moving, from the lower left to the upper right.
Some more amazing monthly charts are below; I have made this newsletter extremely affordable, consider a free 7-day trial to access them…
