
The Daily Drip
Core markets charts updates and commentary
Note: The counts on the right edge are real-time, and they are prone to adjustments as price action develops. Elliott Wave has a fluid approach, is evidence-based, and requires constant monitoring of certain thresholds.
In the counts below, this (( )) = circle on chart
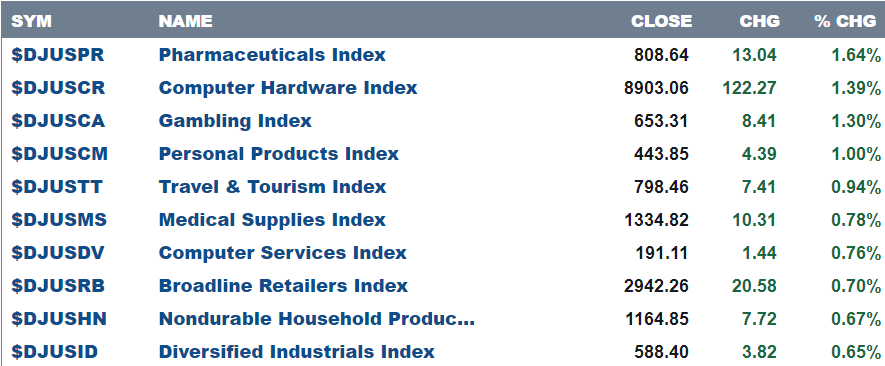
Here are today’s top 10 best performers out of 104 industries.
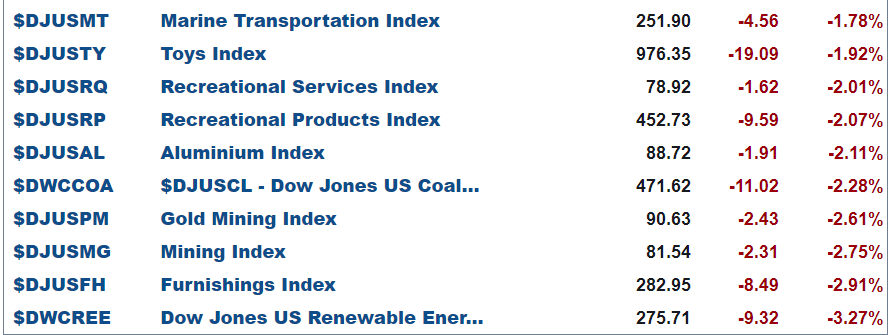
and bottom 10 …
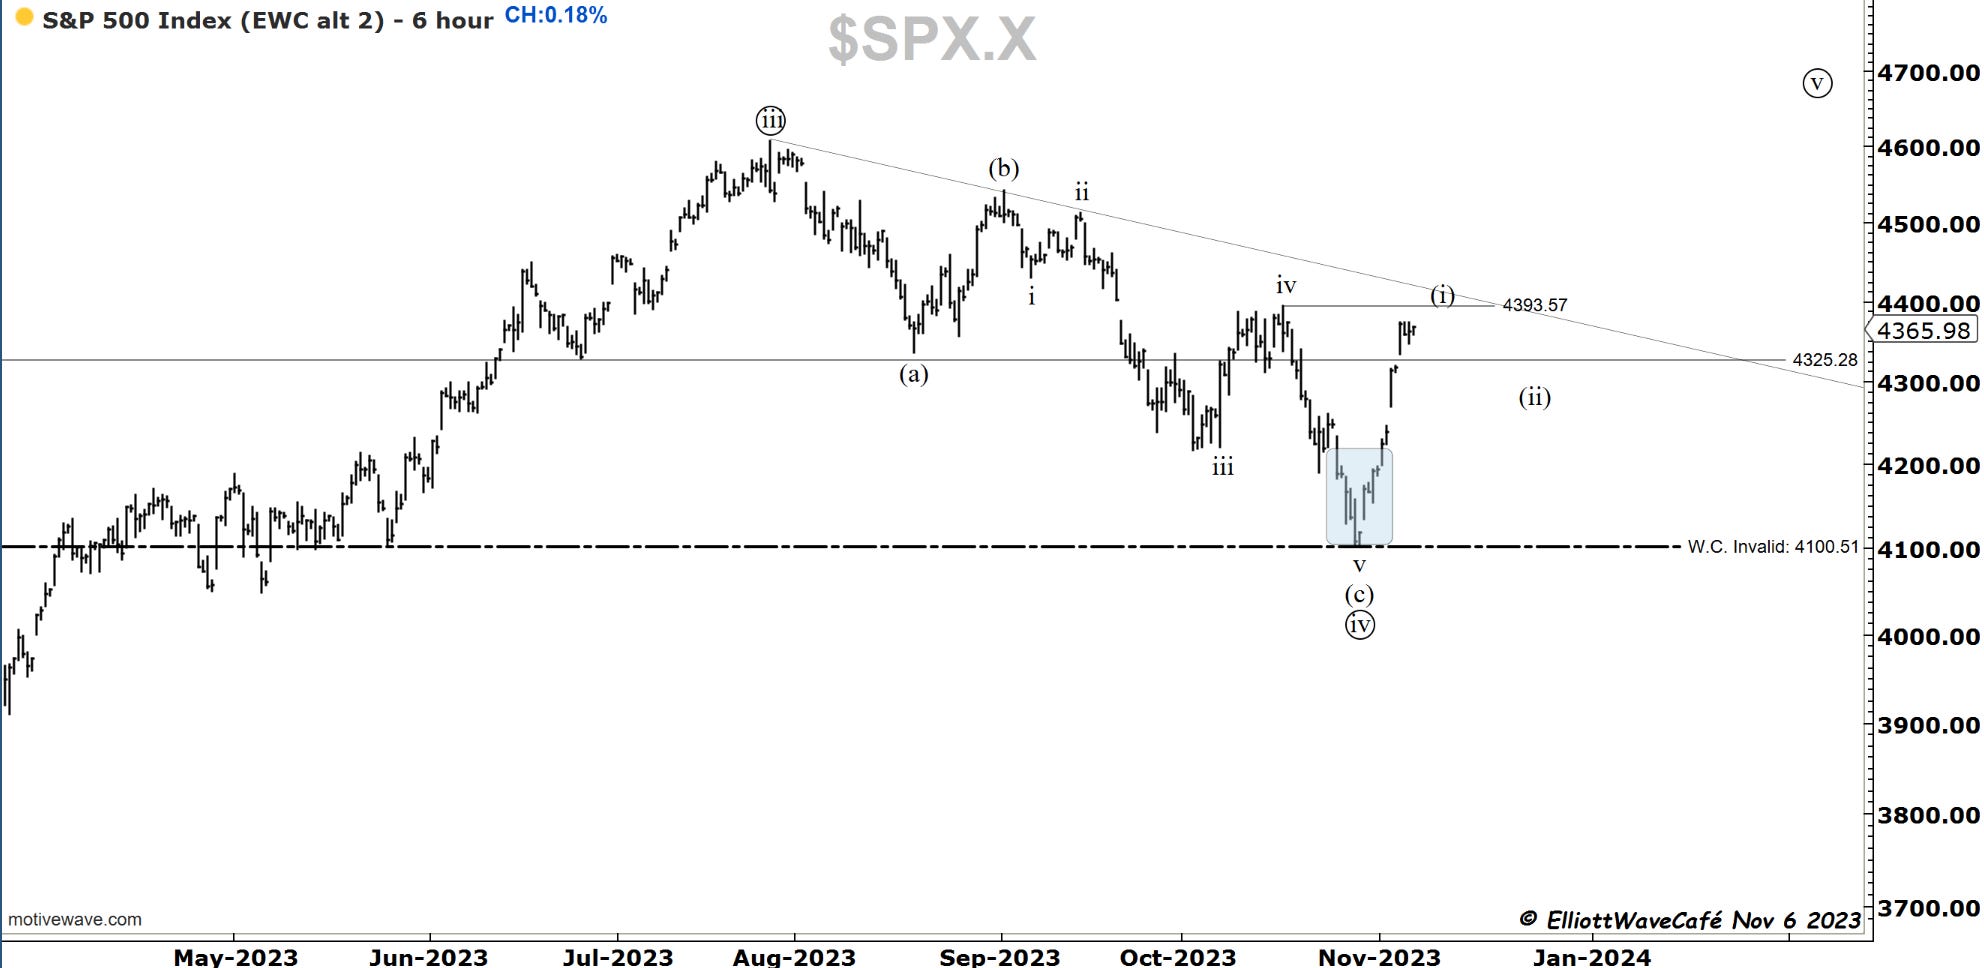
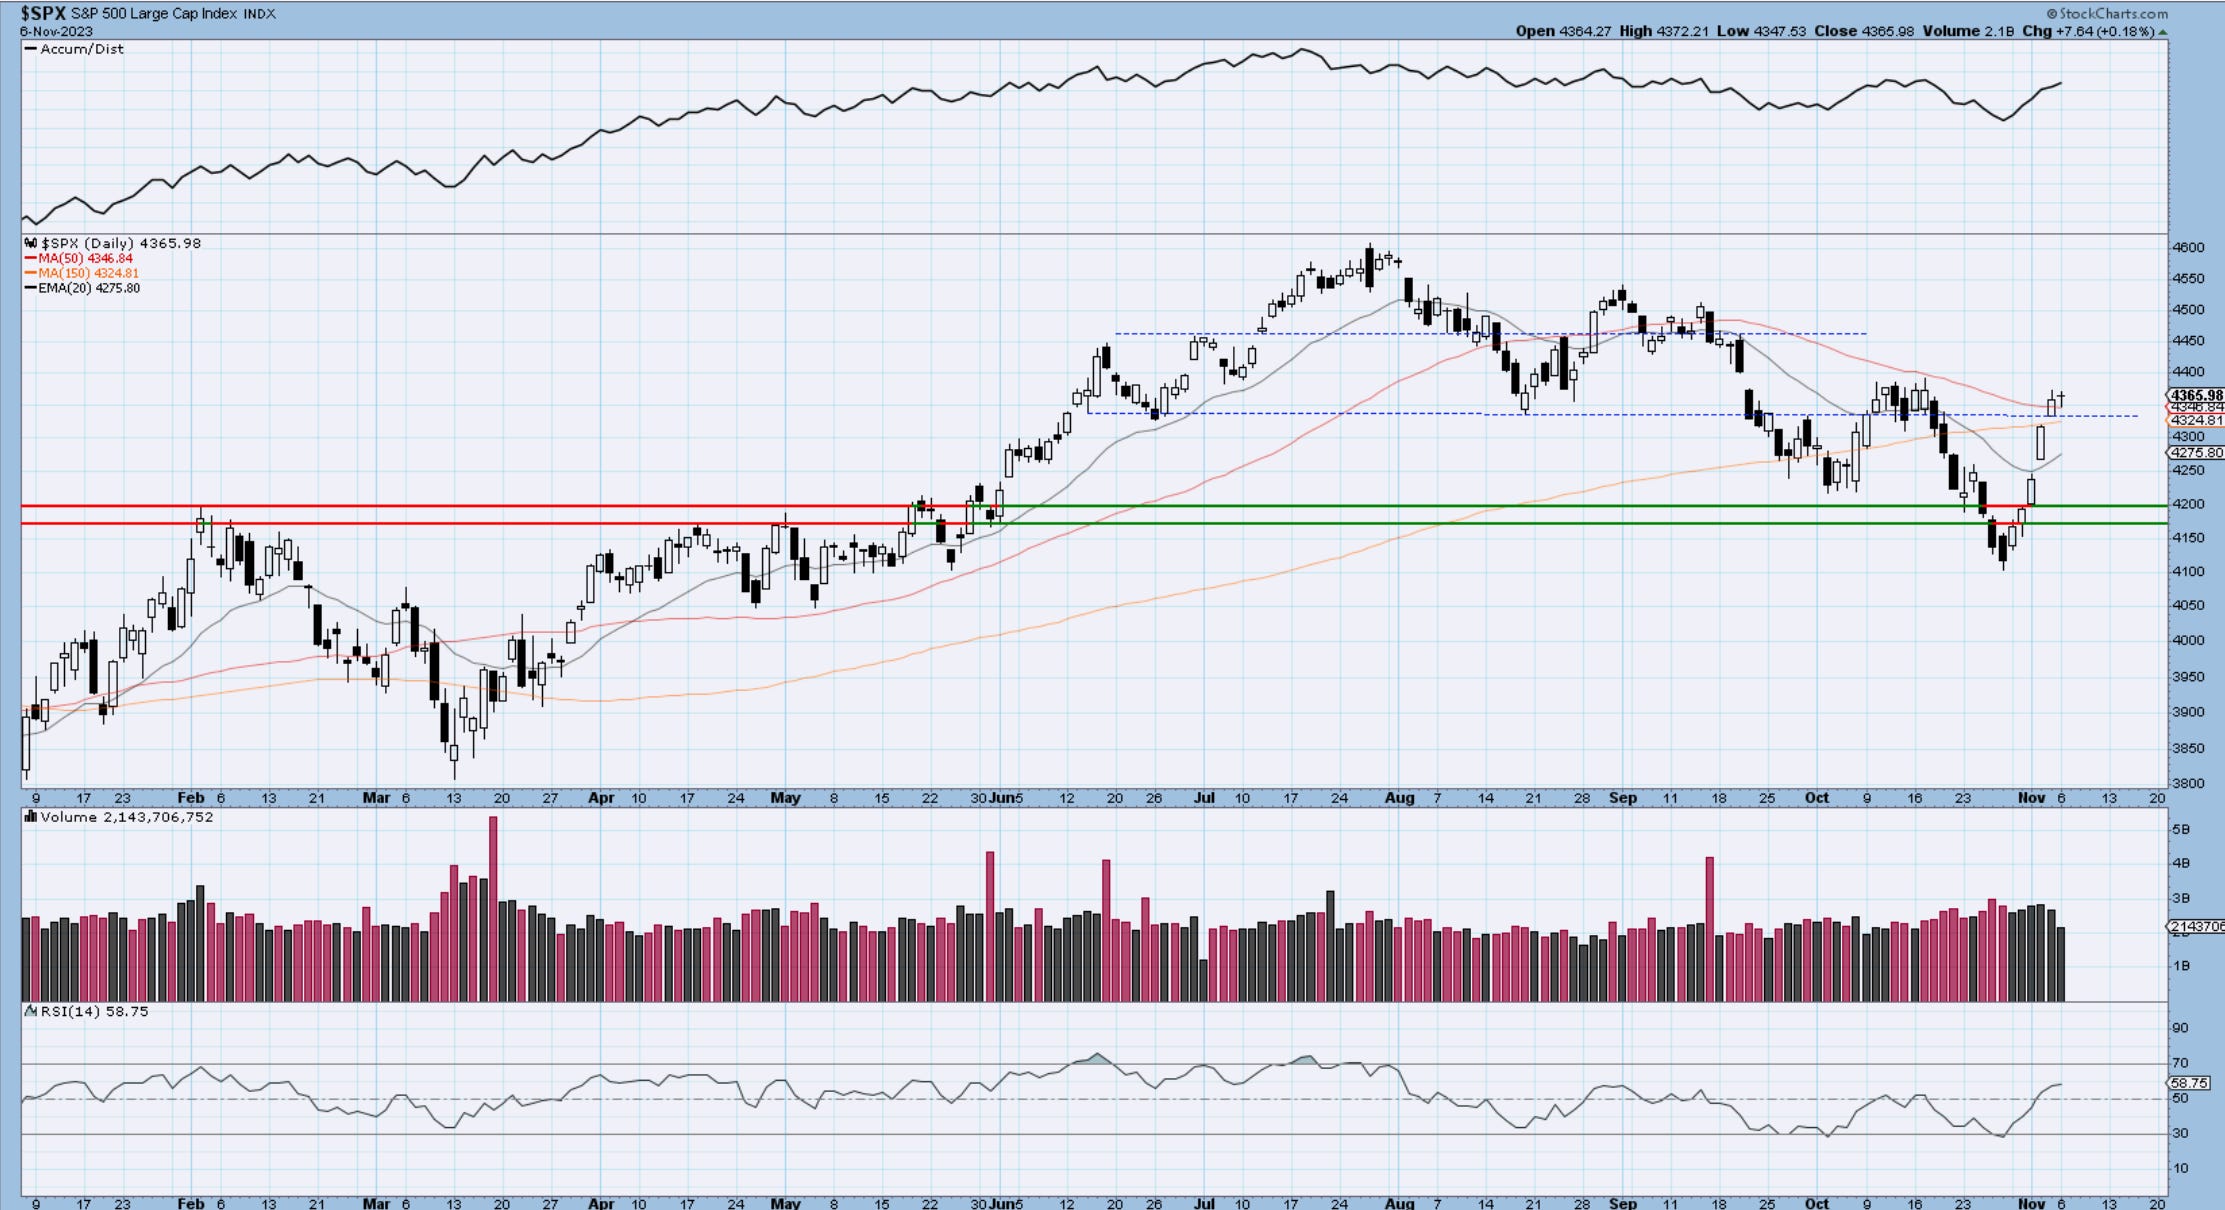
SP500
After an outstanding week to start the month of November, the indices are starting to cool off. It is to be expected after multiple gaps higher. We are approaching the previous wave iv high and the declining trendline. We’re also toying with a declining 50-day MA. Put in the mix the fact that we’re in a 4th wave at a smaller degree, a declining volume on rallies, a NYSE with more declining than advancing today and we have a cocktail for a deeper retracement, maybe after one more quick push higher.
I am rarely a fan of waves (i) being so sharp, and I tend to be skeptical, but I will give it the benefit of the doubt and look for a 3-wave setback to confirm the setup. We were coming off some rather extreme bearish positions at the end of October and elevated fears. The sharp rally cleared some of that sentiment, and we’re probably back to neutral, if not slightly too bullish. This also needs to be corrected. I see a couple of weeks where we could get some churn, back and fills, and corrections, followed by another thrust higher into the end of November or early December. I will be looking to step on the gas once again if a wave (ii) presents itself.
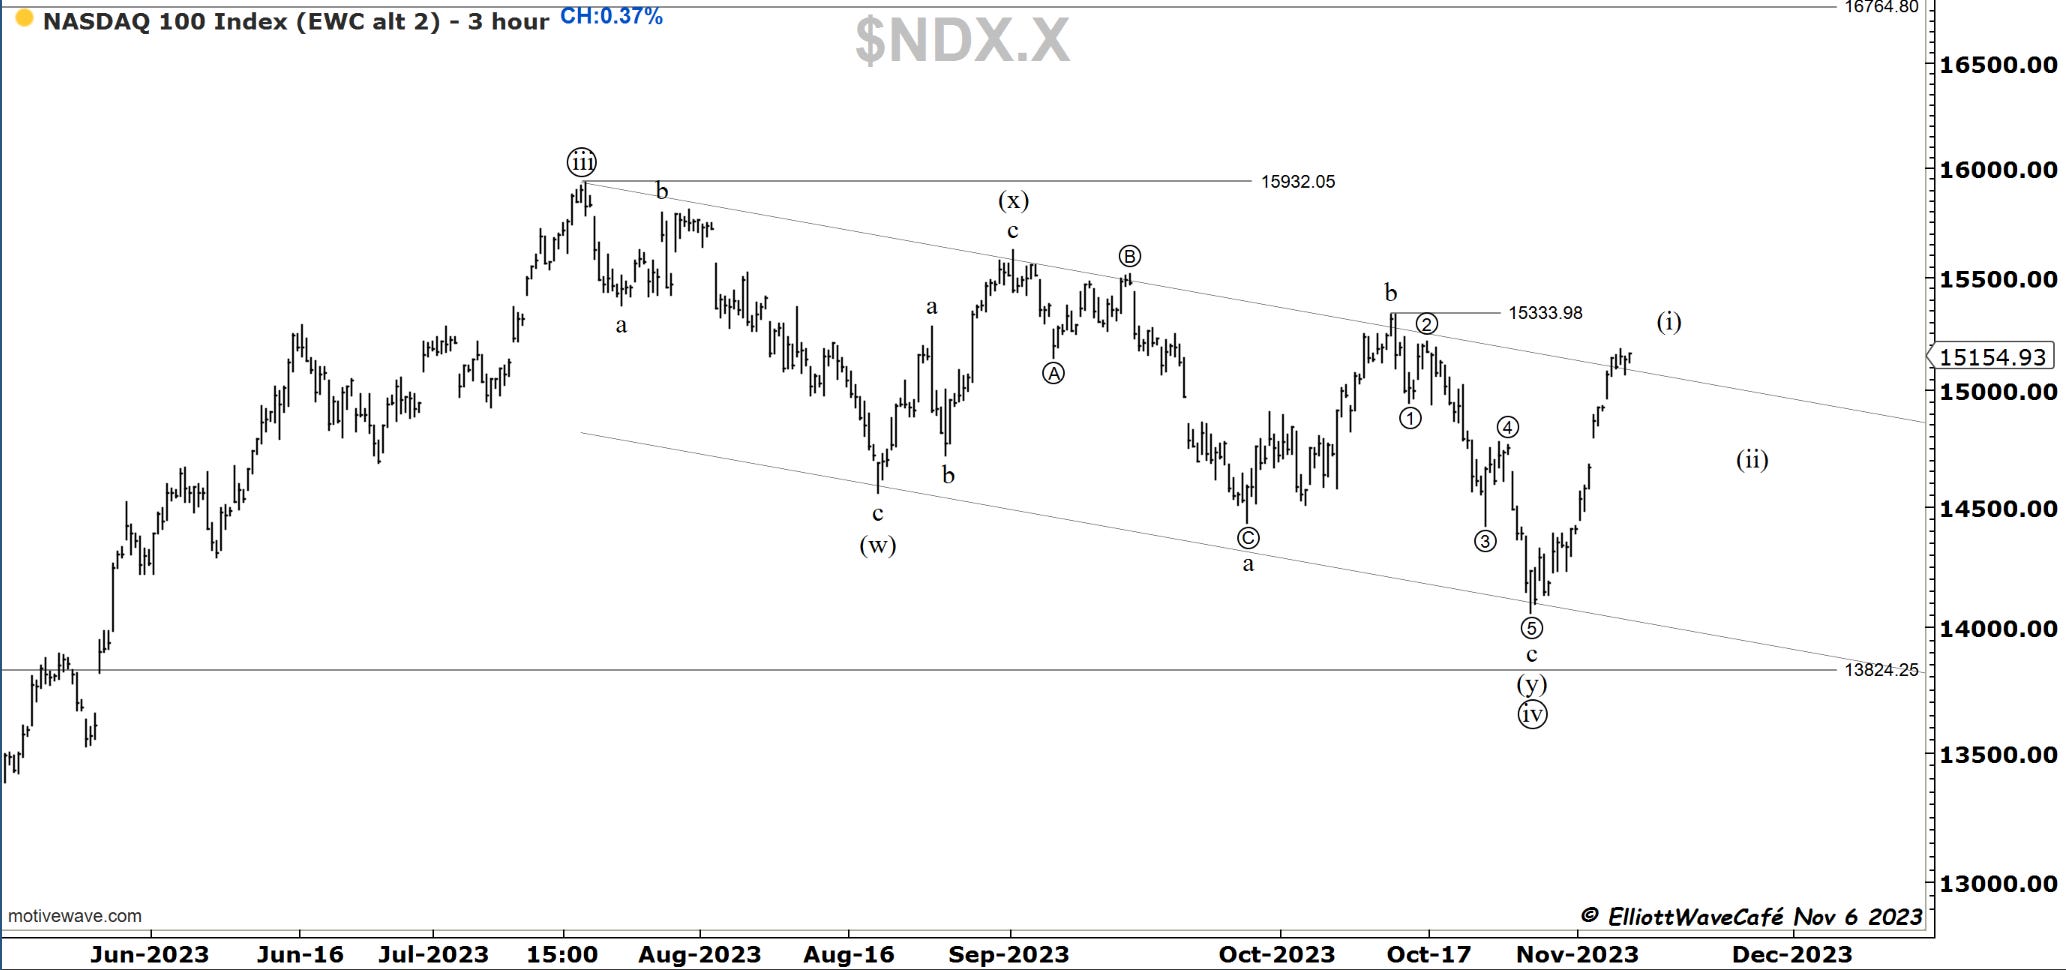
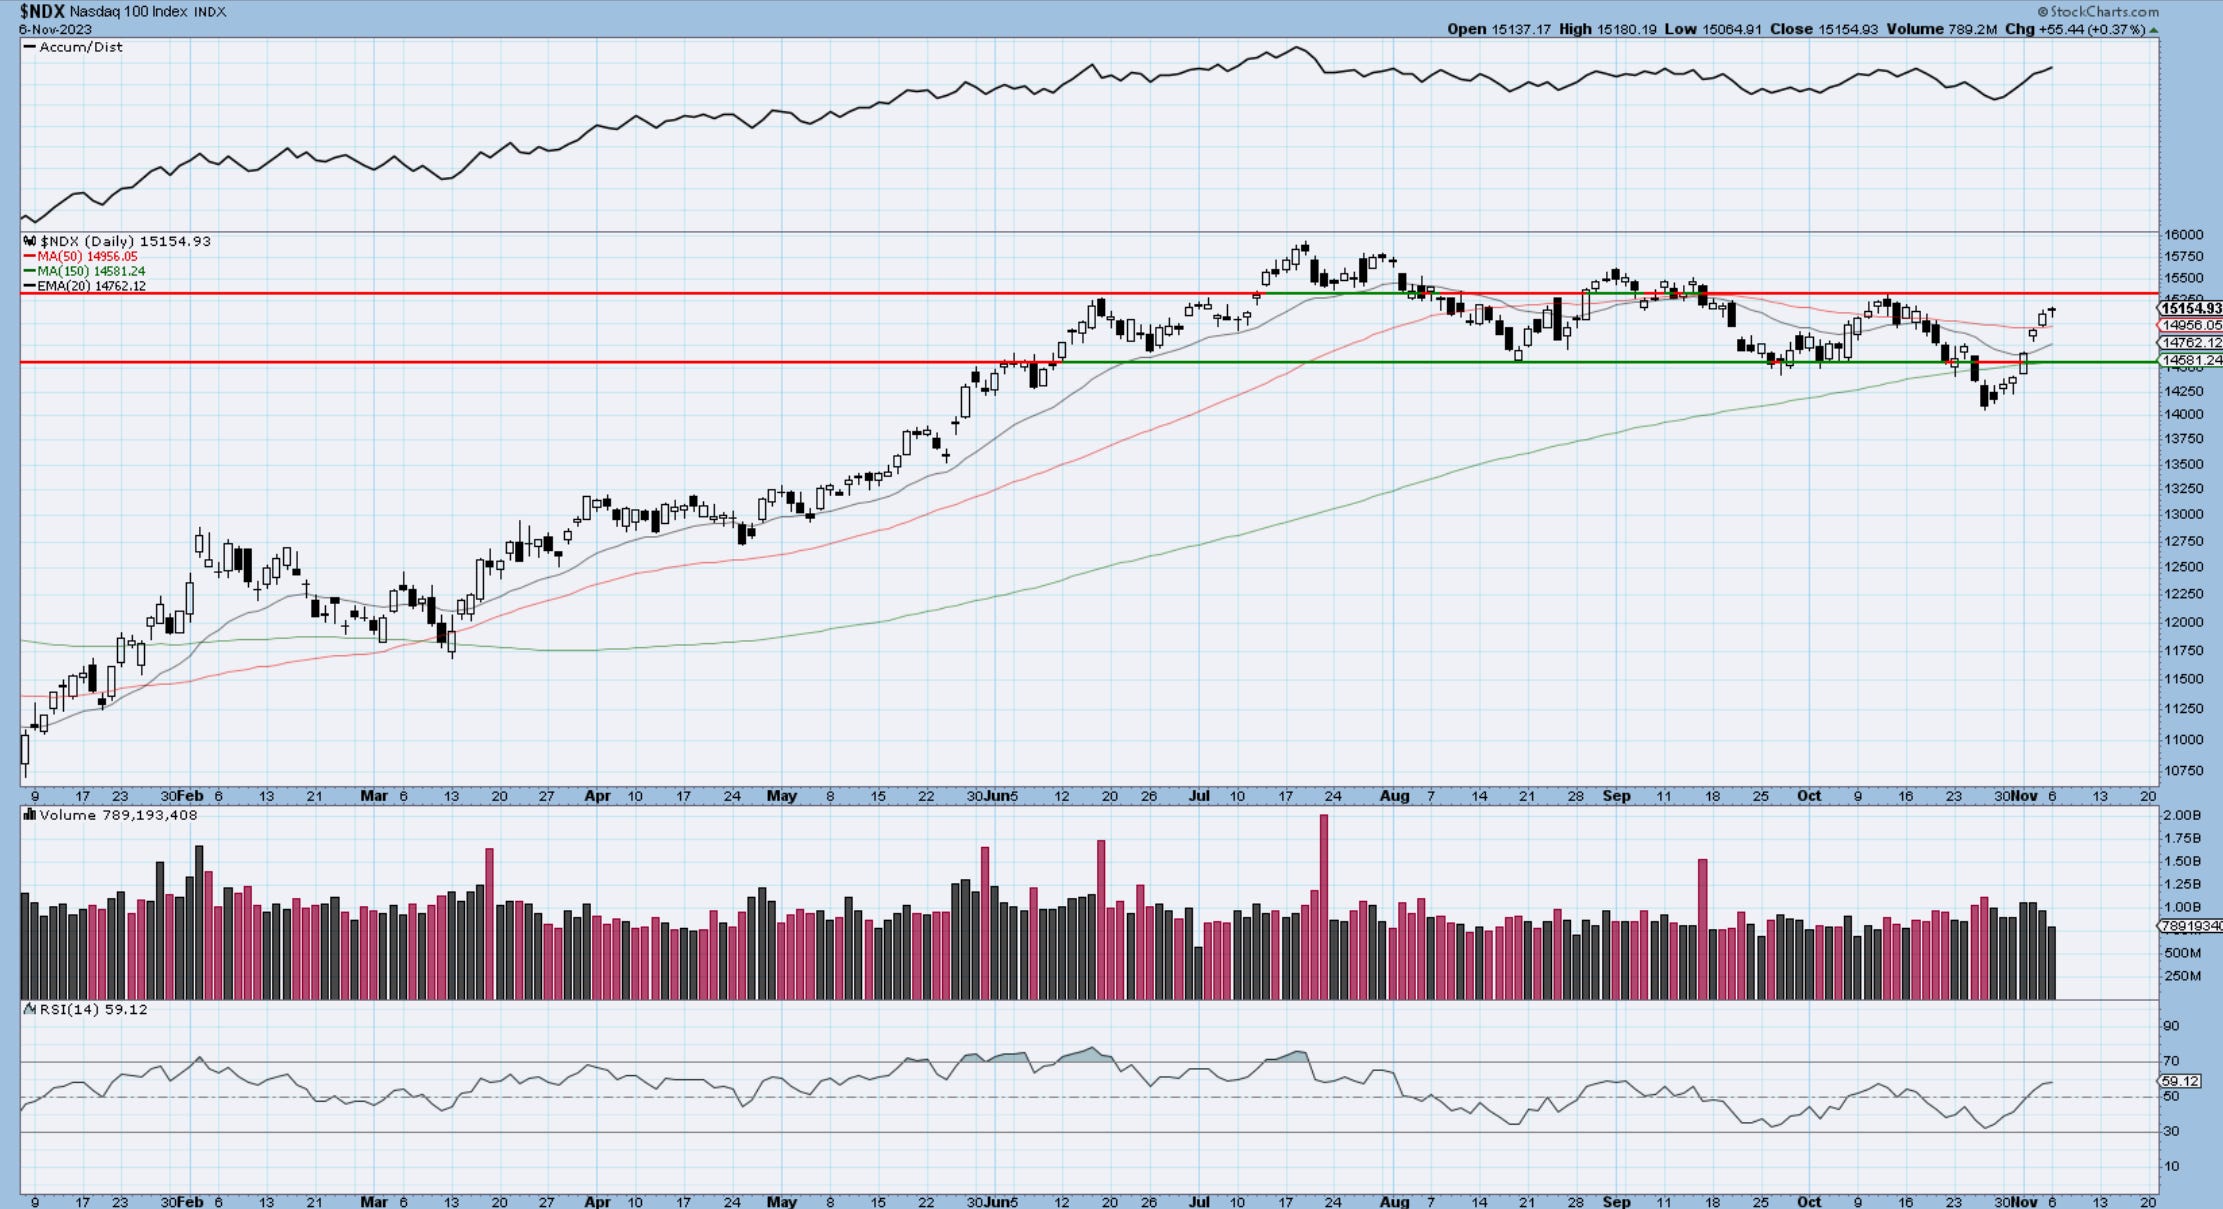
Nasdaq100
Nasdaq had a relentless rally ad it’s really threatening the trendline from late July. The move has all the callings of a motive wave, short of completing it. Once it does, which I think is near, we will get a setback. The nature of that move will build the next play on the card. The horizontal resistance is quite heavy as well, I doubt they can get thru that without some serious fighting. I am choosing to be a bit more selective and patient a few days until we get a resolution from these zones.
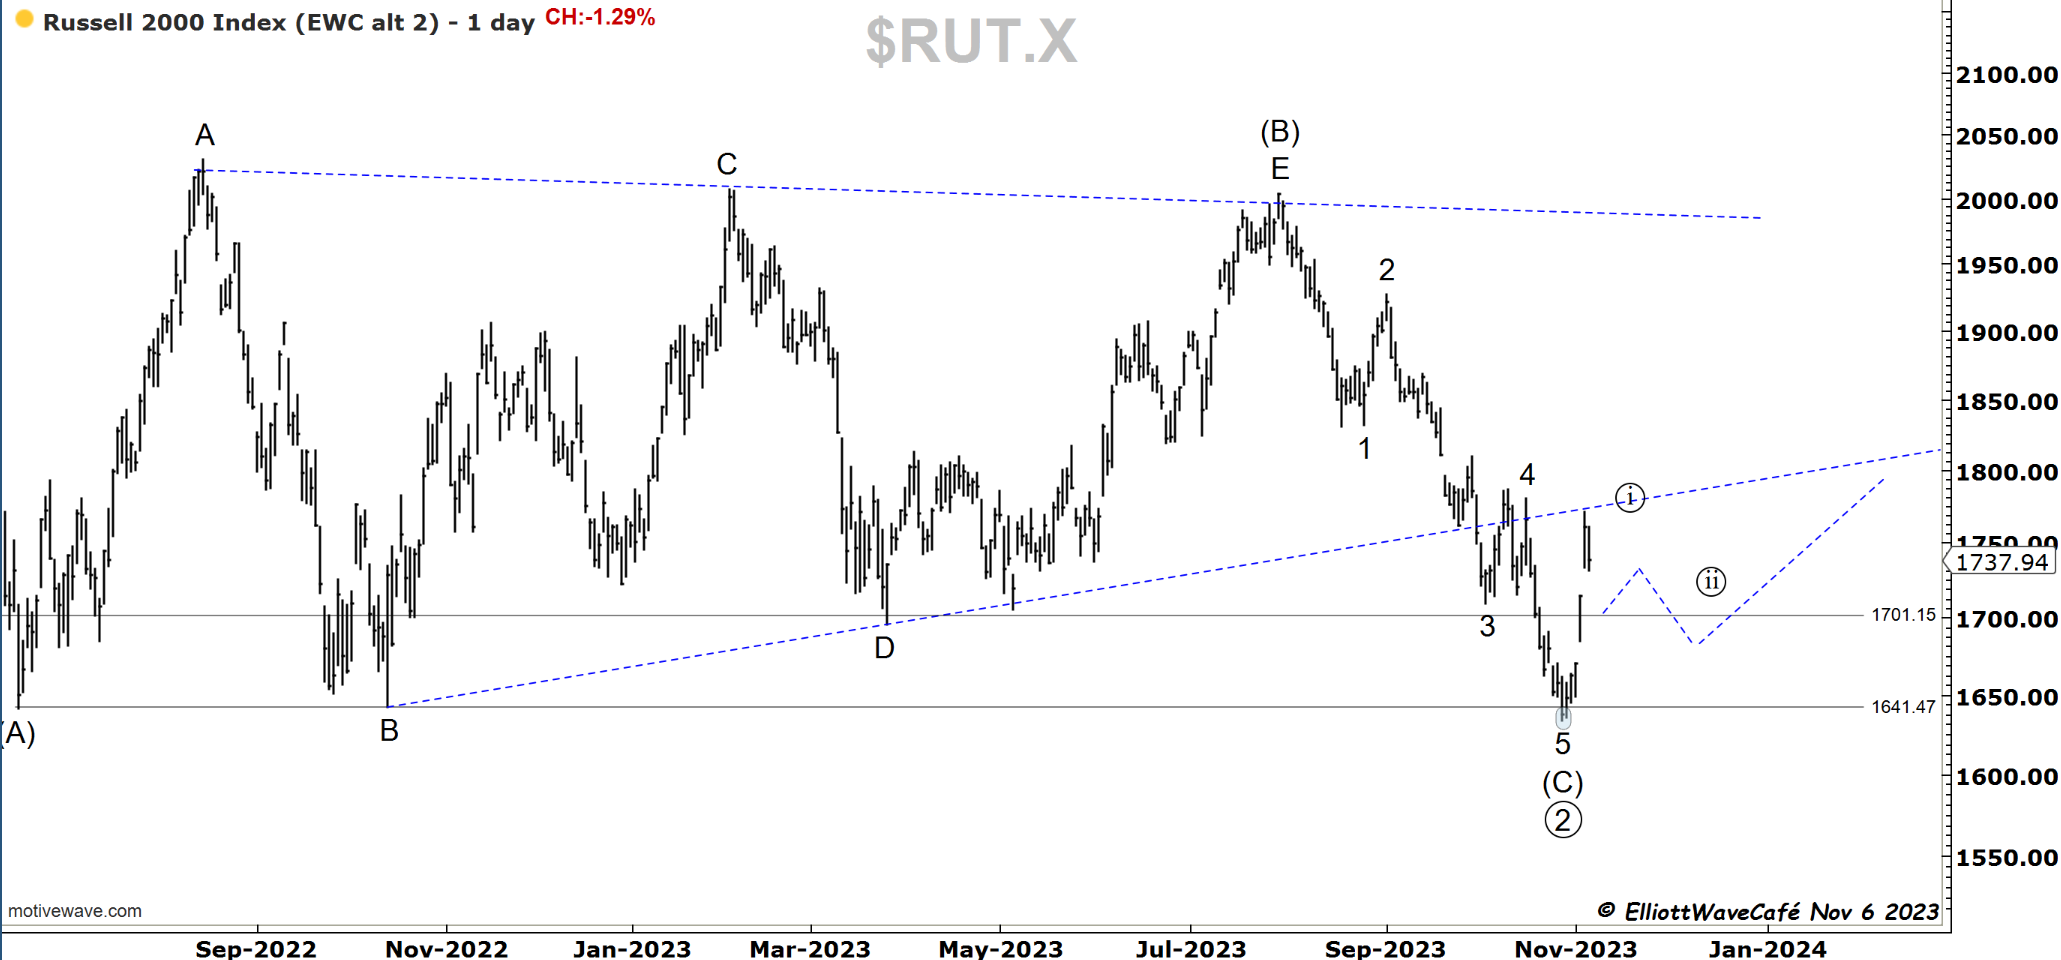
RUSSELL 2000
This index went and kissed the underside of that broken trendline. If we think wave ((2)) is done, then this must be wave ((i)) of the next buildup. Some will argue that this rally is just an A wave of a corrective ABC upwards. That’s ok too, if you think small caps have further to decline. Even under those conditions, the rally should have some legs after a B wave setback.

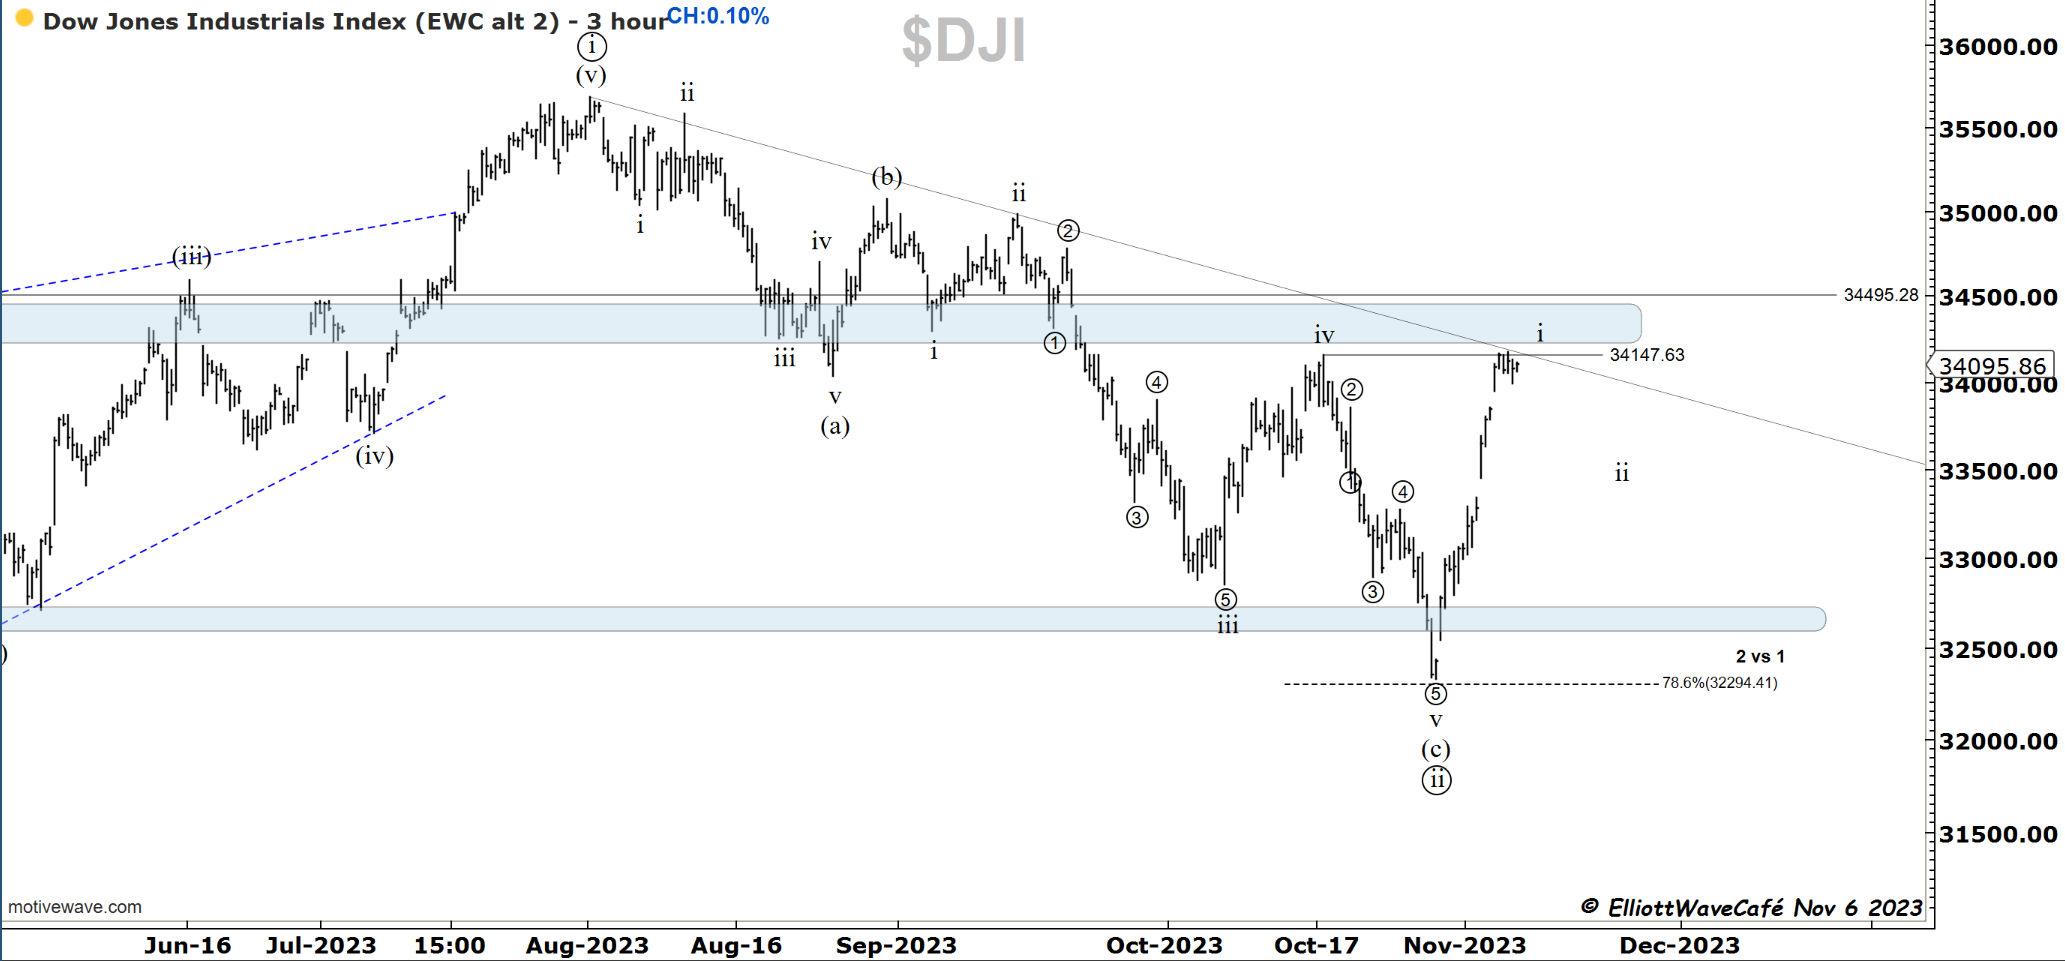
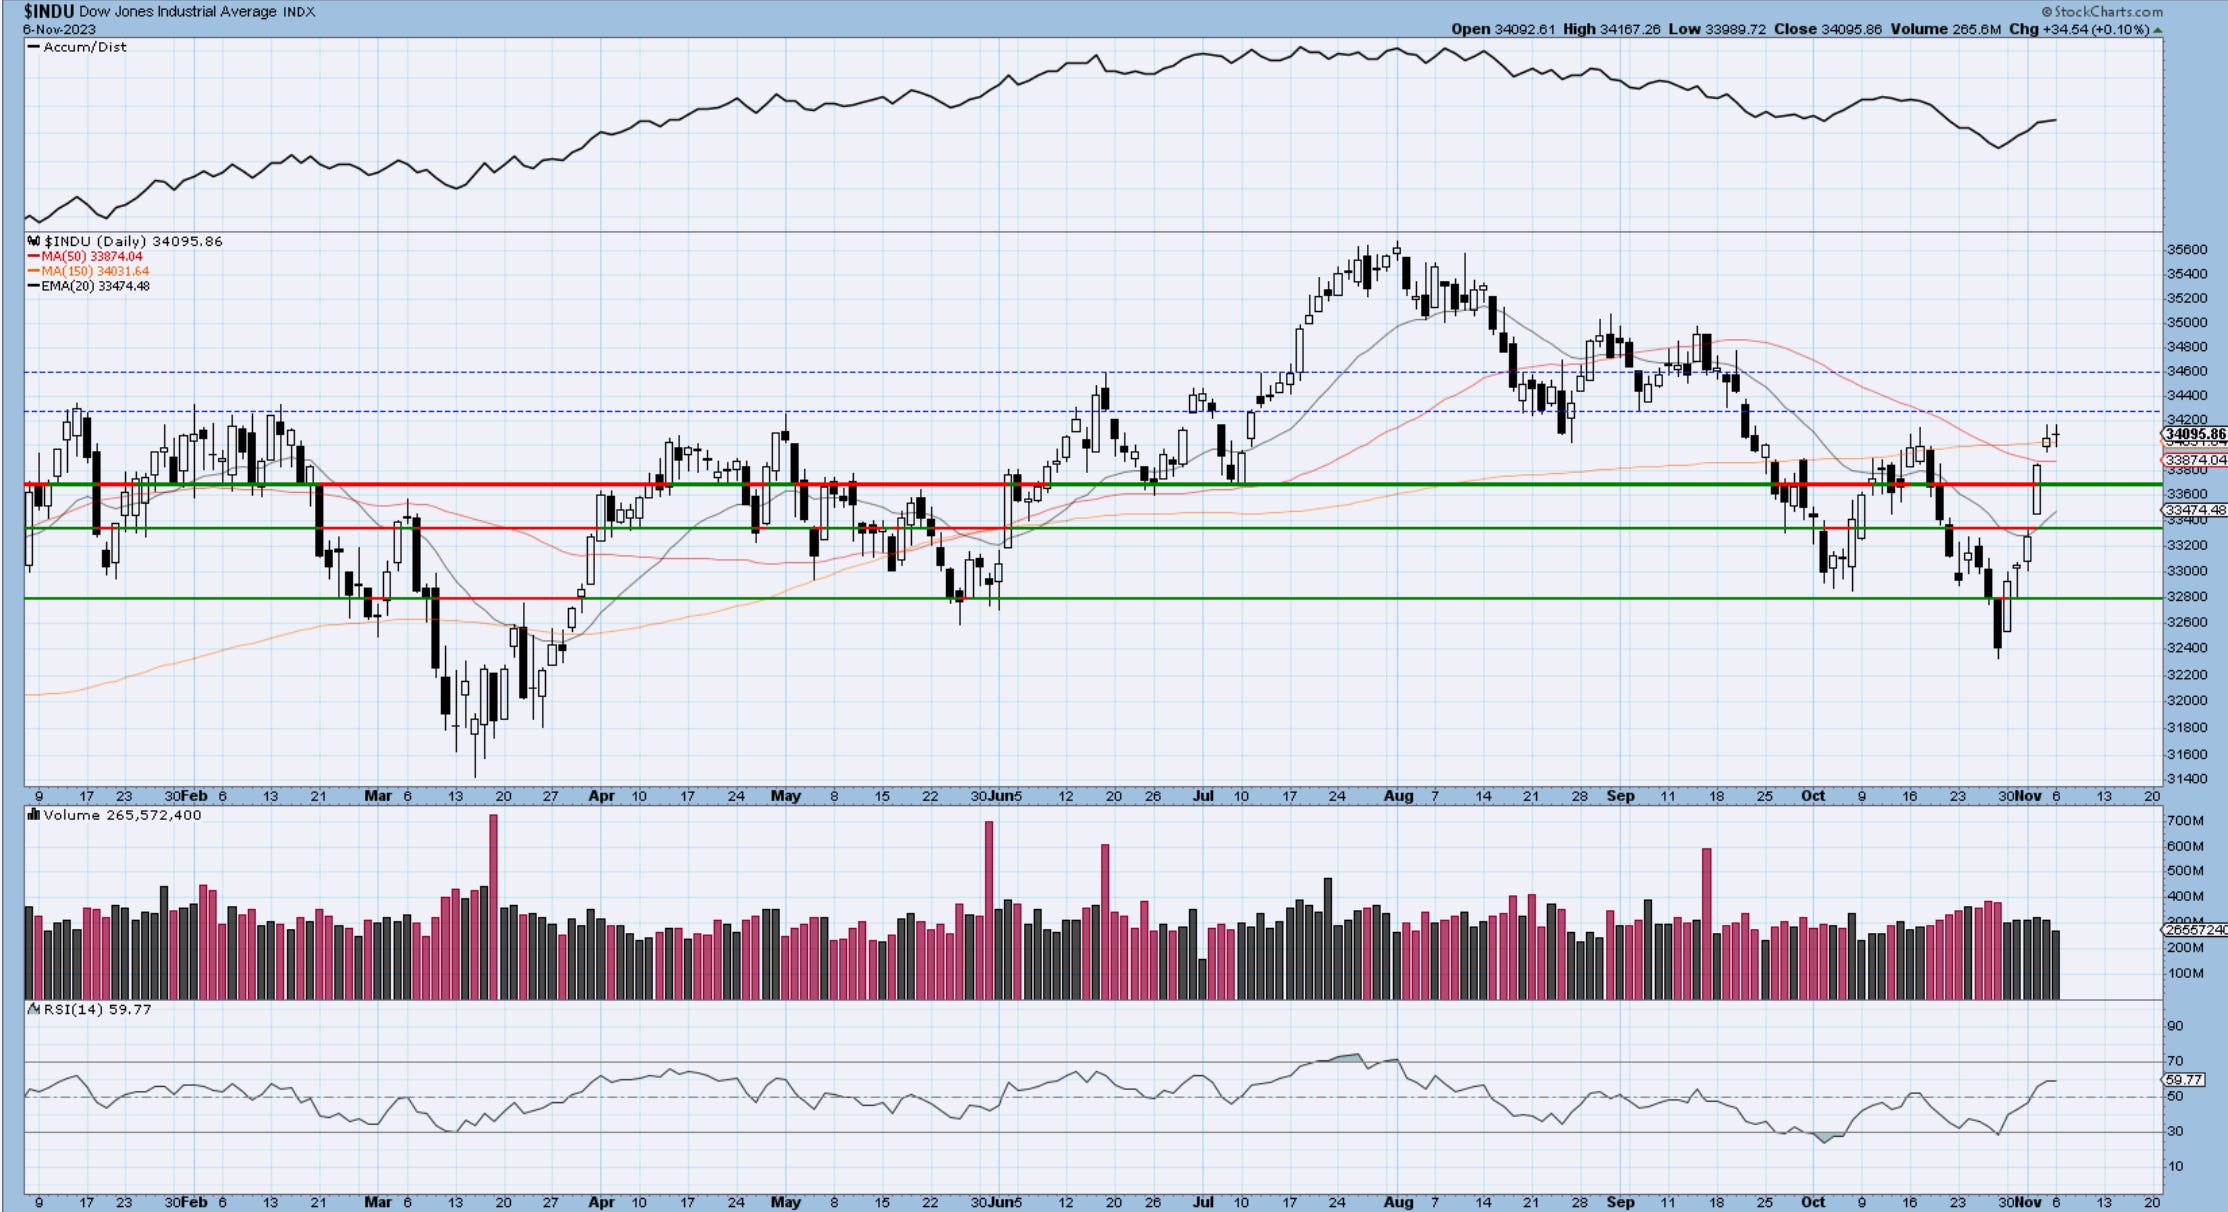
Dow30
Where did we stop in this market? At a perfect confluence of horizontal levels with a declining trendline. Same as in the markets above, this too is prone for corrective action soon after a possible new high to complete i.
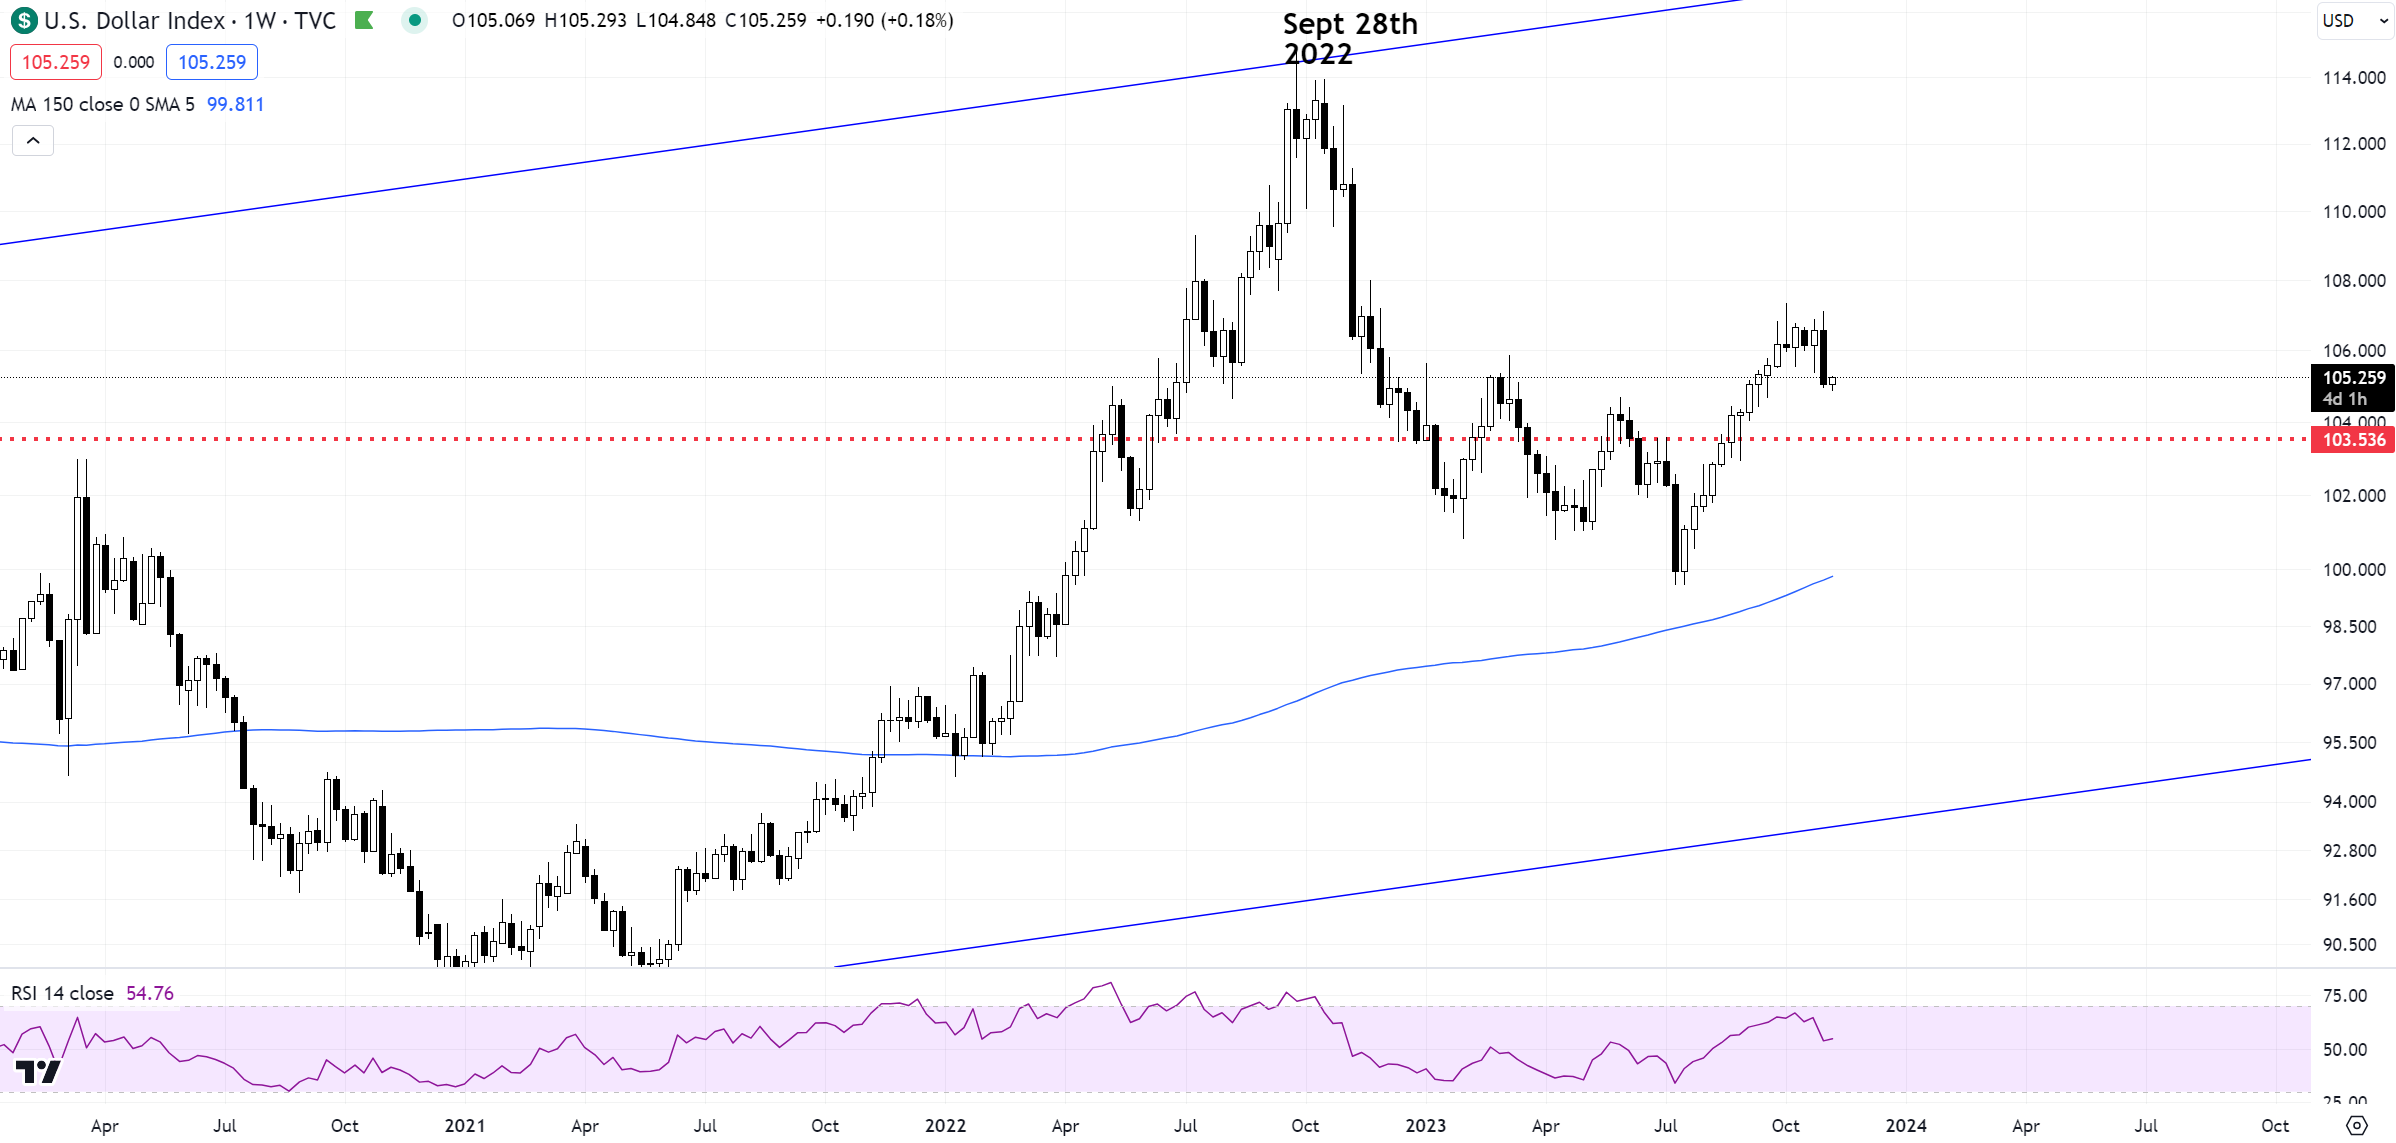
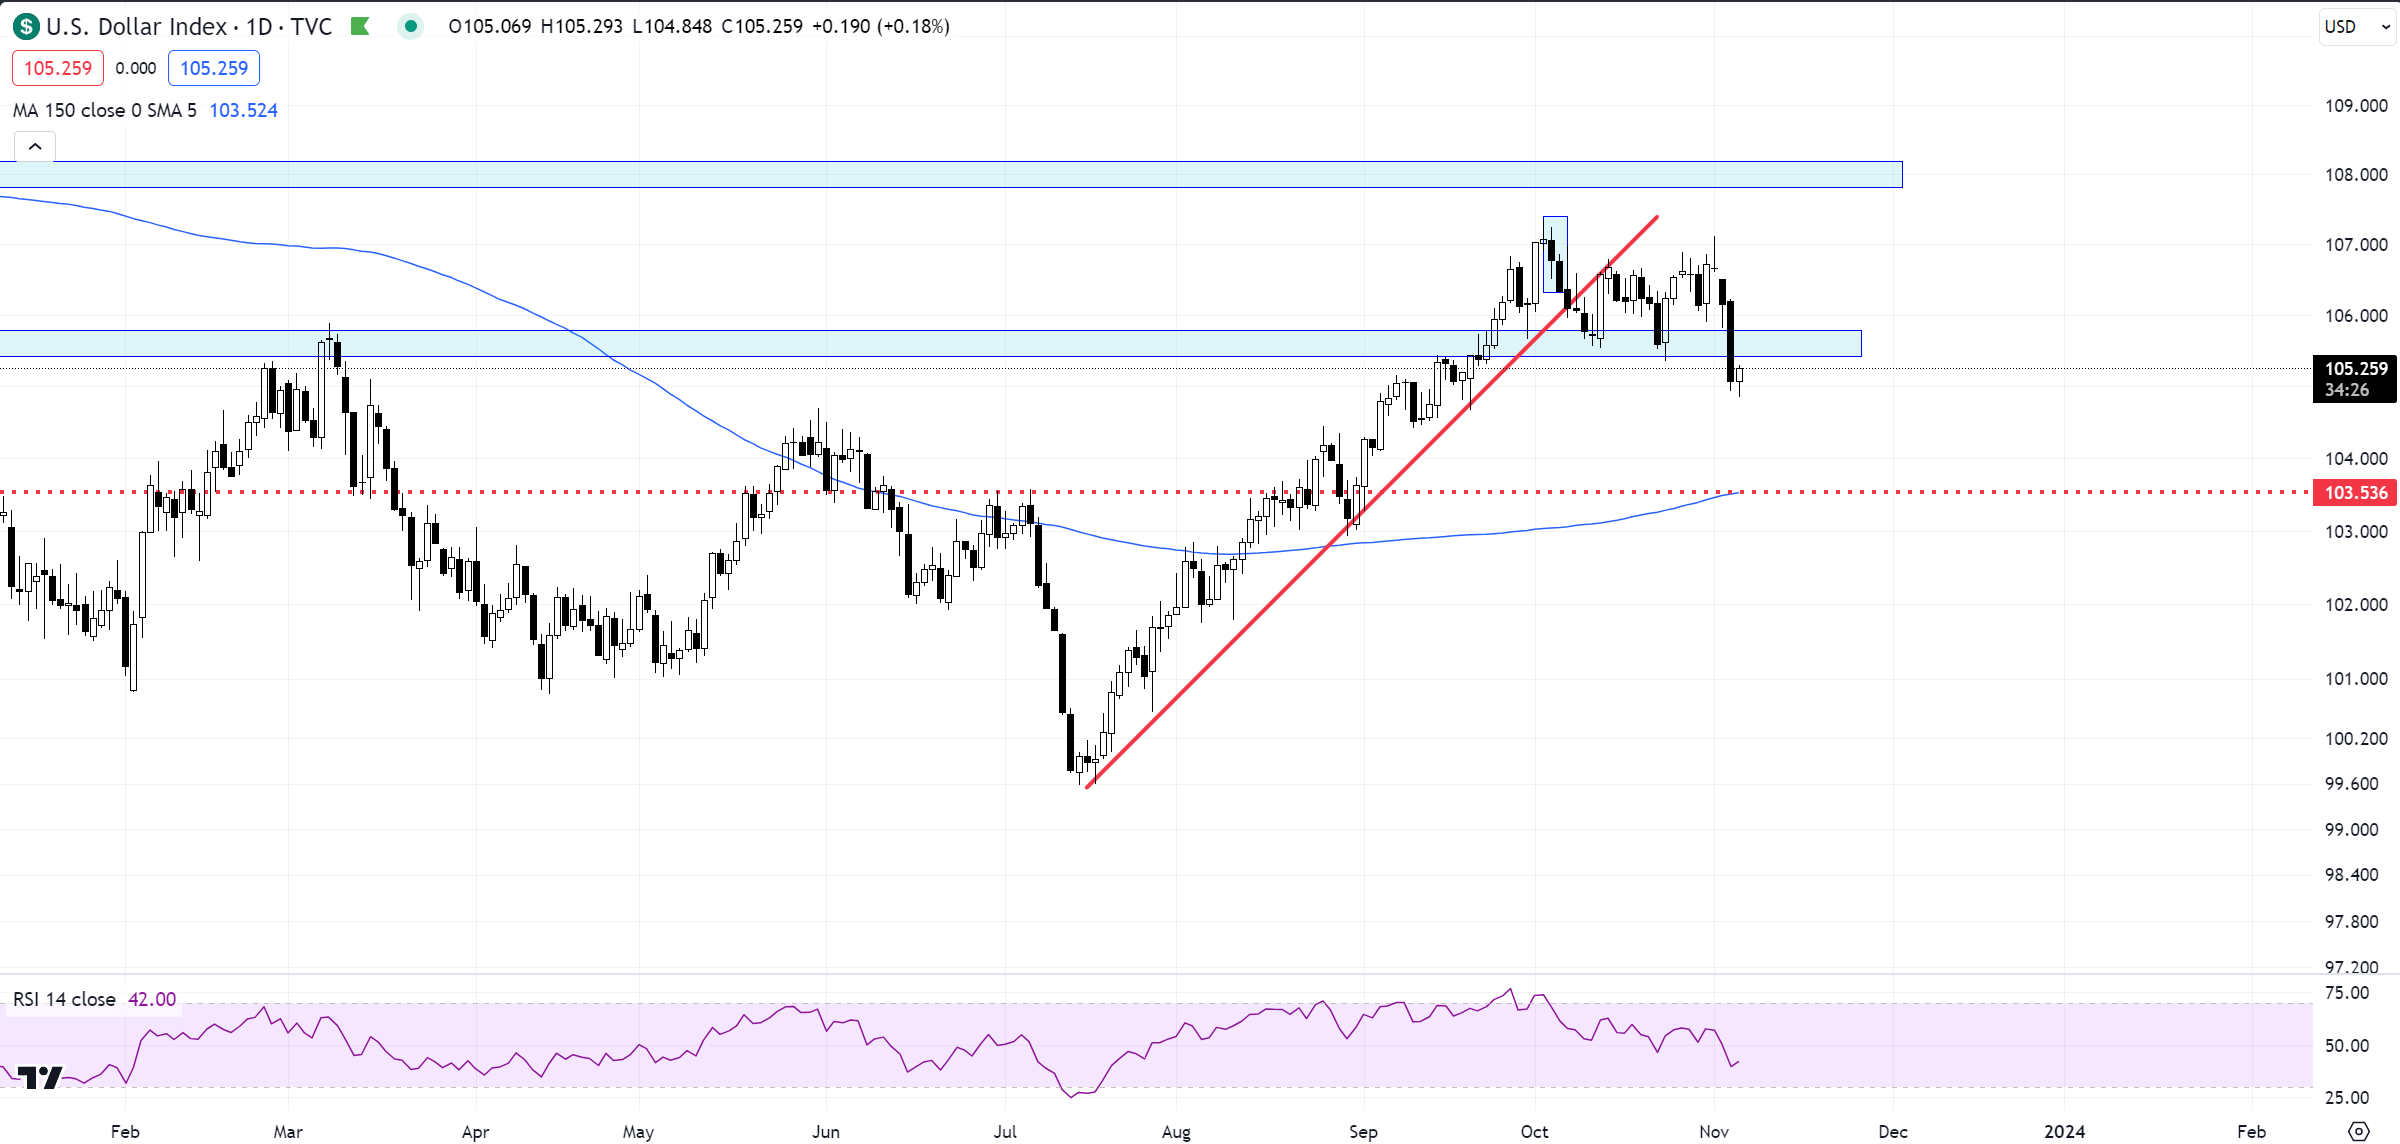
US Dollar and Yields
The dollar has finally given some back after multiple attempts at breaking 107. I think breaking 105.50 is a big deal but we need to continue for it to be meaningful. Anything back above 106 would start to smell like a completed downside correction and another try at the highs. We prepared for USD weakness ever since the red trendline was broken and it came last week with a bit more strength on falling yields. The dollar continues to be an important metric for risk so let’s monitor it forward in relation to yield and equity behavior.
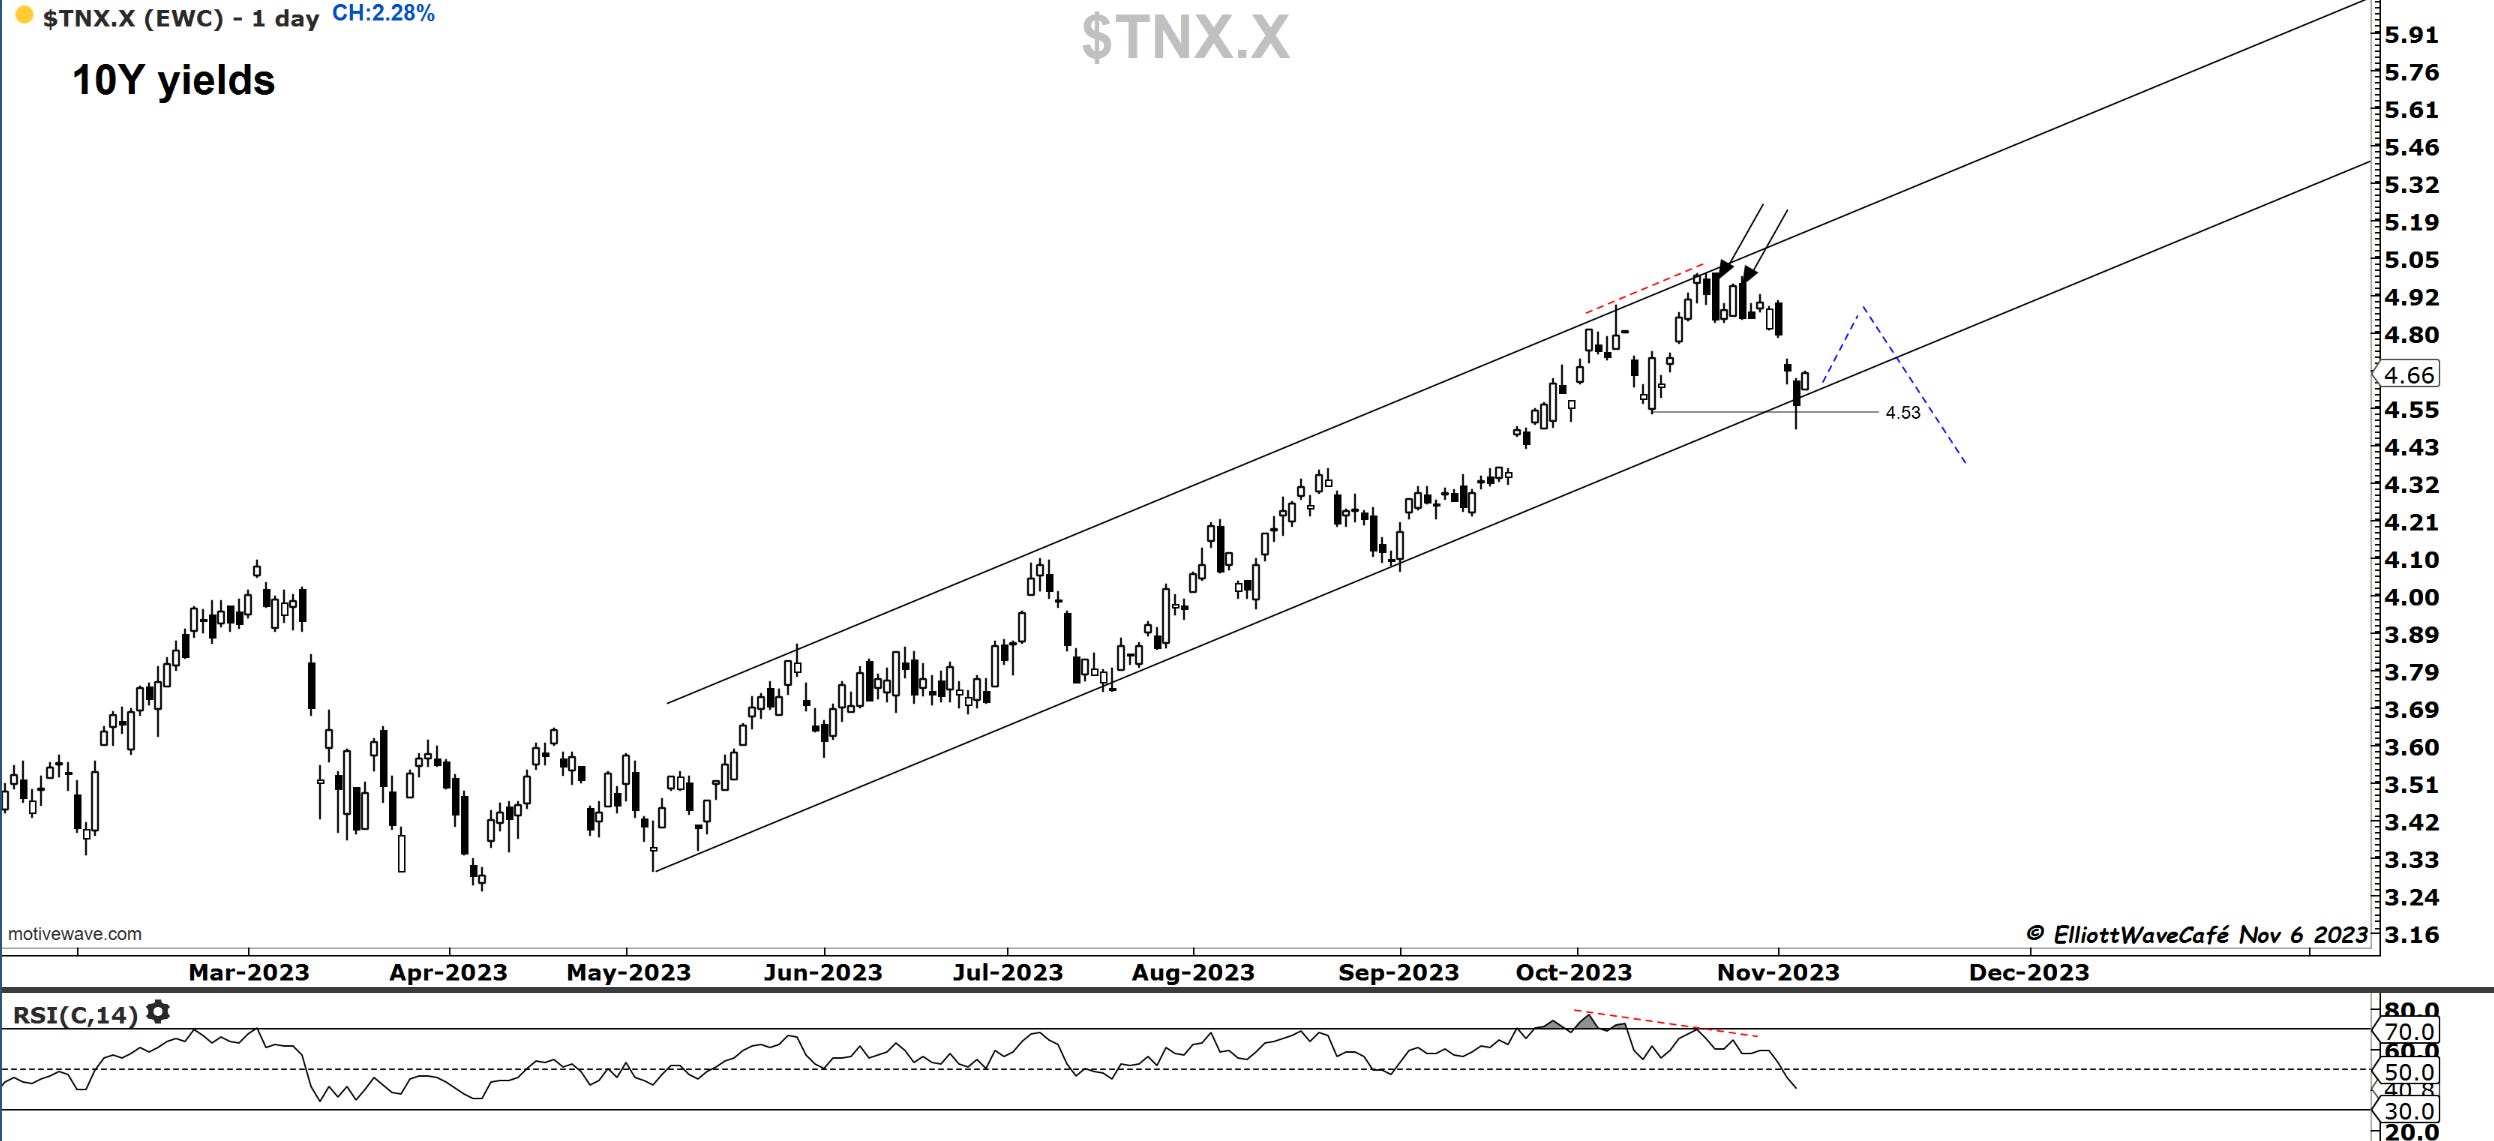
The two candles we flagged last week, did their job in sending traders towards more selling of yield. We tagged the lower boundaries of the uptrending channel and briefly broke below the prior swing low. This indicates weakness in trend and it actually came to us as the top was being formed amidst a declining RSI reading. There should be now a slight recovery in yields which I will monitor for failure and formation of a head and shoulder pattern. If we crack the trend, the path in yields will be lower into 2024. Fed actions will follow as cuts, as they are not creators but followers of short-term yields.
Gold
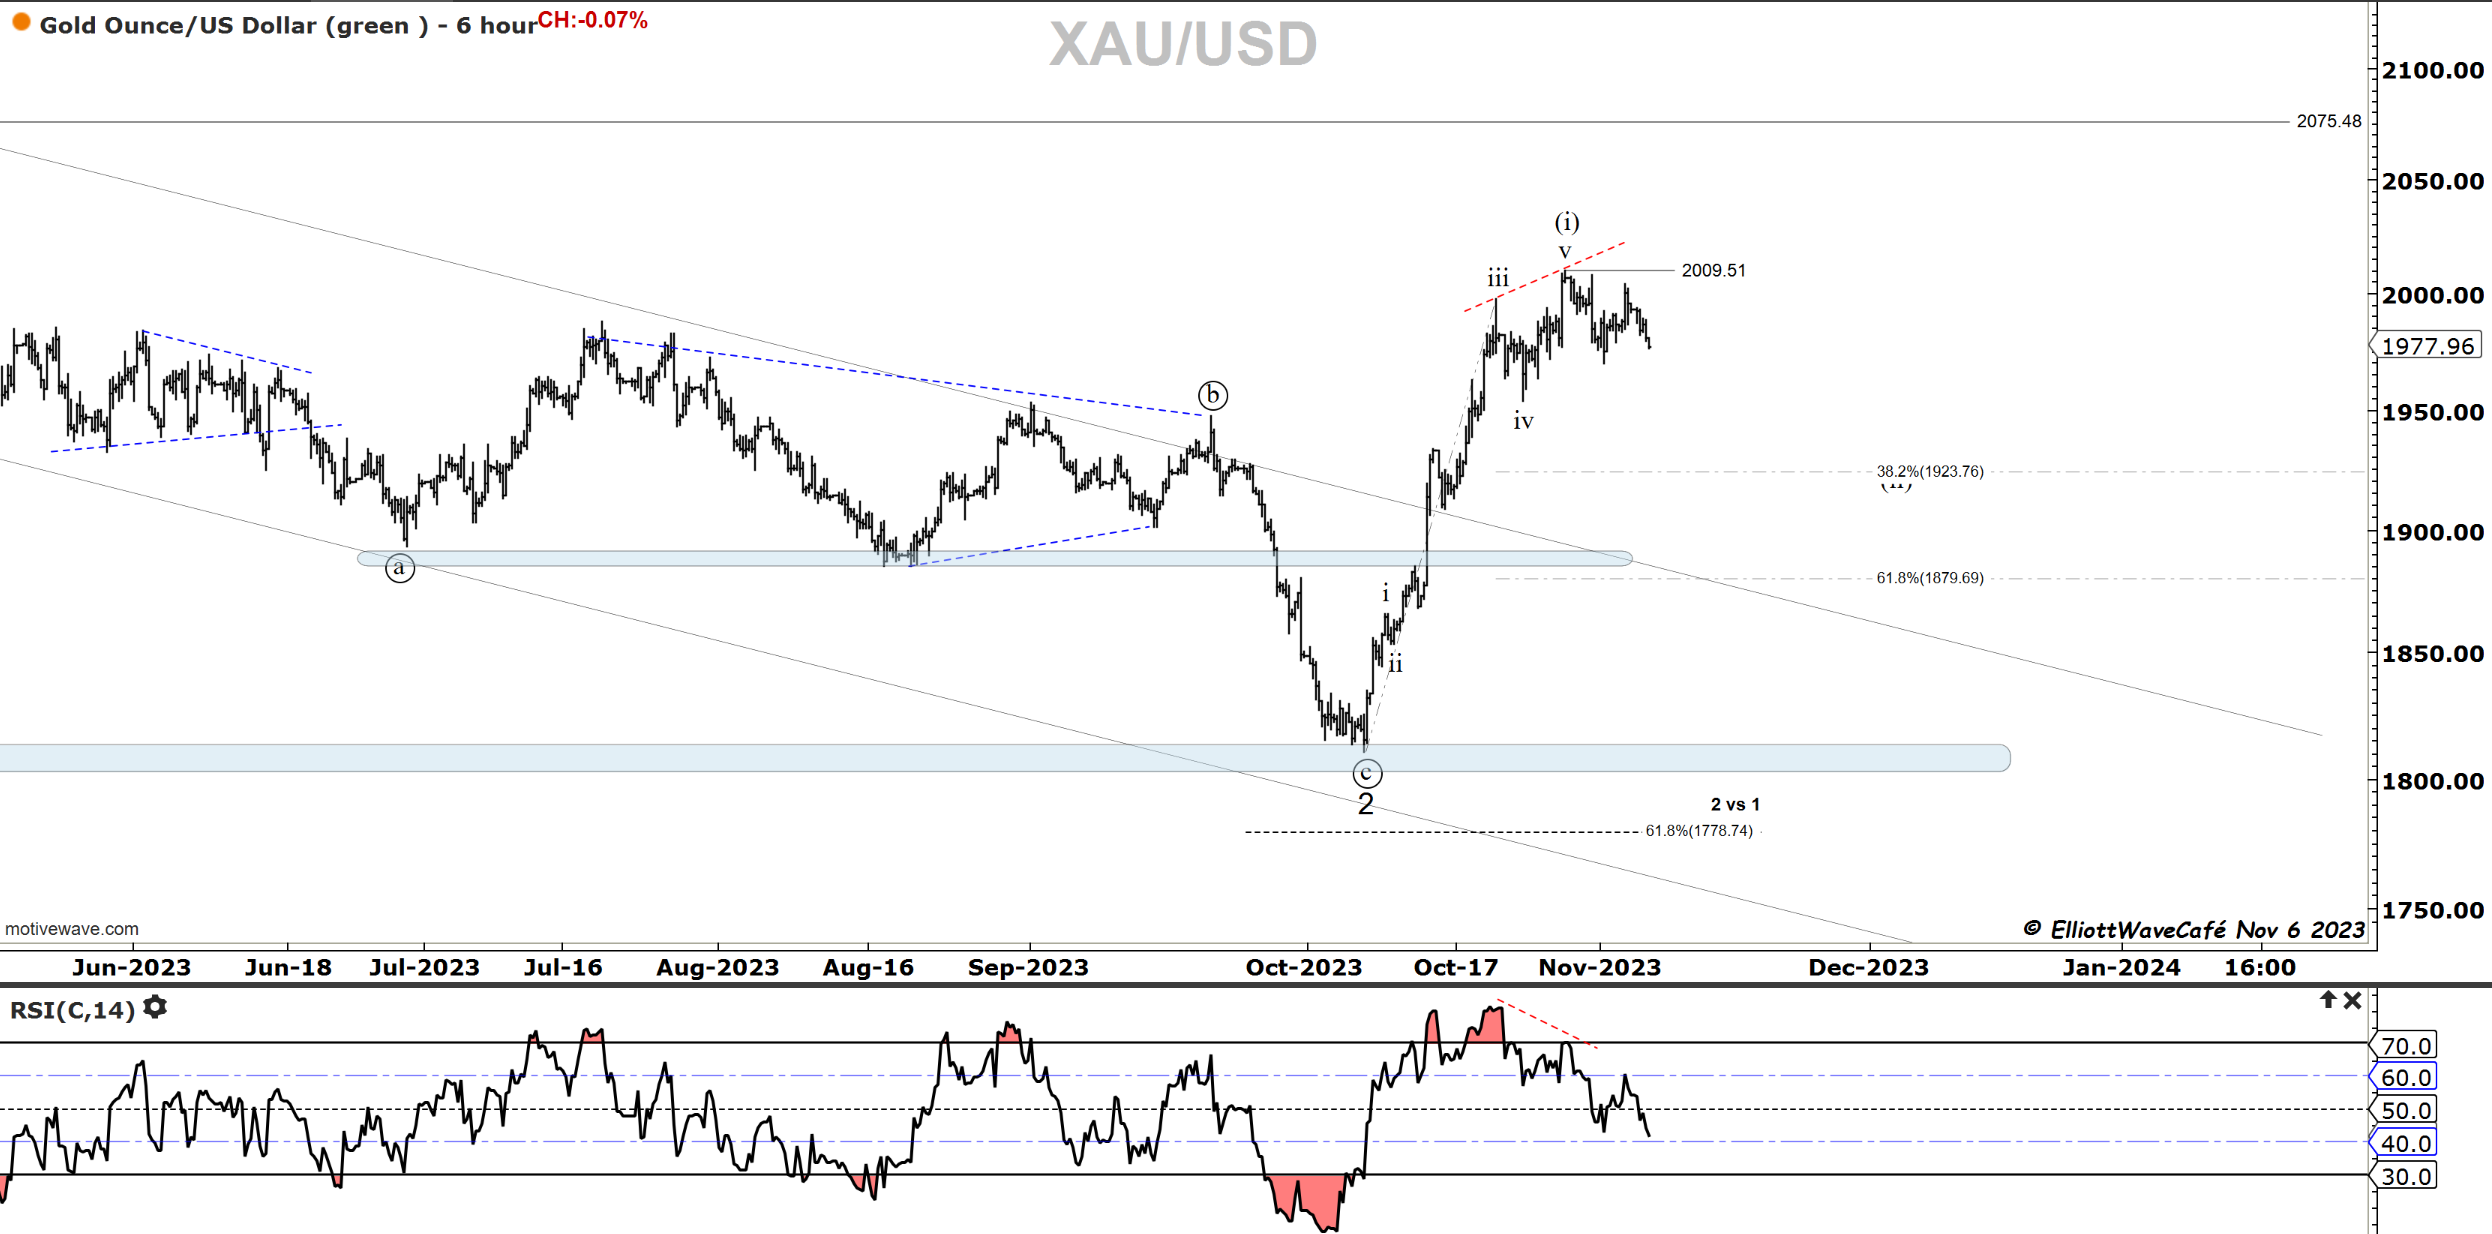
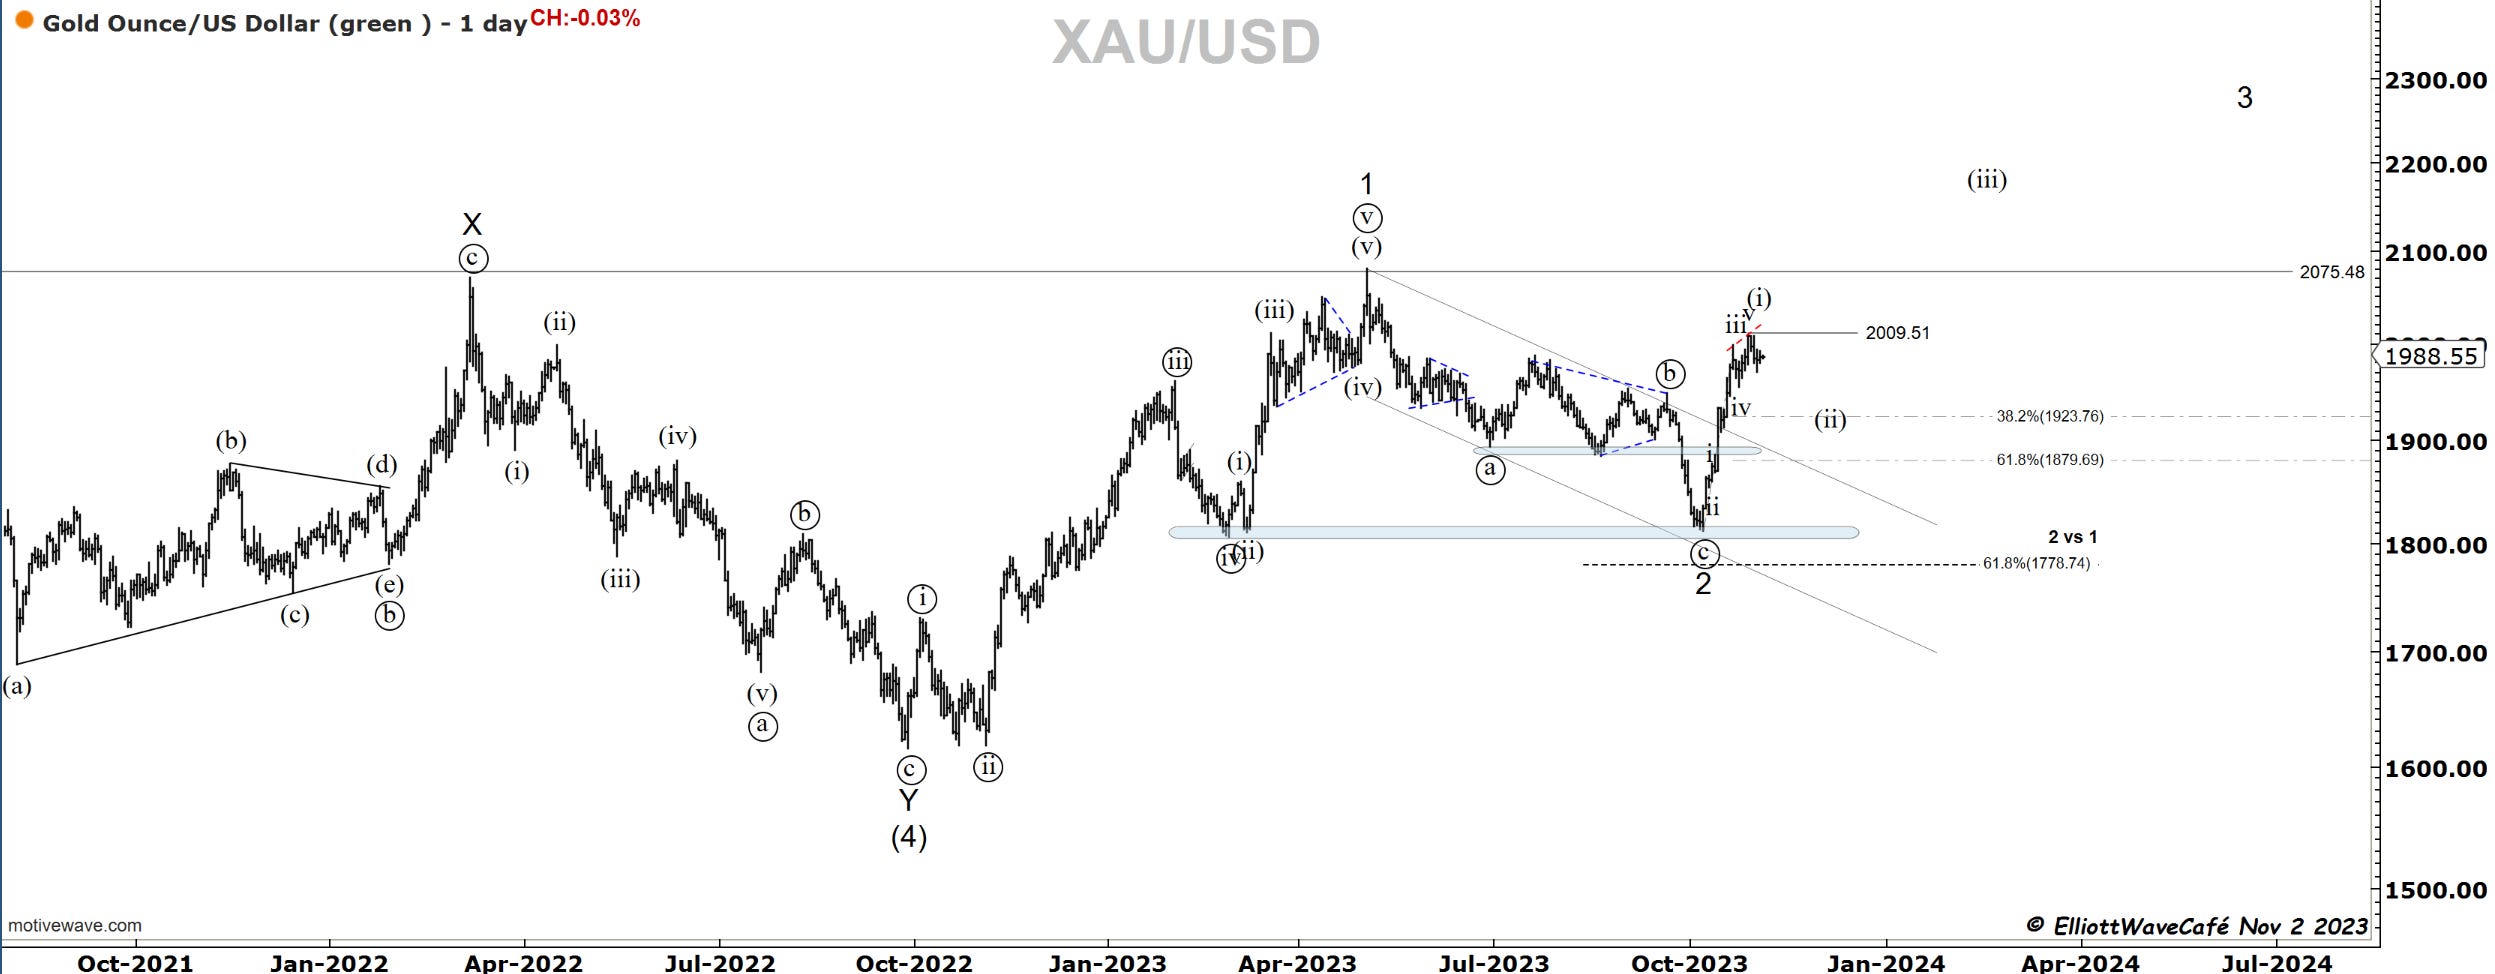
prior comments on gold stand and the price action is working to confirm it. Looking for declines below 1950.
Gold is out of the picture for a while as it continues to correct the initial advance. Once wave (ii) shapes up a bit more, we can start thinking about the long side once again.
Bitcoin
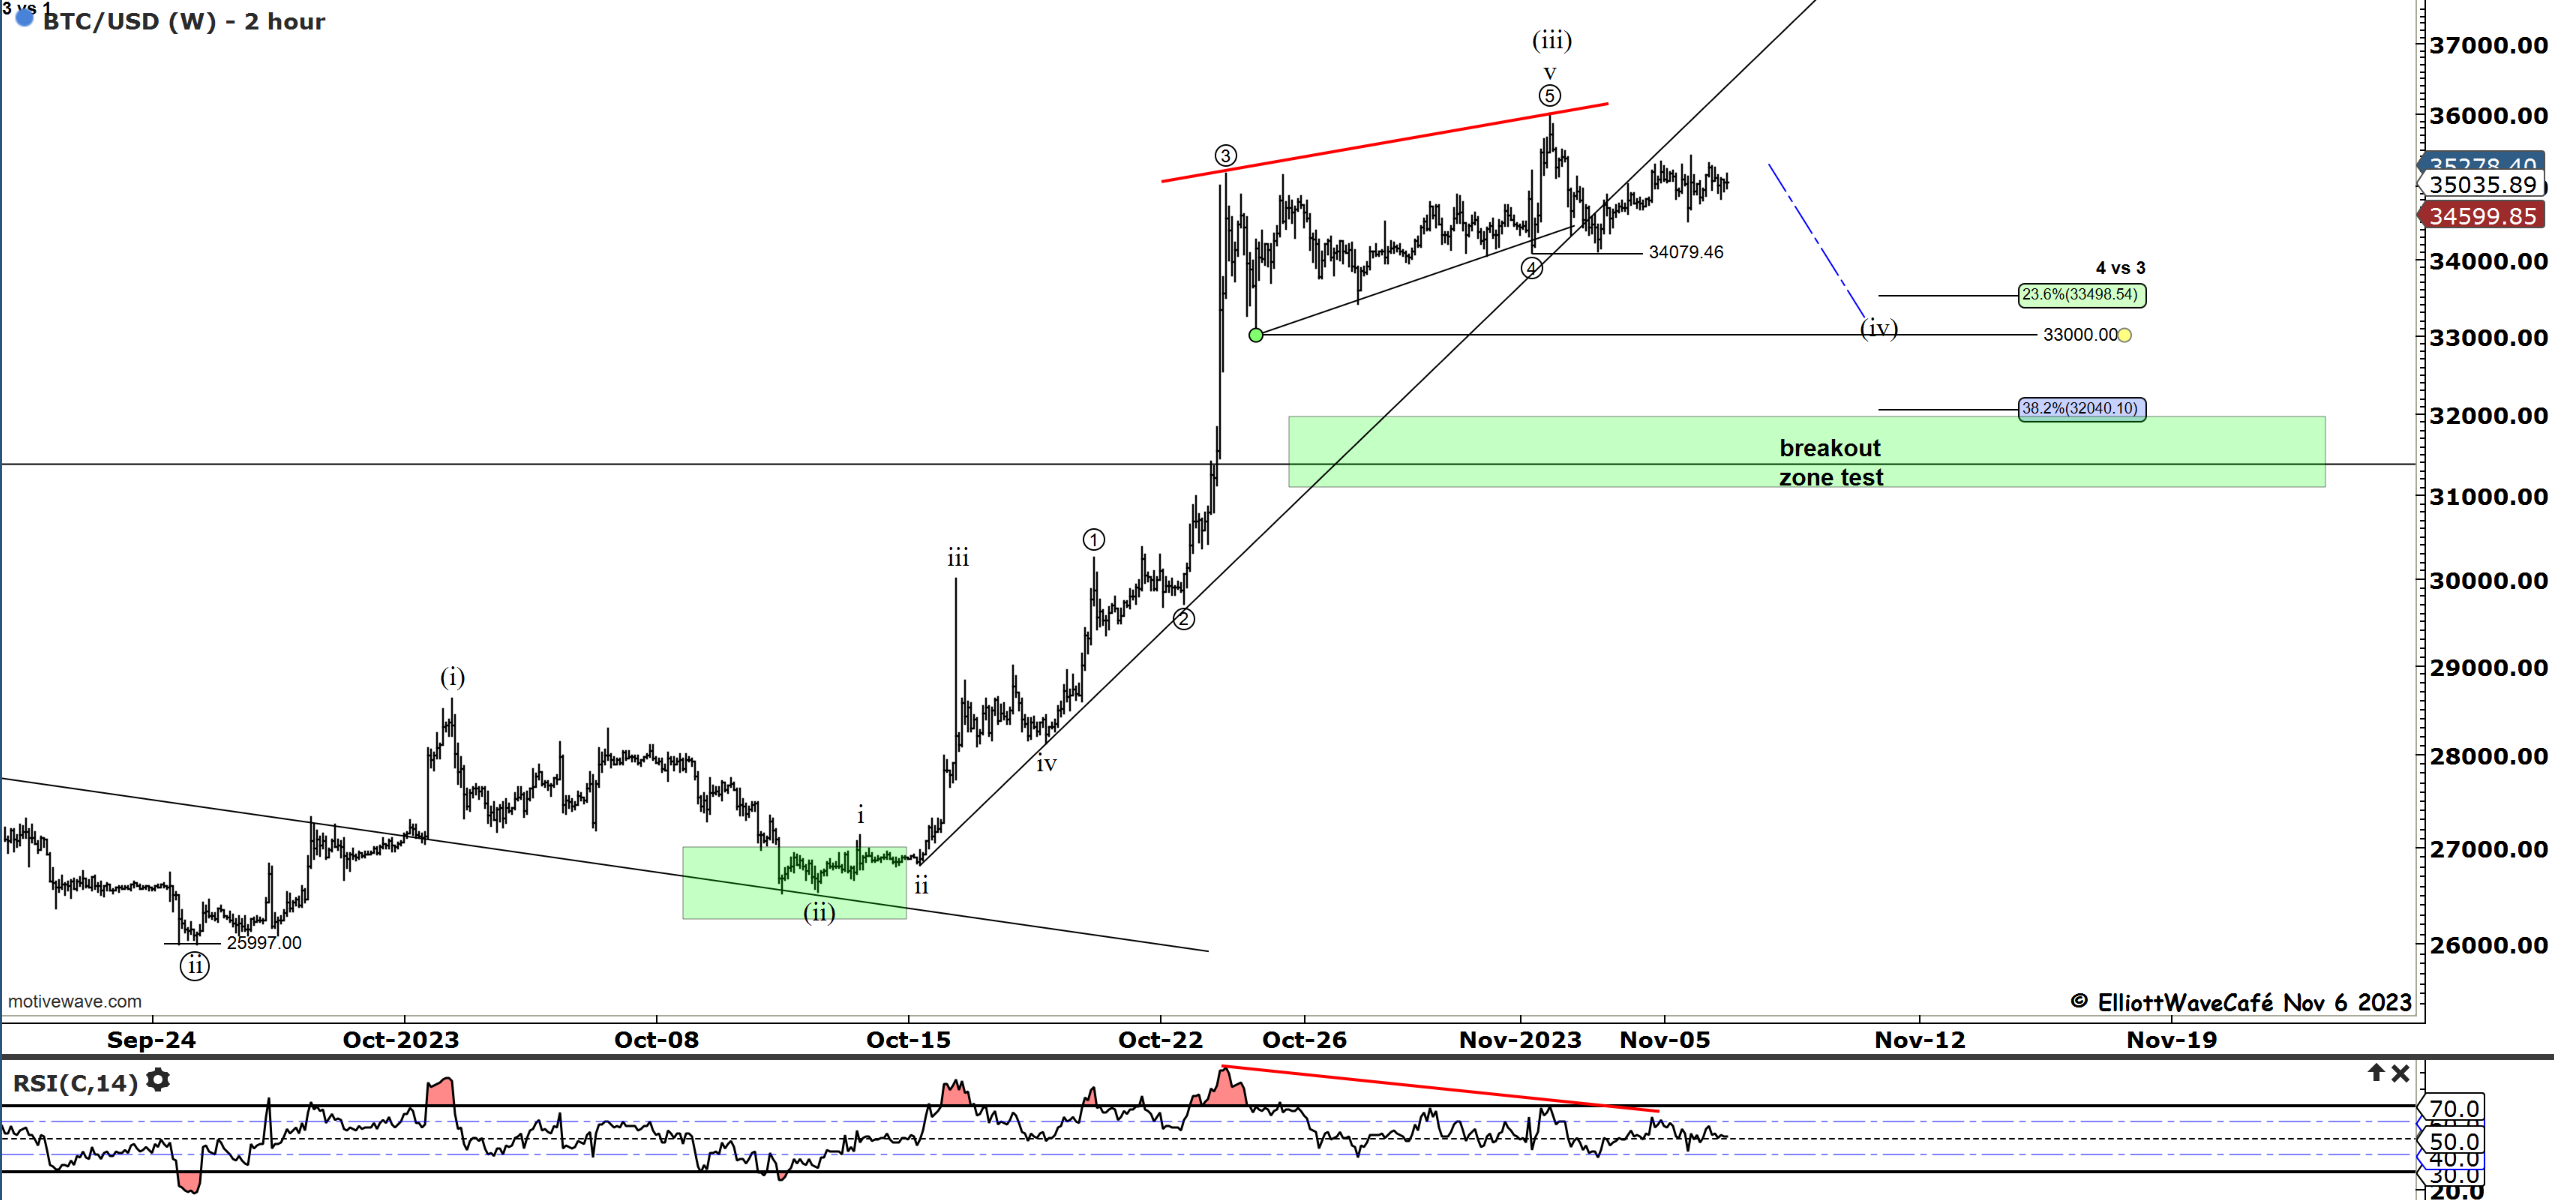
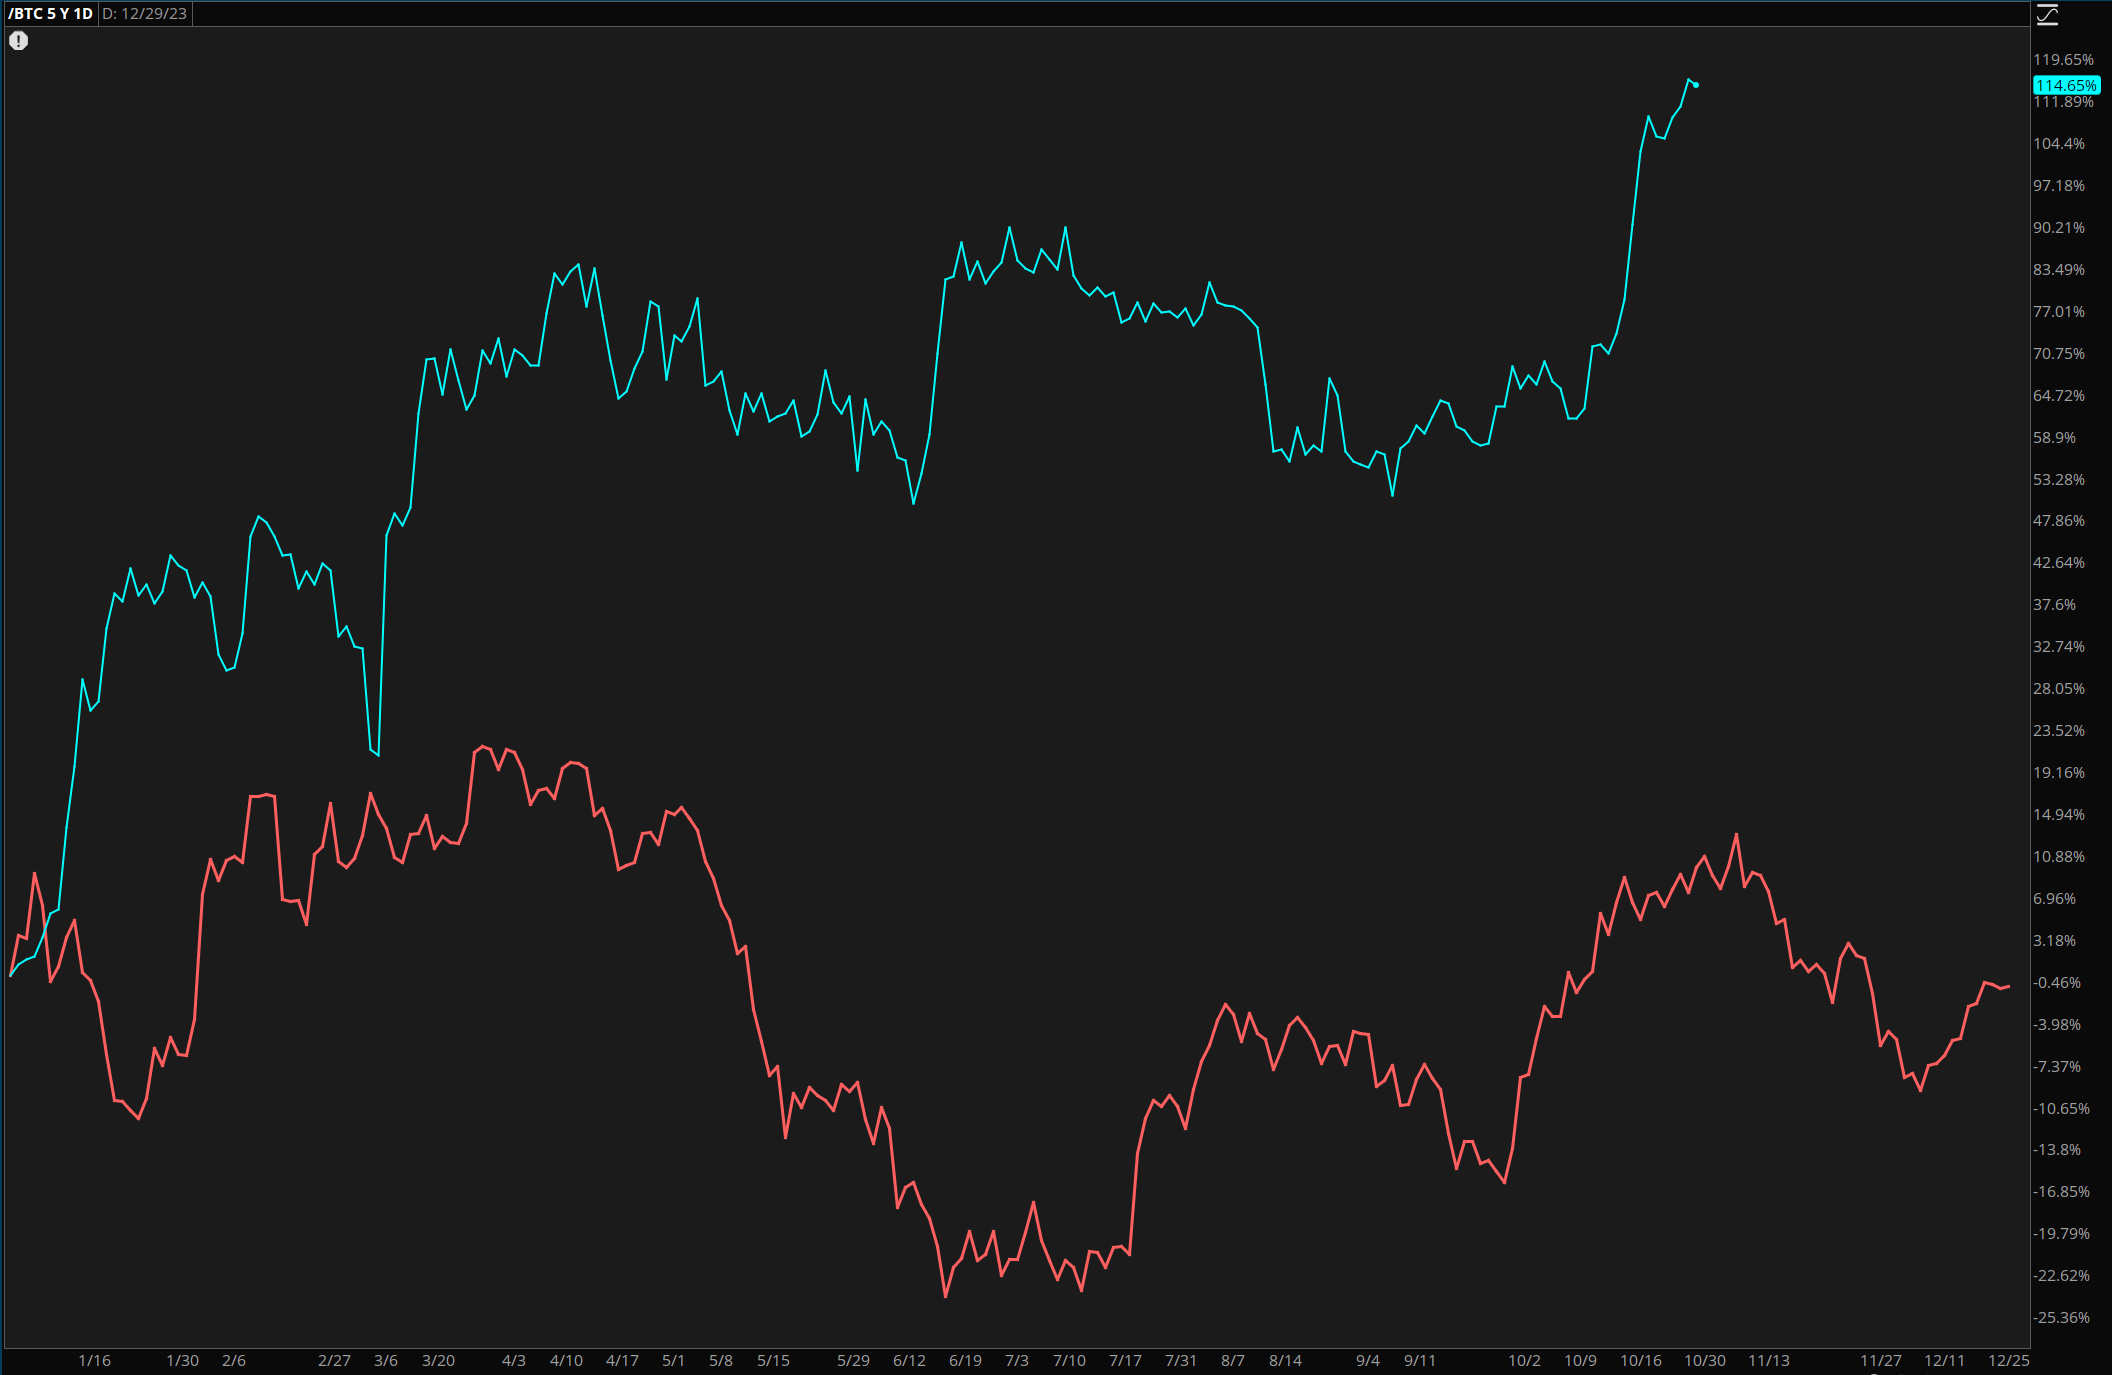
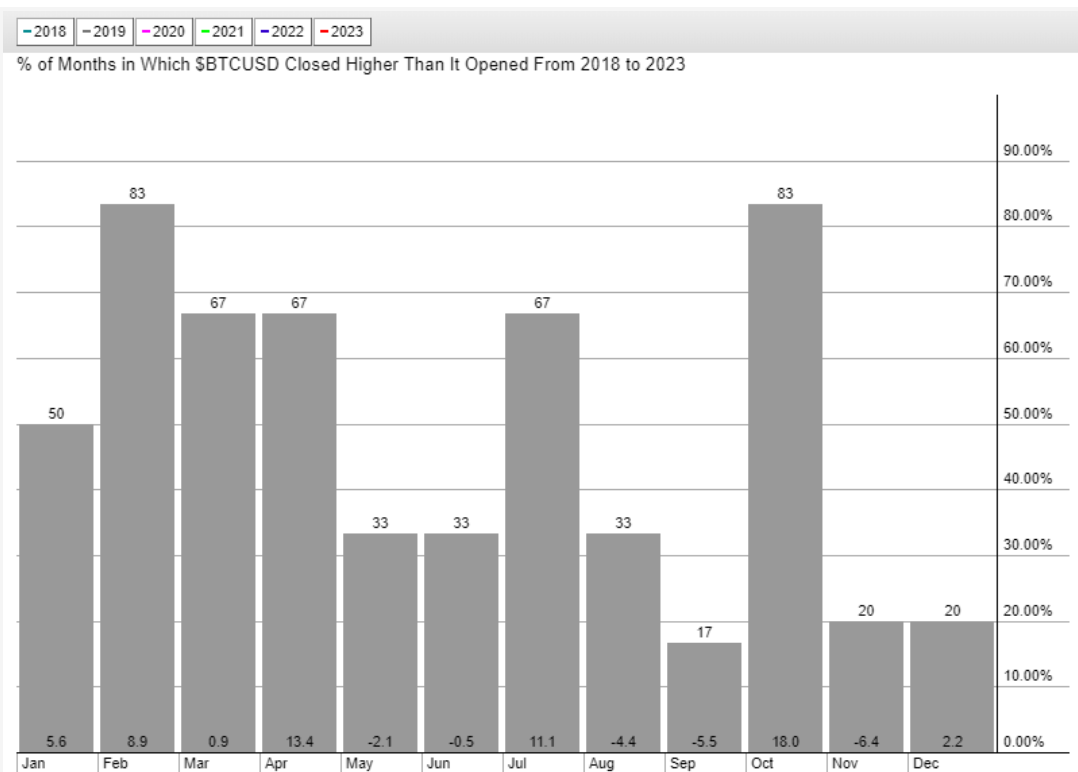
Bitcoin continues to struggle the upward momentum and has been doing so for about 2 weeks now.( 2nd chart). I continue to view the current behavior as corrective for a wave (iv) formation. By my metrics, we should fall towards the 33k zone. I will keep the seasonality charts for perspective along with the cycle at this point. Bitcoin’s stagnation is allowing the altcoin market to grab market share and that could continue even with BTC falling for a while. I am not an expert in crypto correlations or dominance so take my views with a grain of salt when it comes to alts-btc behavior.
Overall I think is right to remain long BTC as long as we’re above 31k. The current churn will run its course and a higher-leg will follow.
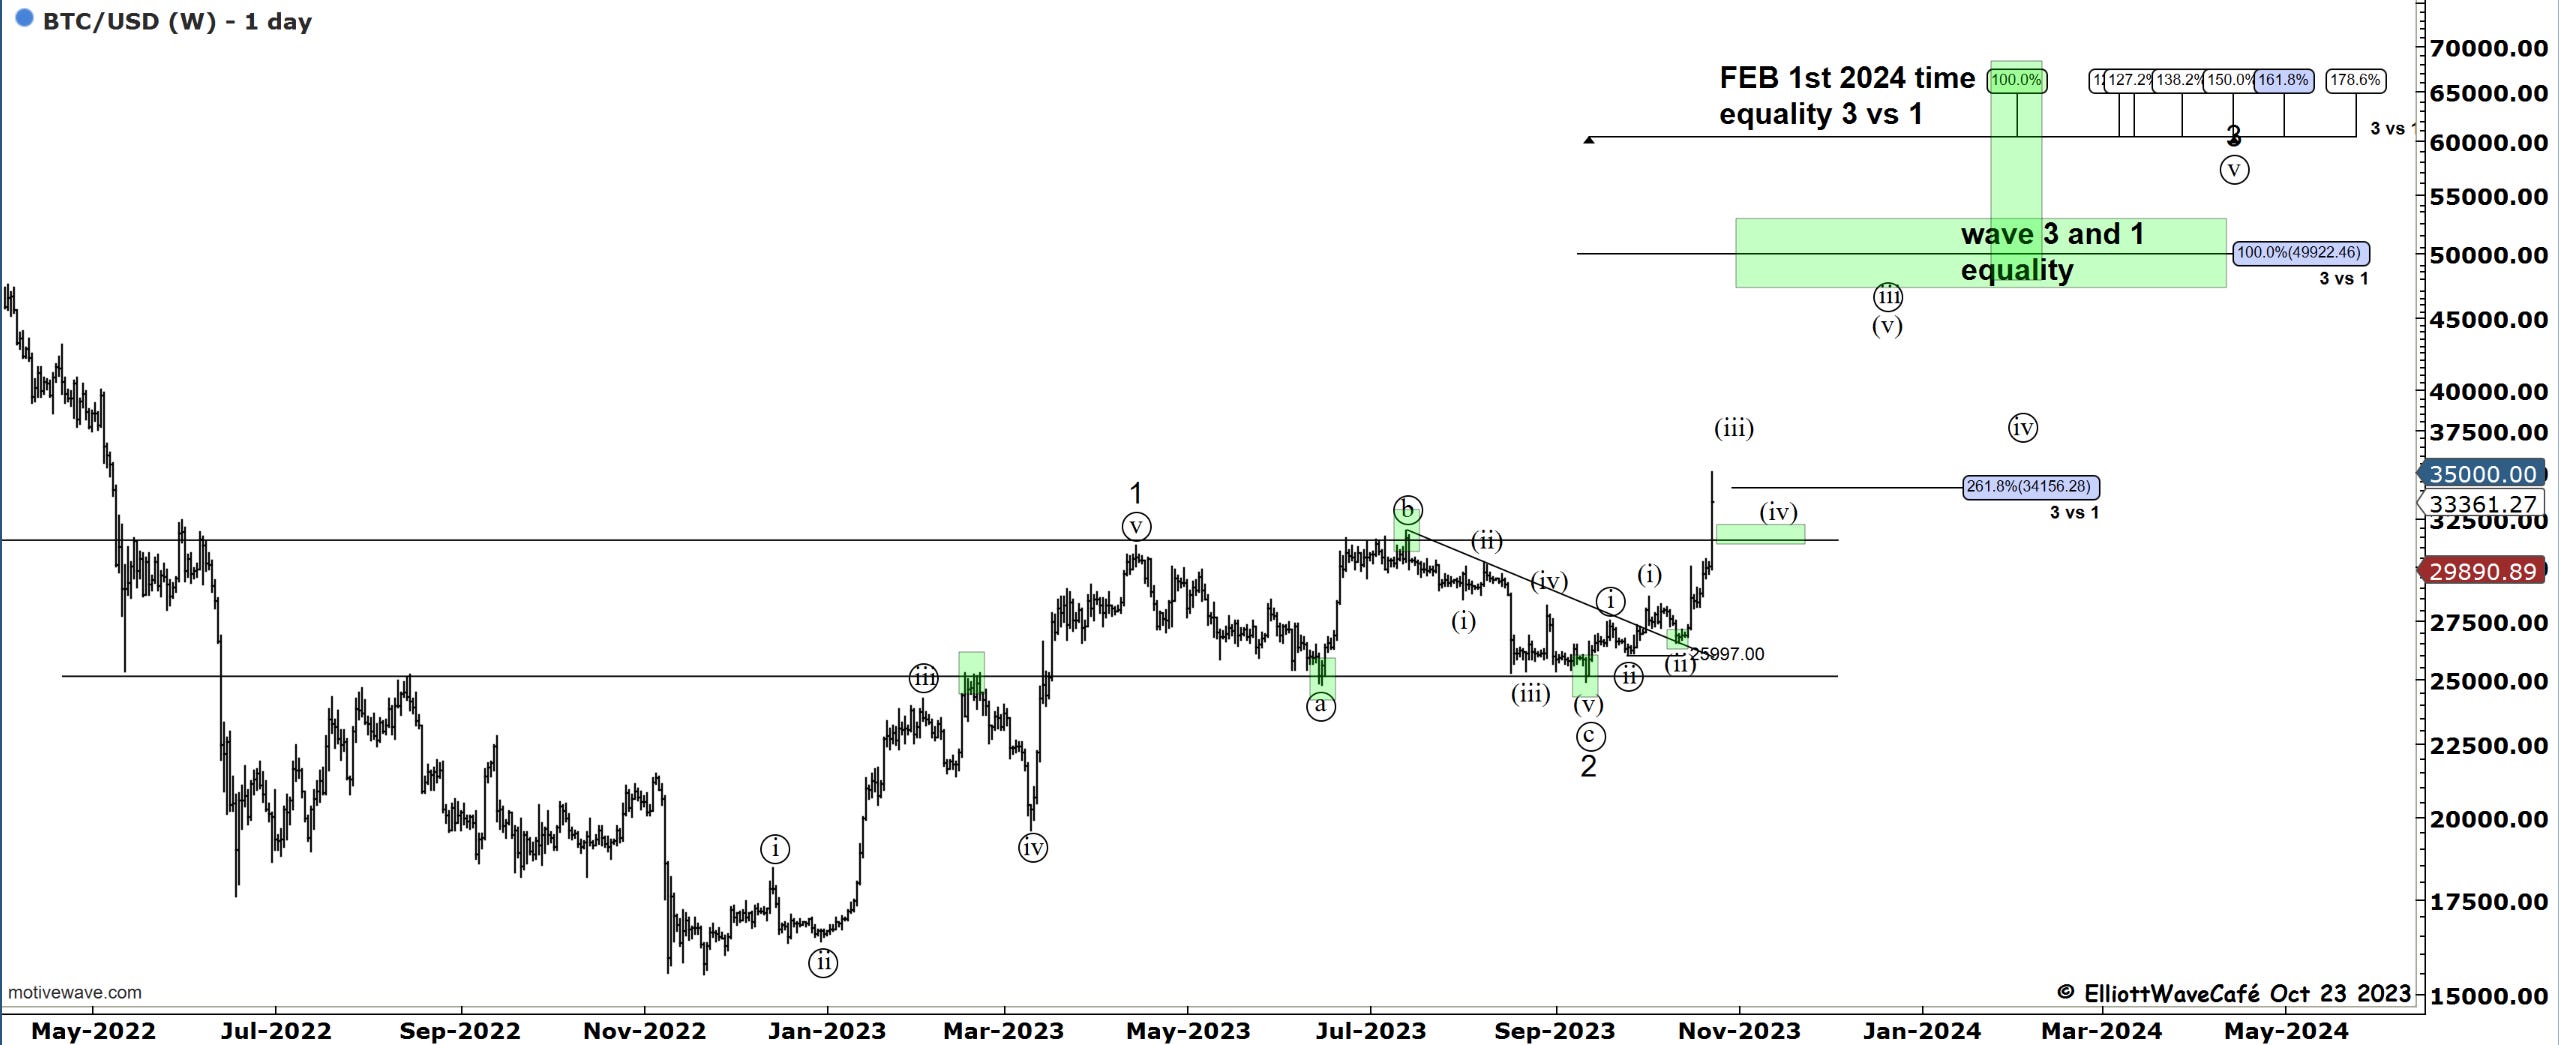
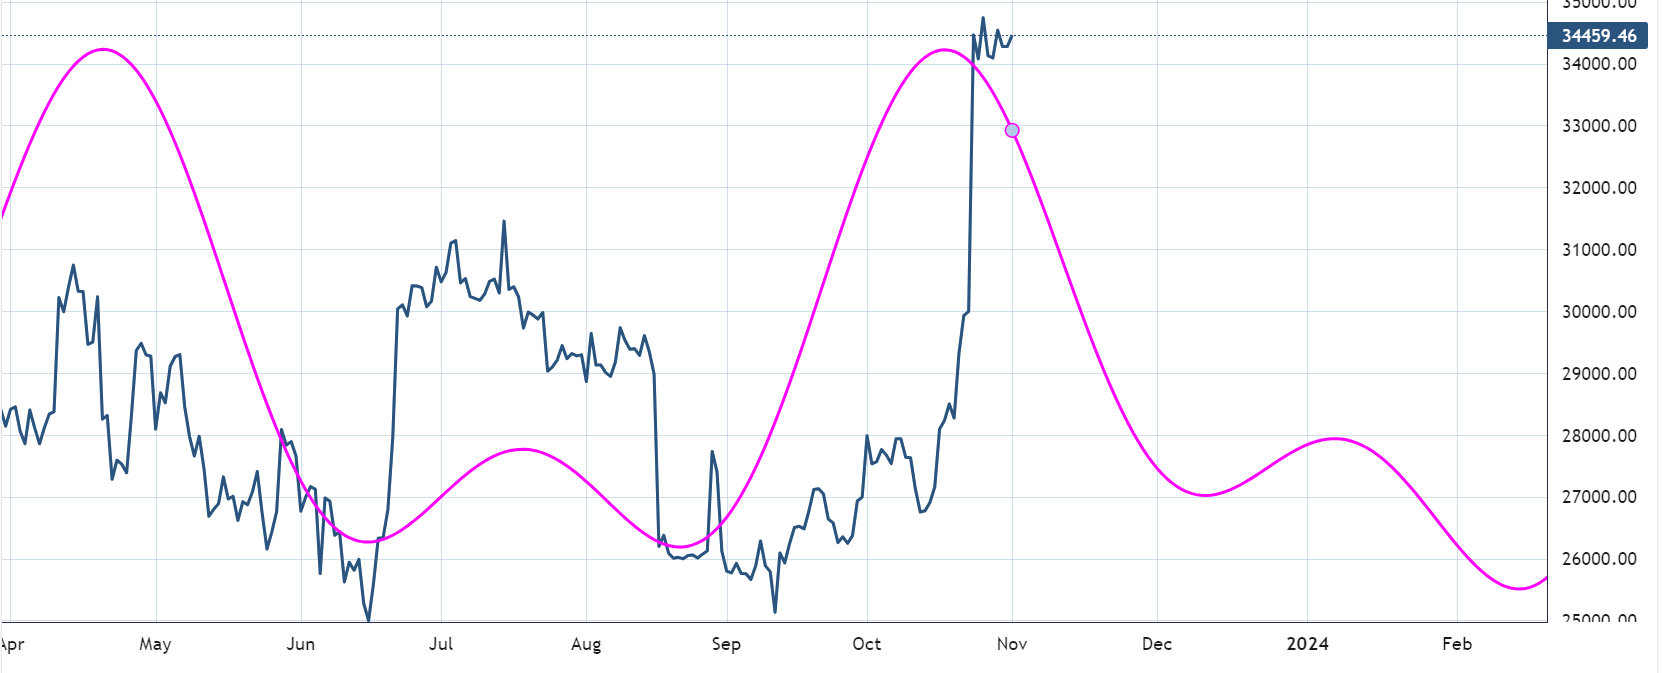
My cycle composite work suggests a period of upcoming weakness as well. Do not look at the price levels shown by the magenta line, but rather the time aspect of it.
Daily video coming up next,
See you all next week - trade well,
Cris
email: ewcafe@pm.me