Note: The counts on the right edge are real-time, and they are prone to adjustments as price action develops. Elliott Wave has a fluid approach, is evidence-based, and requires constant monitoring of certain thresholds.
In the counts below, this (( )) = circle on chart
SP500
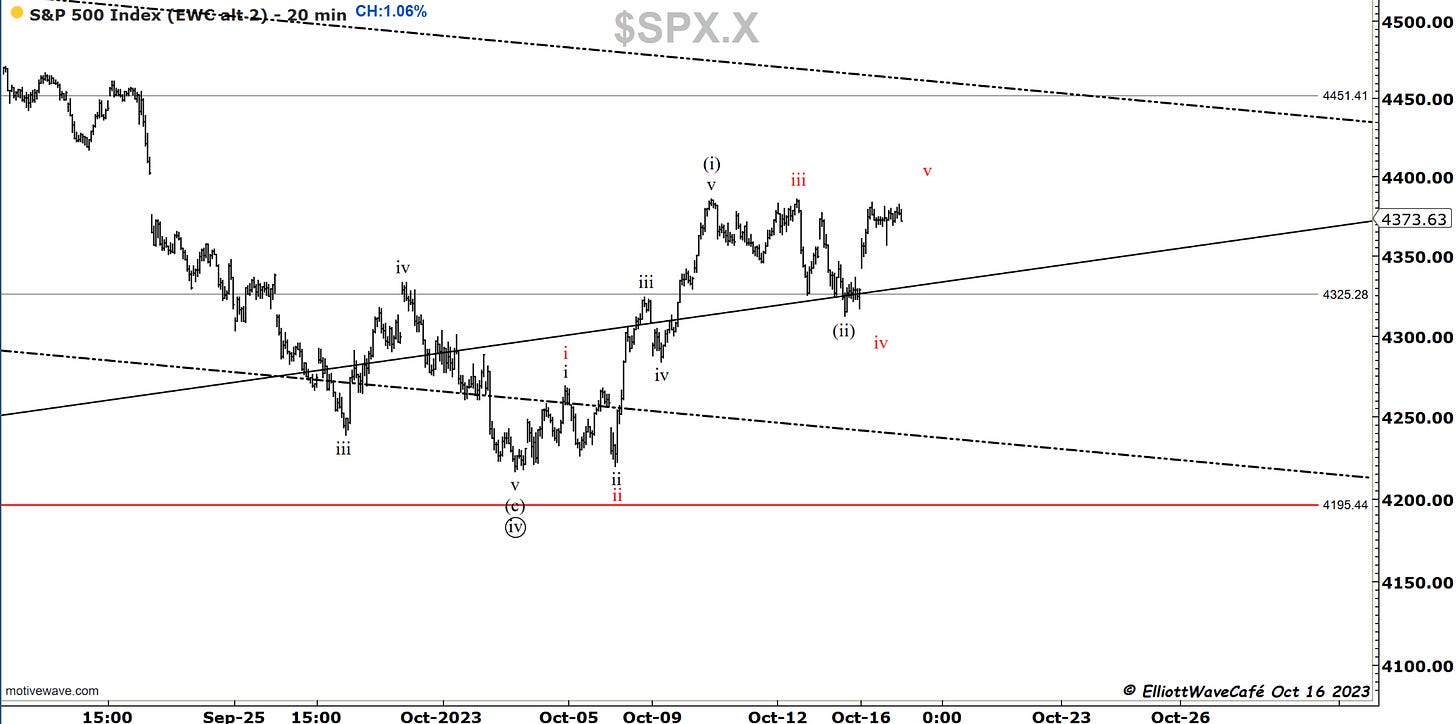
Over 1% rally today across indices with good participation from multiple sectors. Last week’s drop was a corrective move against an impulse that started on Oct 3rd. If this move was a wave (ii) then wave (iii) will surpass 4500. I am still contemplating a possible wave iv of (i) ( chart 2), instead of higher degree (ii) and that is only due to the the structure developing in Nasdaq. Under both scenarios, the roadmap is higher and only if we lose 4200 we would be looking at something different. ( I will discuss in video tonight).
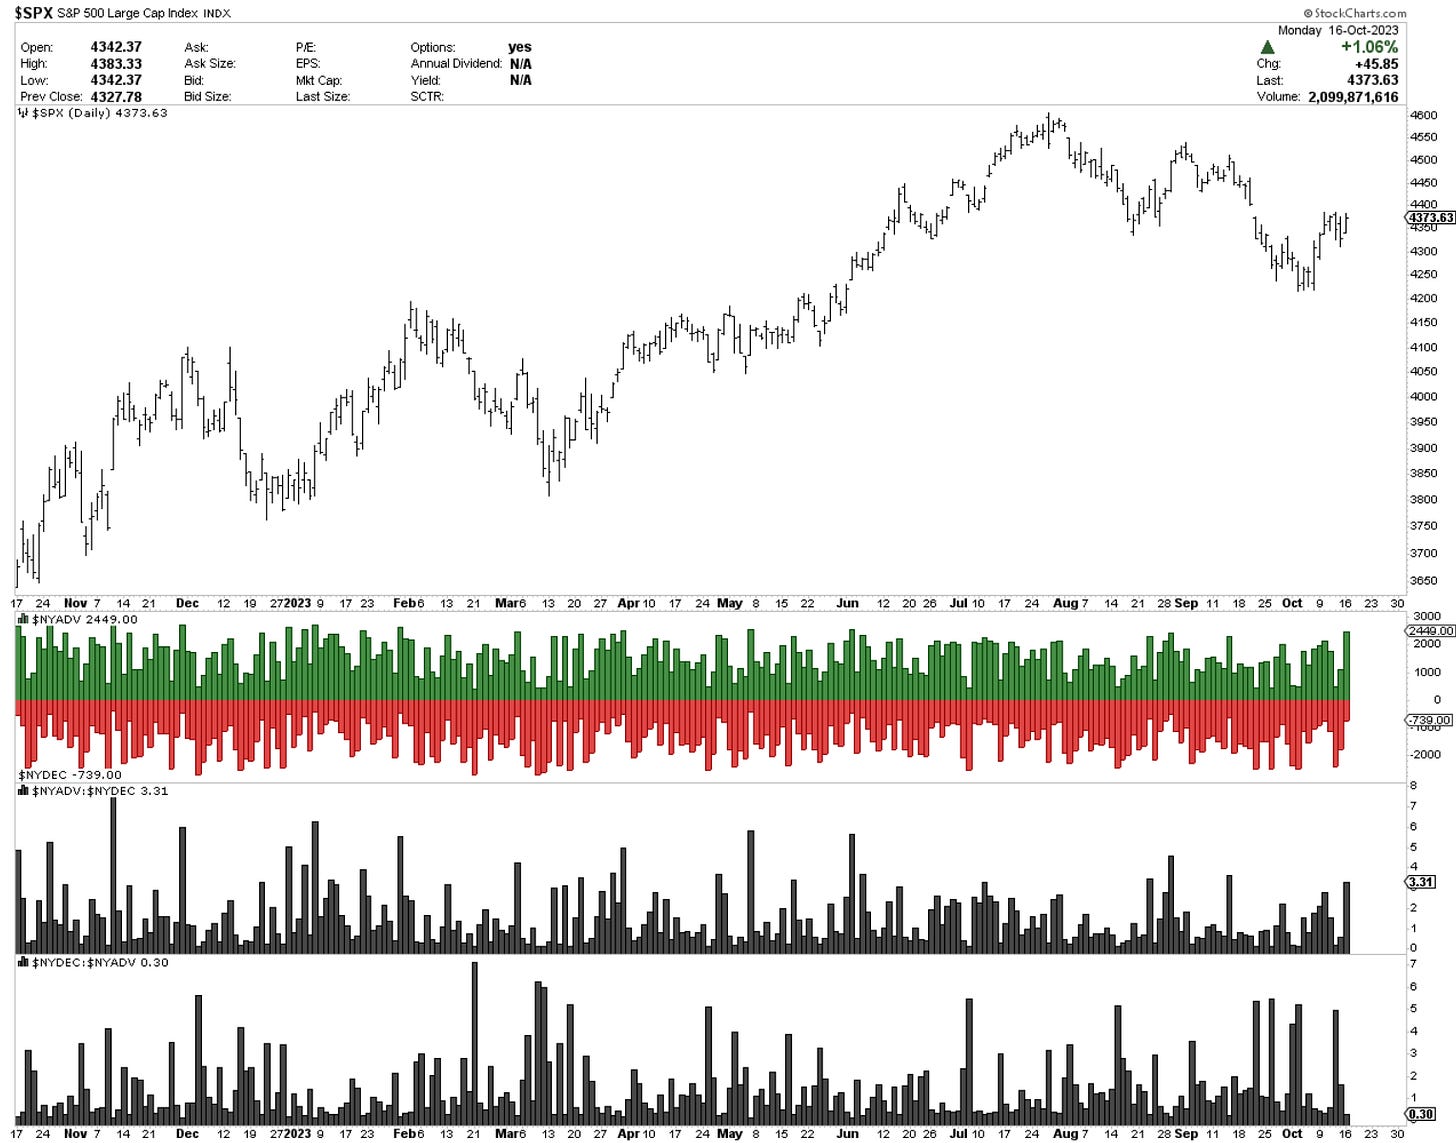
Here is today’s massive breadth advance with gaining stocks outpacing the losing ones by over 3 to 1.
Good strength at the sector level with participation from financials, discretionary and industrials. The beaten-down staples stocks recovered as well. We bought a few ourselves in the active positions tab.
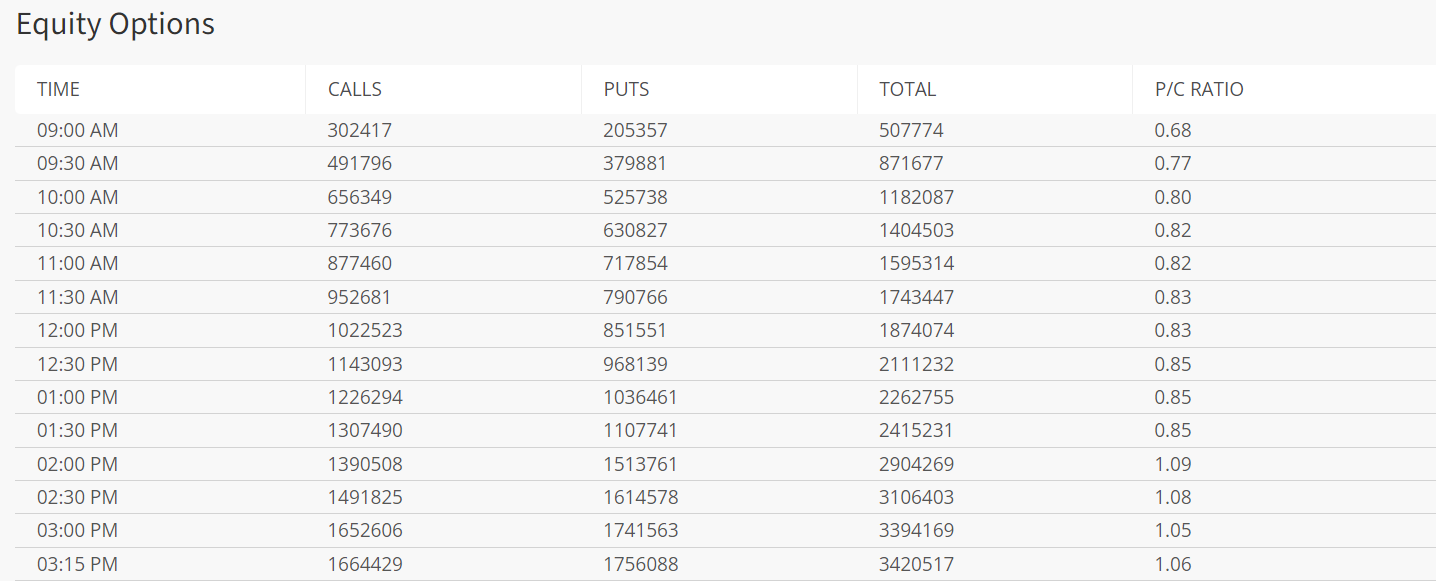
What is still somewhat surprising is the number of puts that continue to get bought on rallies, showing the lack of trust in a rising market. We started the day at 0.68 only to finish up at the highs near 1.04 - 1.06. In the second chart you can see the SP500 in pink and the constant put-buying in blue. Will this be further fuel for rallying further or will this massive put buying be rewarded? As we know most option buying expires worthless, I am curious about what happens here.
Check this out on the relationship between SPY and QQQ. The top pane displays the rounding bottom of the 2022 correction with a little handle on the right-hand side. I am not an expert in cup and handles but it is not something to ignore. The lower pane shows the relative ratio between the two. We’re at support from 2021 and 2022 right before the Qs started to show large outperformance. Does this mean the sp500 is about to catch up? We’ll find out, stay tuned.
Nasdaq100
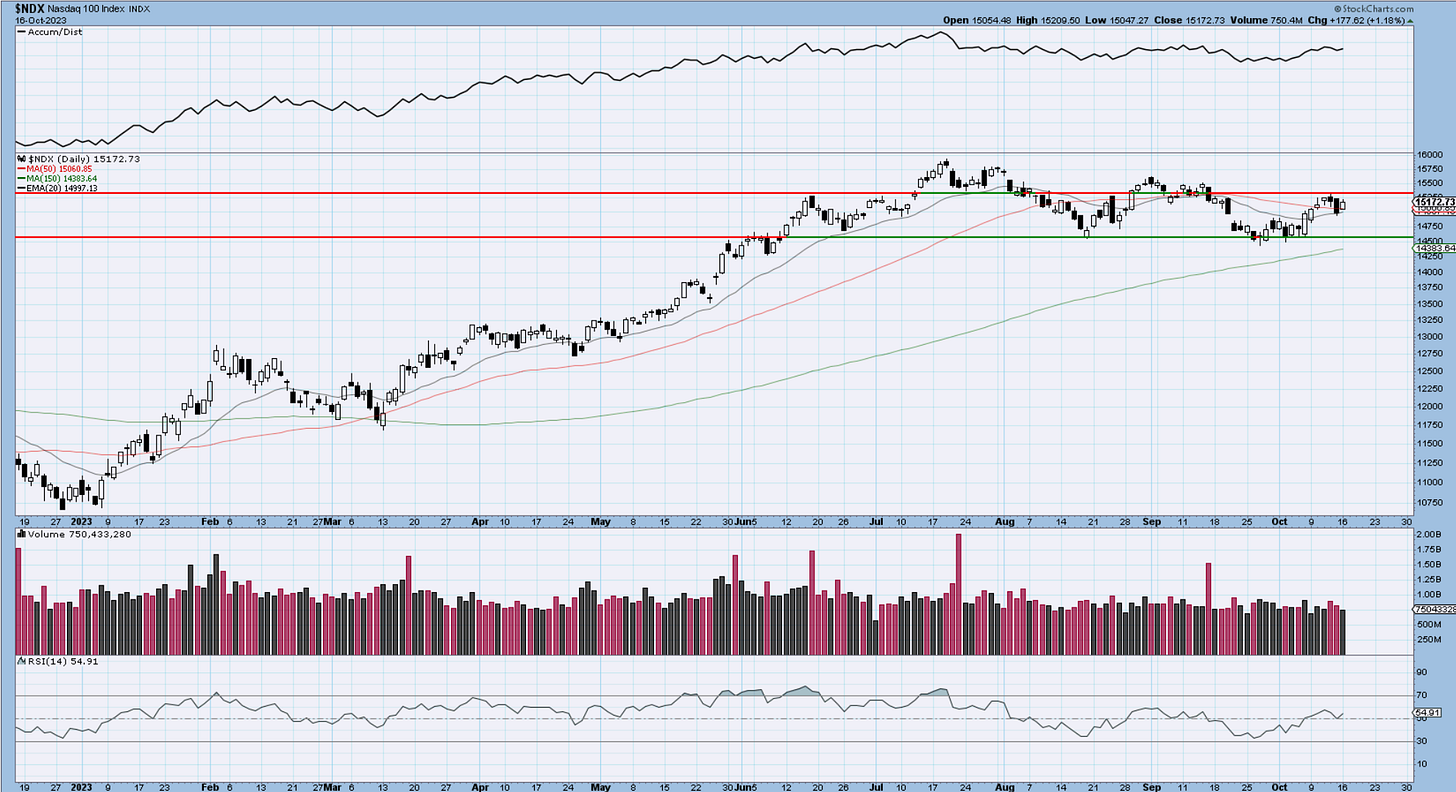
The drop in that suggested wave iv was quite large but never got into the territory of wave i. Even if we completed a wave (iii) alternate in red and we’re doing a wave (iv) currently, we’re still above wave (i). This is what I was saying above about the count in Nasdaq that does not seem to be in a higher degree wave two just yet. I could count it but the internal waves are too small to make the “right look” sense at this juncture. Without complicating things, we’ll stay on a 4th wave approach until we have enough reasons to believe it is not so. Due to the size of wave (ii), there is more room here for wave (iv) to develop, before we break higher above the channel.
Price has been in distribution mode since July but has started to tick up above the key moving averages. The resistance line remains in place for now and if bulls want to see this higher, they need to absorb all that overhead supply.
Dow30
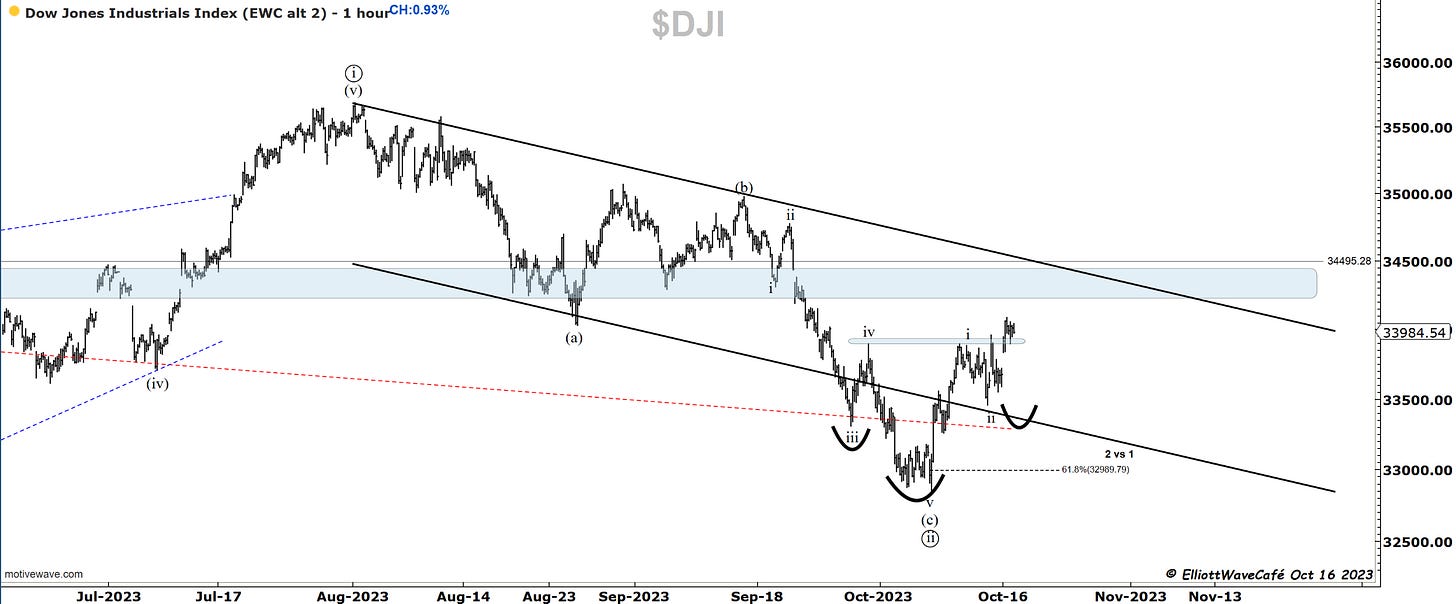
Dow finally broke above that blue line we were watching and started to confirm the reversal of the 33k levels. Here, a wave ii makes more sense. There is still a risk of a wave ii flat still ongoing, until the impulse gets bigger and we break 34,300 with more conviction.
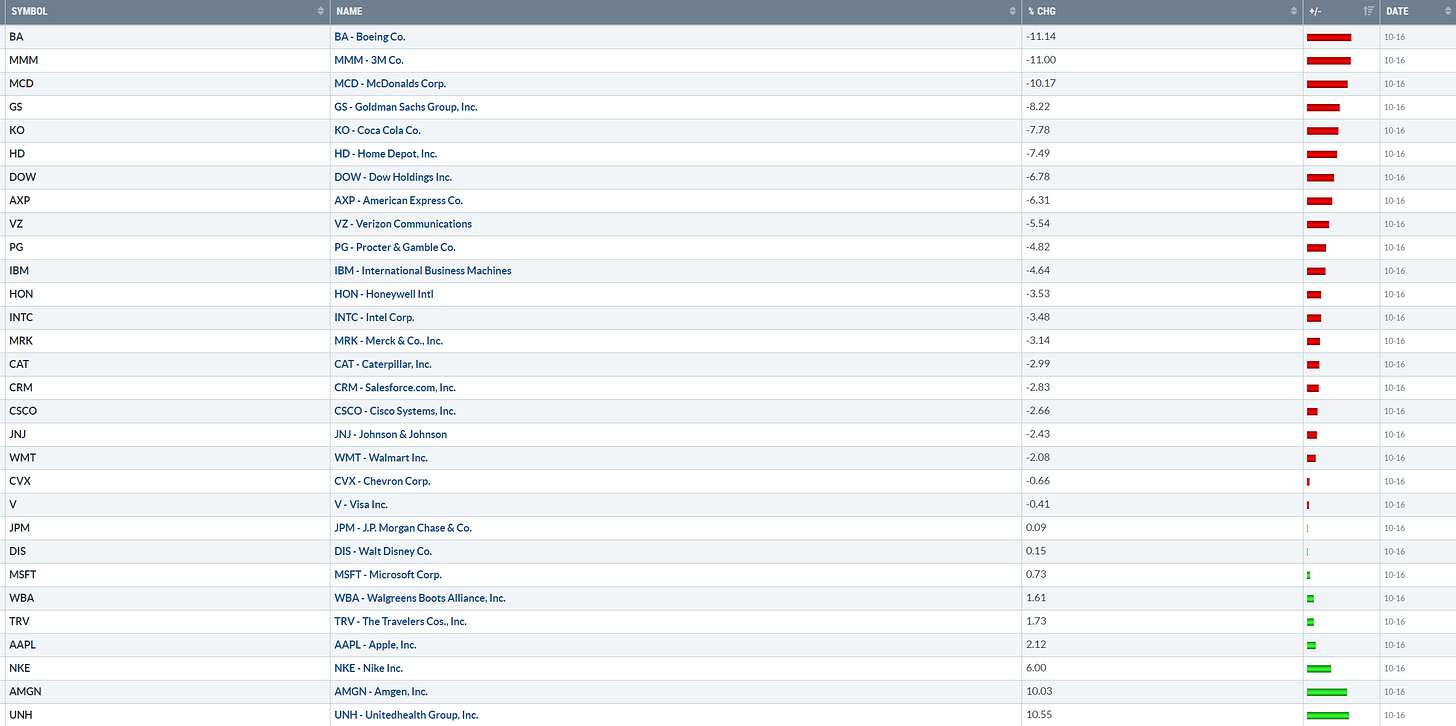
A lot of stocks in the Dow have taken it on the chin for the past few months (chart shows 1 mo perf), and by my work, they have started to stabilize and show signs of life. If they all start to push marginally higher I think Dow can have an impressive performance this quarter.
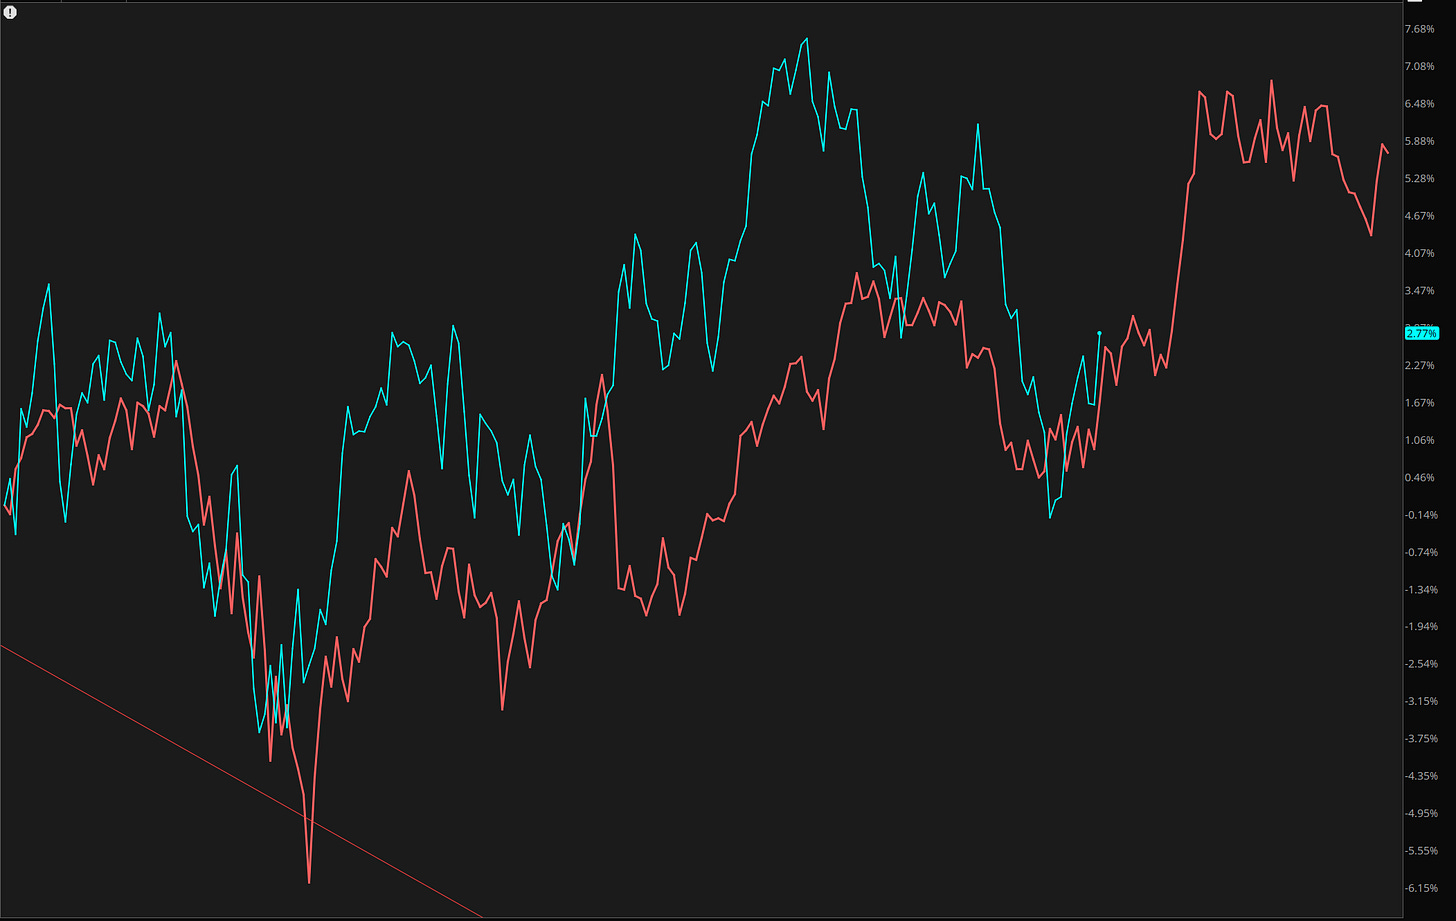
Seasonally ( red line) we’re supposed to be doing great until the year ends.
By the way, take a look at the COT ( commitment of traders) positioning on the speculator side. Massive short positions the likes this index has not seen before.
US Dollar
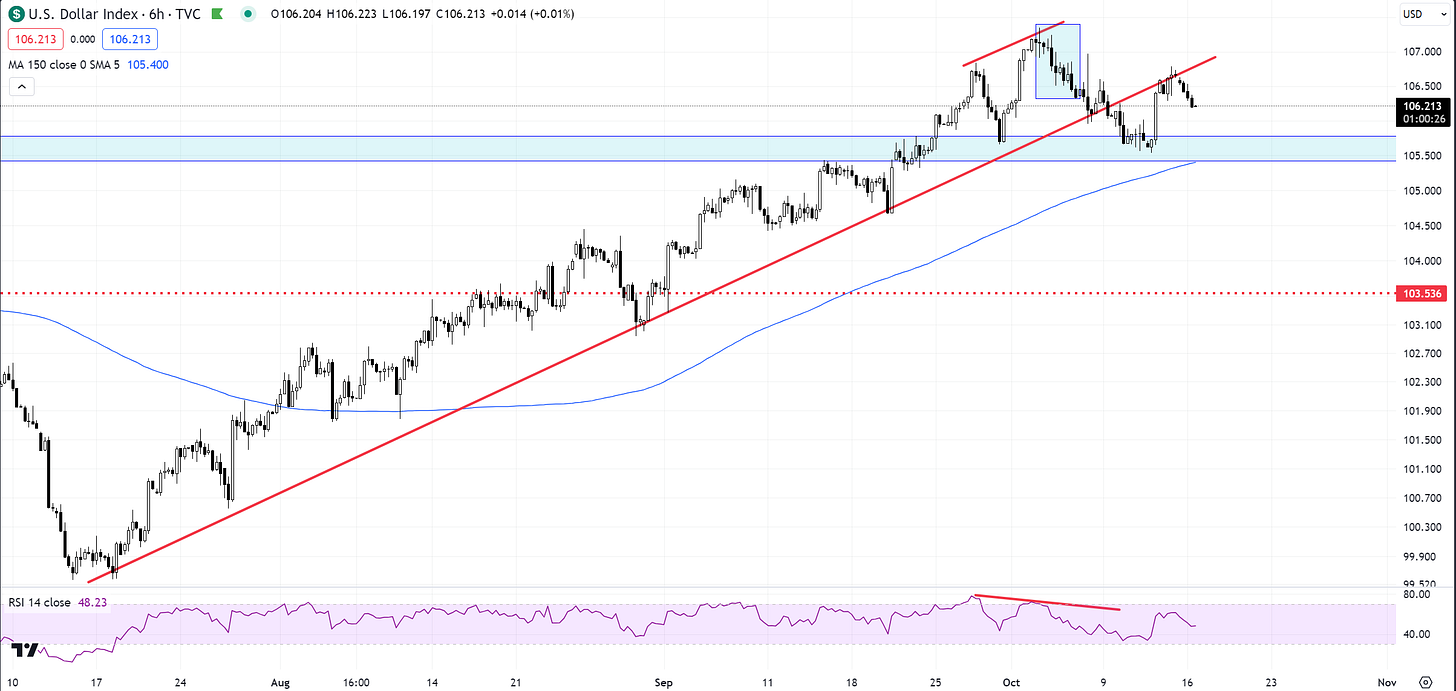
The dollar tried to rally but was rejected just as it was trying to get back above the broken trendline. Usually that means a retest and the move lower will resume. There is a small head and shoulders as well on the price structure. If we can get below 105.50, the selling will accelerate and provide a boost to risk on assets. ( stocks, crypto, emerging markets).
Gold
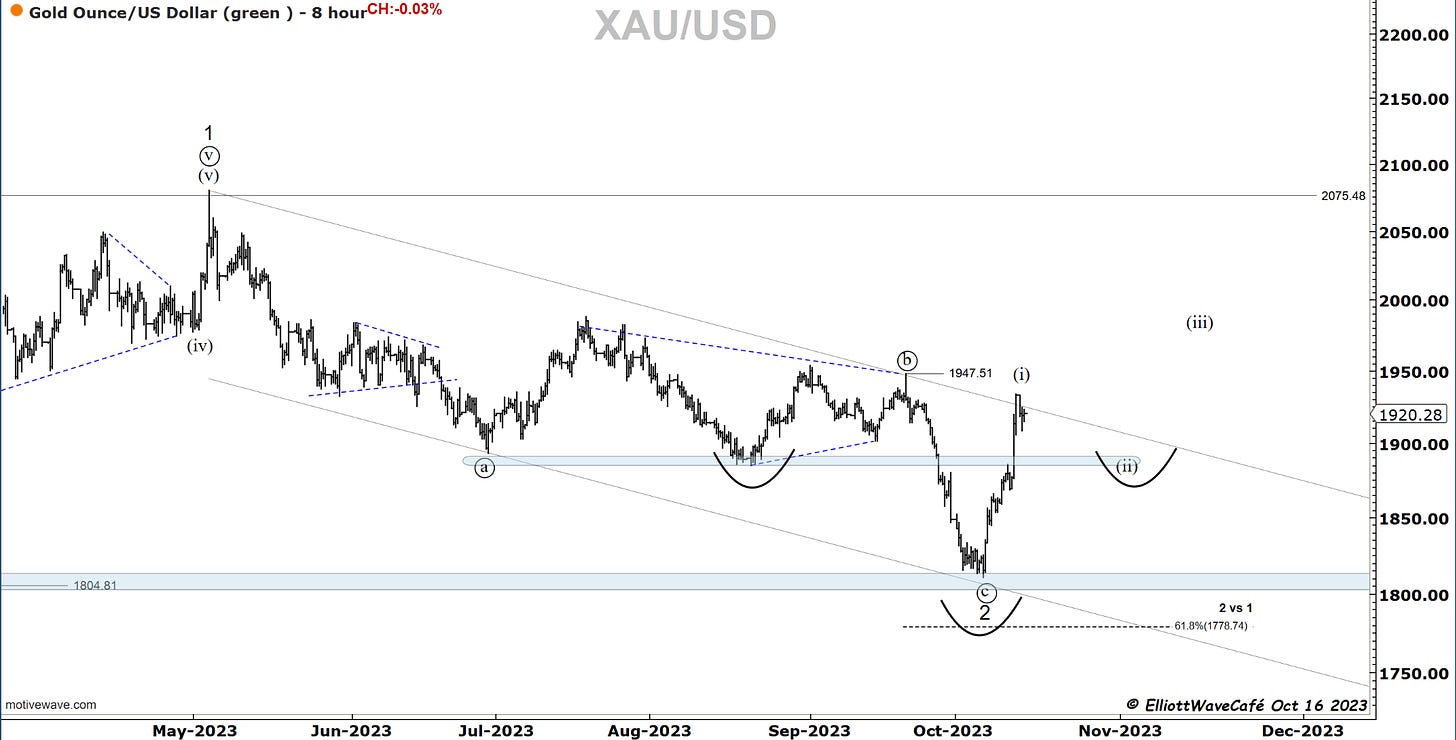
A very strong rally extended that suggested wave (i) towards 1930. We have yet to overtake the ((b)) wave tip at 1947 but I think the move is strong enough to suggest it should have some continuation after a normal correction takes place. It’s a V type of a rally and my thinking is that it would try to balance out with some slower moves to the right into a “right shoulder". Notice the channel trendline as well and why it is such an obvious level for it to find offers.
If this price action holds and we do not fail as gold does many times, there is a lot of room to go and the triple top will cease to exist. I am willing to start buying gold on pullbacks with stops below 1800. You will see it in the active positions once I do.
Bitcoin
Bitcoin held well the retest of the broken trendline and eliminated the 3wave risk mentioned in prior updates. The 26k zone was never taken out and instead, we spiked higher towards 30k. It was a news-induced event, but whatever caused it, the reality on the chart remains that we had an explosive move higher characteristic to a 1,2 1,2 setup.
Short of a complete reversal of current price action, which is always a risk, a trader who does not read the news, would expect a continuation higher based on the chart and count setup. I would use 26,500 as defense and not a penny lower. Anything below those levels would indicate a high probability of a completed reversal lower. It is the bulls job now to continue bidding on this and proving that the breakout is real and worth considering. I will be personally waiting and watching how they behave here and even if I join higher, it’s a price I am willing to pay for a bit more assurance.
My latest BTC video update is on you tube and you can check it out here
Daily video coming up next,
See you tomorrow- trade well,
Cris
email: ewcafe@pm.me


