
The Daily Drip
Markets review, strategy and analysis
Note: The EW counts on the right edge are real-time, and they are prone to adjustments as price action develops. Elliott Wave has a fluid approach, is evidence-based, and requires constant monitoring of certain thresholds.
In the counts below, this (( )) = circle on chart
Chart of the Day—STX—A three-wave setback is now giving way to a chance for a higher breakout in this stock. A break of 98 would trigger the first buy point, followed by the 100.44 mark.
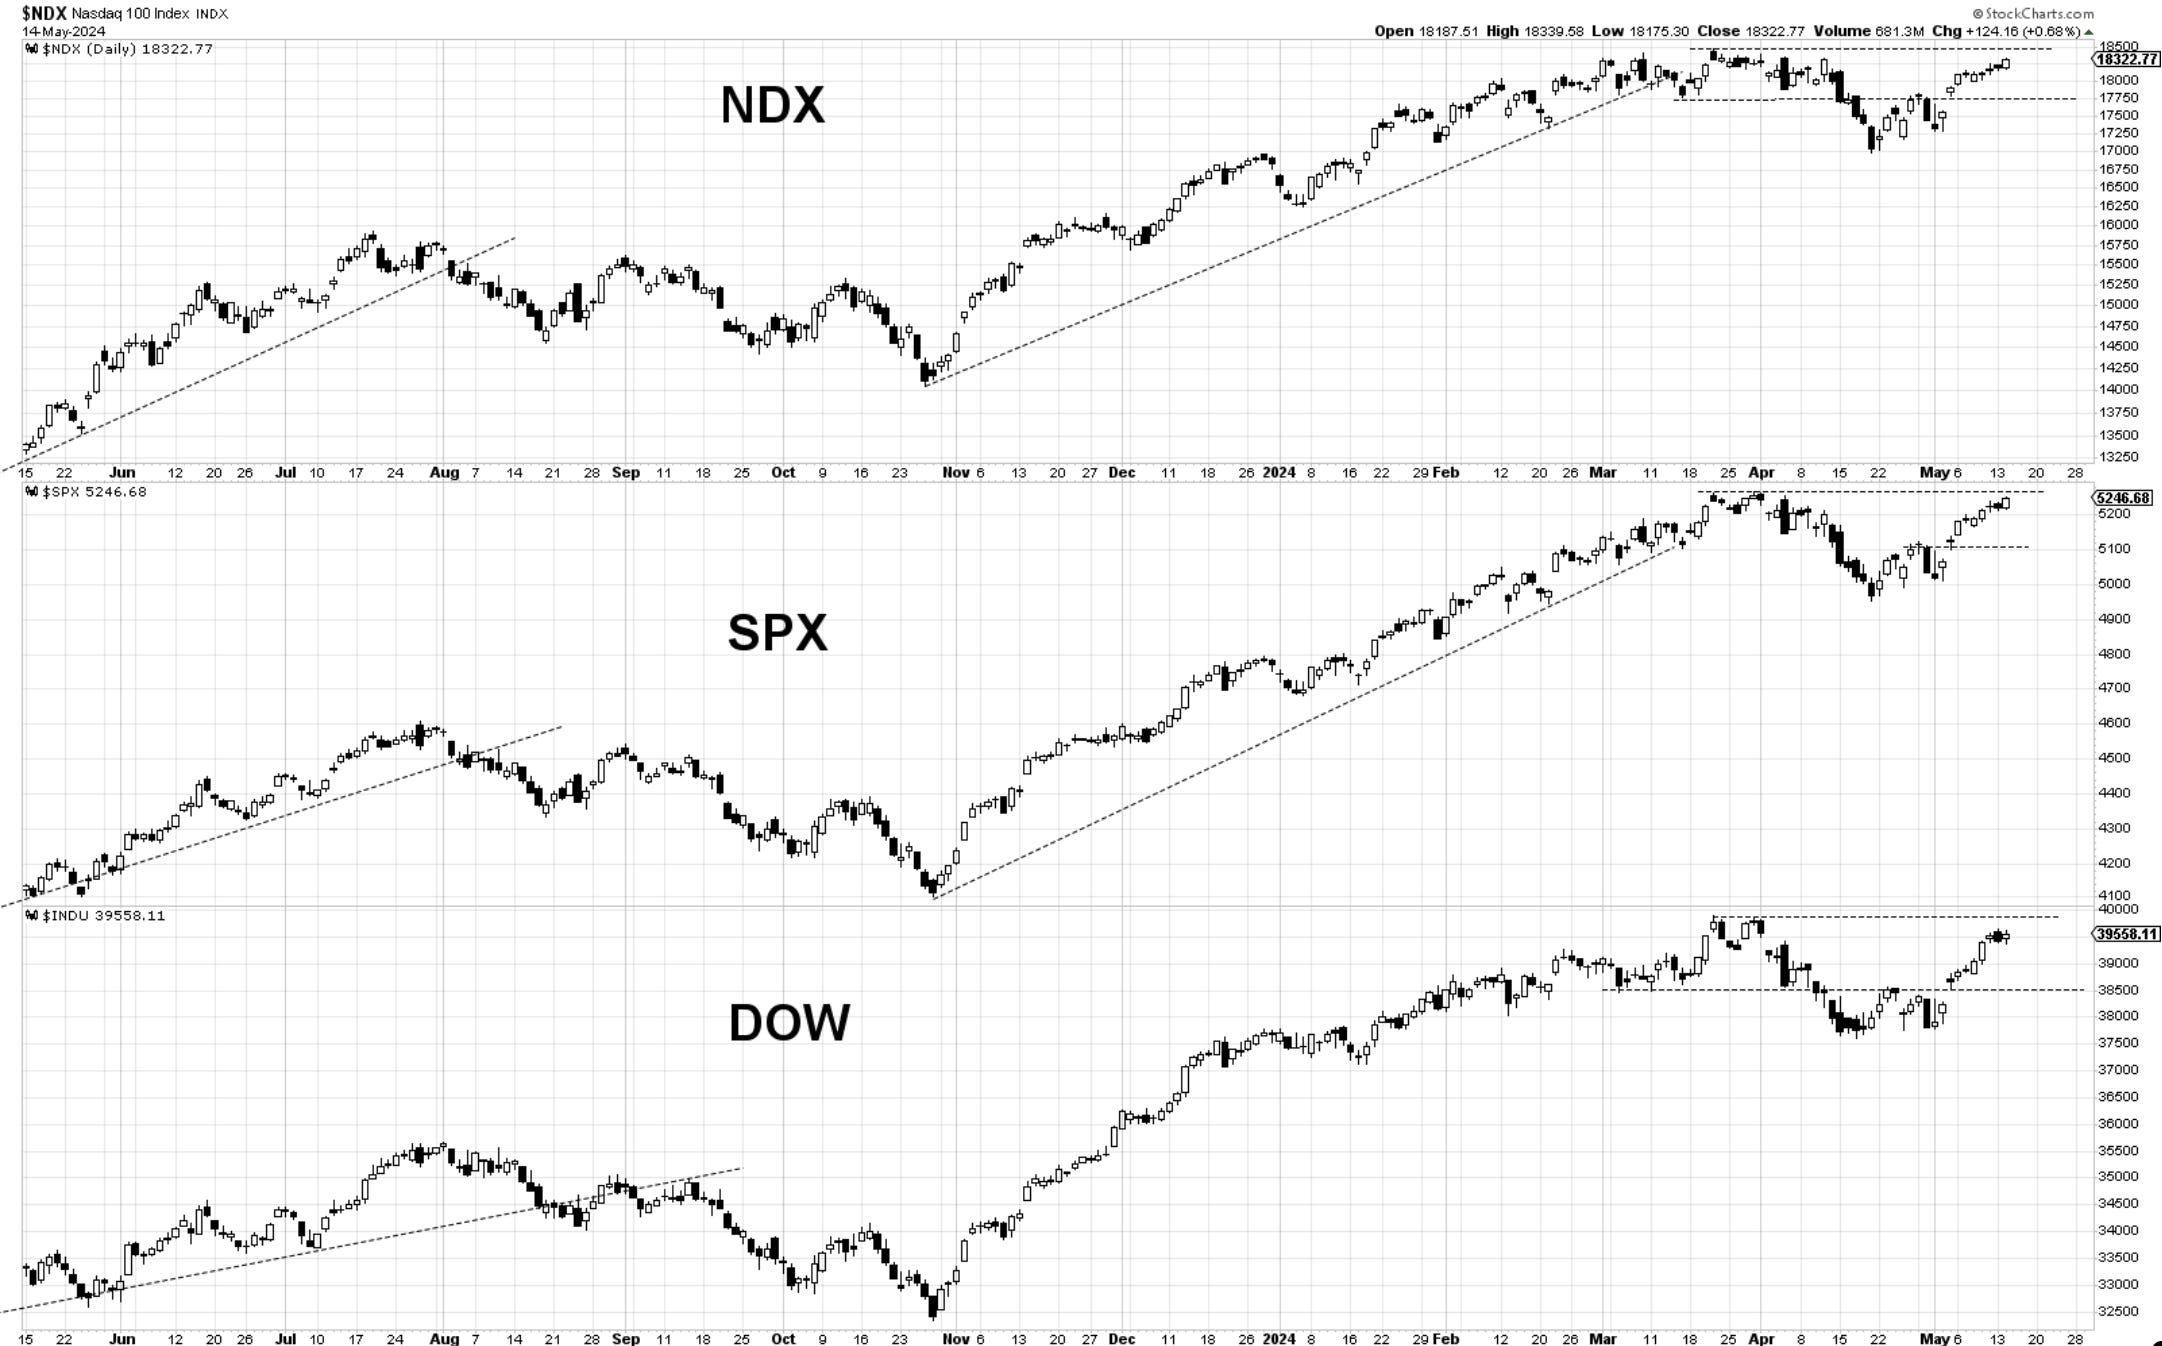
Bottom Line: With CPI data looming, the markets are within inches of breaking their all-time highs. We have been growing long exposure since the failed decline of May 2nd. The tape continues to favor the bullish side, and exposure will increase when the high breakout occurs.
Let’s now dive into charts and further analysis below… then the Double Shot daily video.
