
The Daily Drip
Core markets charts updates and commentary
Note: The counts on the right edge are real-time, and they are prone to adjustments as price action develops. Elliott Wave has a fluid approach, is evidence-based, and requires constant monitoring of certain thresholds.
In the counts below, this (( )) = circle on chart
SP500
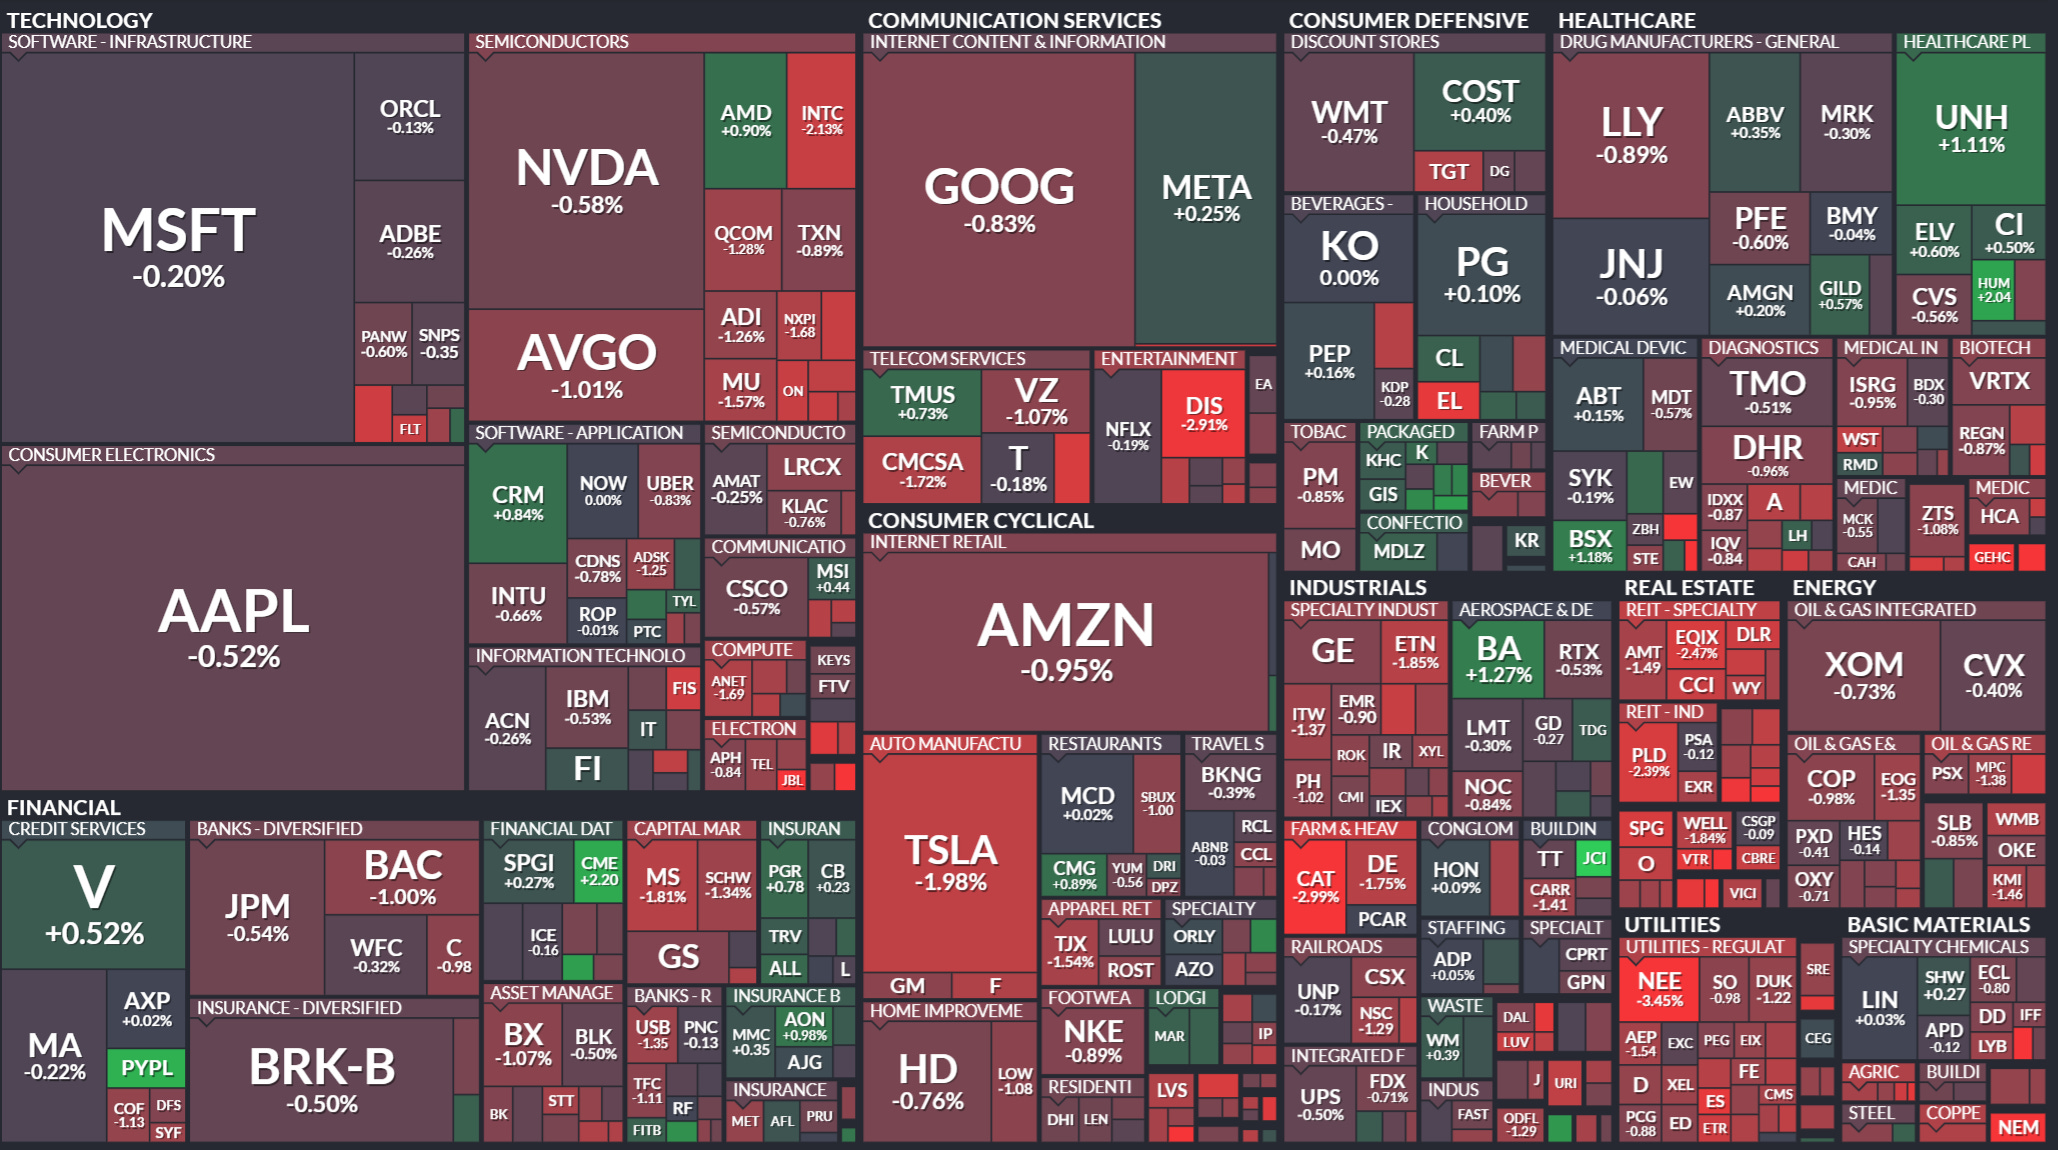
The market, as represented by the SP500, fell -1.05% at the lows of the day. It has managed to recover half of those losses in the after-lunch session. The larger weight stocks were the main culprit, but there were also declines across the board, similar to yesterday in terms of percentages. Over 75% of stocks across exchanges were falling on increasing volume. The market is behaving as per my expectations, which I have explained here over the course of multiple posts since mid-December. I continue to expect further deterioration and corrective pricing for another month at a minimum. There could be bounces along the way and even attempts at the highs, but they will be opportunities to sell and unload long positions.
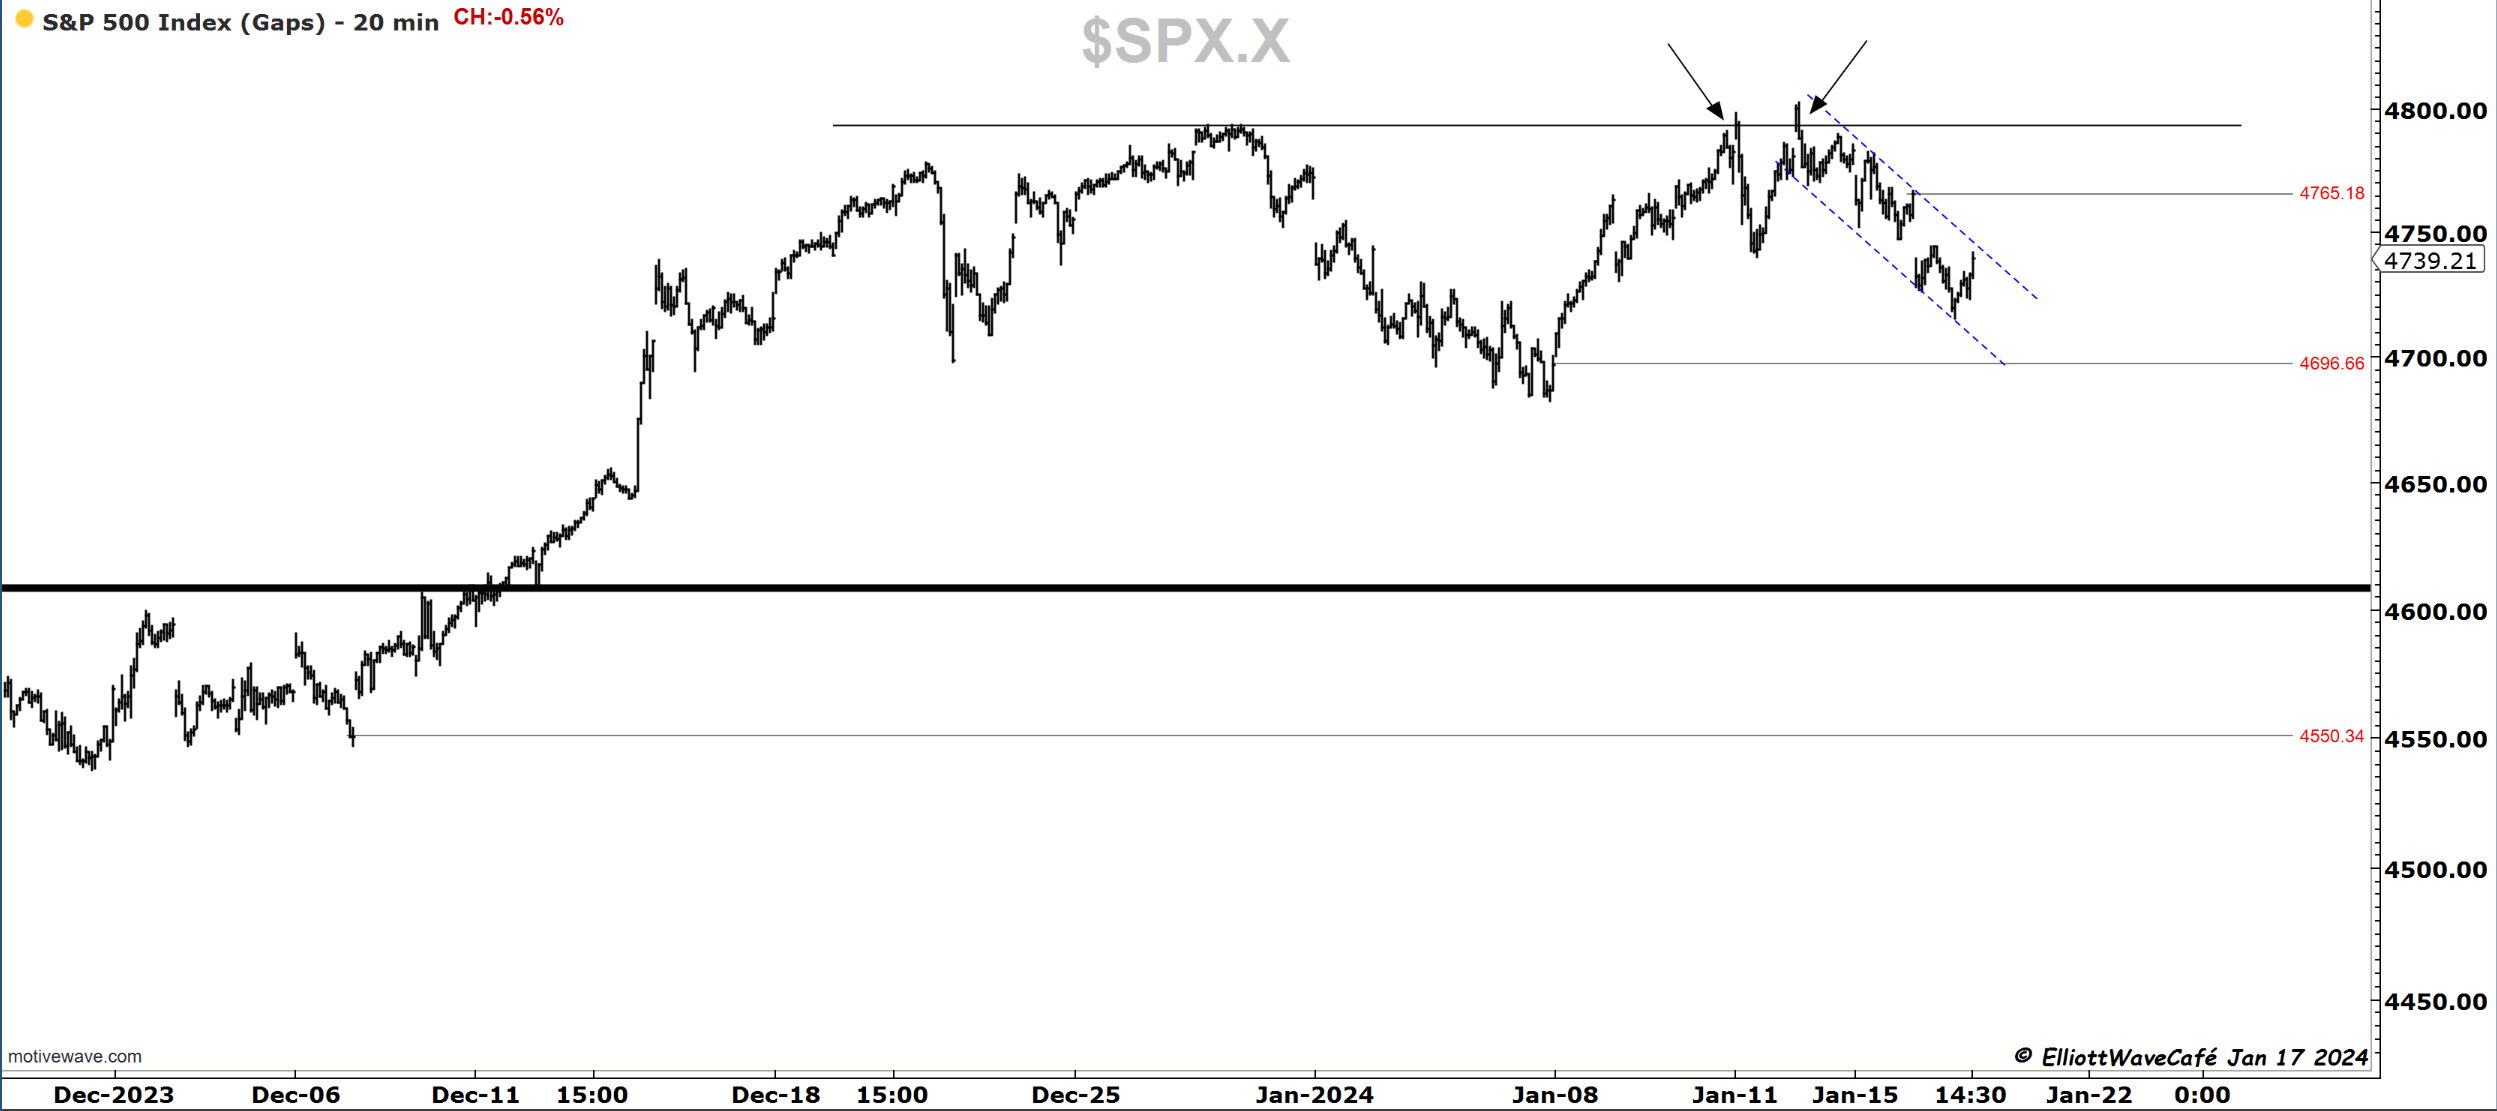
Here is the short-term channel in the SP500 with a series of lower lows and lower highs. You can also notice in red few unfilled gaps that live nearby. The large black line is the targeted support at 4600. The 2 arrows show price failures on breakout attempts.
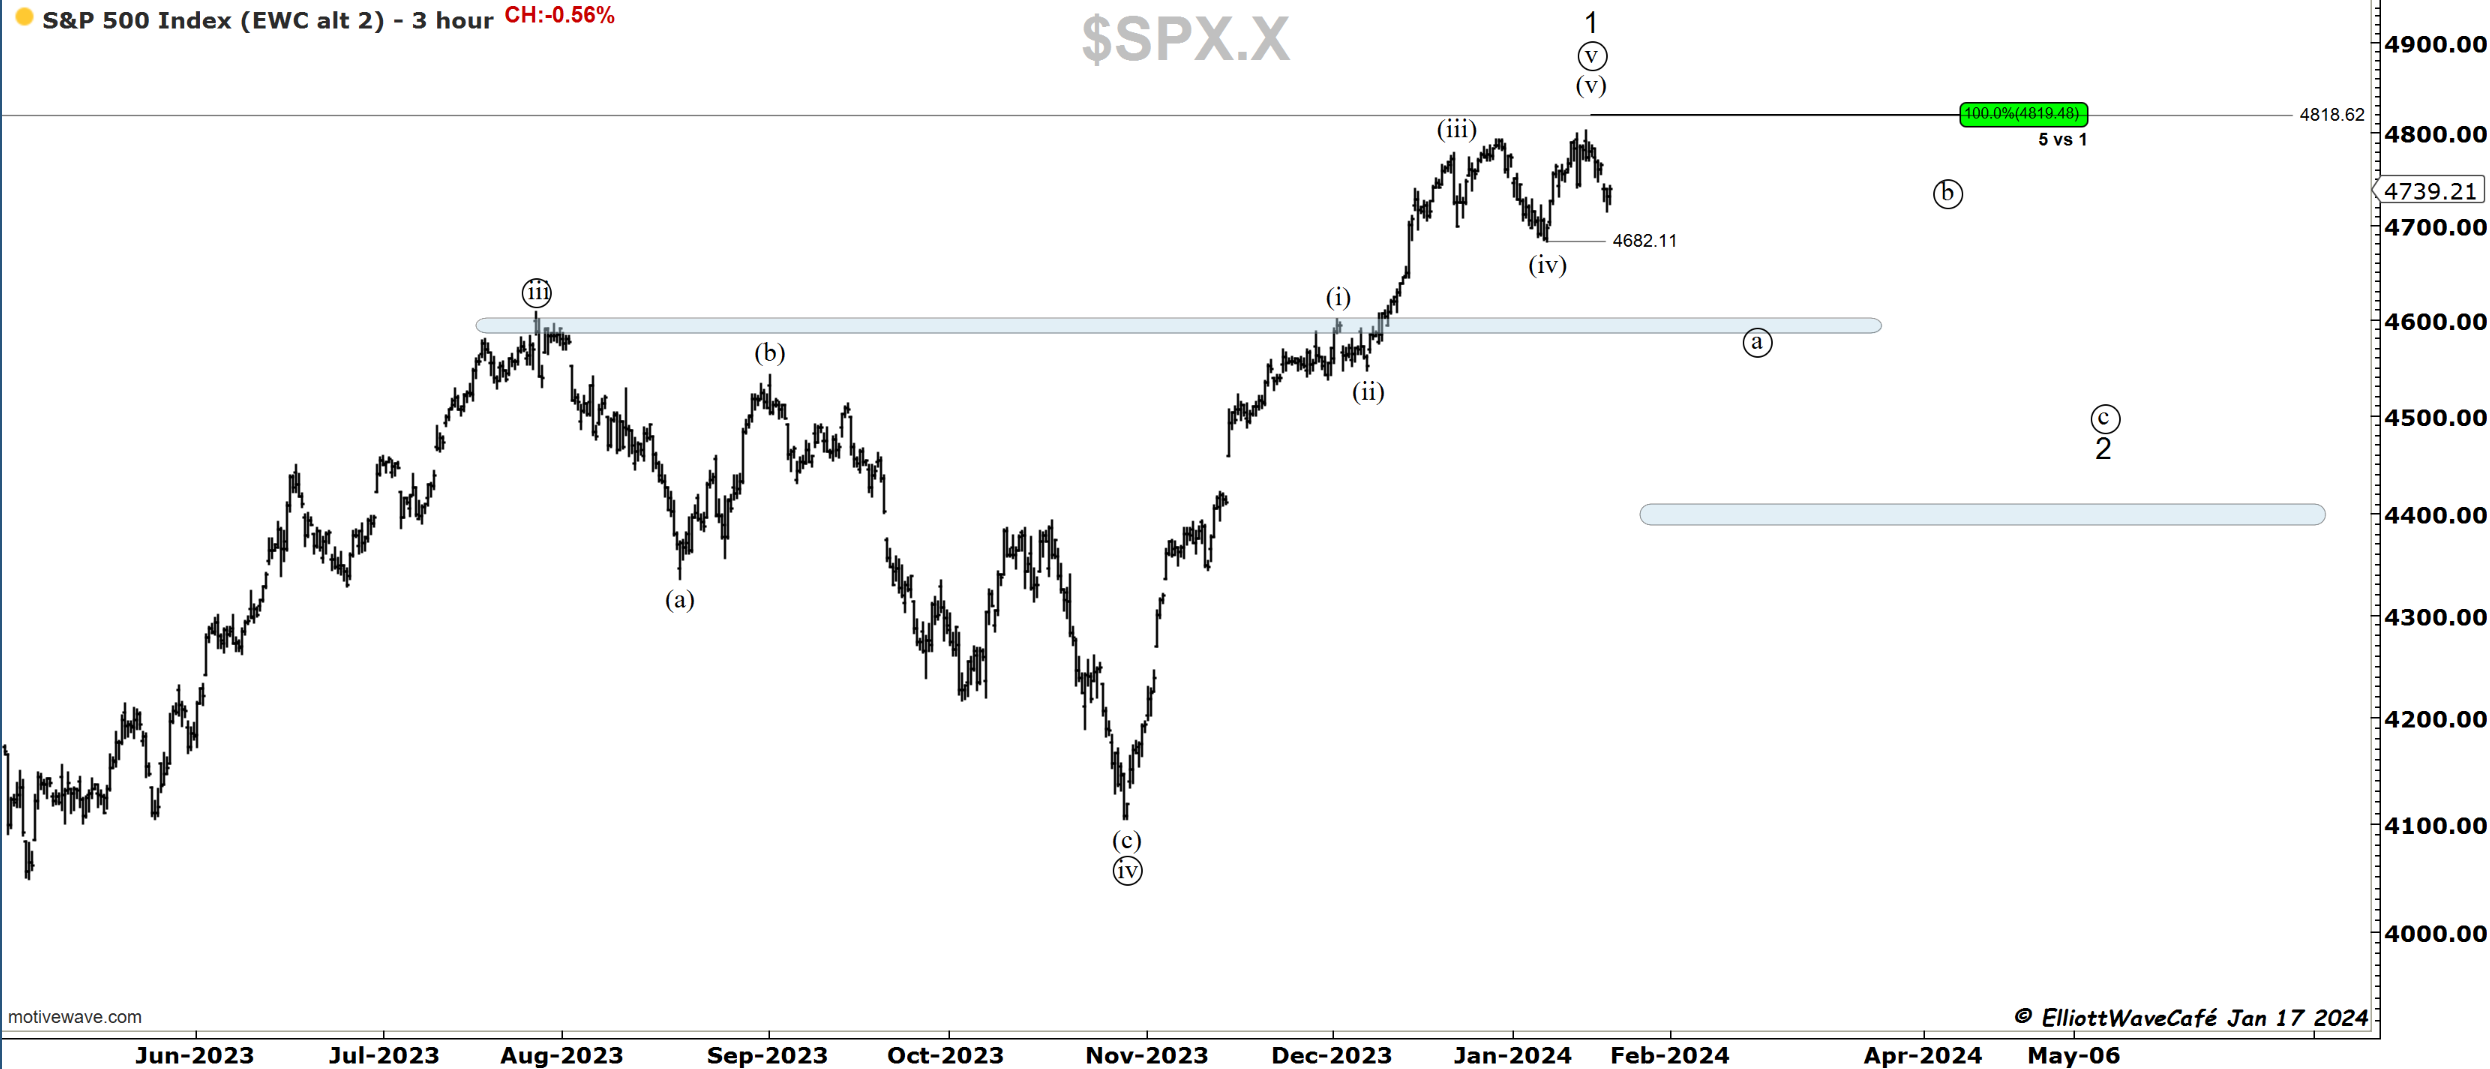
I don't think we have yet established a proper wave ((a)) decline. The small wave structure from the top has motive wave characteristics but is not fully developed in my view. We need further acceleration.
Here is a look at how the Major markets have all lost their uptrend and are now coming to meet their 150-day MA eventually. The XVG index, which is the equally weighted index of approx 1500 stocks, is the first one to get near it.
The top panel below is the relative ratio of equal-weighted SP500 RSP vs cap-weighted SPY. There was a major breadth of participation and excitement about all the stocks participating in a possible new “bull market.” This is shown with RSP outperforming SPY for the last couple of months of 2023. Since 2024 started, this has completely reversed, sending that ratio back lower. Once again, we have deterioration and weak breadth in multiple industries. I will continue to monitor this behavior as one of the weakest months of the year is approaching. To correct the entire advance from late last year, the current pullback is insufficient. I see RSP towards 145 and SPY towards 450.
Nasdaq100
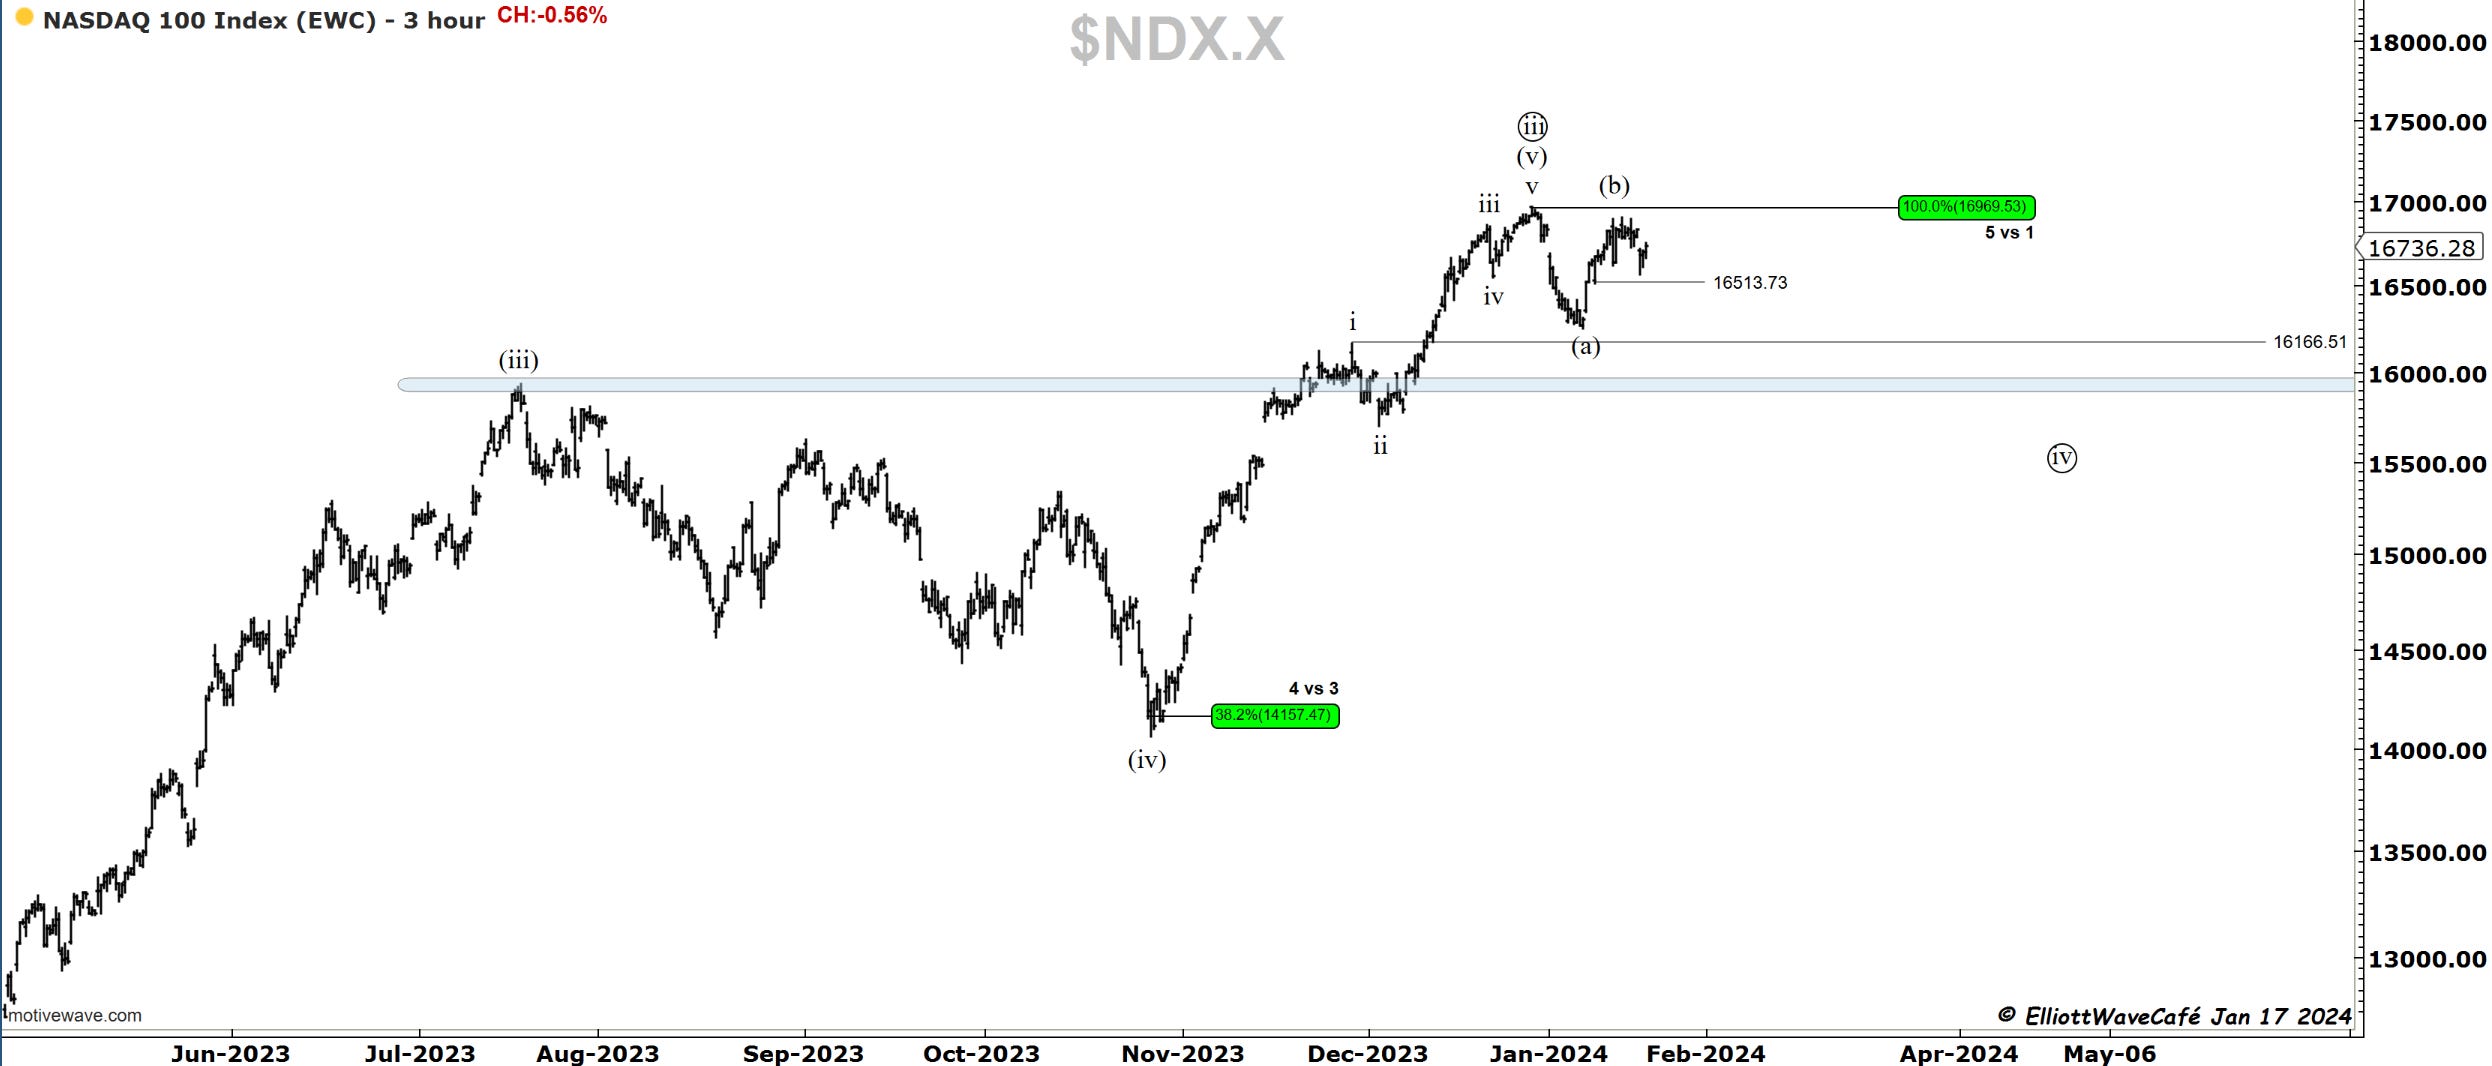
We sold off -1.6% at the lows today. We have recovered more than half that by the time the session was over. Notice the three attempts to break 16,900. There could be an attempt to close that gap at 16,833. It is right to press the downside below that level.
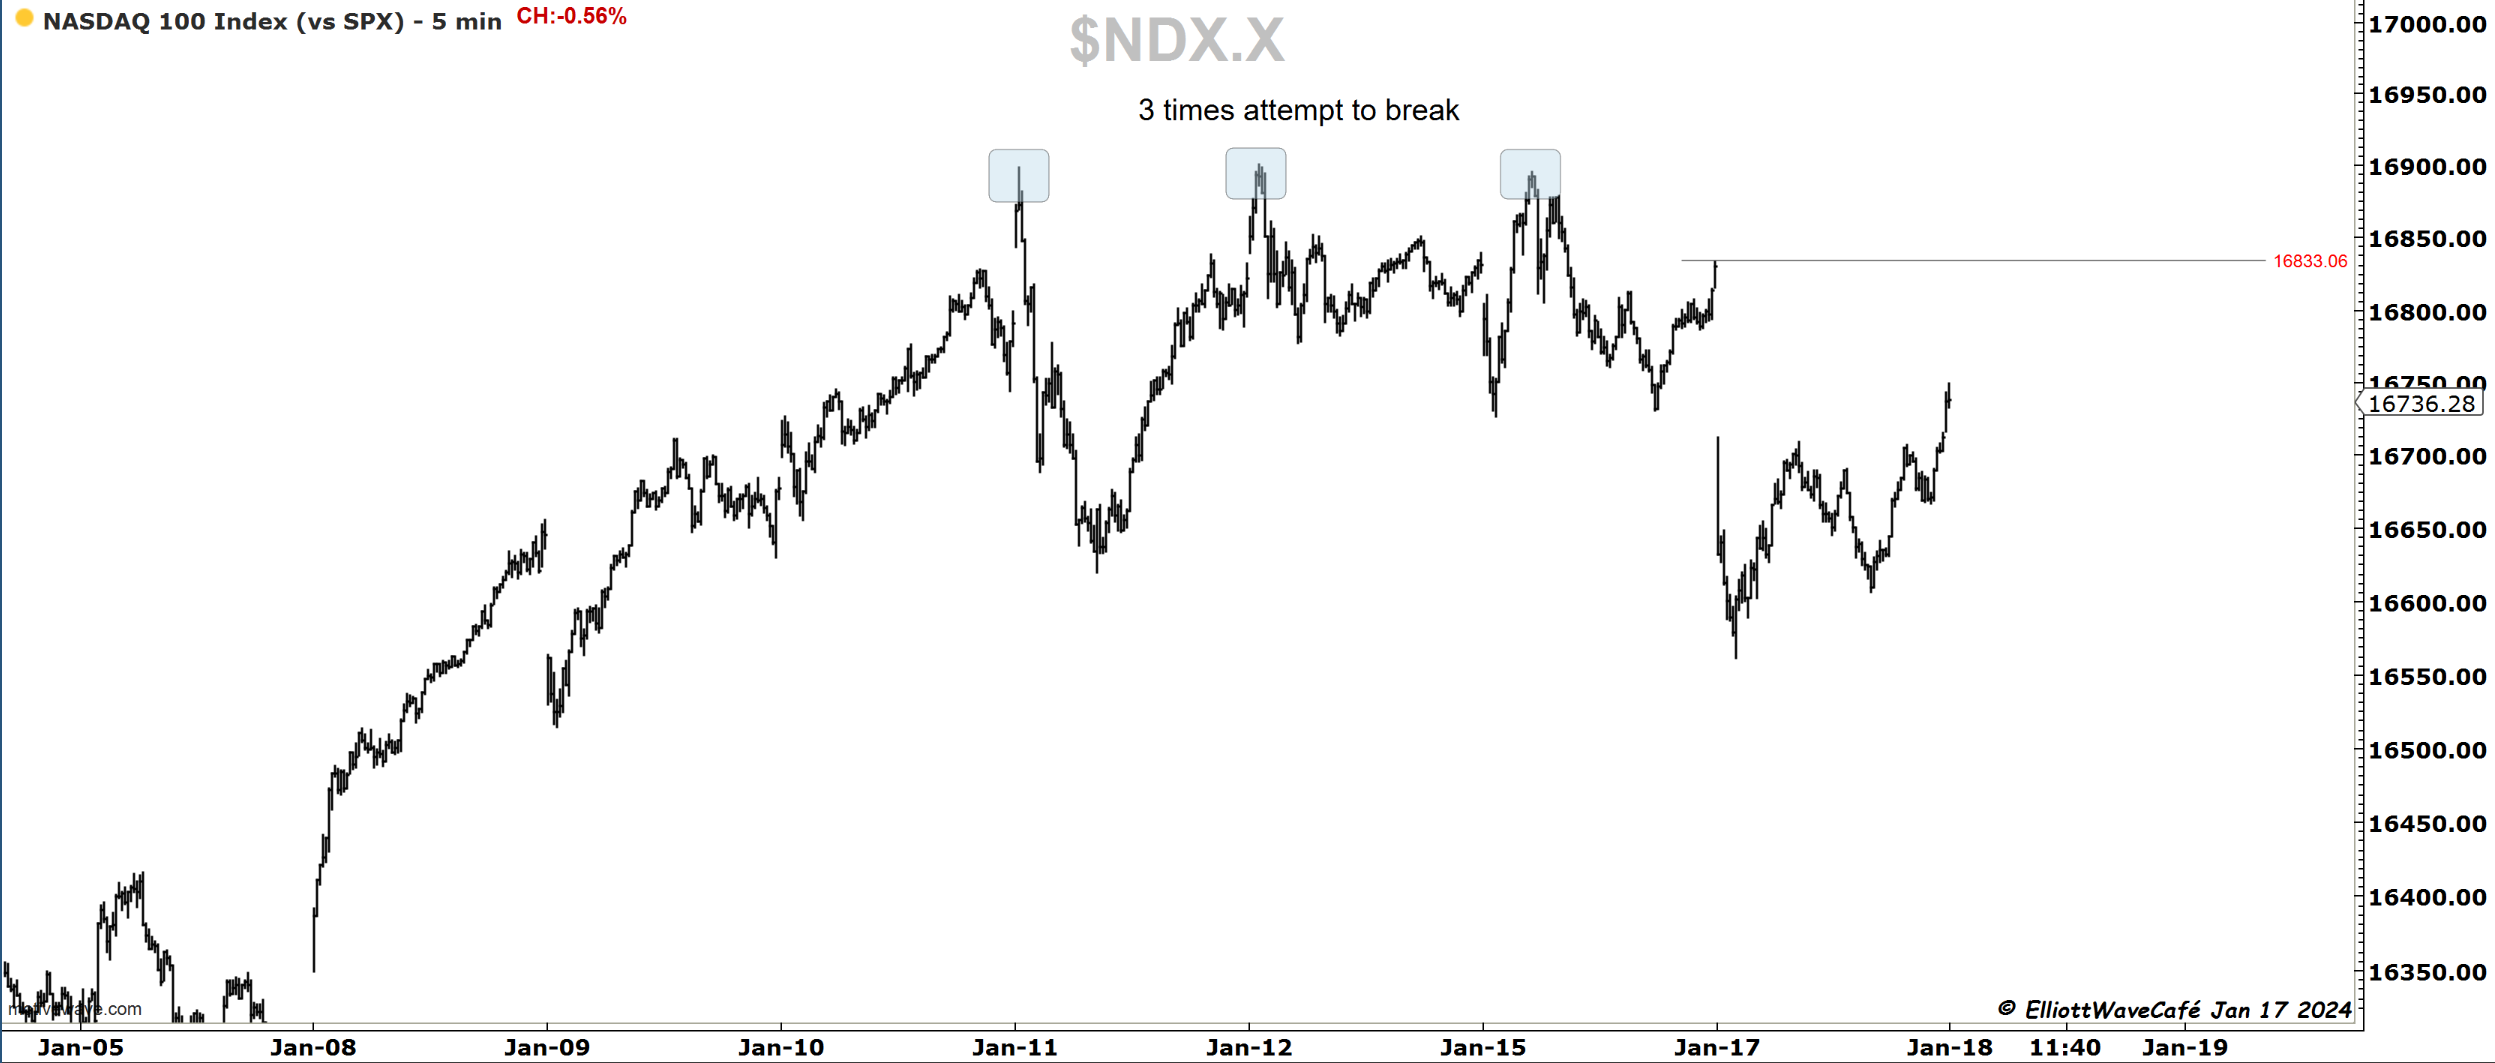
The count is unchanged, but more evidence is needed to secure either a (b) or a (ii) at those three highs.
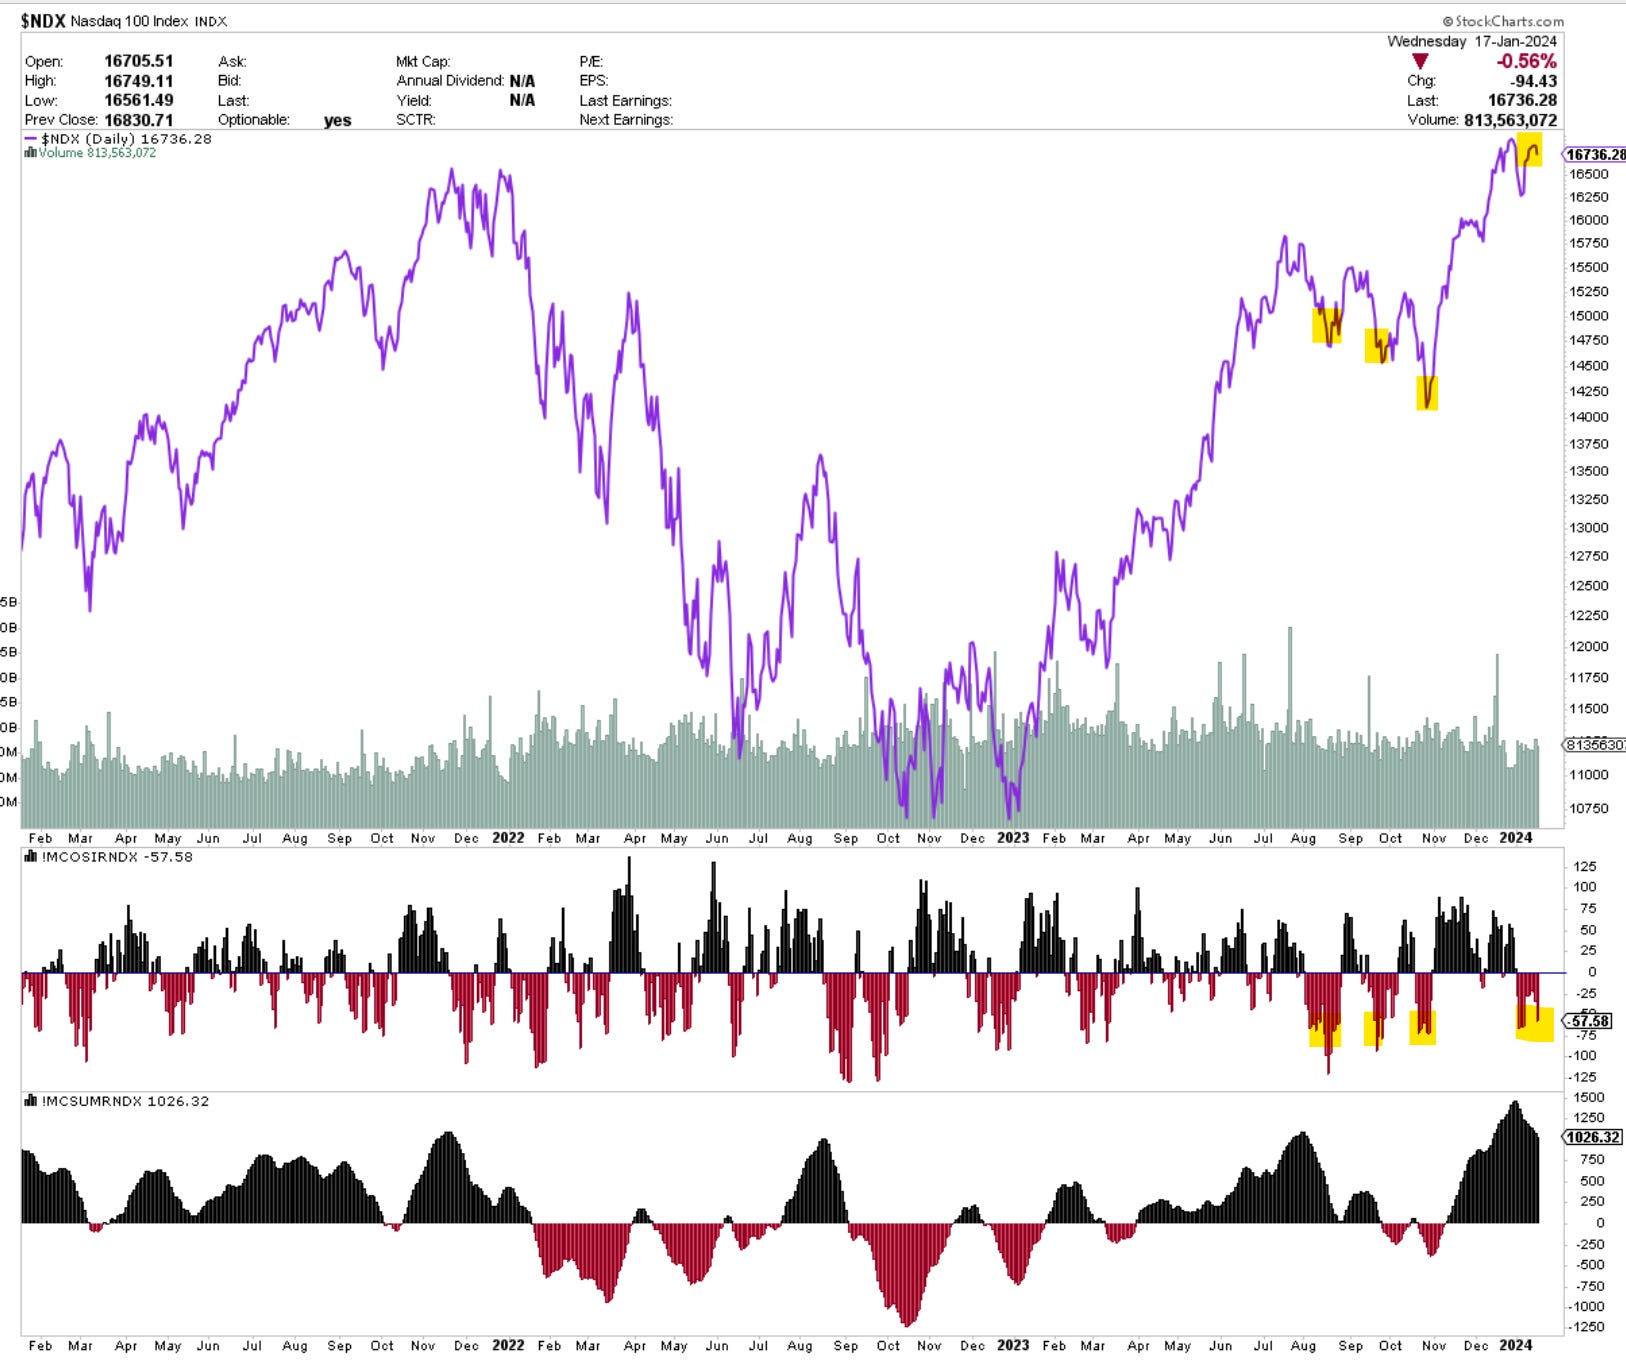
Here is the breadth oscillator for the Nasdaq. In terms of declines outpacing advances, we are almost at the levels from the summer of 2023. Yet price has not really responded. Since NDX is also heavily skewed towards those few large stocks, it continues to hold near the highs. Let’s see if it succumbs to further selling pressure.
RUSSELL 2000
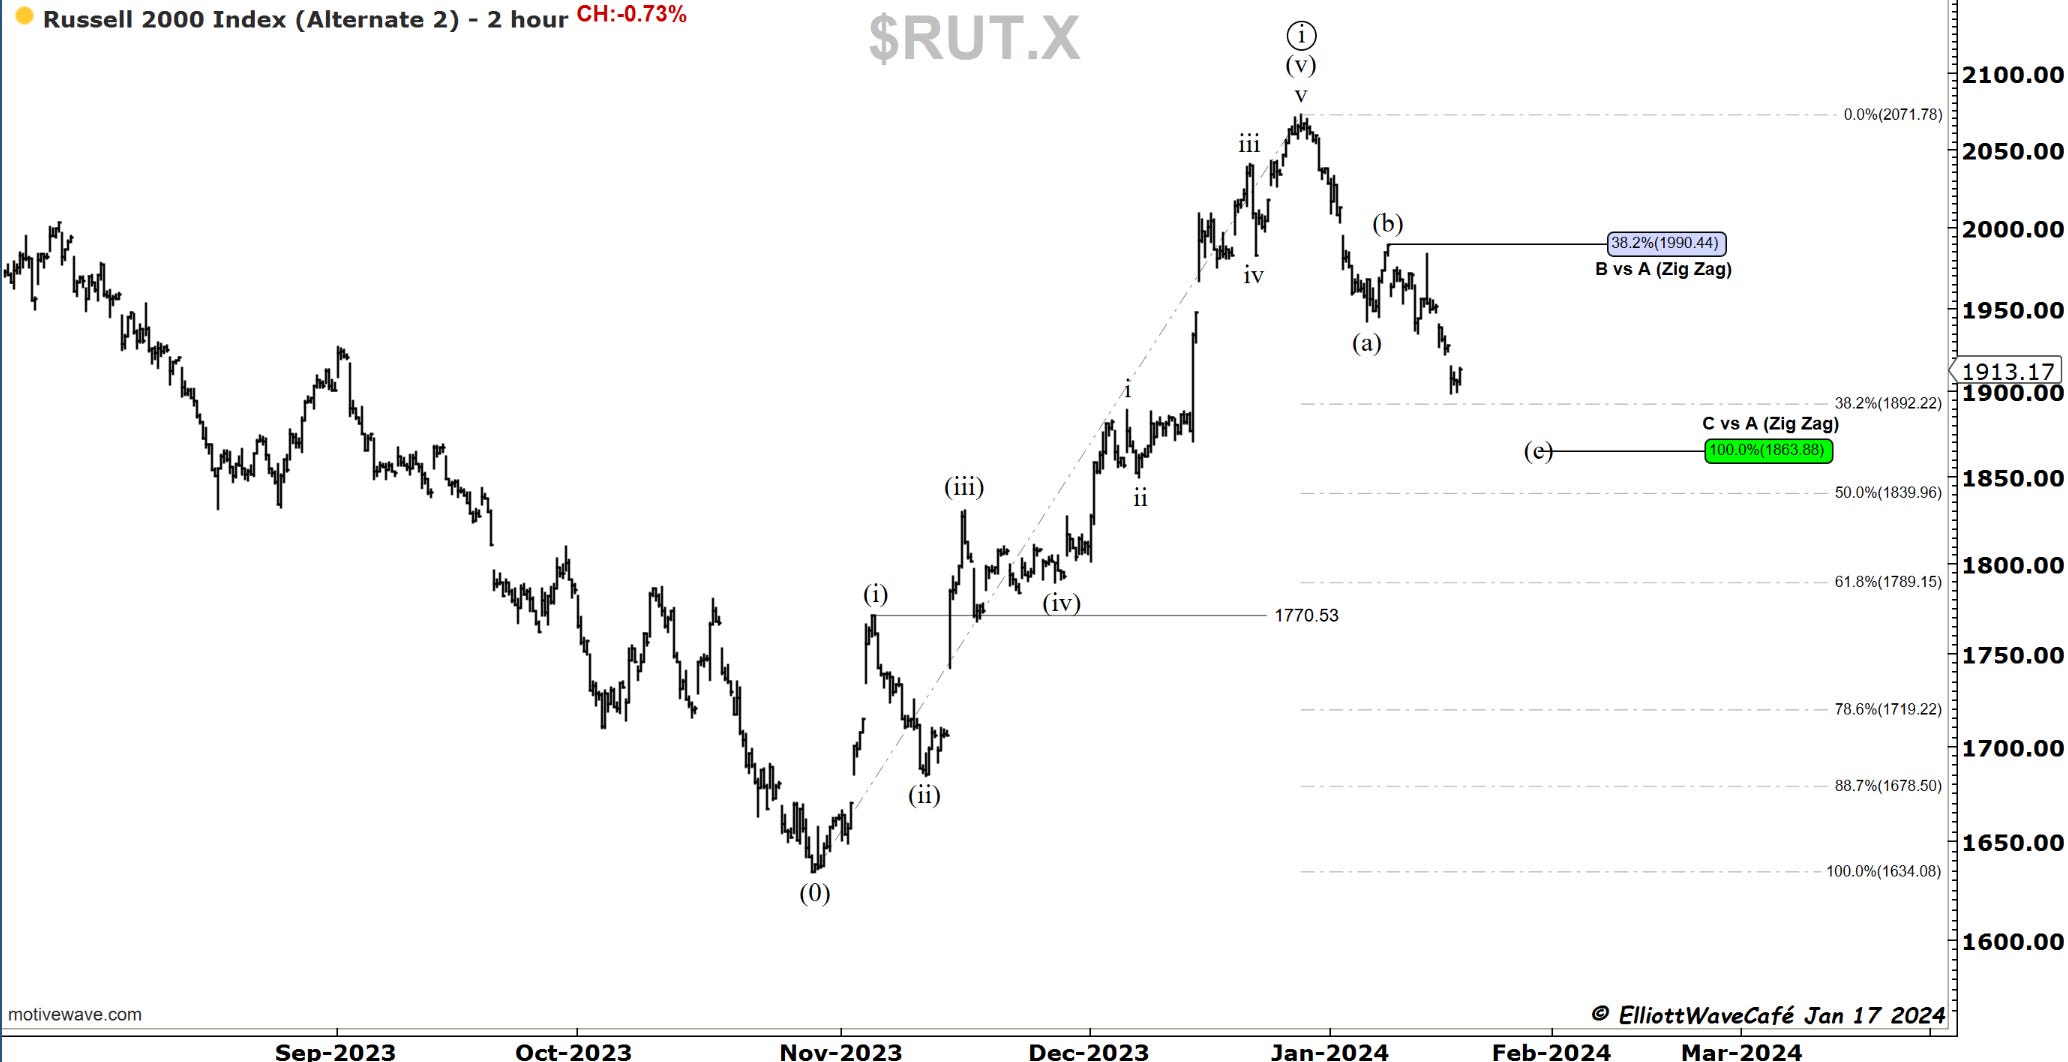
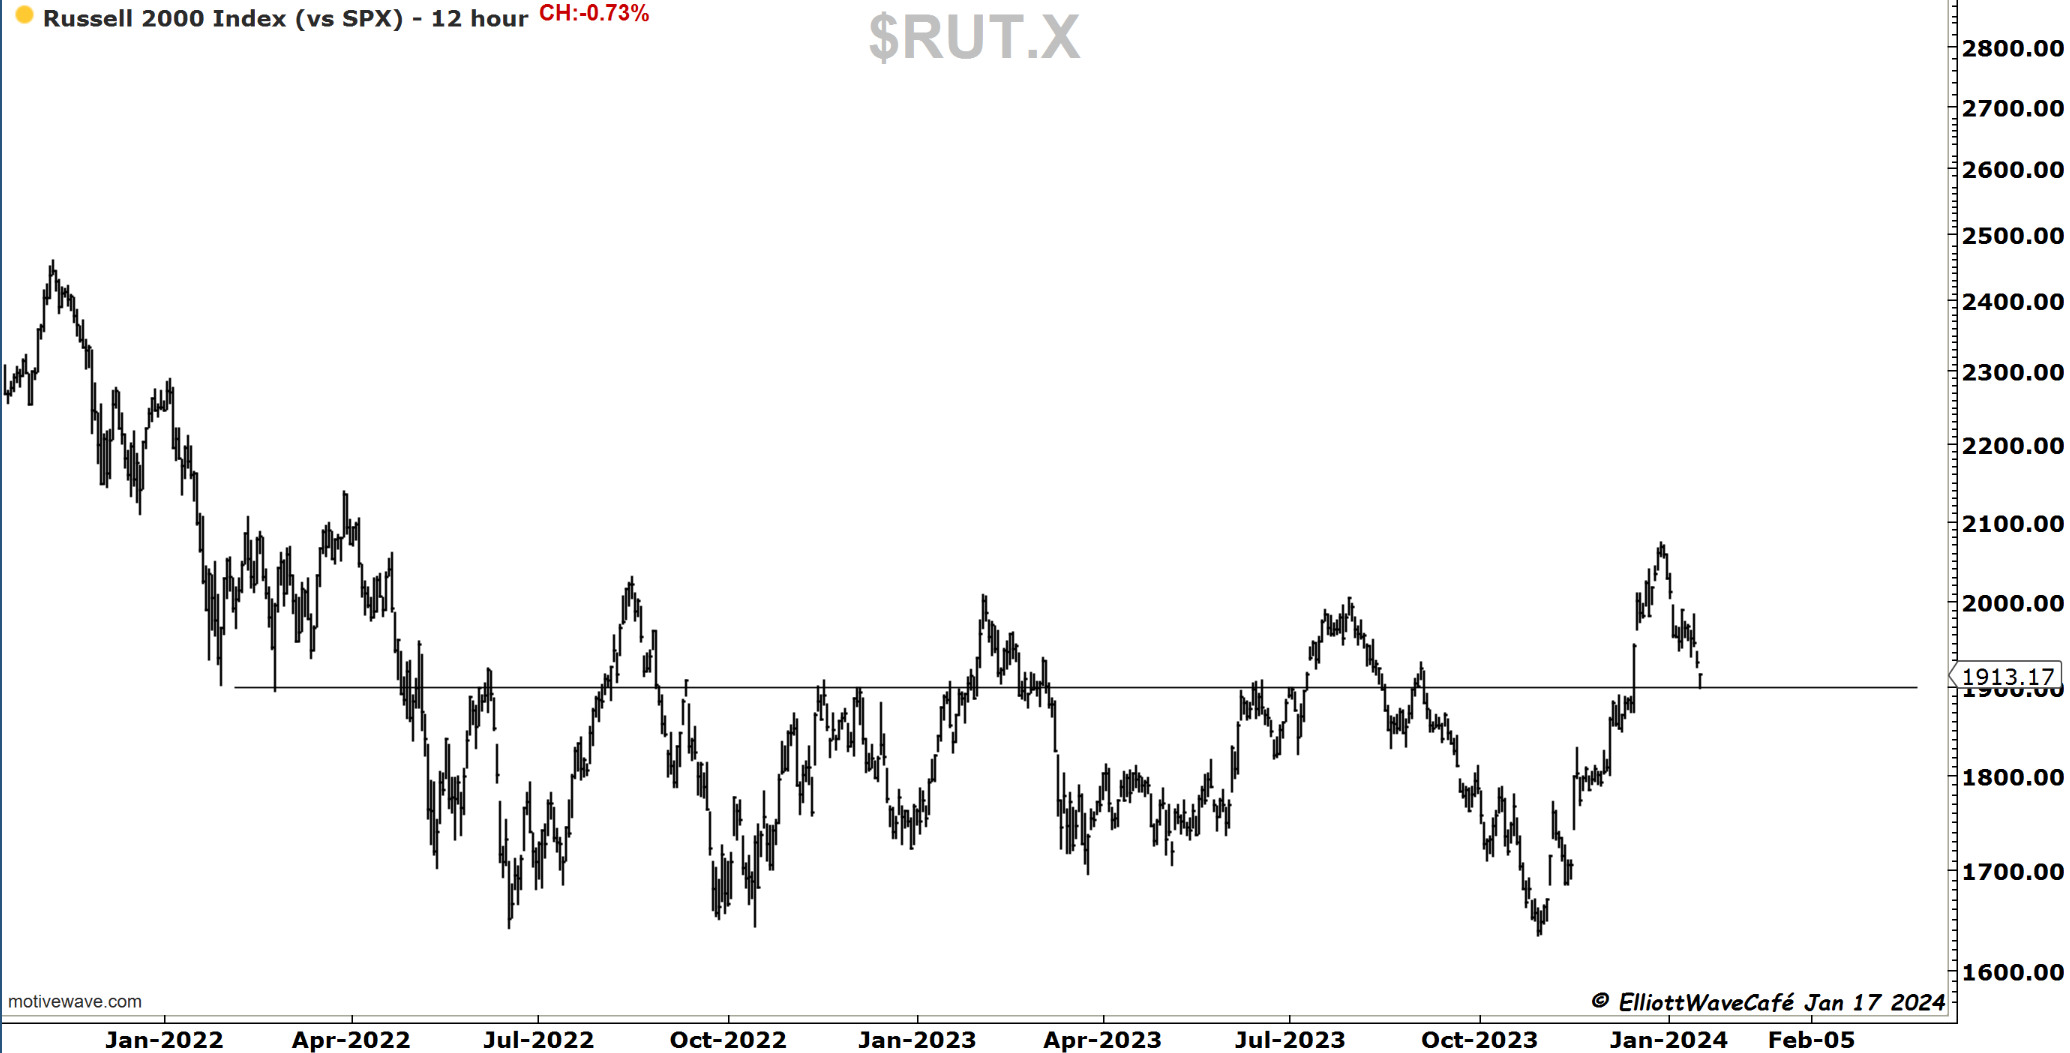
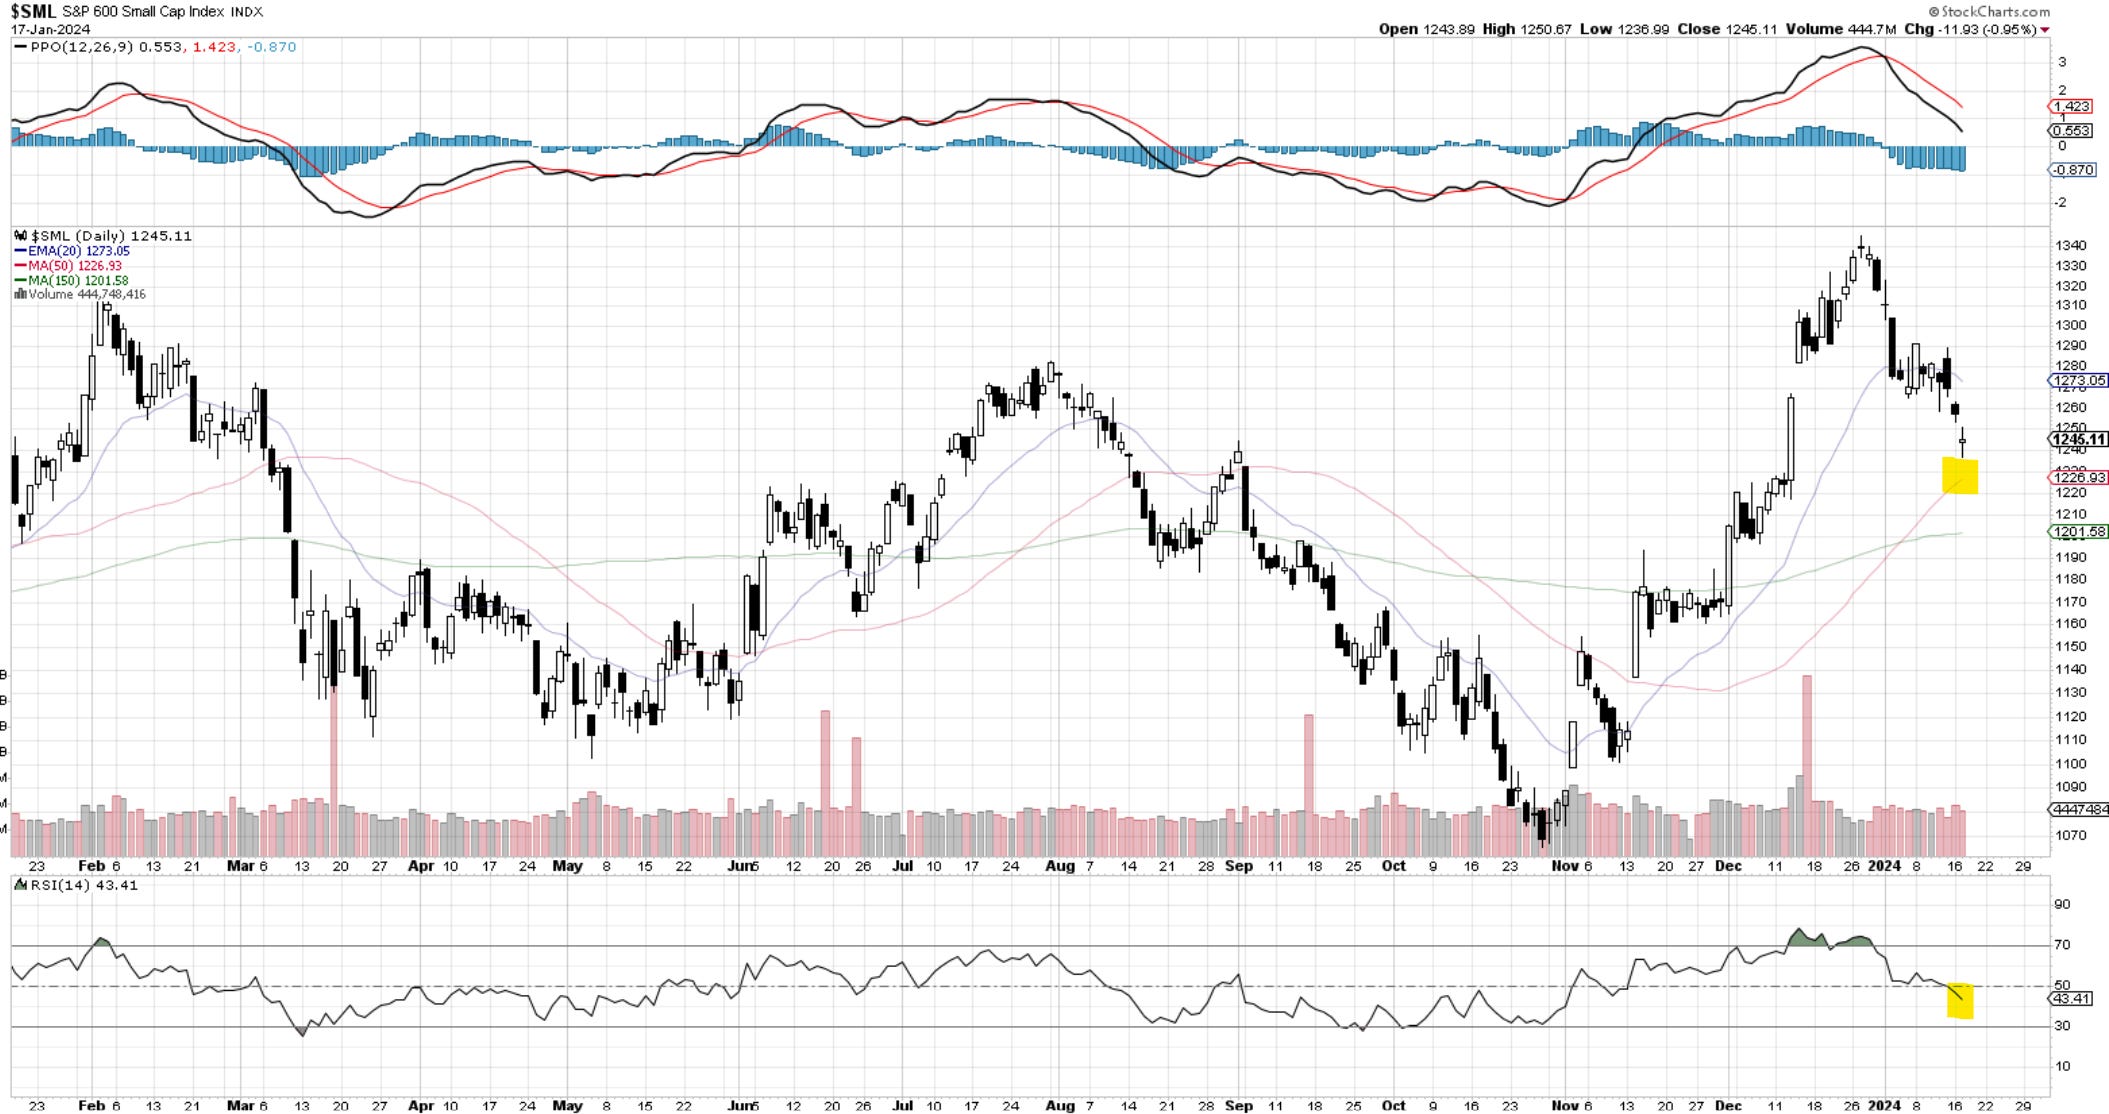
Russell continued lower once again, and it was the weakest of the major indices. We are now at 38.2% fib support. We also have decent horizontal support and a 50-day MA nearby. The RSI is near 40. This confluence of support could provide a temporary hold on this decline. I don’t think that the entire corrective move is completed, however. For those attempting to play a bounce in small caps, I would like to see a clean 5 waves up on smaller time frames. So far, only corrective 3 wave bounces are present.

Dow30
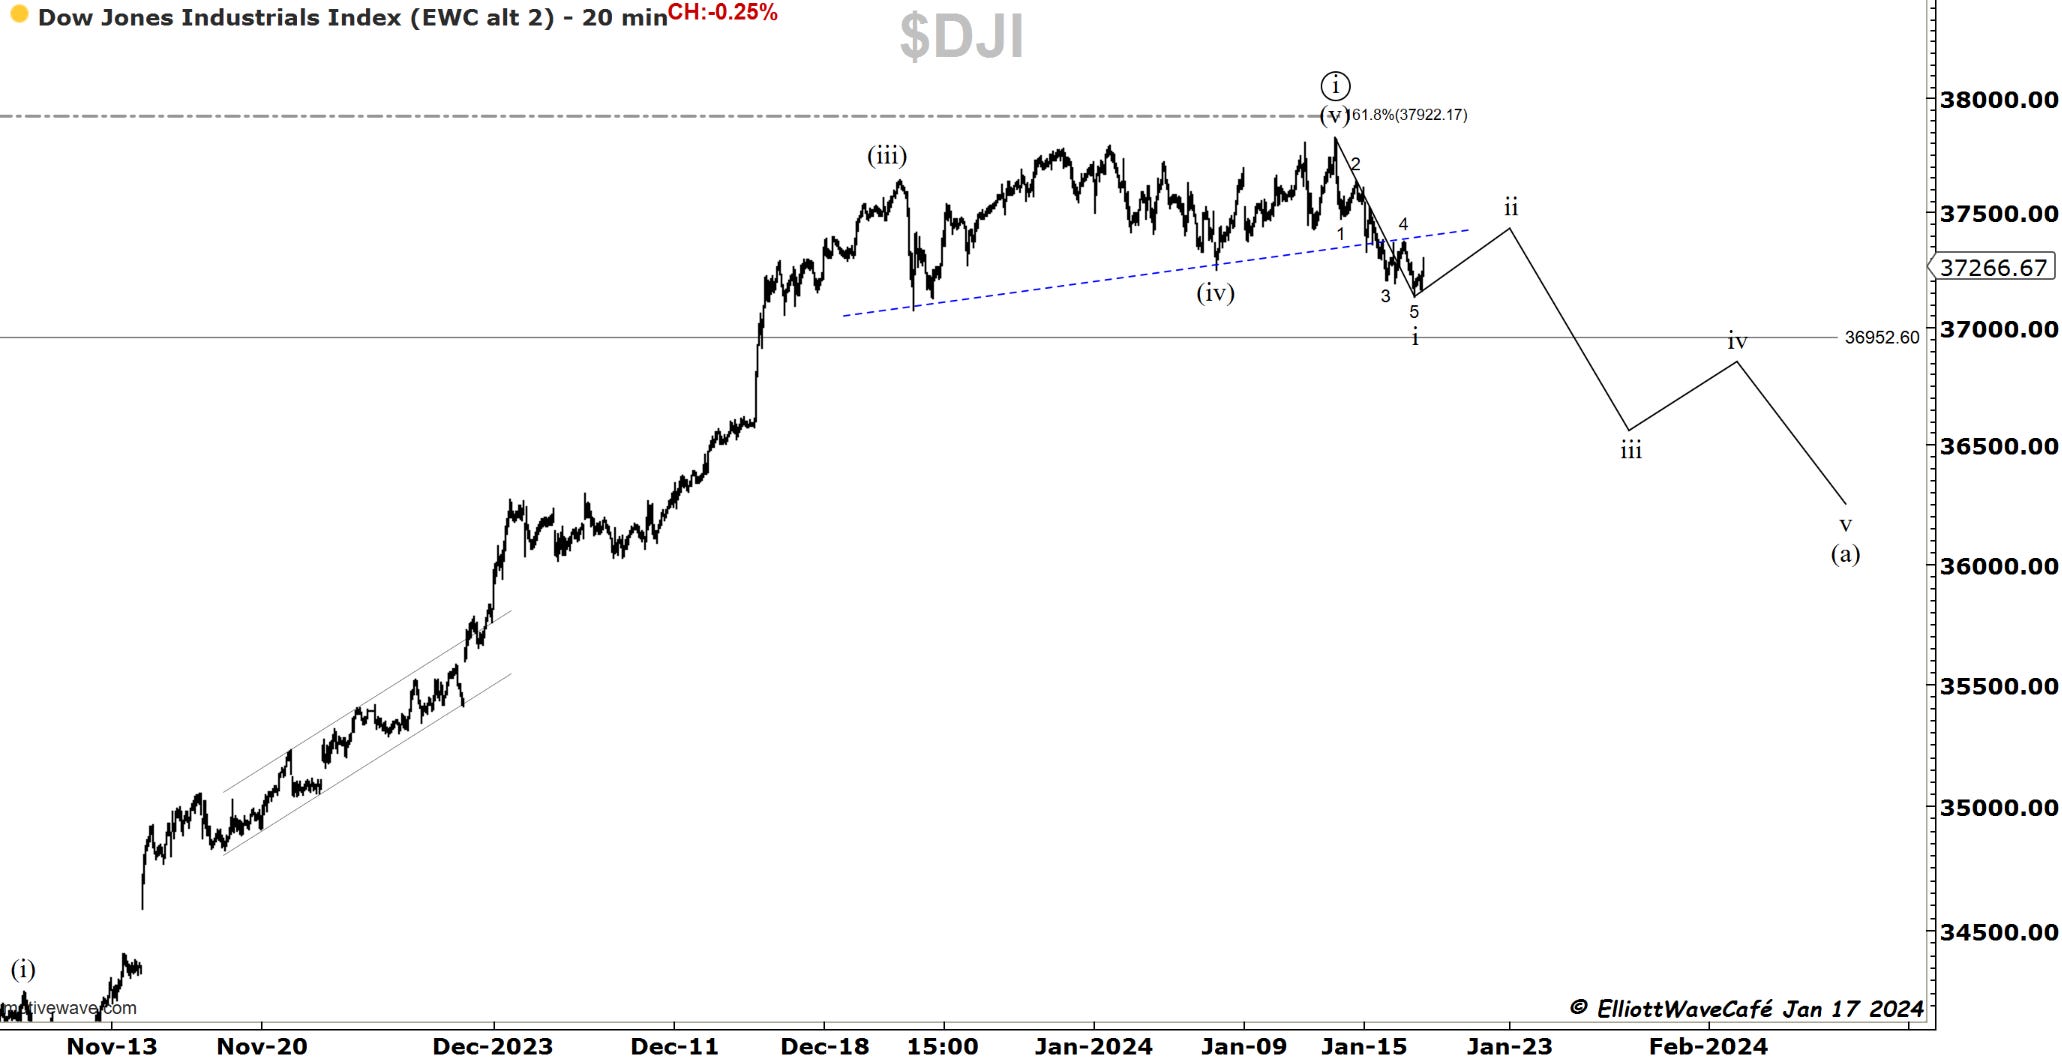
Here is the proposed pathway in the Dow. A 3wave wave ii rally should lead to a steep decline in wave iii of (a) of ((ii)).
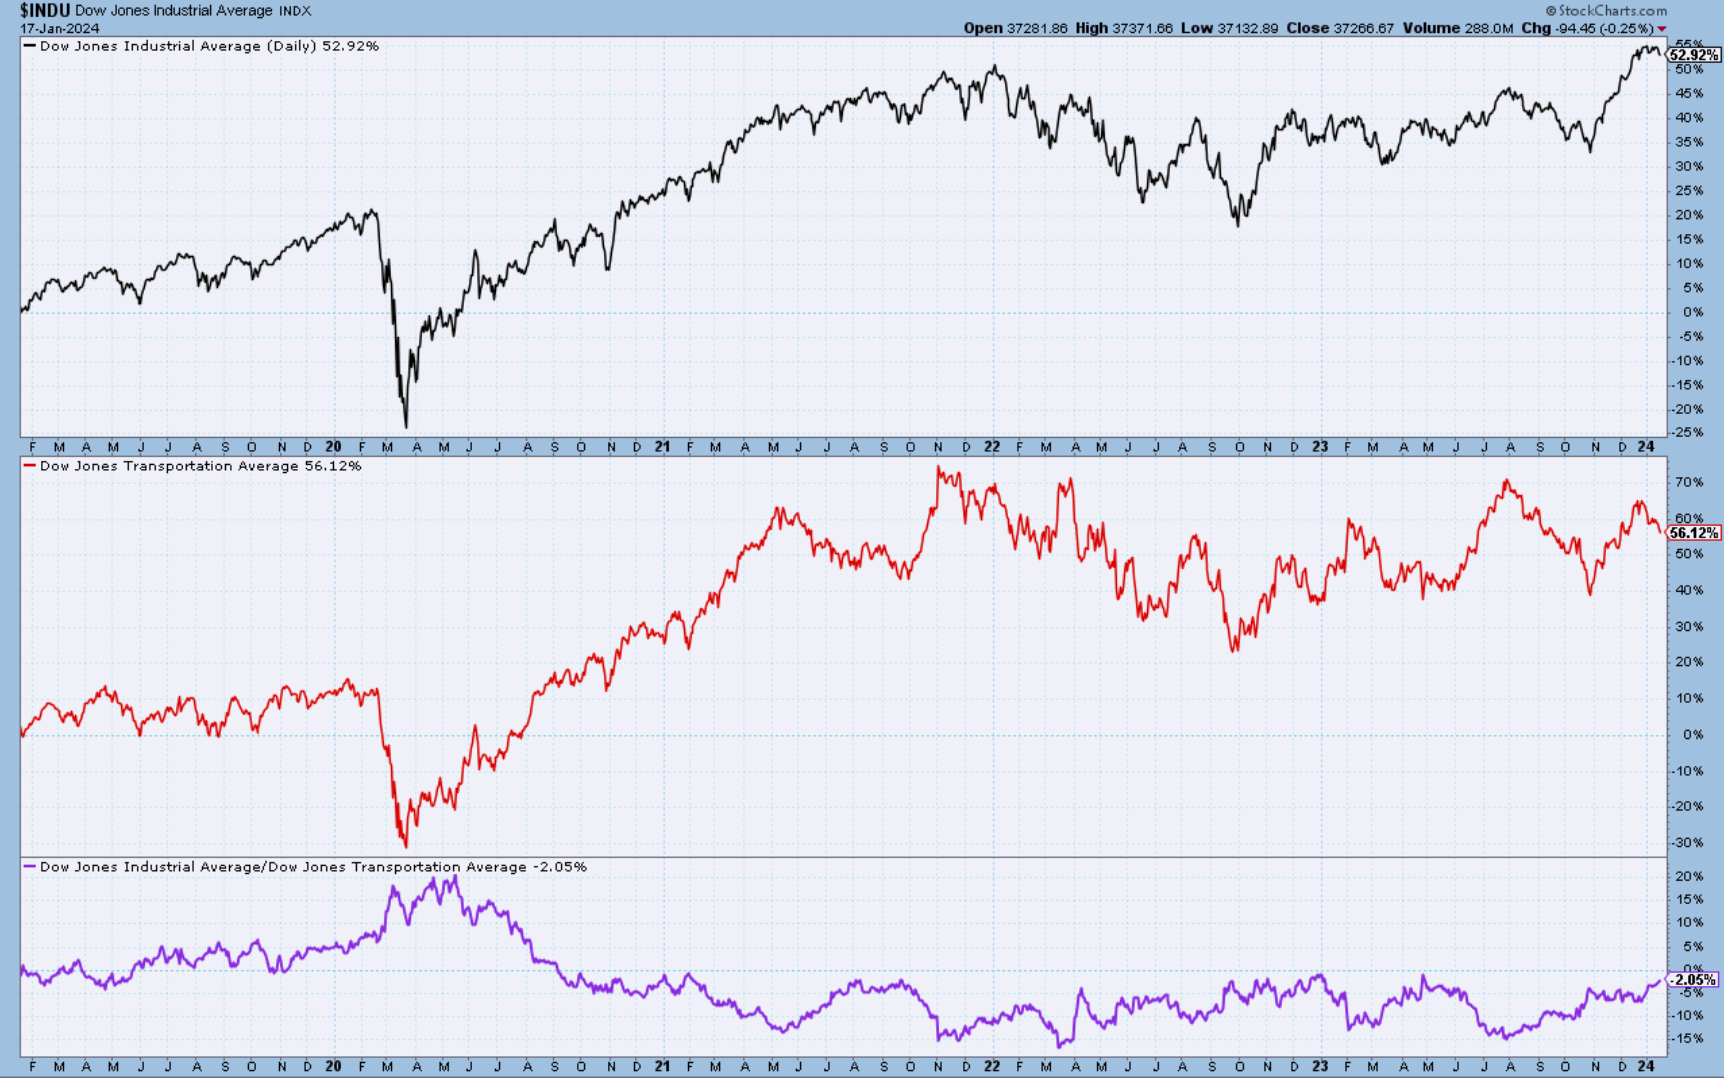
Notice the heavy divergence between the Industrials and Transports. Good old Dow Theory. We have a problem. What type of signals have transports been sending by not being able to stage advances? And I don’t think it’s only Boeing.
US Dollar and Yields
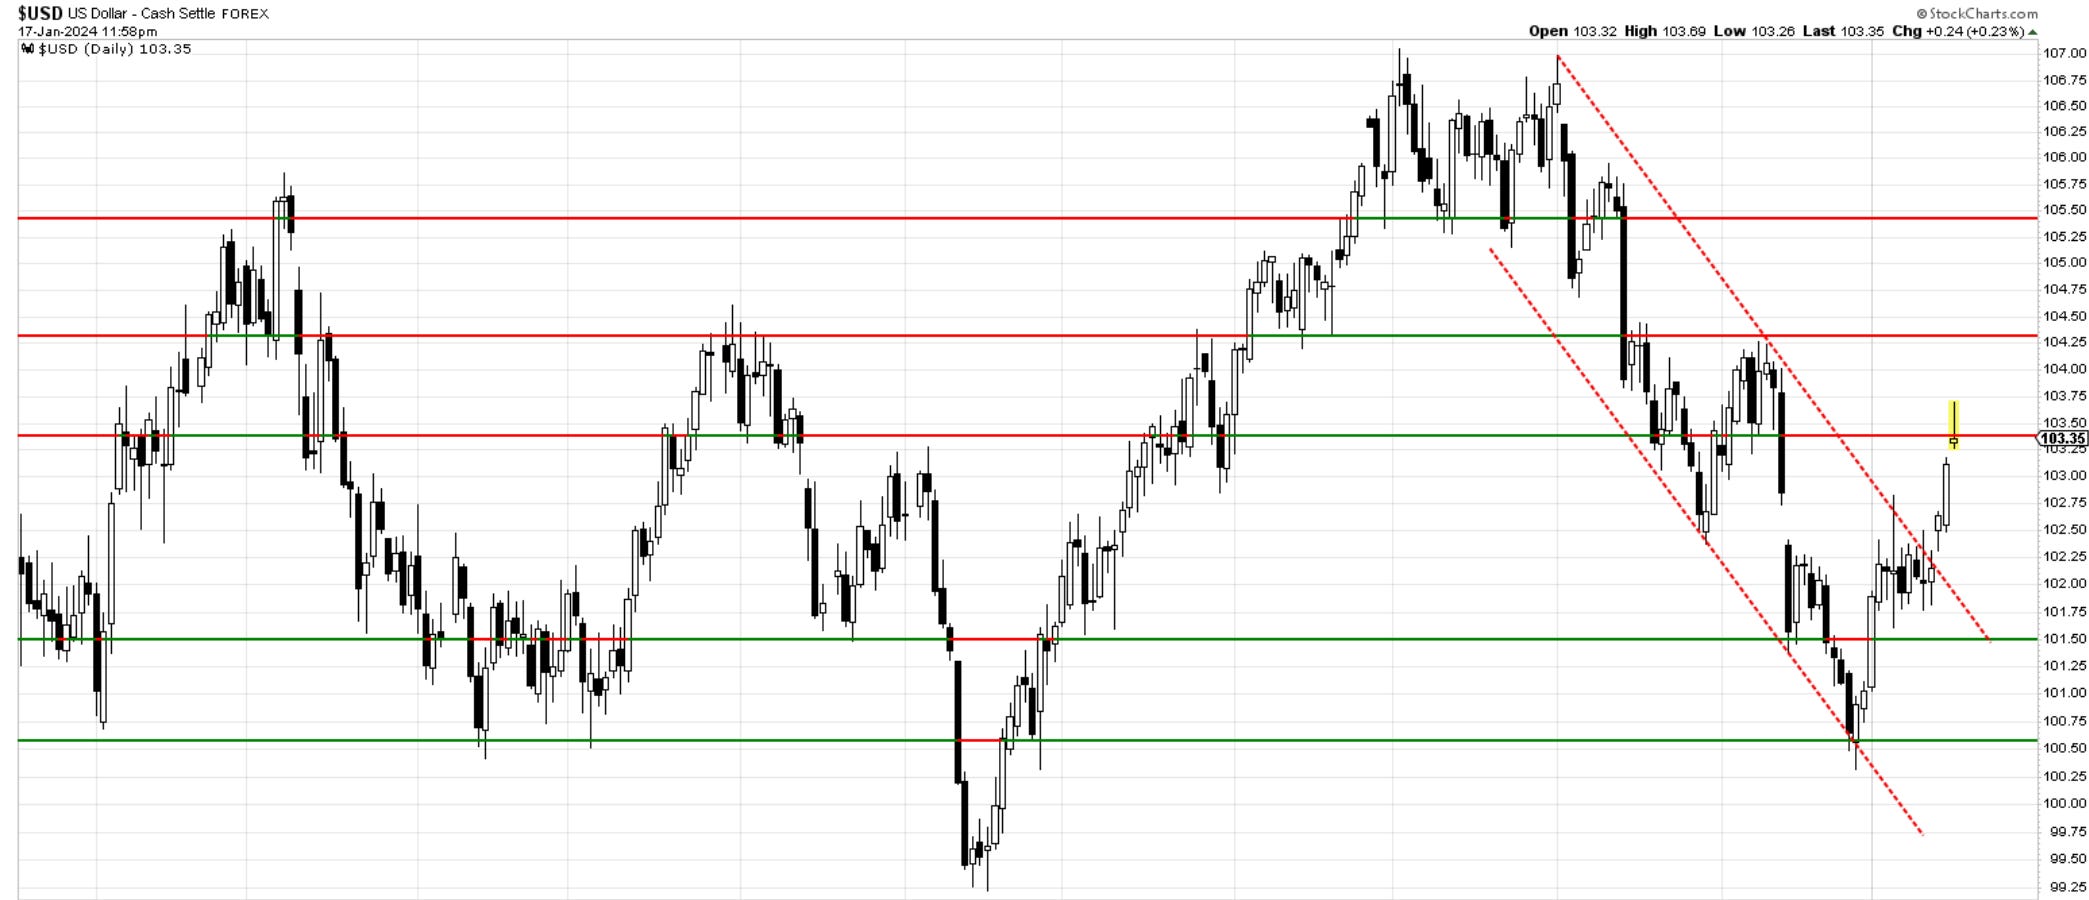
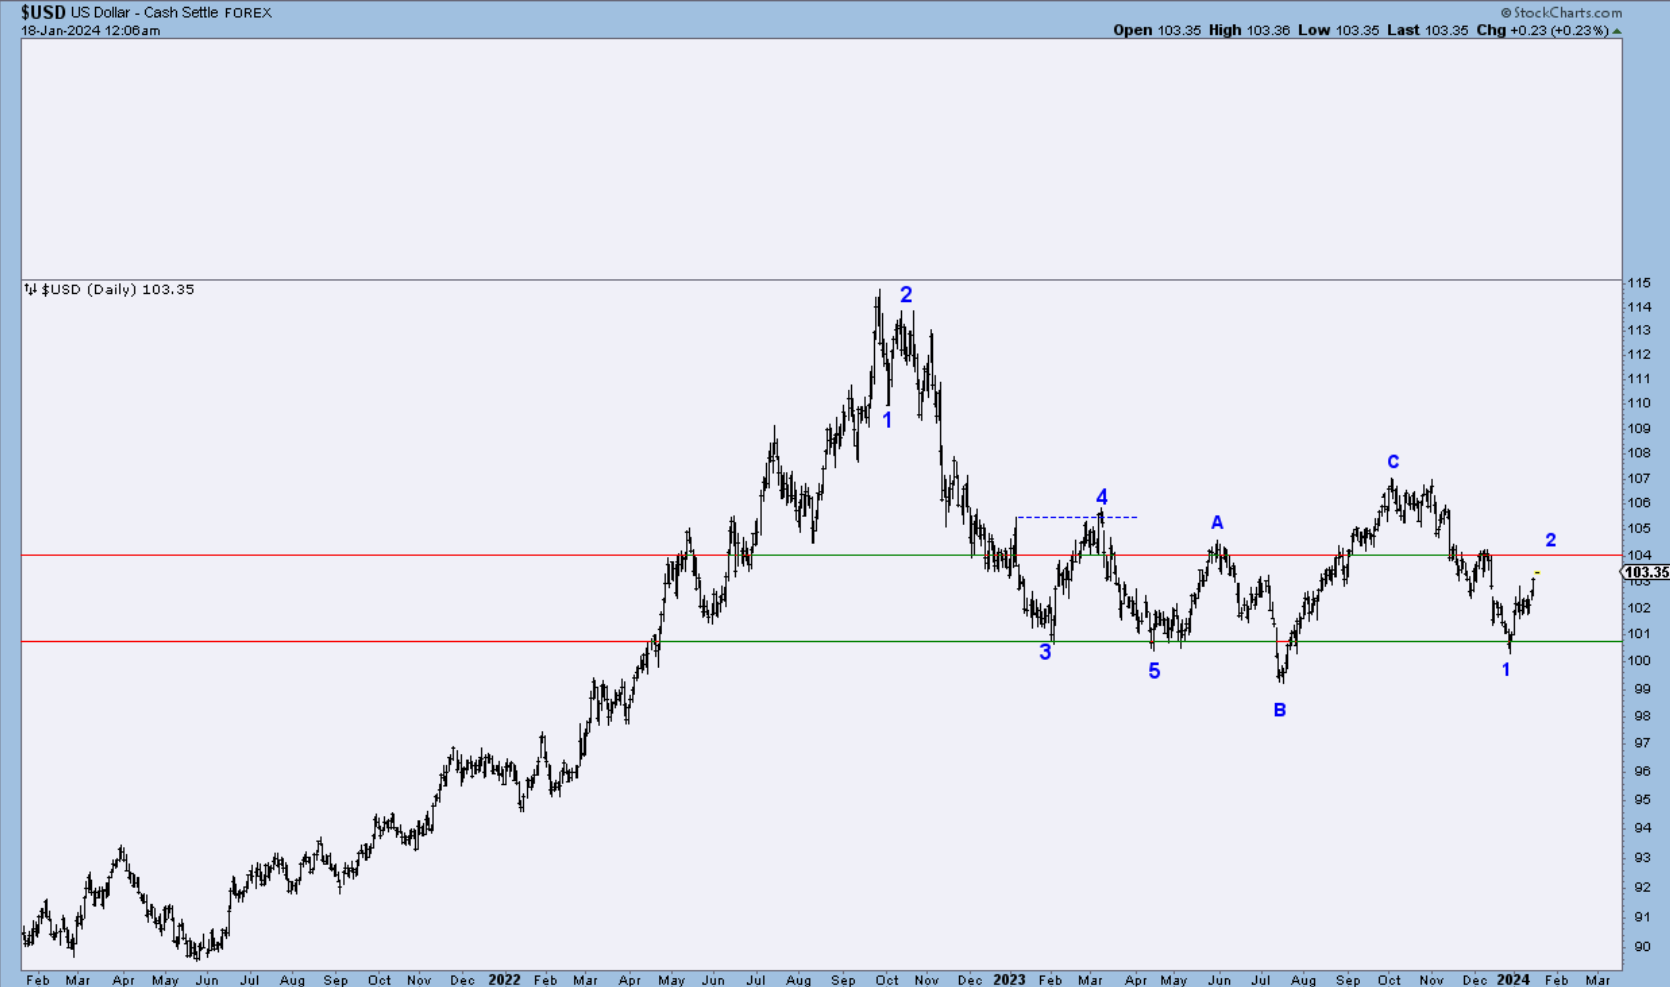
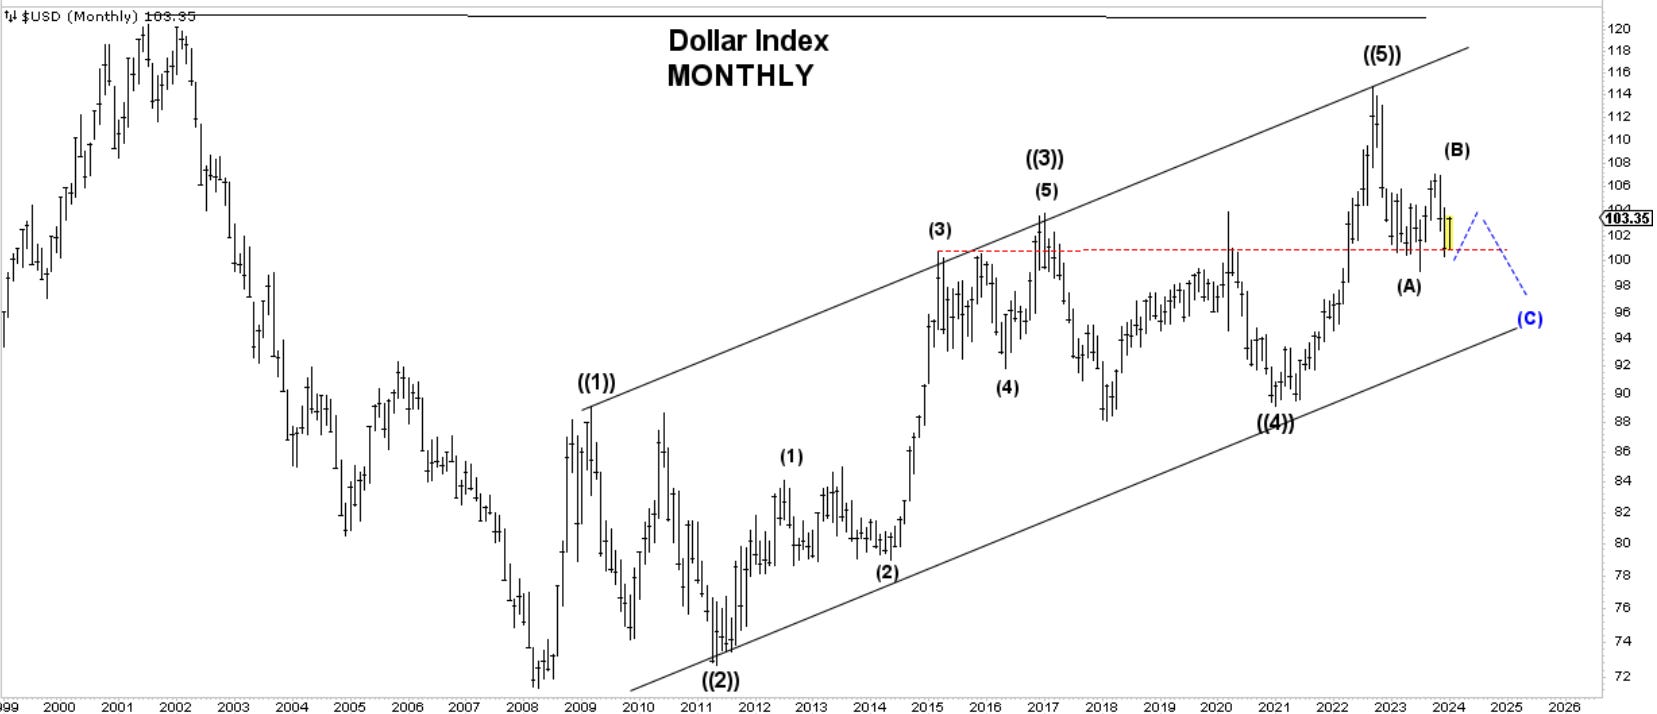
A few views of the dollar are below. Stalling a bit at horizontal resistance. In my view, it is the most complex instrument to analyze. There are a multitude of factors going into it. ( global trade, rate differentials, yields and many more). For simplicity, I resort to some basic wave counting and key zones. From a monthly perspective, there should be more downside, but only after this up-leg runs its course, and I don’t think we’re there yet.
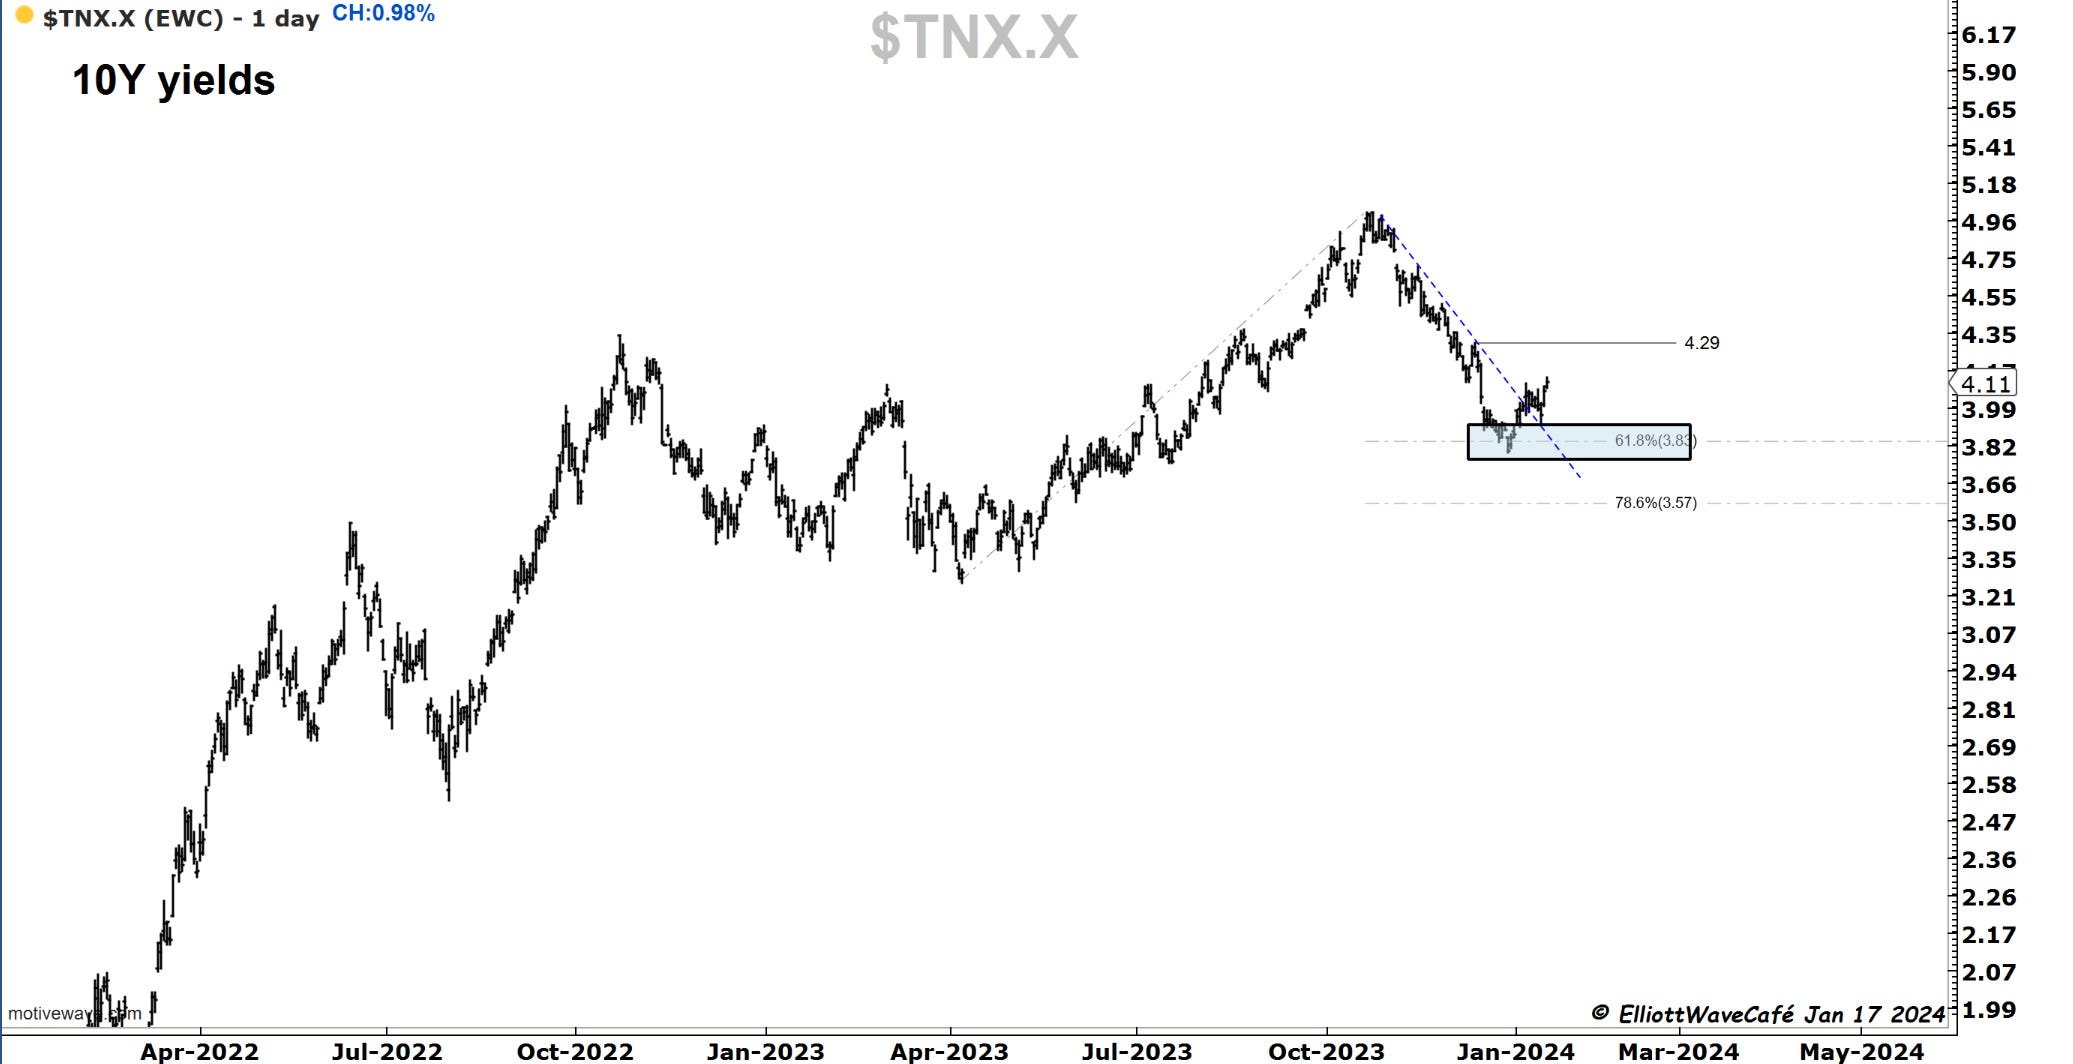
1o-year yields should continue to trend higher. 4.29 is the target for now. Today’s strong retail numbers have helped give it a further boost.
Gold
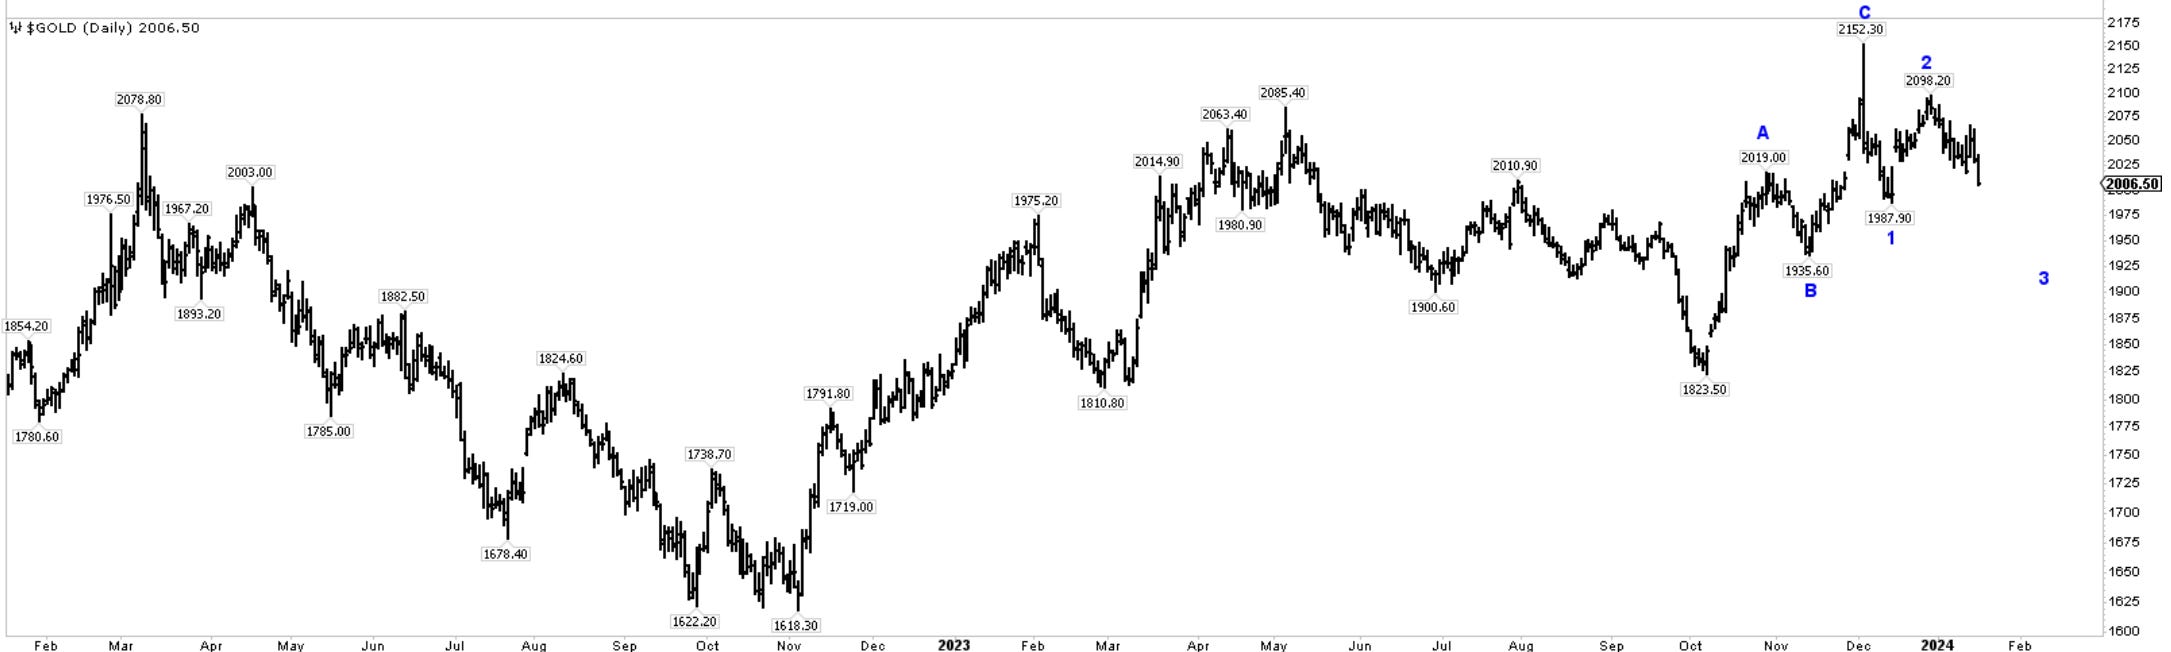
Gold has lost -1.17% today, getting closer yet to that prior swing low at 1987.90. A loss of that level will likely accelerate the downside. There was a premature, exciting move towards 2150 on FED cutting rates. I think we’re going through a period of repricing as those rate cuts are being pushed back. Plus, don’t forget money market funds yield nearly 5%, so holding a yellow metal with no yield does not make much sense for many.
Bitcoin
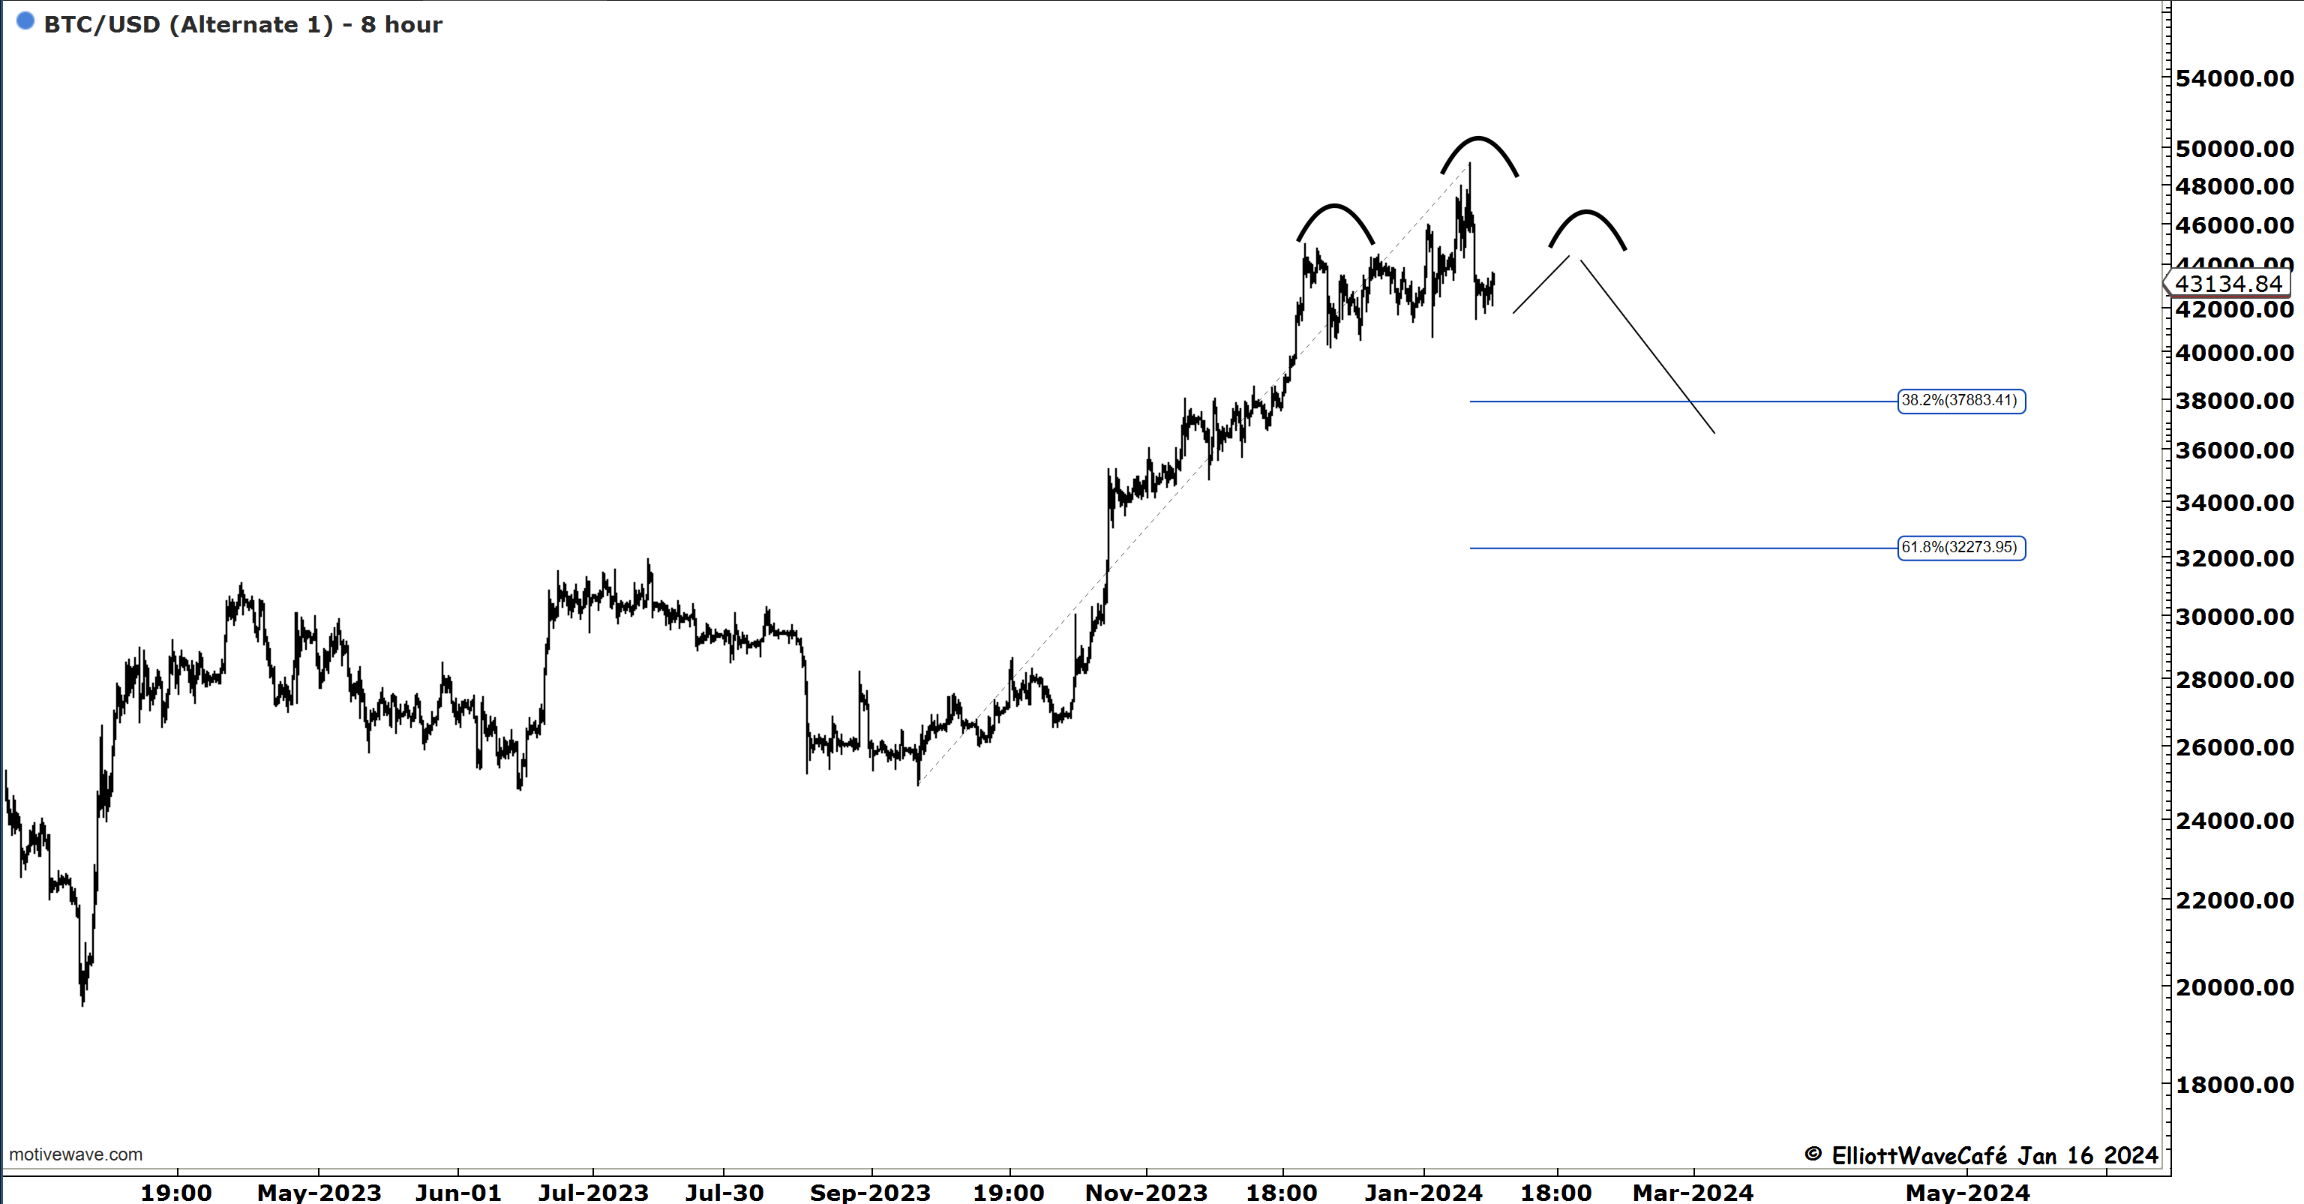
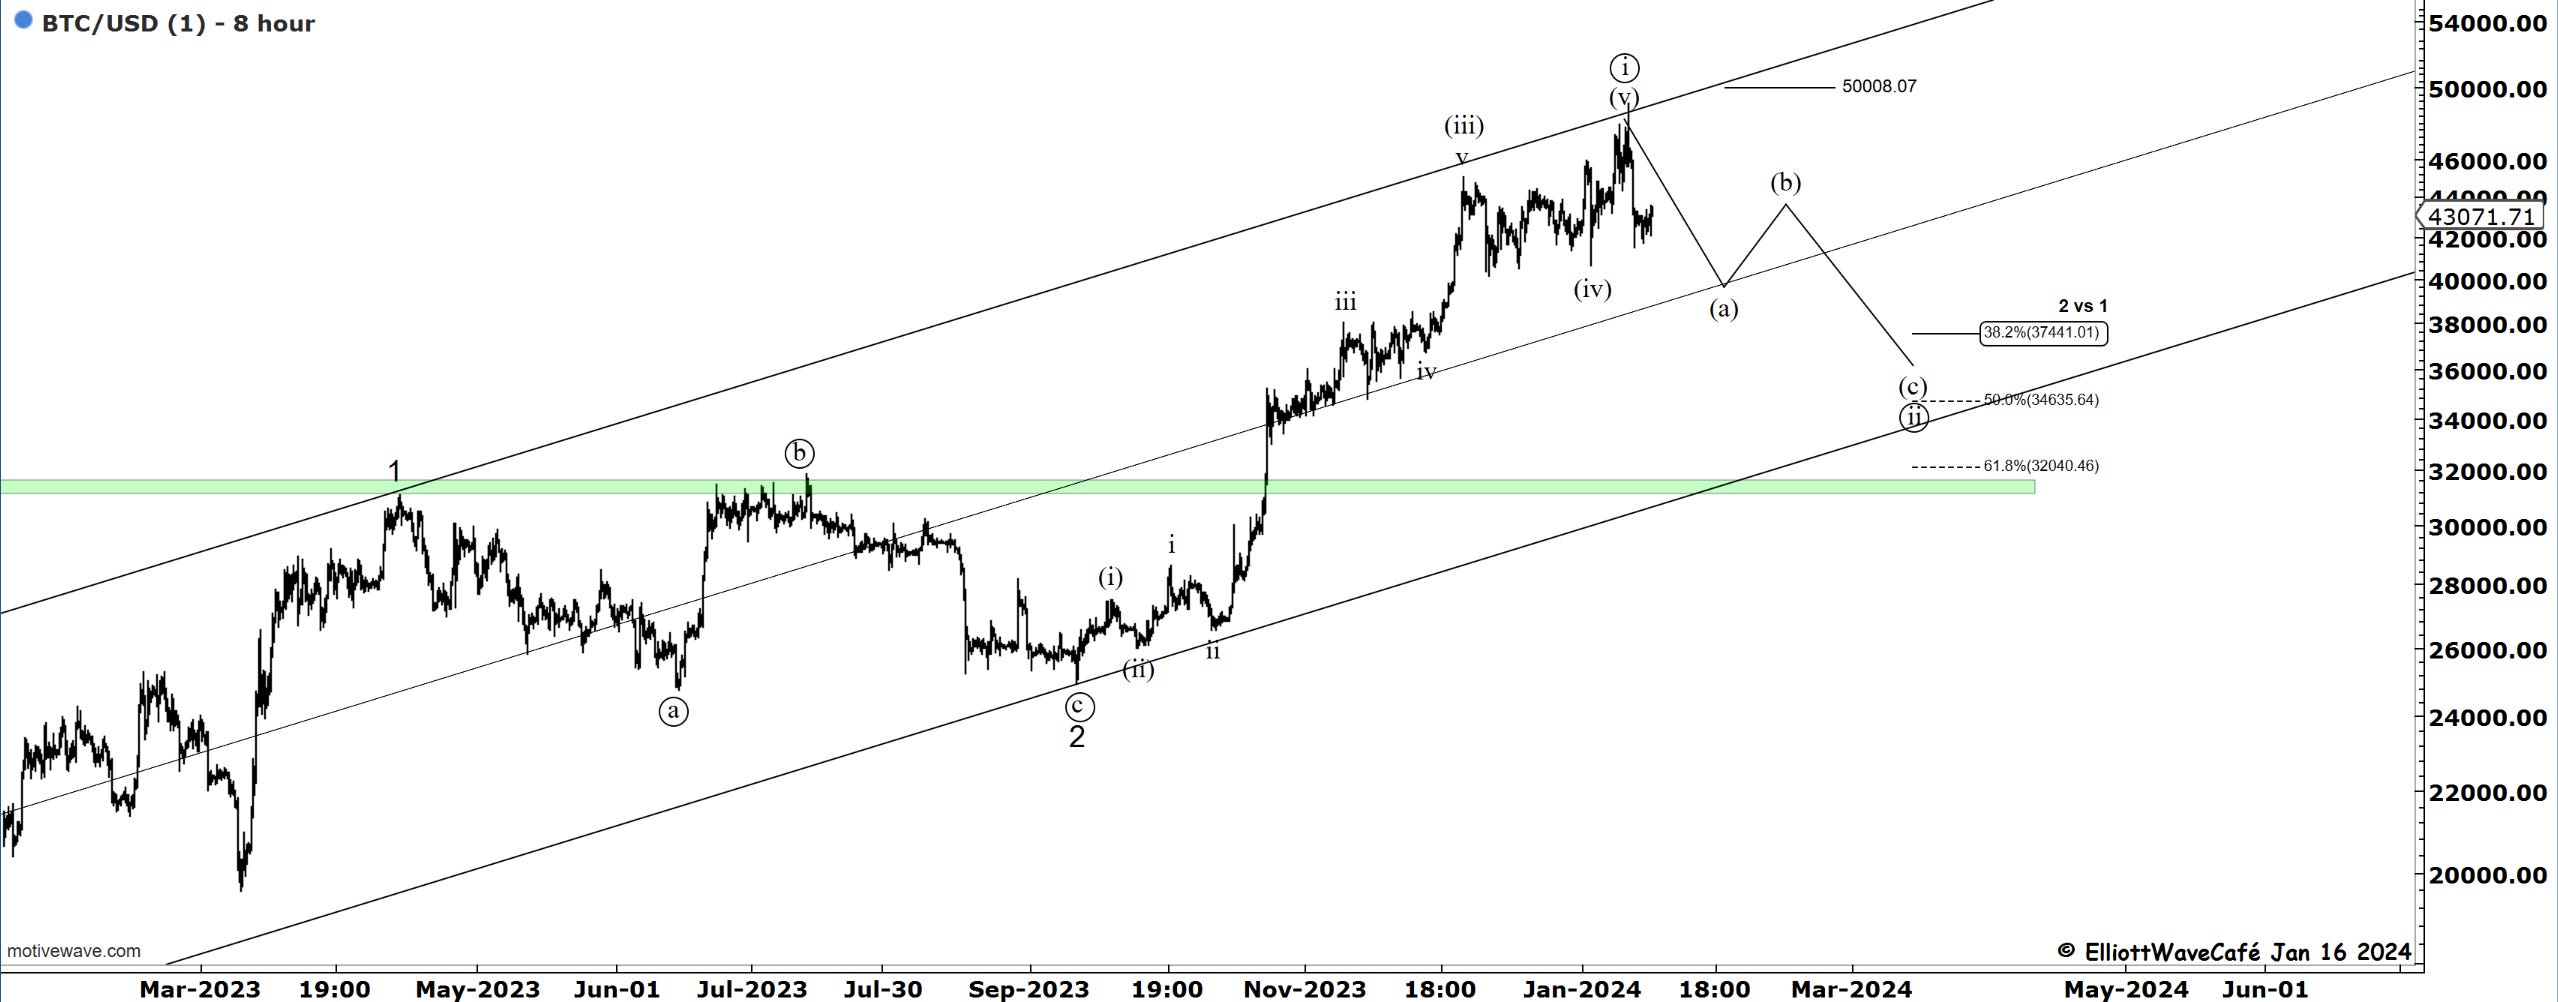
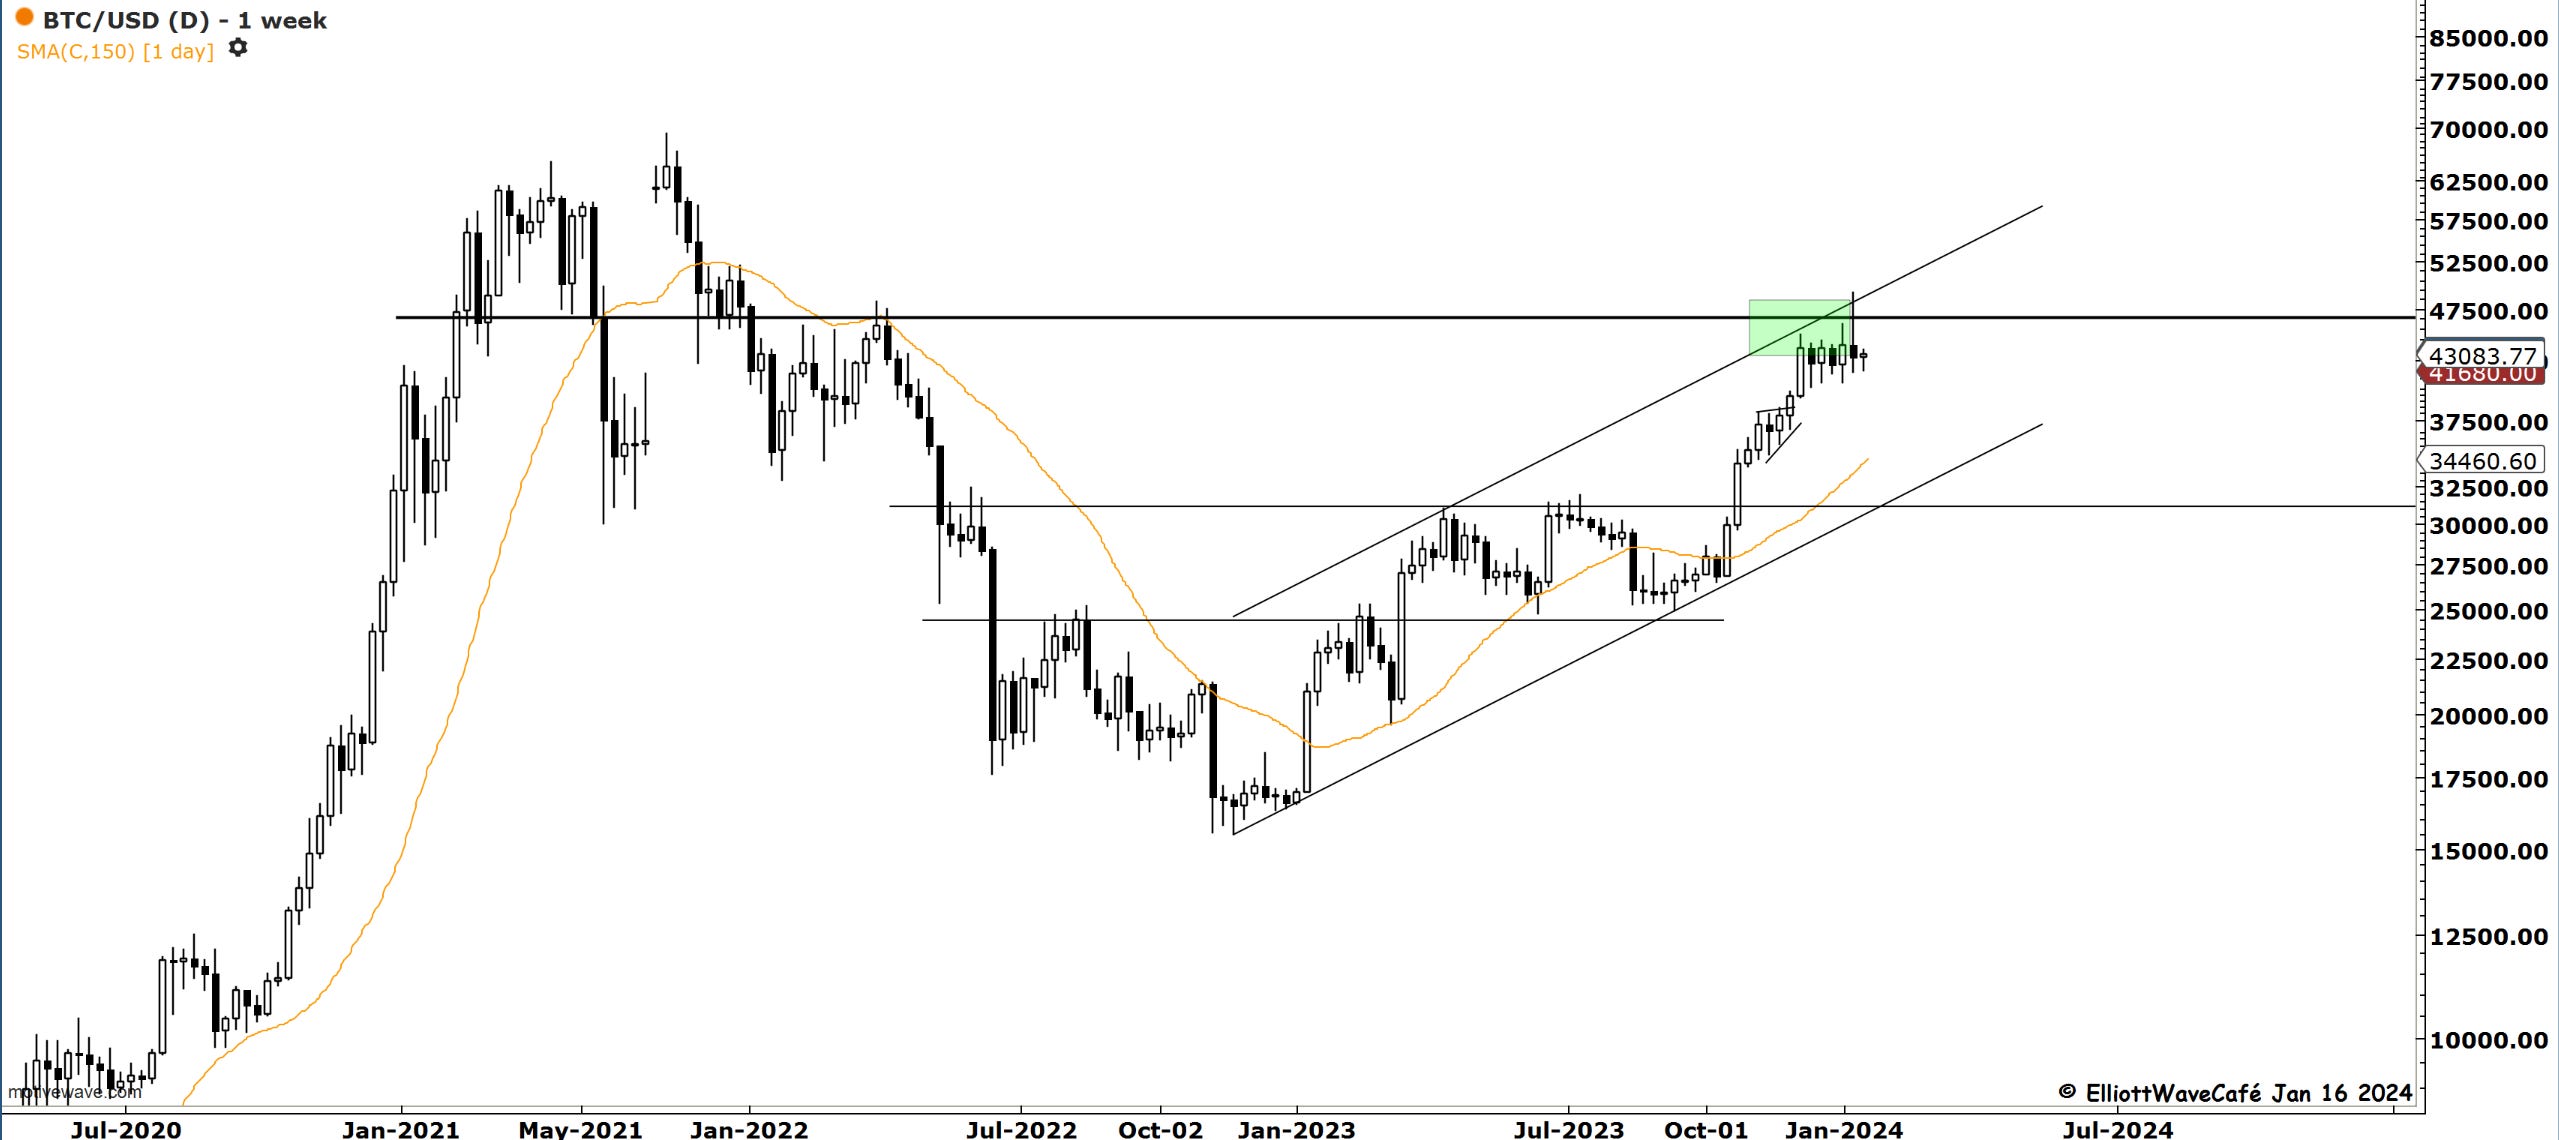
previous comments remain- no changes necessary. I see lower prices ahead.
Bitcoin has begun a corrective period that should take prices below 40k in the weeks ahead. The weekly candle displays a clear rejection of higher prices. This is coming at a time when the BTC cash ETF was approved. Any rally from current prices would be an opportunity to short or ease off on long positions. I will comment on this in tonight’s video.
“Double shot” Daily member video coming up next,
If you’re new to Elliott Wave or need to refresh, there is a 7-hour video course with downloadable slides under The Coarse tab on the website.
Have a great day wherever you are! - trade well, and don’t forget to subscribe and drop a like if this letter helps you in any way.
Cris
email: ewcafe@pm.me