
The Daily Drip
Core markets charts updates and commentary
Note: The counts on the right edge are real-time, and they are prone to adjustments as price action develops. Elliott Wave has a fluid approach, is evidence-based, and requires constant monitoring of certain thresholds.
In the counts below, this (( )) = circle on chart
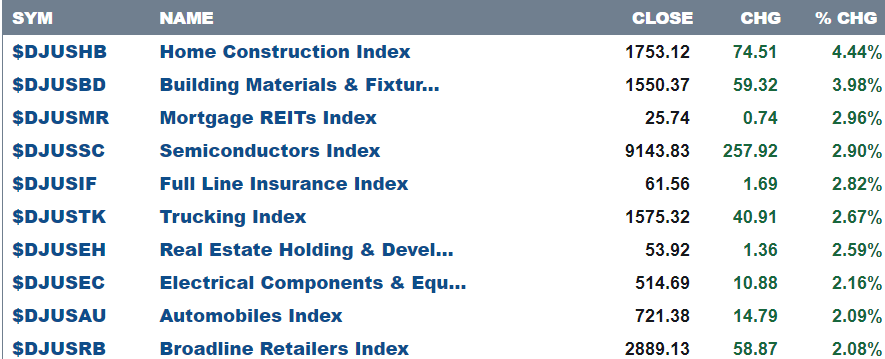
Here are today’s top 10 best performers
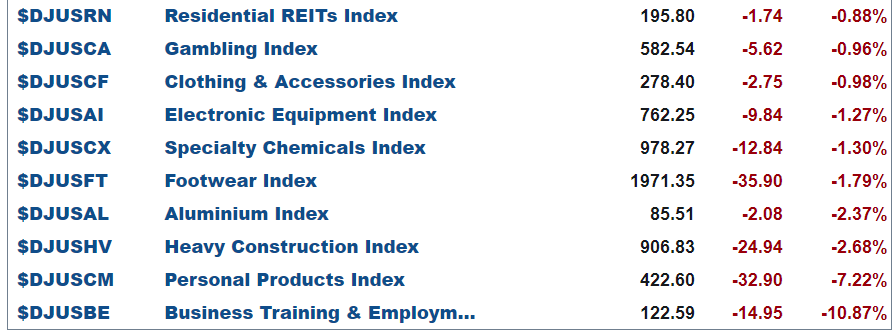
and bottom 10 …
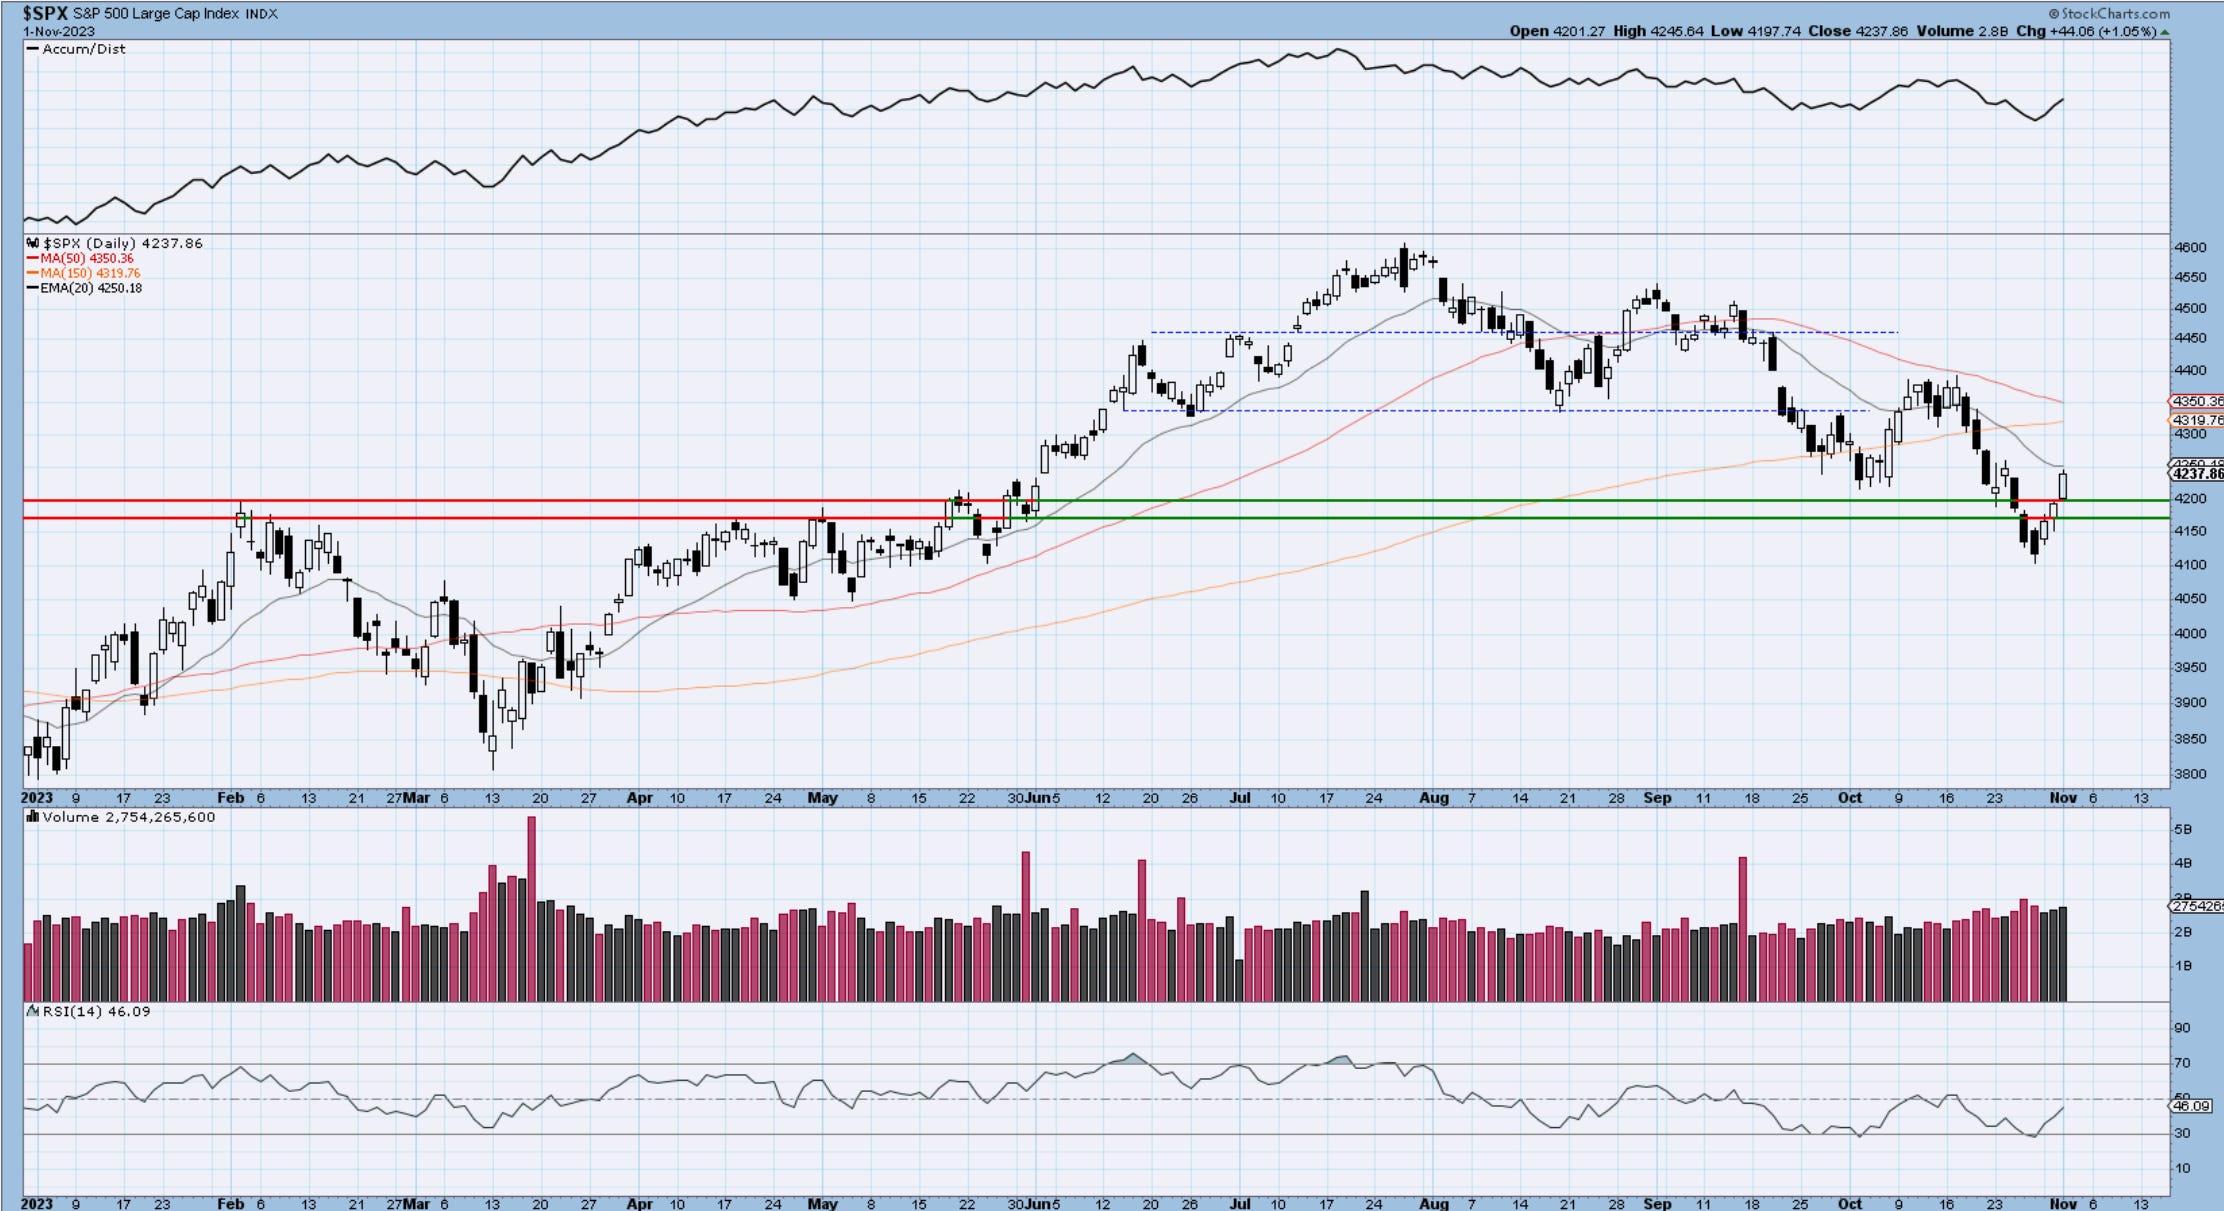
SP500
Three consecutive days of bullish price action in the equities. This comes on the hills of a three prior months decline with over-elevated fears of breakdowns on Friday, Oct 27th. The quick trip below 4200 and into 4100 was reversed at the start of the most bullish period of the year historically. Today’s Fed meeting accelerated the buying after a midday selloff prior to and at times during the press conference. Apparently, the market took Powell’s comments between the lines that the rate hiking cycle is complete and will eventually be followed by cuts if there is an economic slowdown next year. I can’t speak to how accurate that is, but what I can speak to is the fact that the signs I have been pointing to for several days now have proven to be important in terms of breadth, volatility, counts, sentiment, and seasonality.
If wave ((iv)) is complete then the current rally must be wave (i) of the next leg to the upside. The move is healthy and impulsive and might have a bit more to go before we correct in wave (ii). We must be aware of some headwinds as the 20-day MA and the 61.8% levels near 4280 ( this is measured from the latest drop in wave v ).
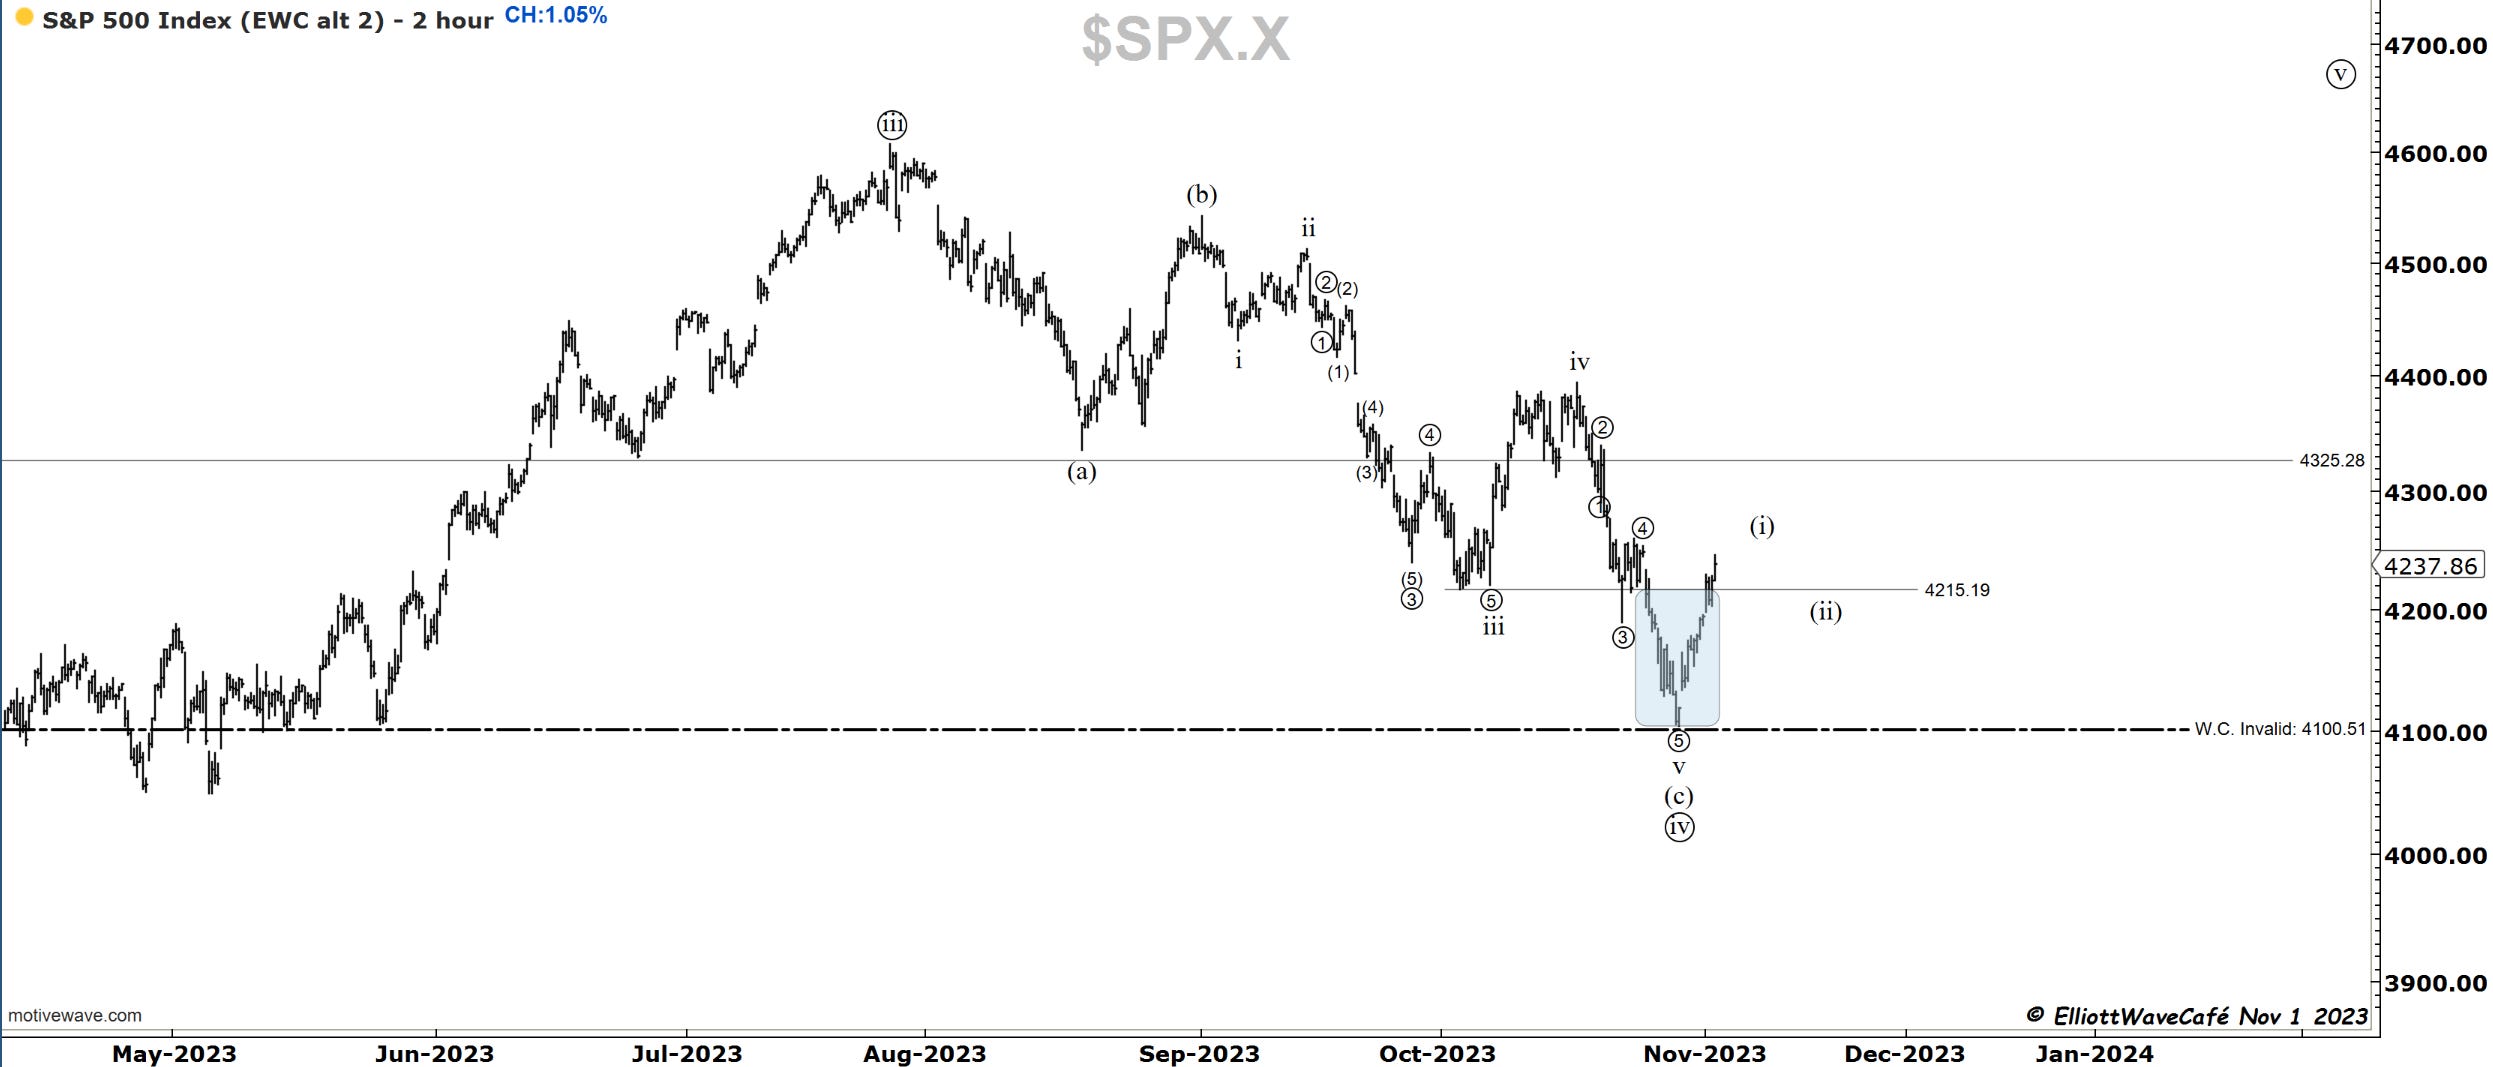
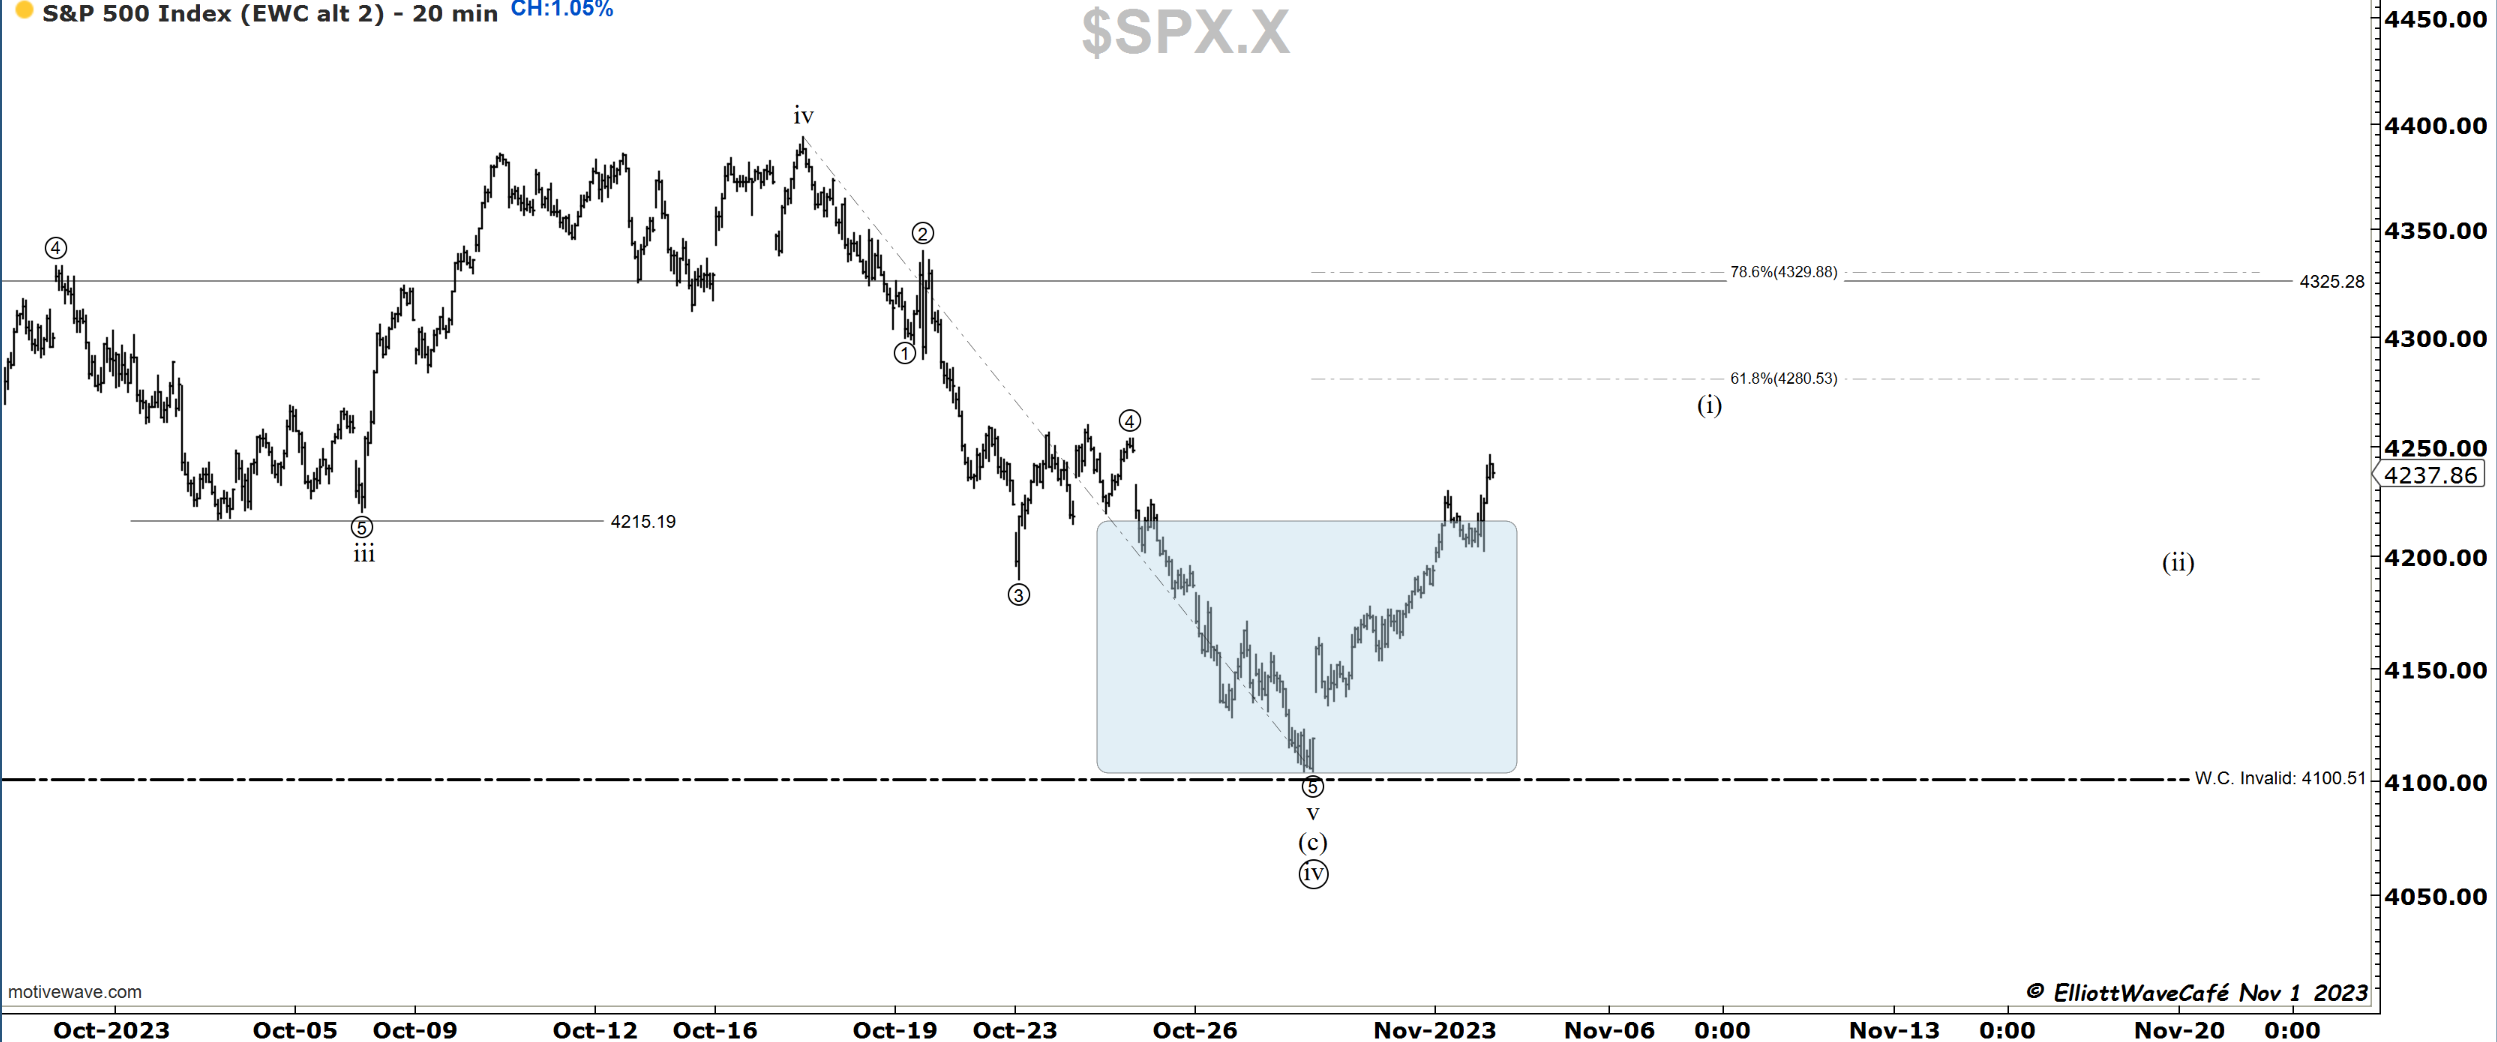
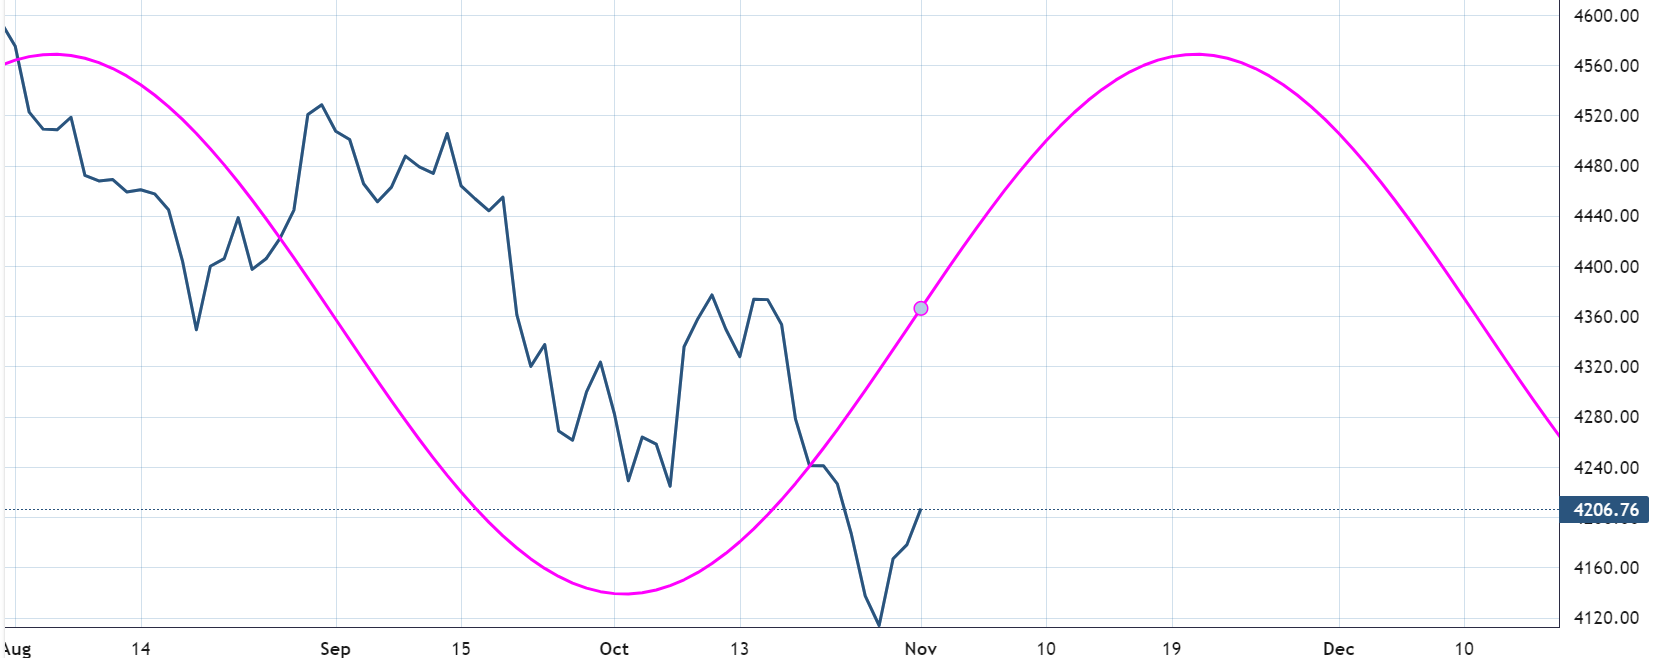
The current 82-day cycle points to further gains for the bigger part of November.
Nasdaq100
Nasdaq100 had an outstanding day, up +1.77%. We’re rapidly approaching the 61.8% of the latest decline along with the prior wave ((4)) highs. I would expect that area to provide headwinds. Longs will be taking profits up there and shorts will try to initiate positions. The lower degree count suggests there should be a few more upside legs to complete (i). The daily chart below shows a climb back above the prior support line but into a declining 20-day MA. Check out today’s volume on the upswing. It’s what you want to see on up days.
RUSSELL 2000
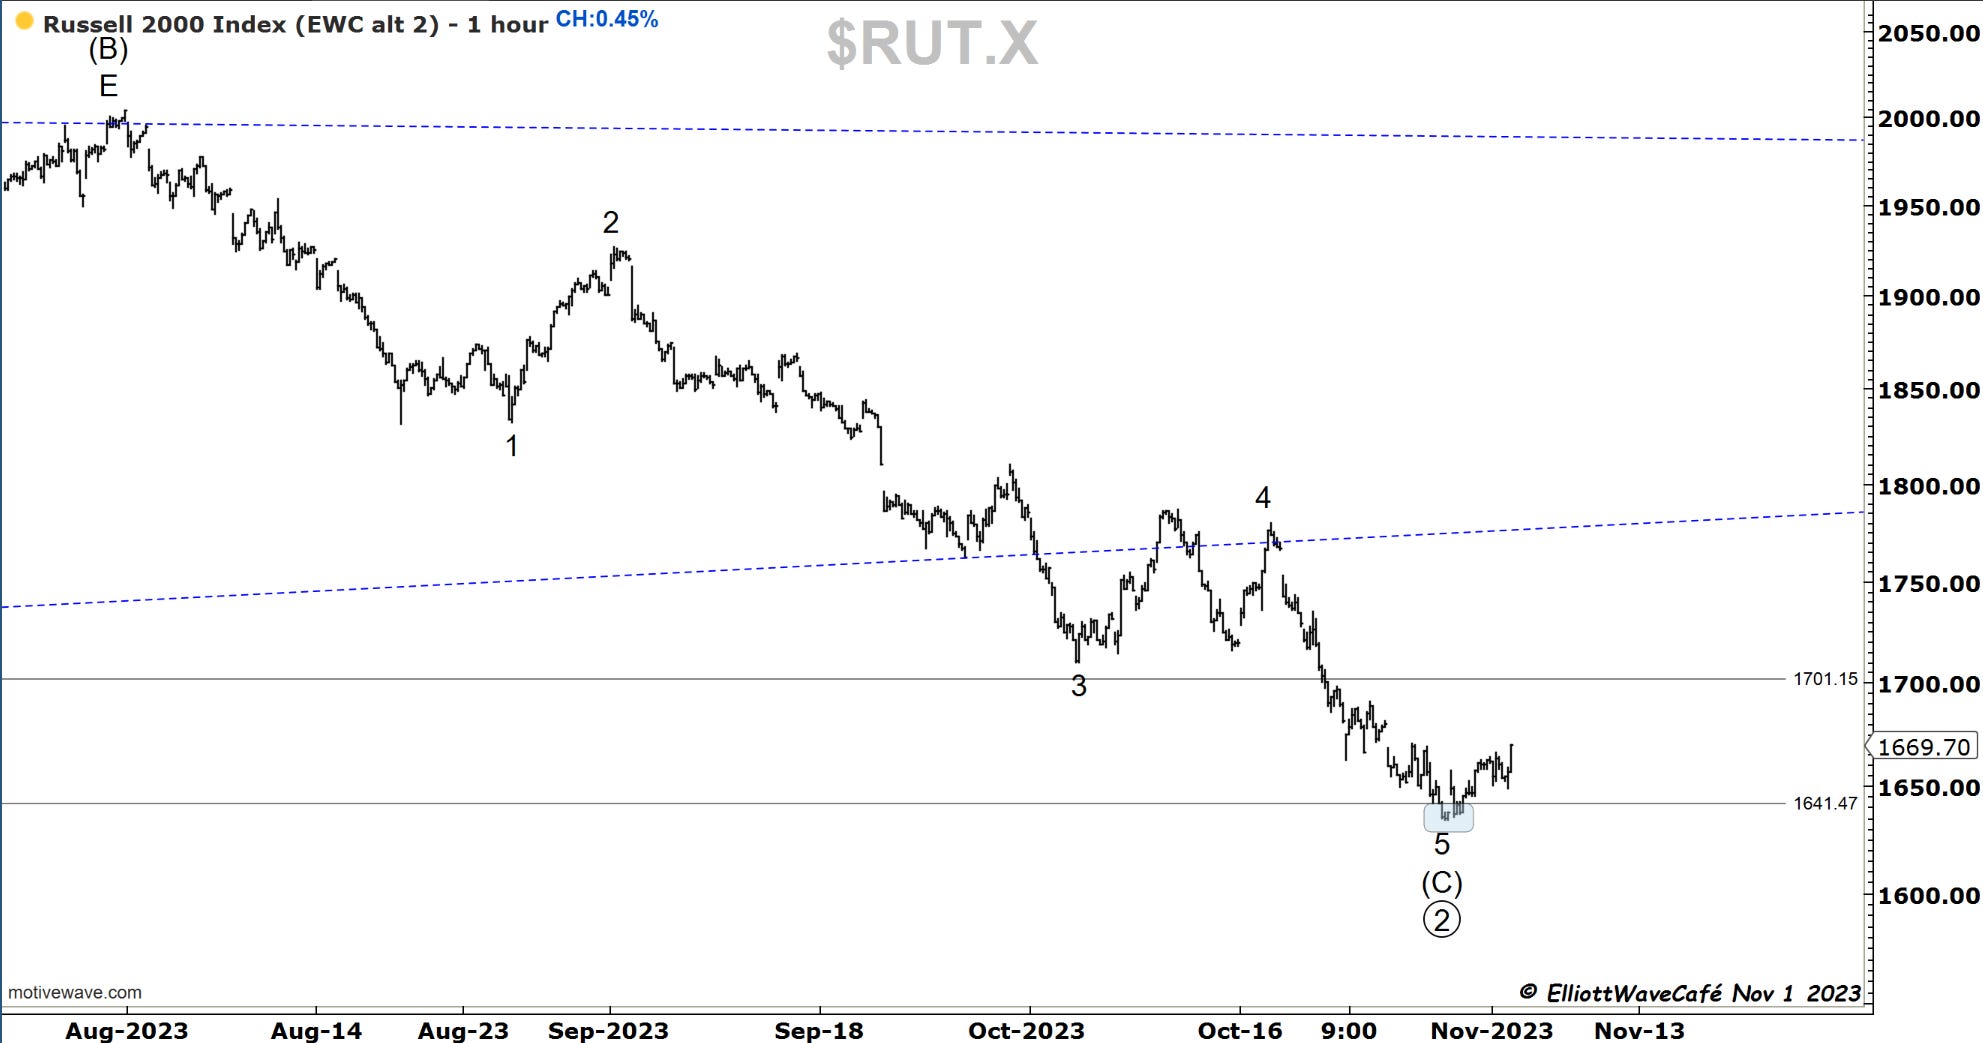
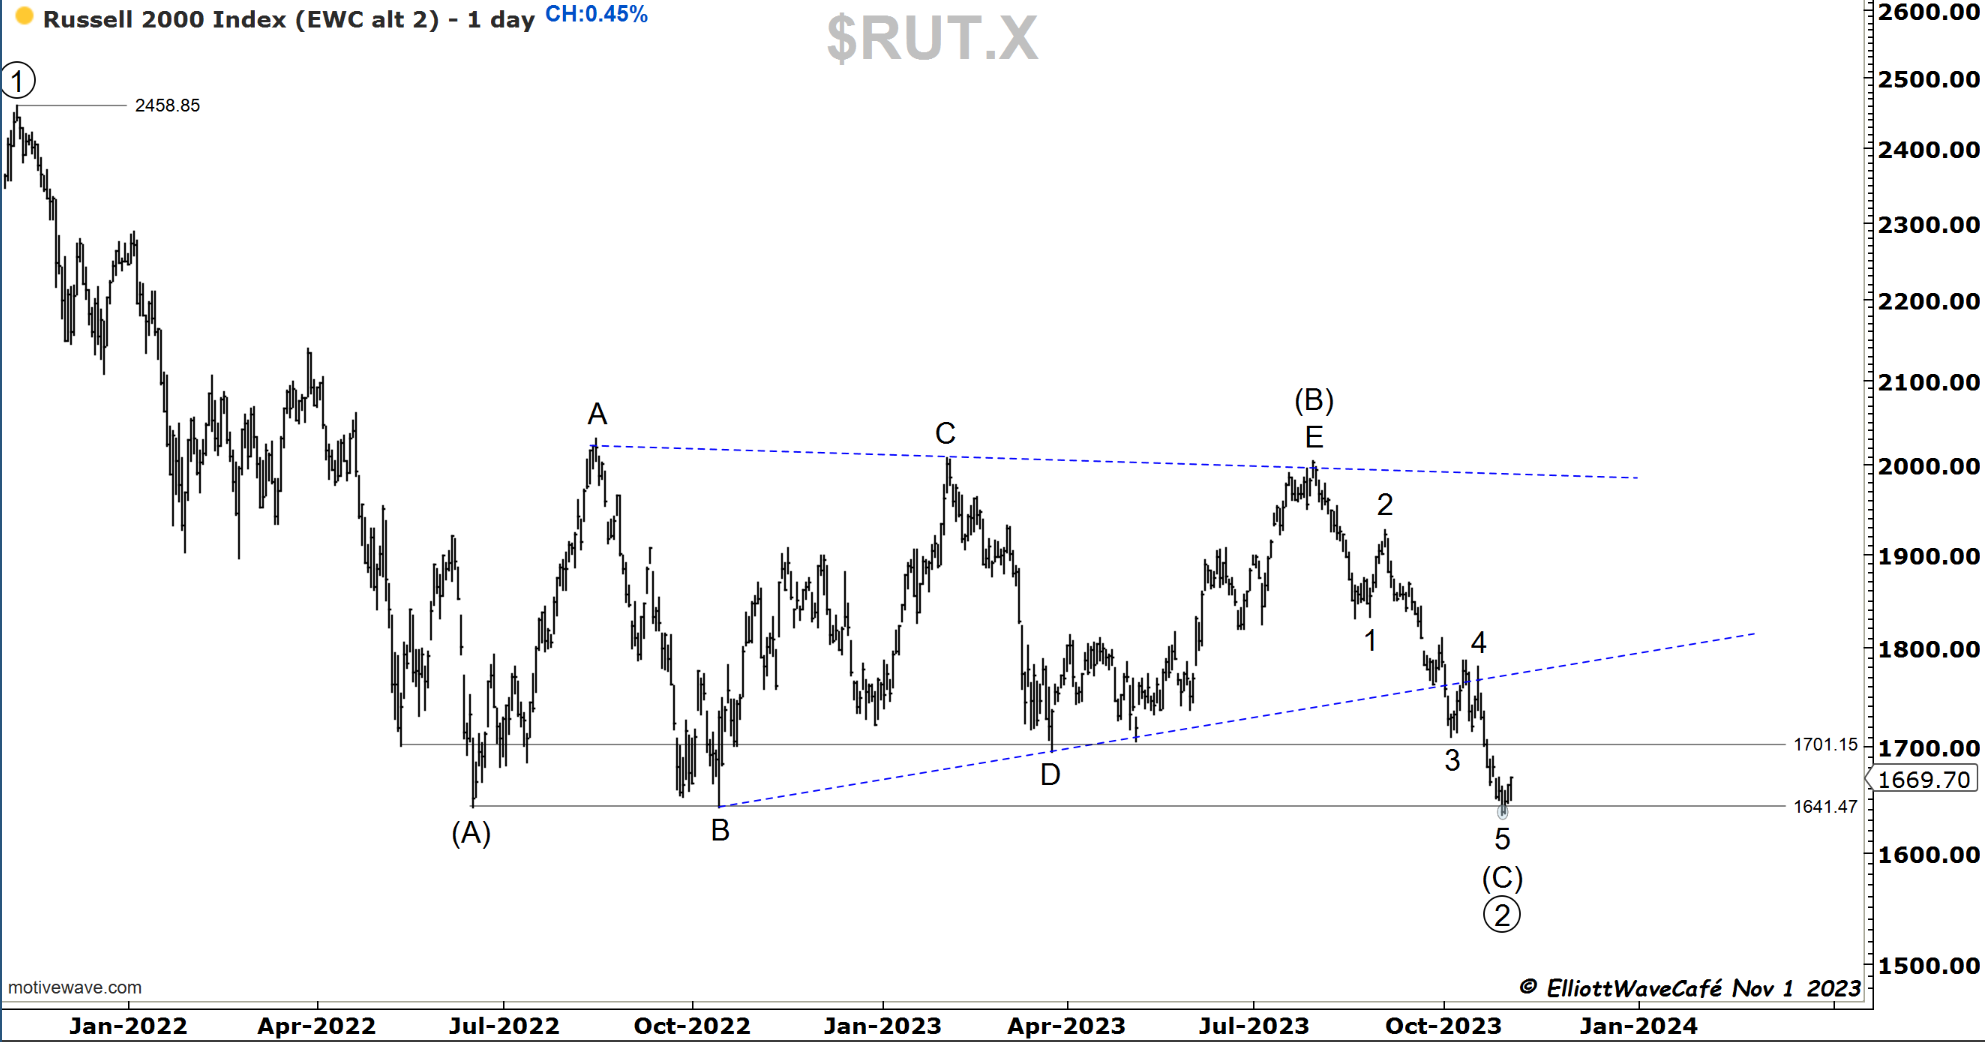
The small cap index remains timid of the lows after briefly breaching support the other day. As I said yesterday, I think there is a decent potential here for more gains supported by the counts and the 100-day active cycles (chart of IWM). 1700 is the first upside hurdle, let’s see if they can conquer it. Lots of rate-sensitive stocks here and if they retreat, it will be fuel for these stocks.
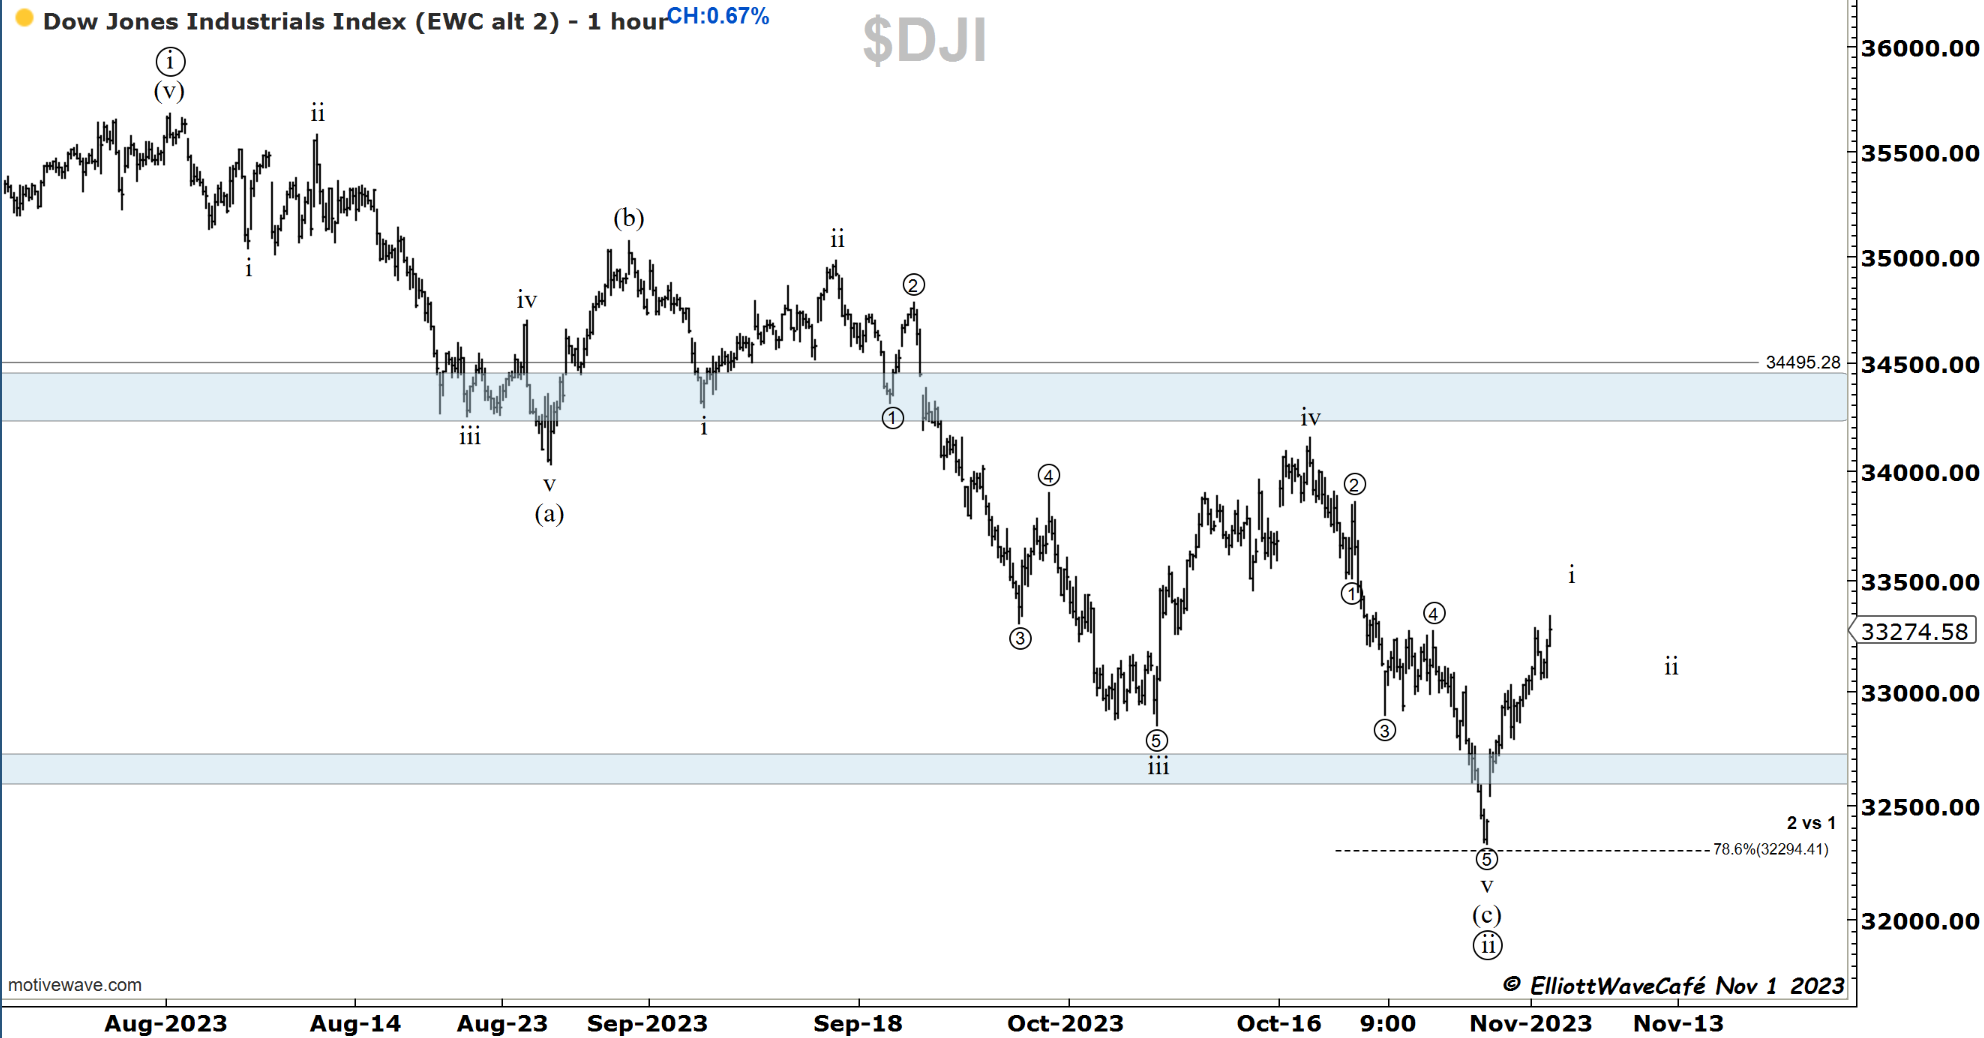
Dow30
I see 5 waves clear as day forming on the 1h chart. It gives me confidence that we’re on the right track with the count and expecting further gains upon necessary corrections. Our 3x ETF’s exposure to DOW is well overweight this week.
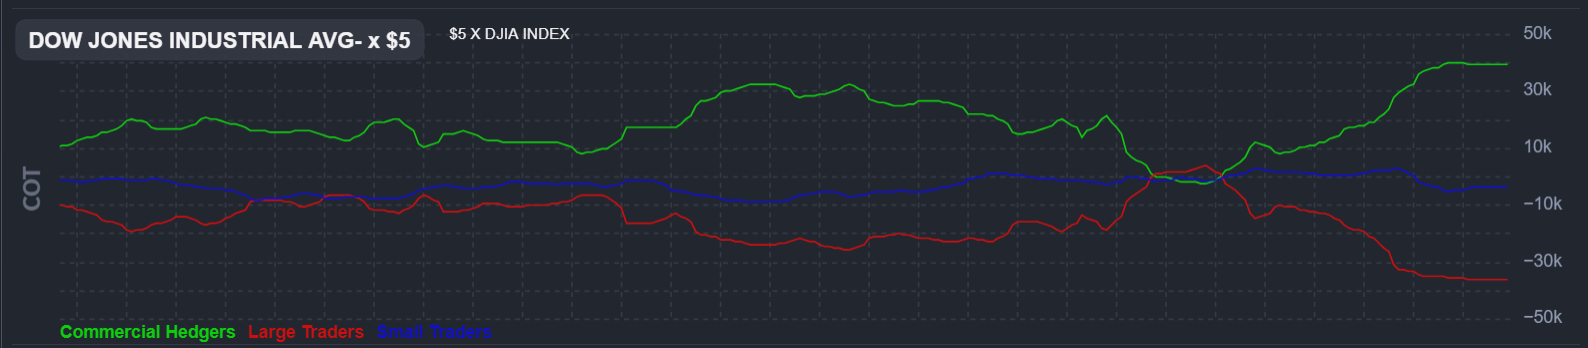
Look how short the large traders are in this particular market. The market tends to punish these extreme positions.
US Dollar and Yields
This tricky currency market is not giving up just yet, if anything it had another attempt at breaking the prior highs. Unsuccessful at the moment, but something that keeps me in check when I analyze risk. Any strong break higher in the dollar won’t be seen well by equity traders. We’re waiting for a break of 105.50 to give a further tailwind to markets.
Yields had a big drop today after the Fed “hinted” at cycle over. Stocks up makes sense, but the dollar did not get the full memo yet. The yellow line diverging still.
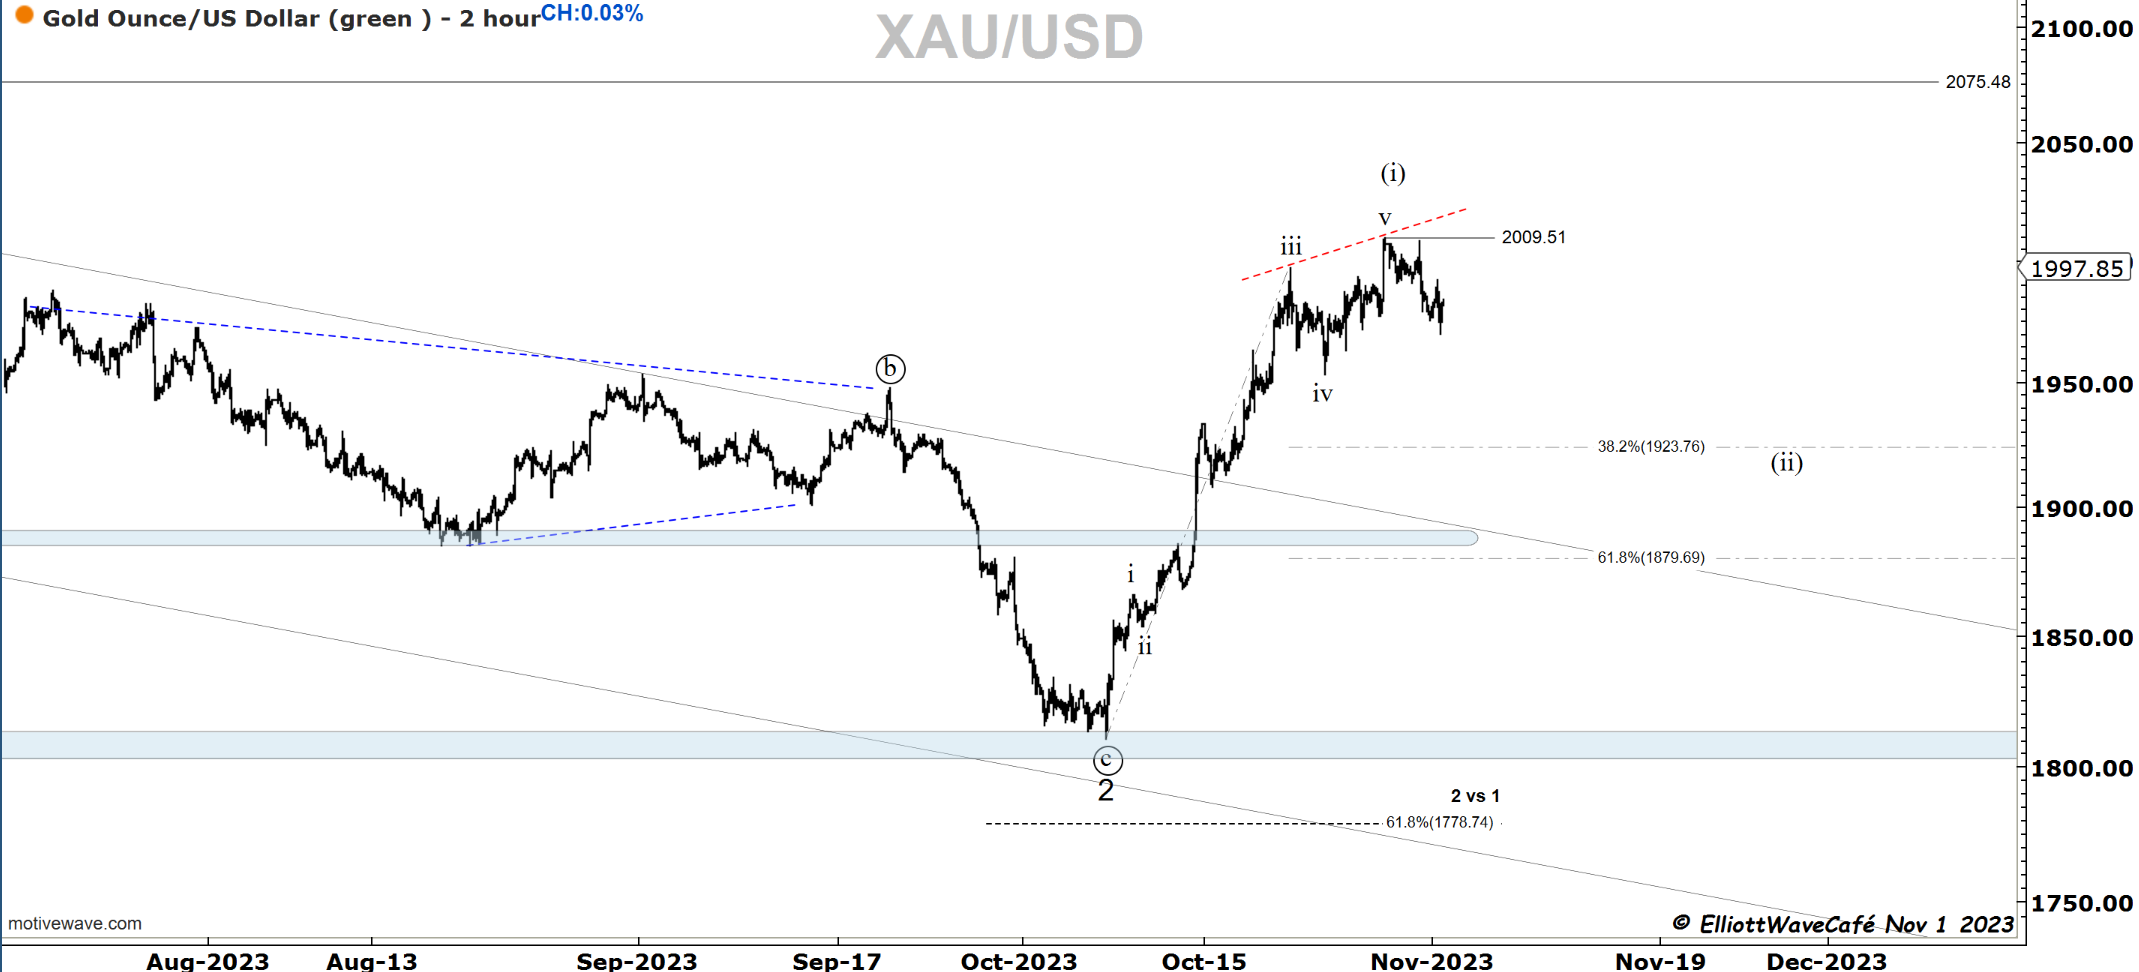
Gold
Prior comments on Gold remain - gold continues to struggle on upswing.
Gold is trying to rally but the rate of ascent is slowing. I can see a possible 5-wave move with divergence in RSI. Let me just say that being long here is playing with a bit of fire. Once a wave (ii) pullback unfolds the odds will be back in bullish favor.
Bitcoin
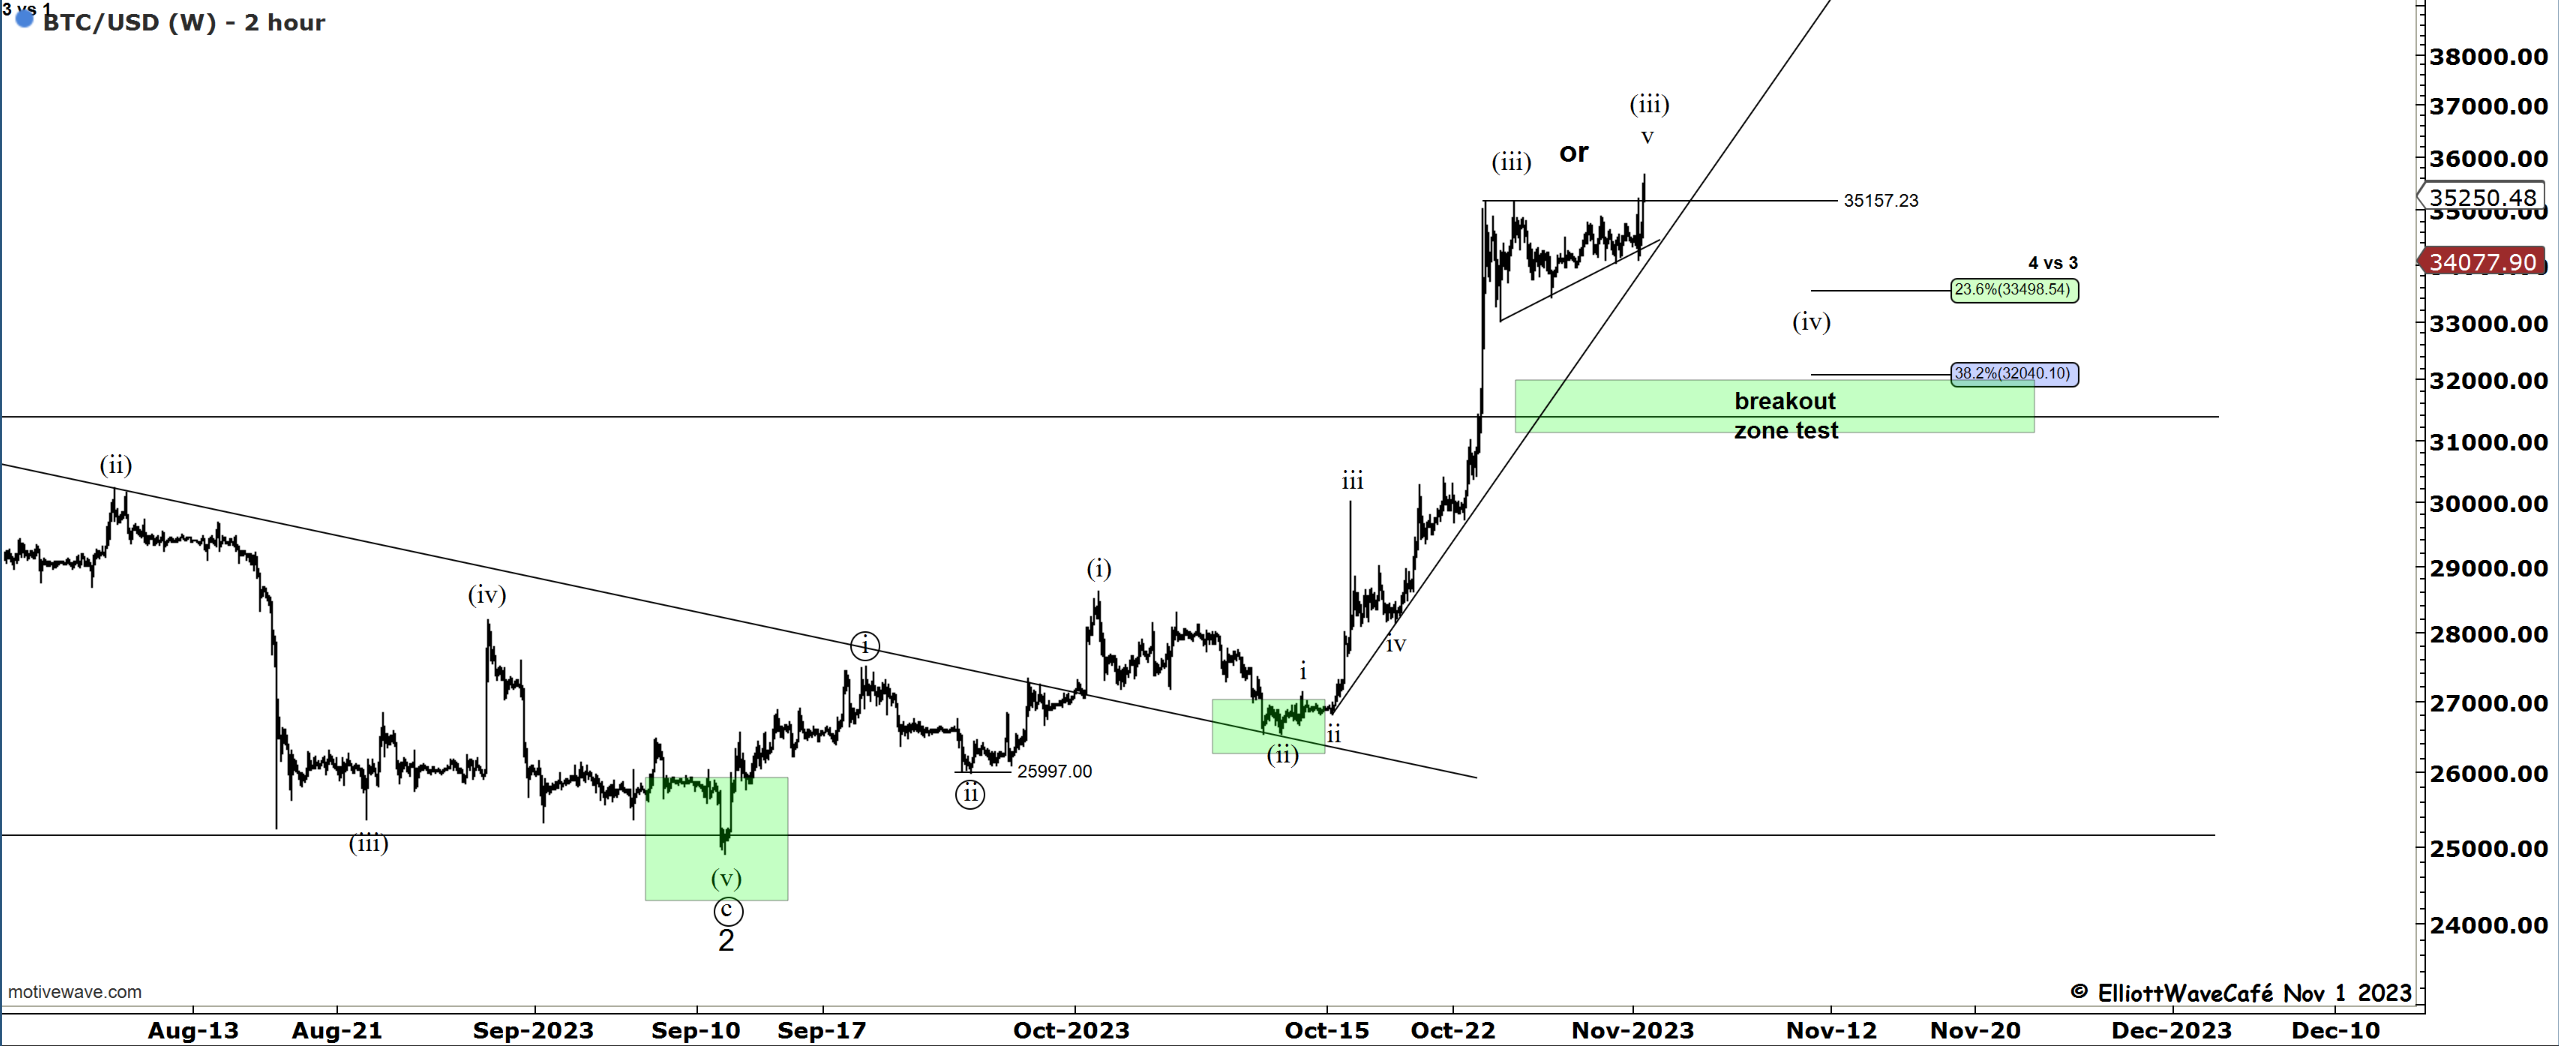
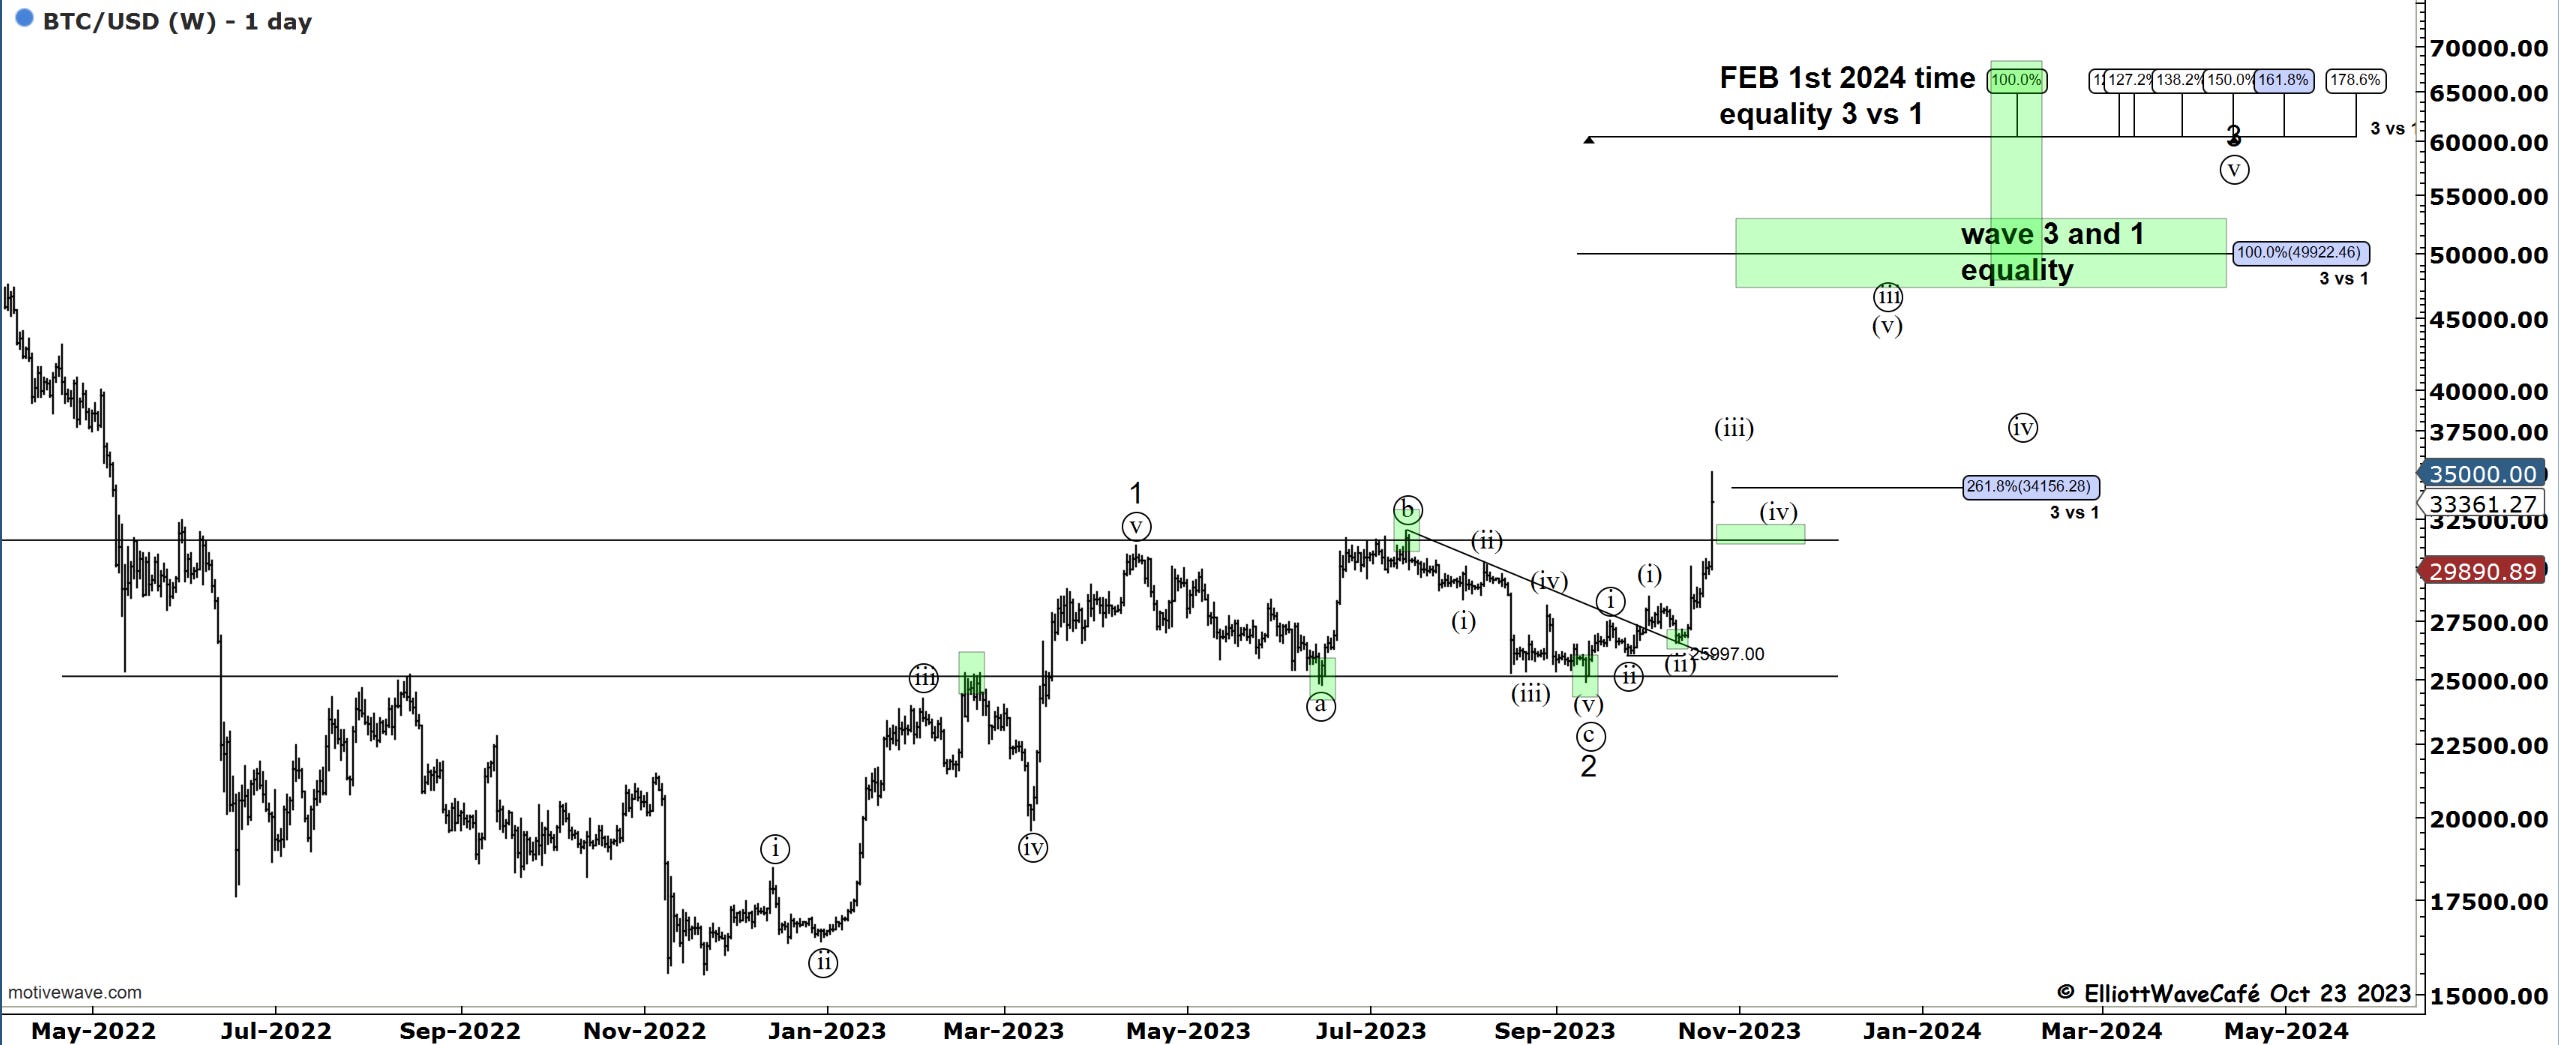
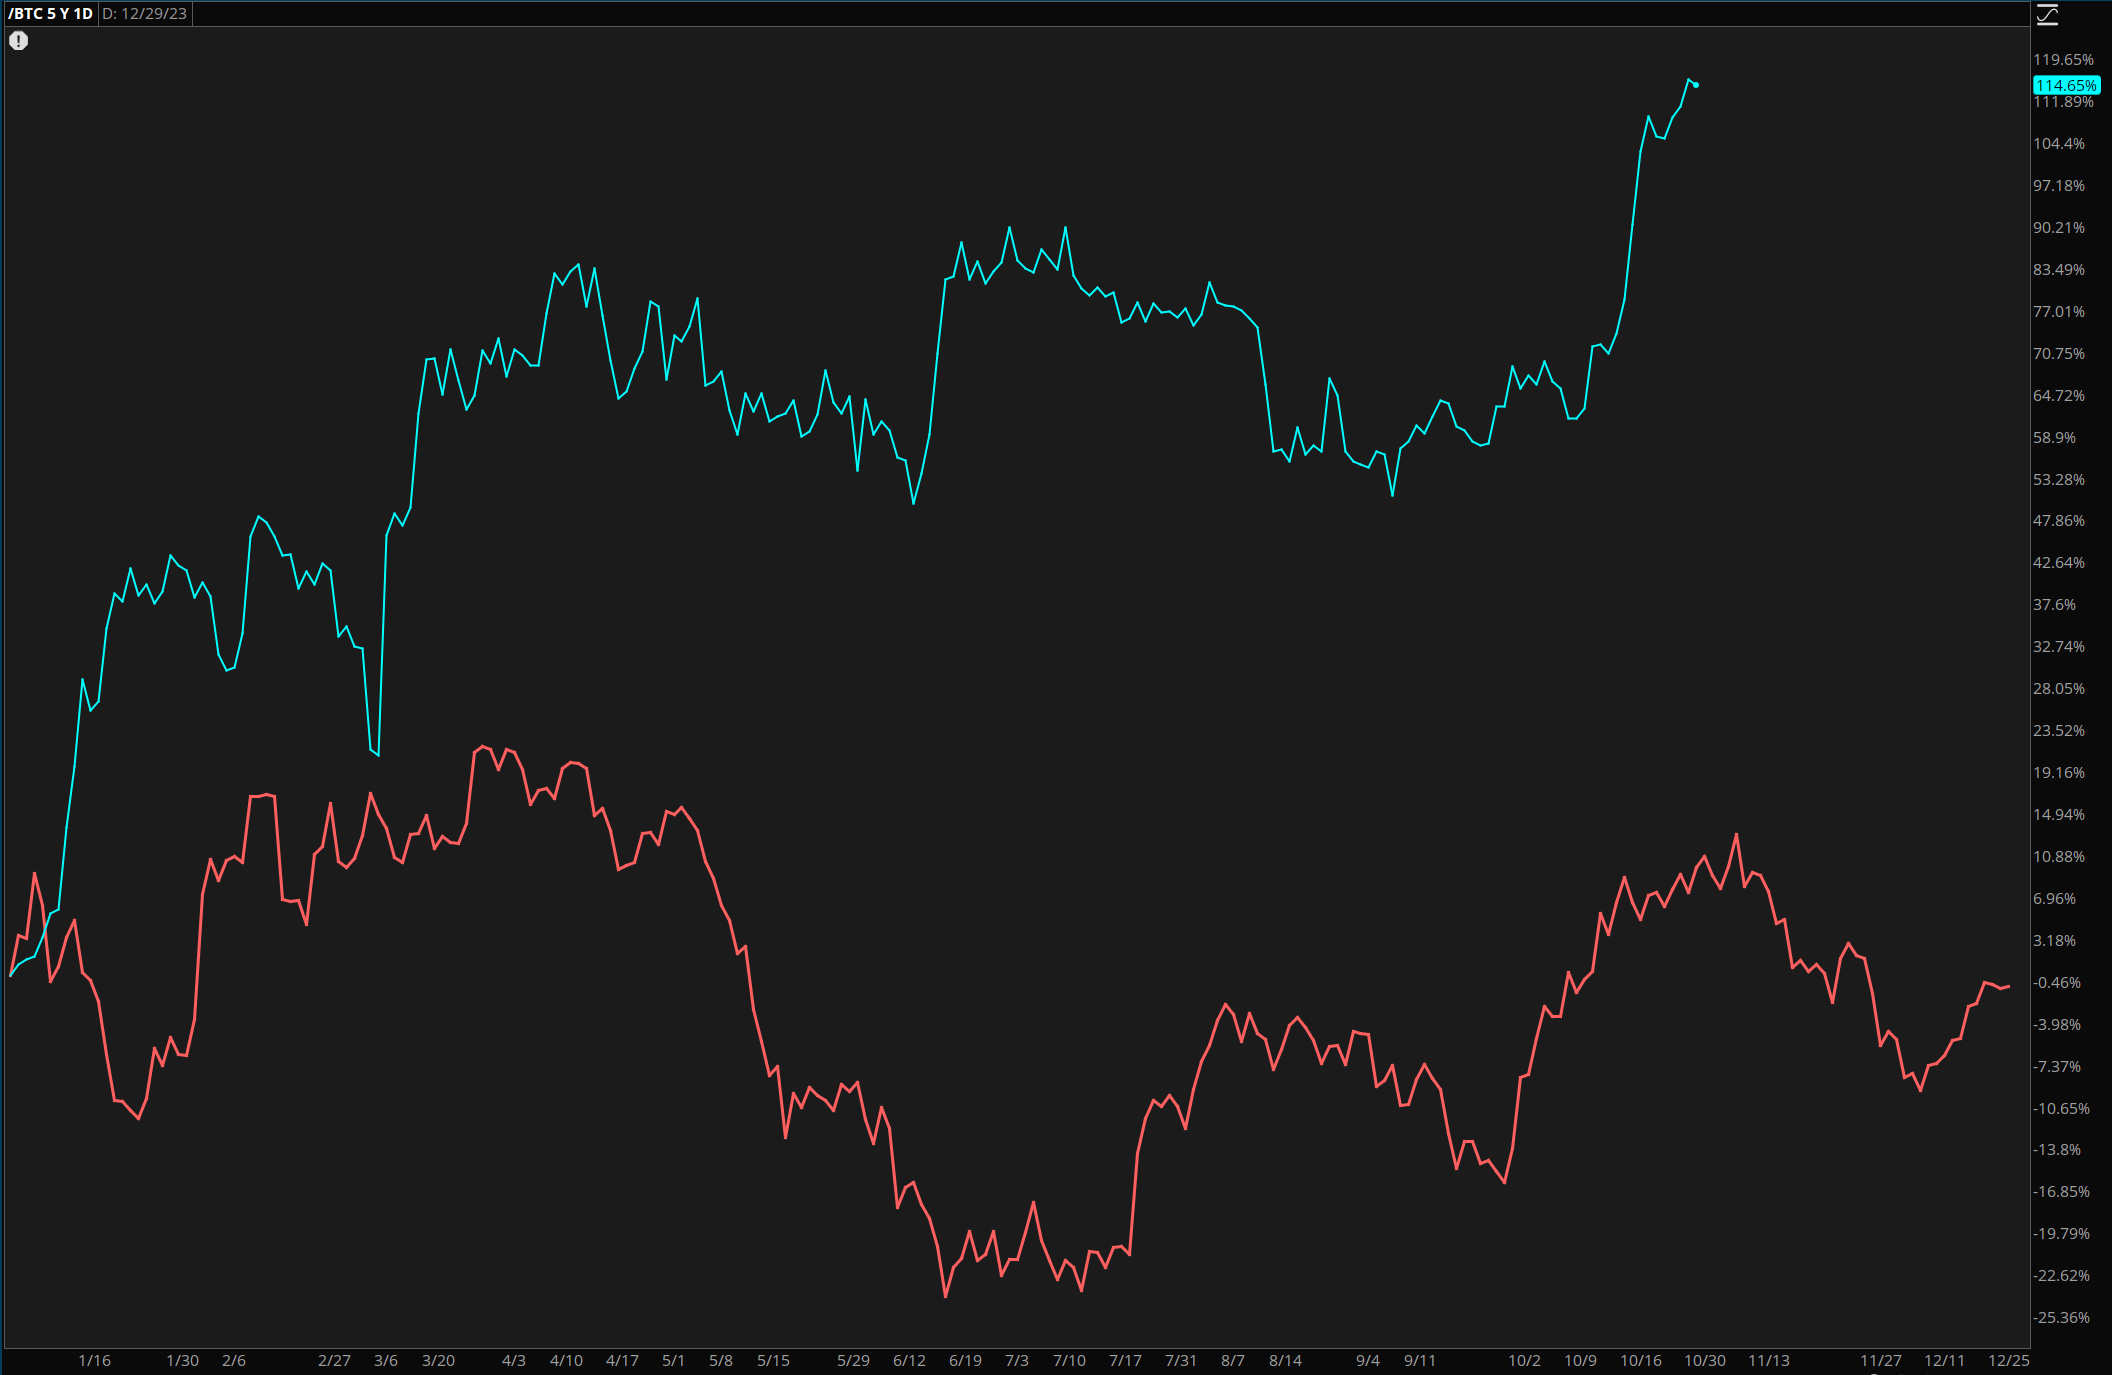
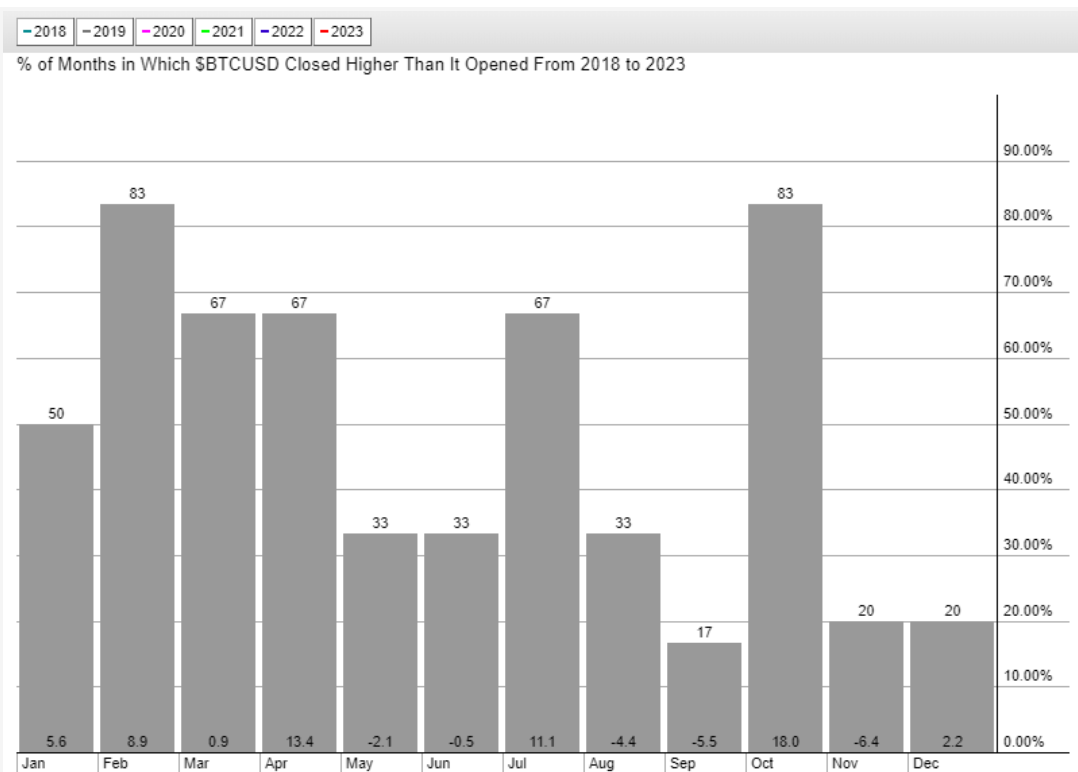
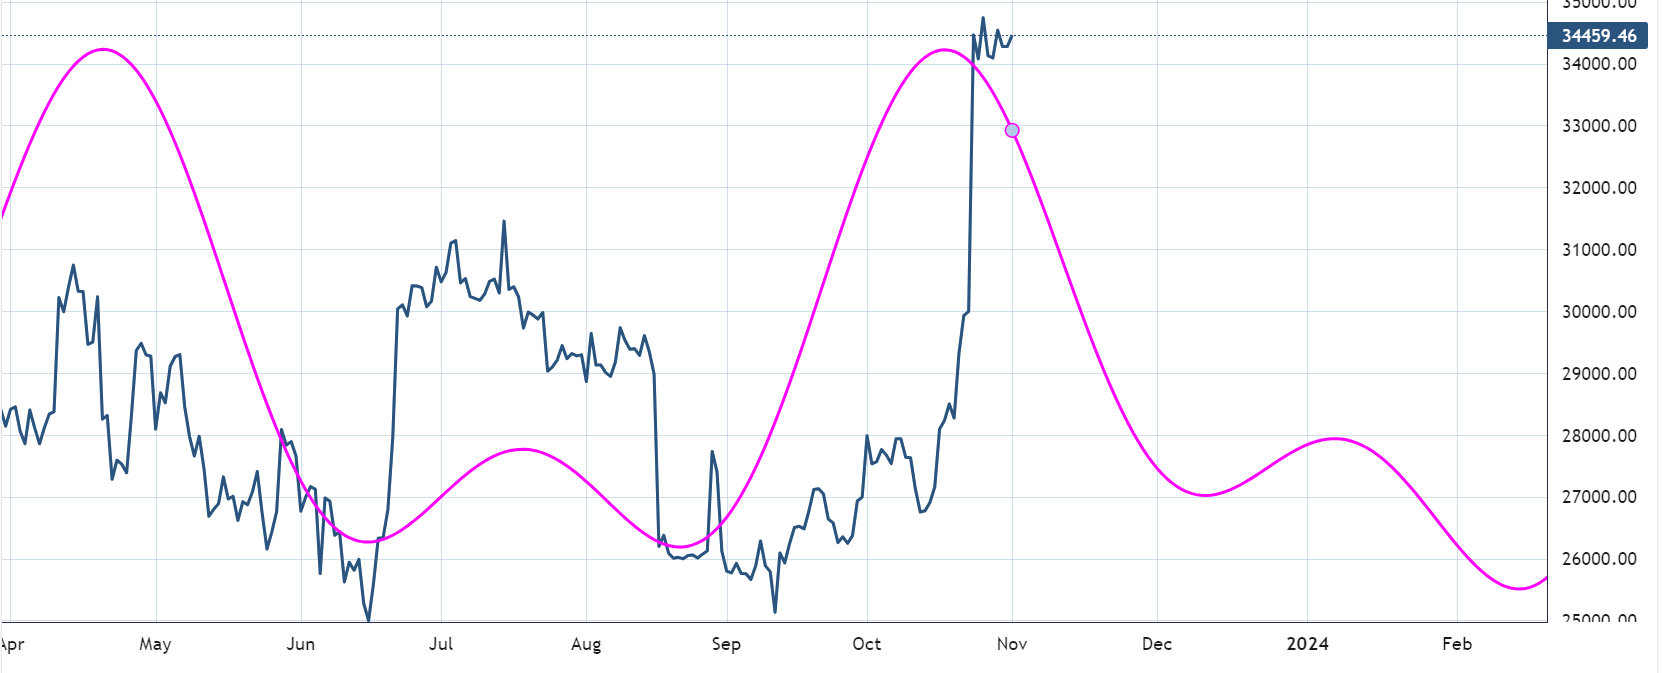
As discussed in yesterday’s piece, ascending triangles, as they call them in traditional TA, have a tendency to break upwards. The common expectation in EW after the triangle completes and breaks is for a reversal of prices into the next larger degree count. In our case, it is wave (iv). Even if this travels much higher, and I am wrong on the count, my suggestion is to keep trailing stops close and bail below 34k. Sometimes, these triangles appear in the middle of the move, which means there is the possibility of BTC running fast to 42k. It’s a tough bet to make after it already rallied over 7,000 points. Also, I have taken a quick glimpse at seasonality in BTC and it shows me quite a bit of underperformance from roughly Nov 9th to Dec 12th. I remain bullish on the larger structure, pending the usual corrections slowdowns.
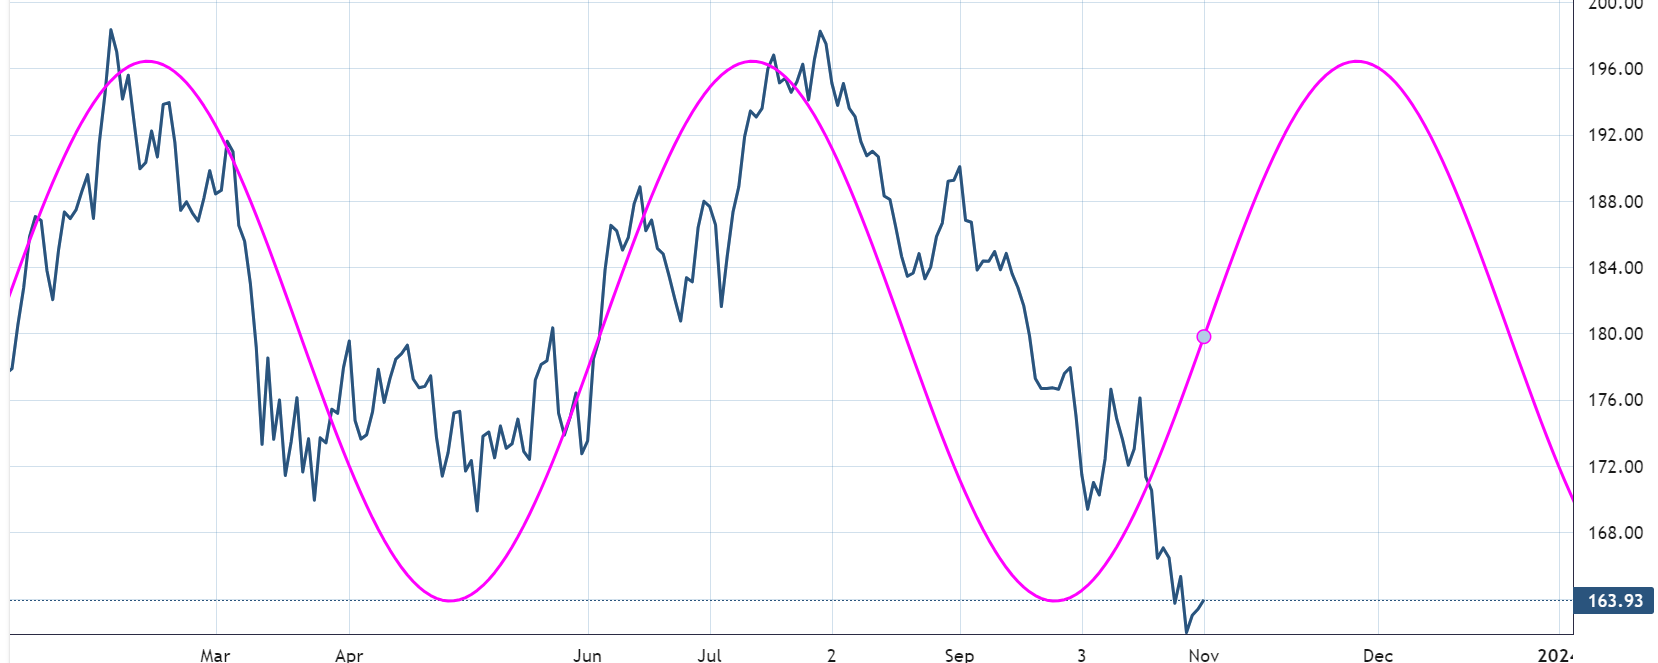
My cycle composite work suggests a period of upcoming weakness as well. Do not look at the price levels shown by the magenta line, but rather the time aspect of it.
Daily video coming up next,
See you tomorrow - trade well,
Cris
email: ewcafe@pm.me