
The Daily Drip
Core markets charts updates and commentary
Note: The counts on the right edge are real-time, and they are prone to adjustments as price action develops. Elliott Wave has a fluid approach, is evidence-based, and requires constant monitoring of certain thresholds.
In the counts below, this (( )) = circle on chart
SP500
The impressive nature of this rally continues day after day. The engines are running at full capacity. It almost feels like nothing could derail this. One day, the large-cap is leading , and the next is the small-cap. That’s the type of behavior that the market is displaying right now. It gave very little chance for entries to those disciplined with non-existing pullbacks. Every little dip finds buyers, and it gets pushed higher.
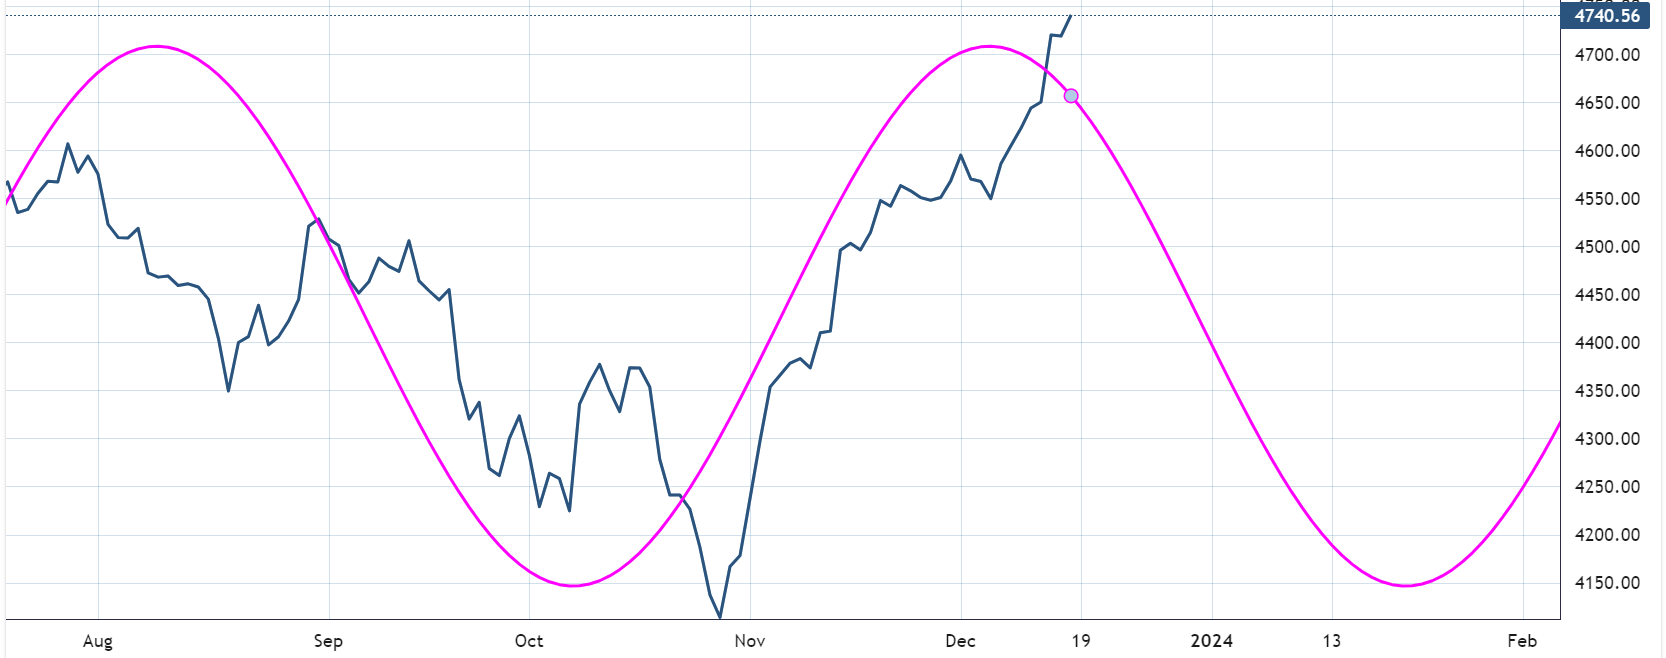
Yet, we can see the steep angle of ascent in red on the chart vs. the rally from March through July in blue. Of course, a trader who wants to join this market asks himself how far this will go and where he could get in. We’re monitoring wave one at several degrees of trend depending on the count used. Once it is completed, it will lead to a correction. That would be the first chance to join the uptrend. Notice the almost equality between the red waves. Notice the ATH resistance along with the channel's upper levels. Notice the cycle chart below. I think these are pretty strong technical signs that a top is approaching. However, until the market displays a decent move in the opposite direction, one needs to wait. I think the display of an upcoming corrective period will be quite visible on the chart.
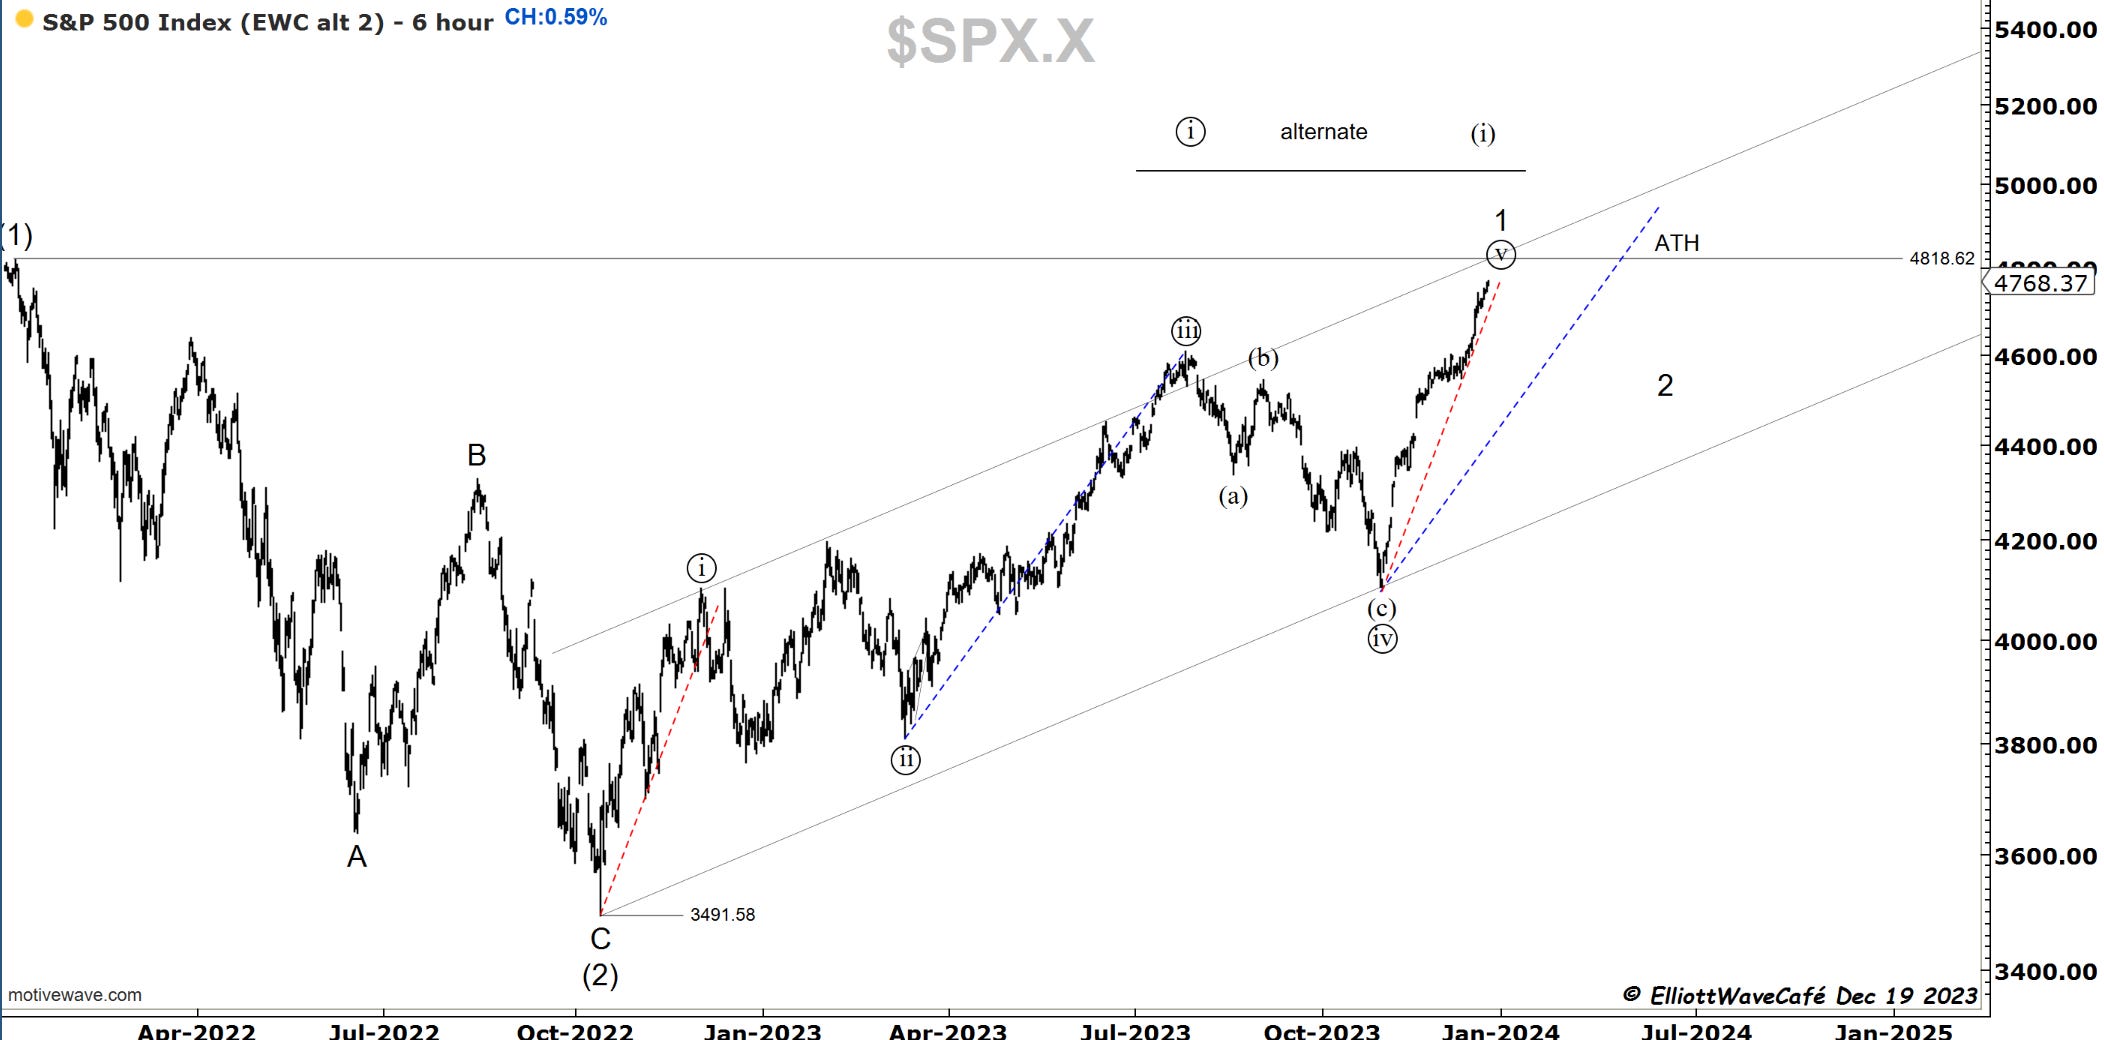
In this bullish alternate chart, you can see how a wave (iii) would be built under normal conditions of a motive wave. Wave ii should not even make it below 4600.
Nasdaq100
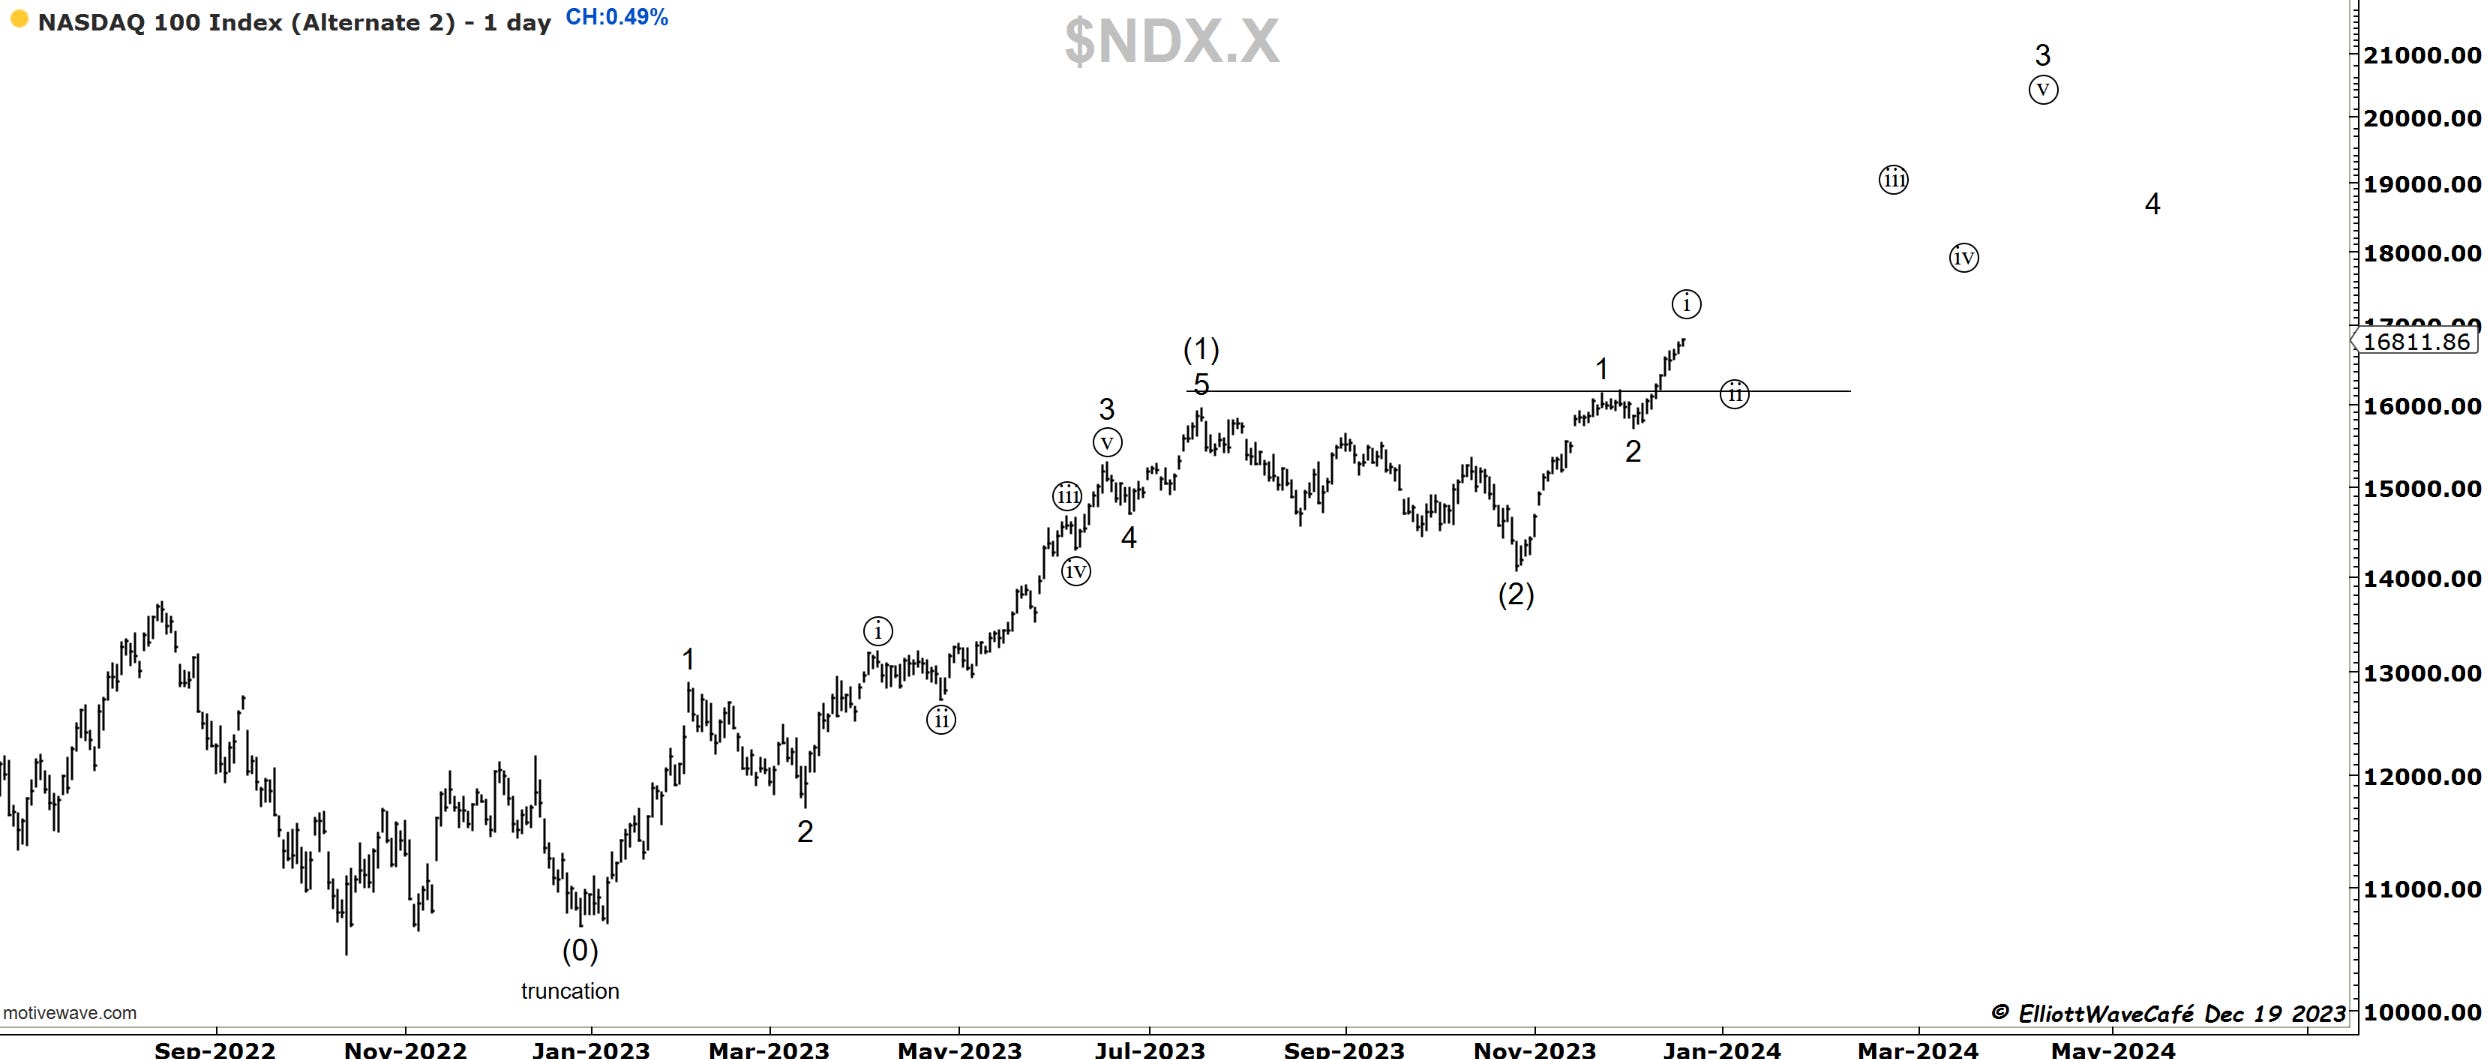
Nasdaq is approaching equality between proposed waves ((v)) and ((i)). It hits exactly at 16,969.
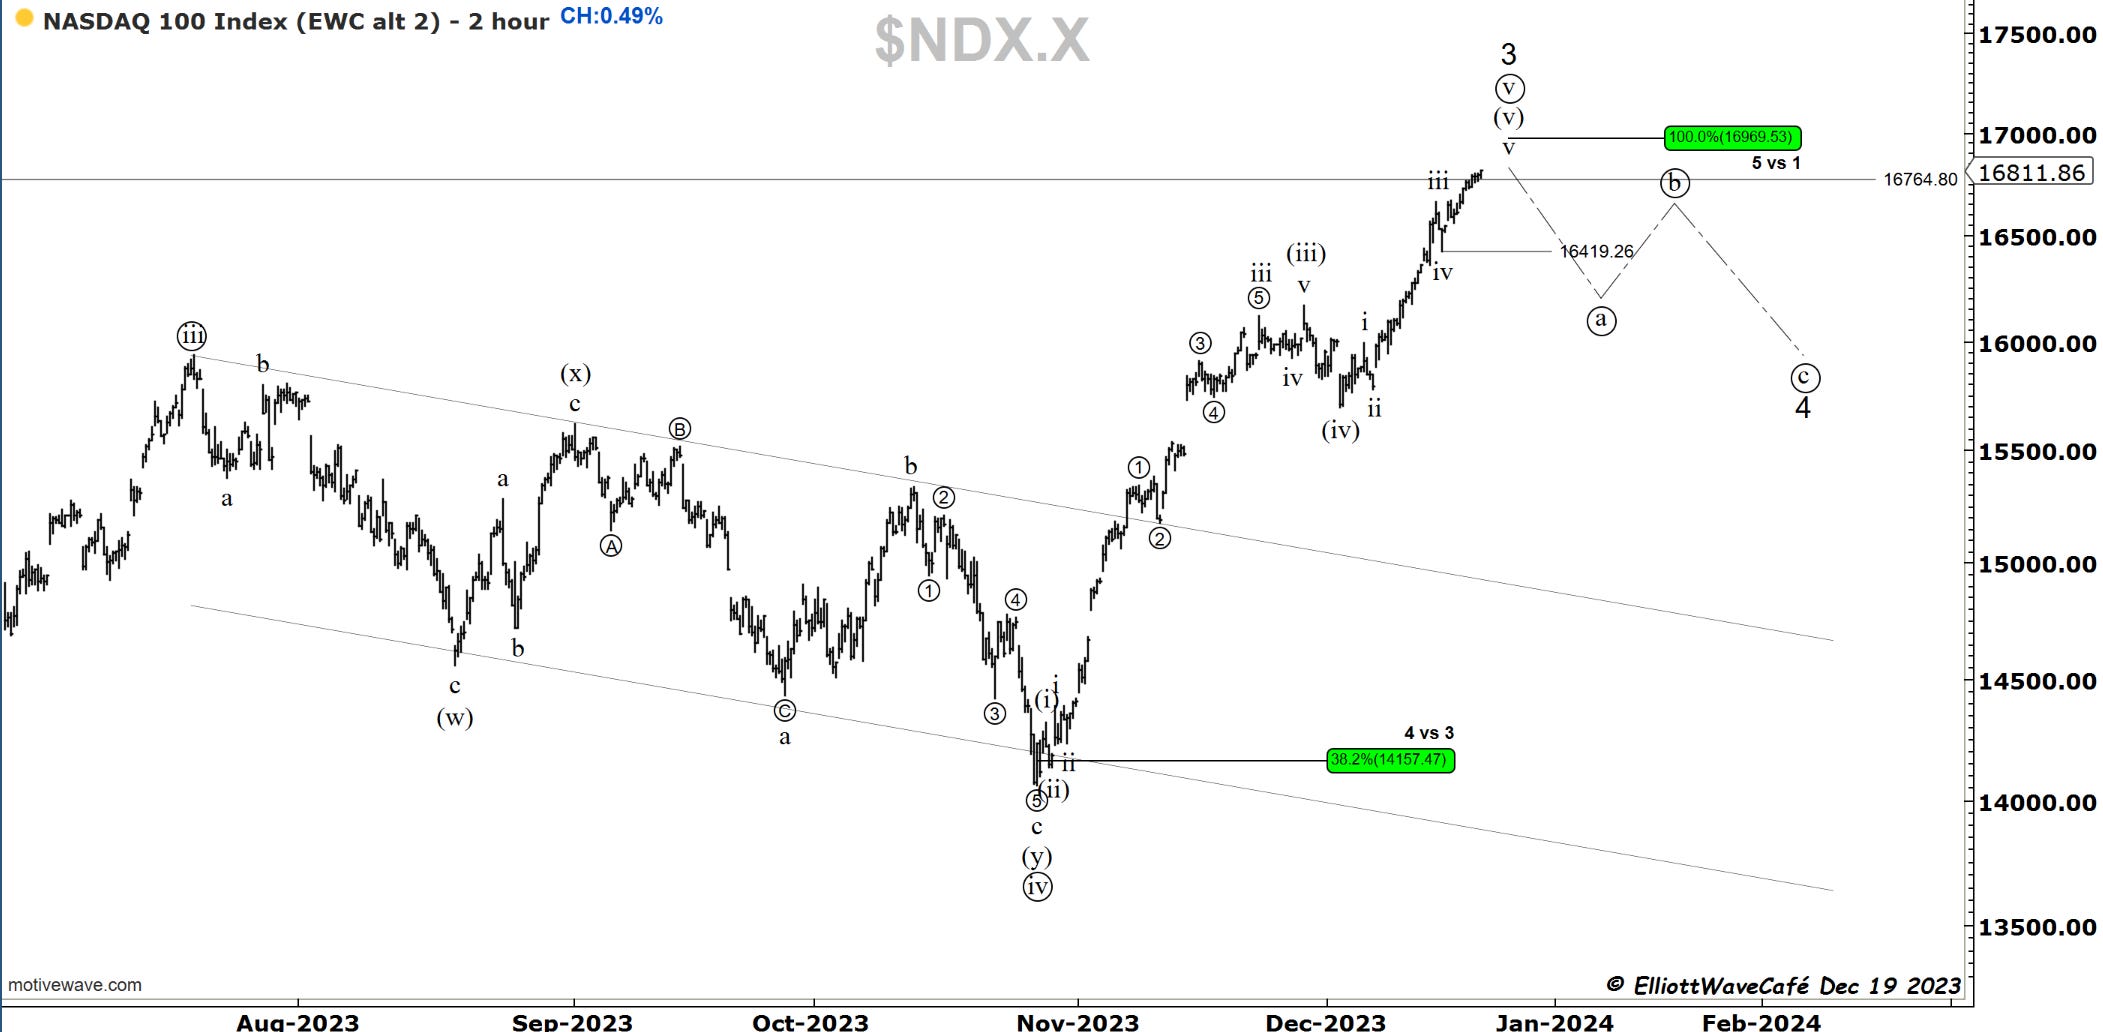
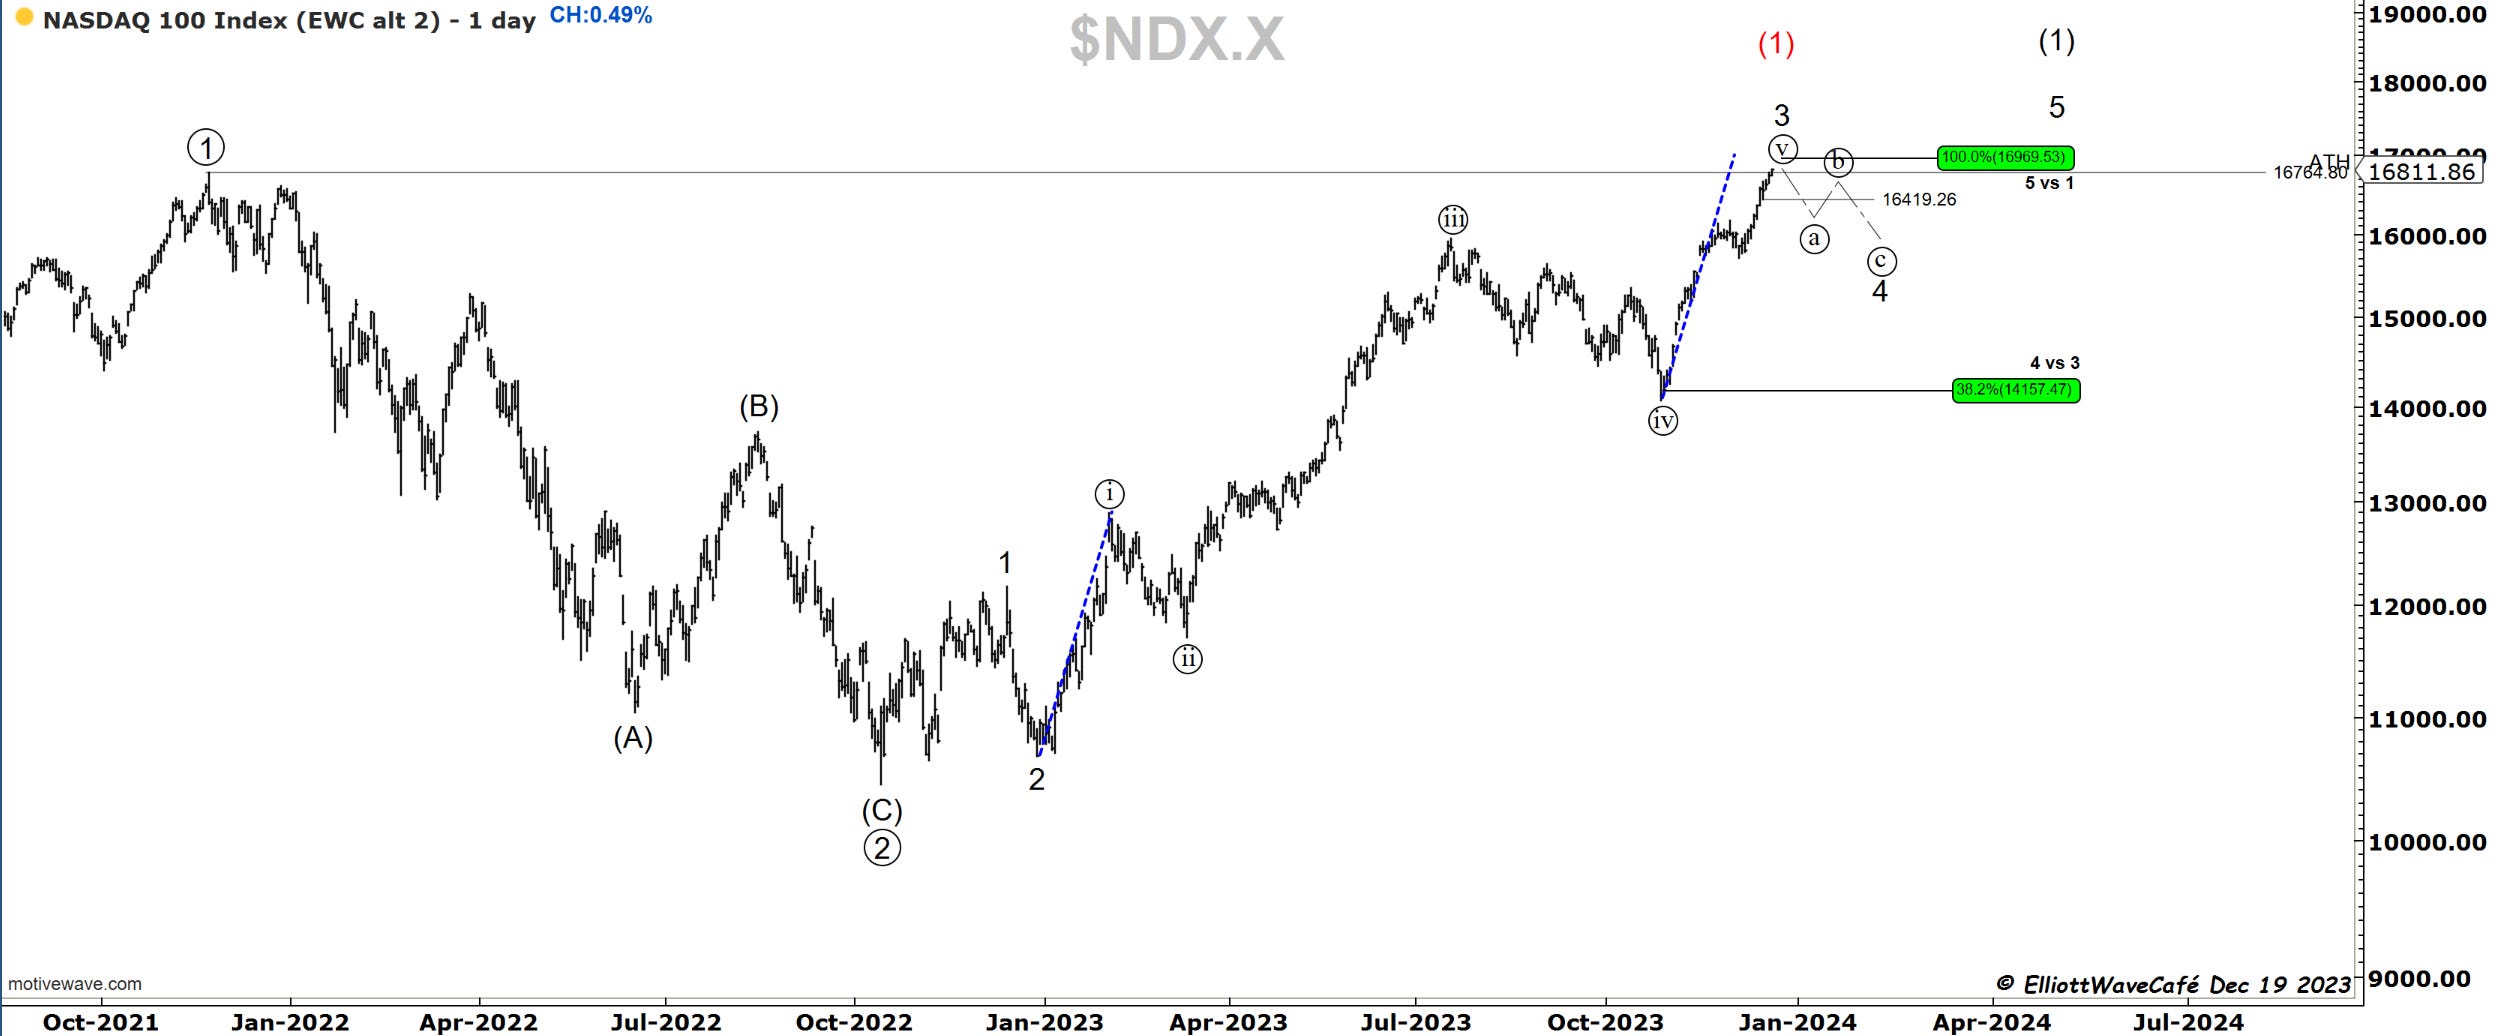
On the ultra-bullish alternate, just like in the SP500, we see this
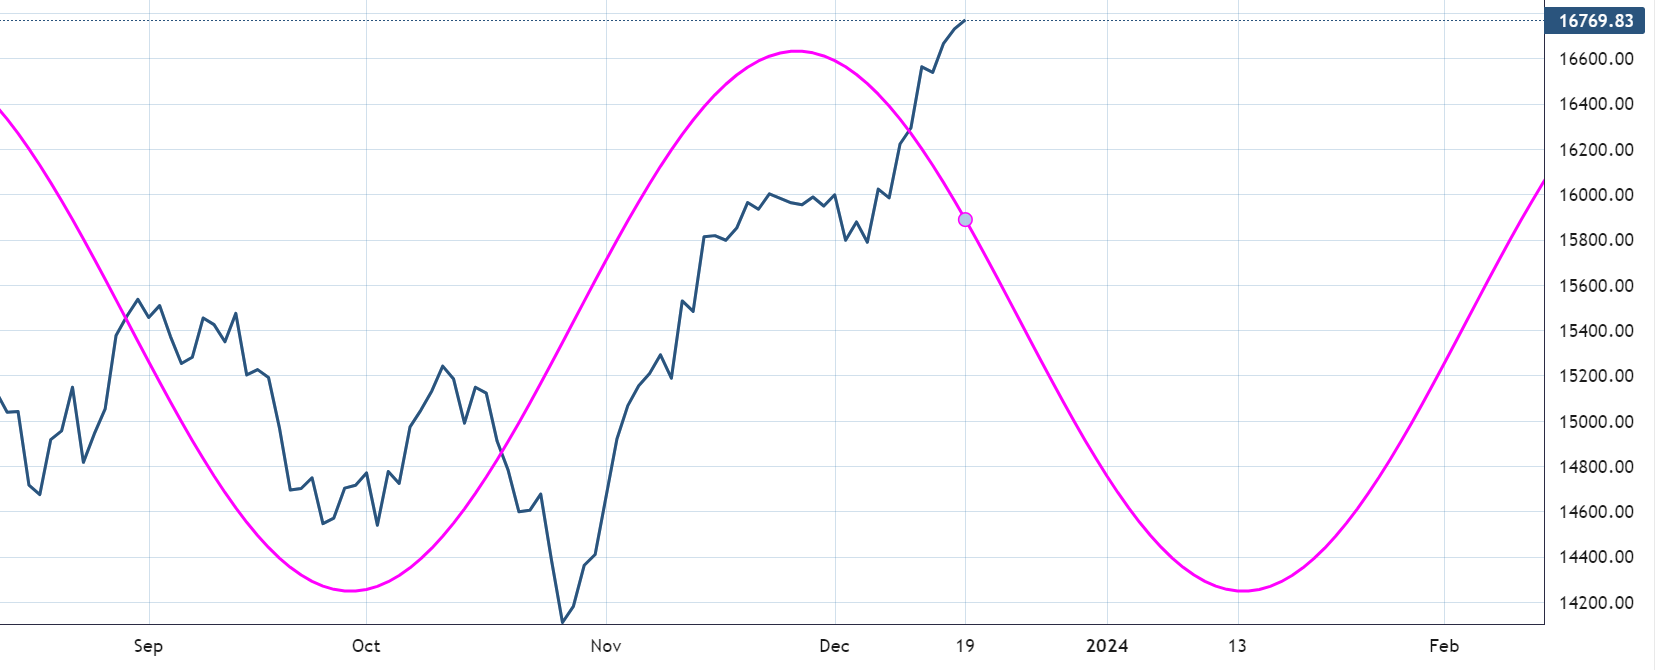
Here is the 82-day cycle in the NDX. Overdue for a period of weakness into mid-end January.
RUSSELL 2000
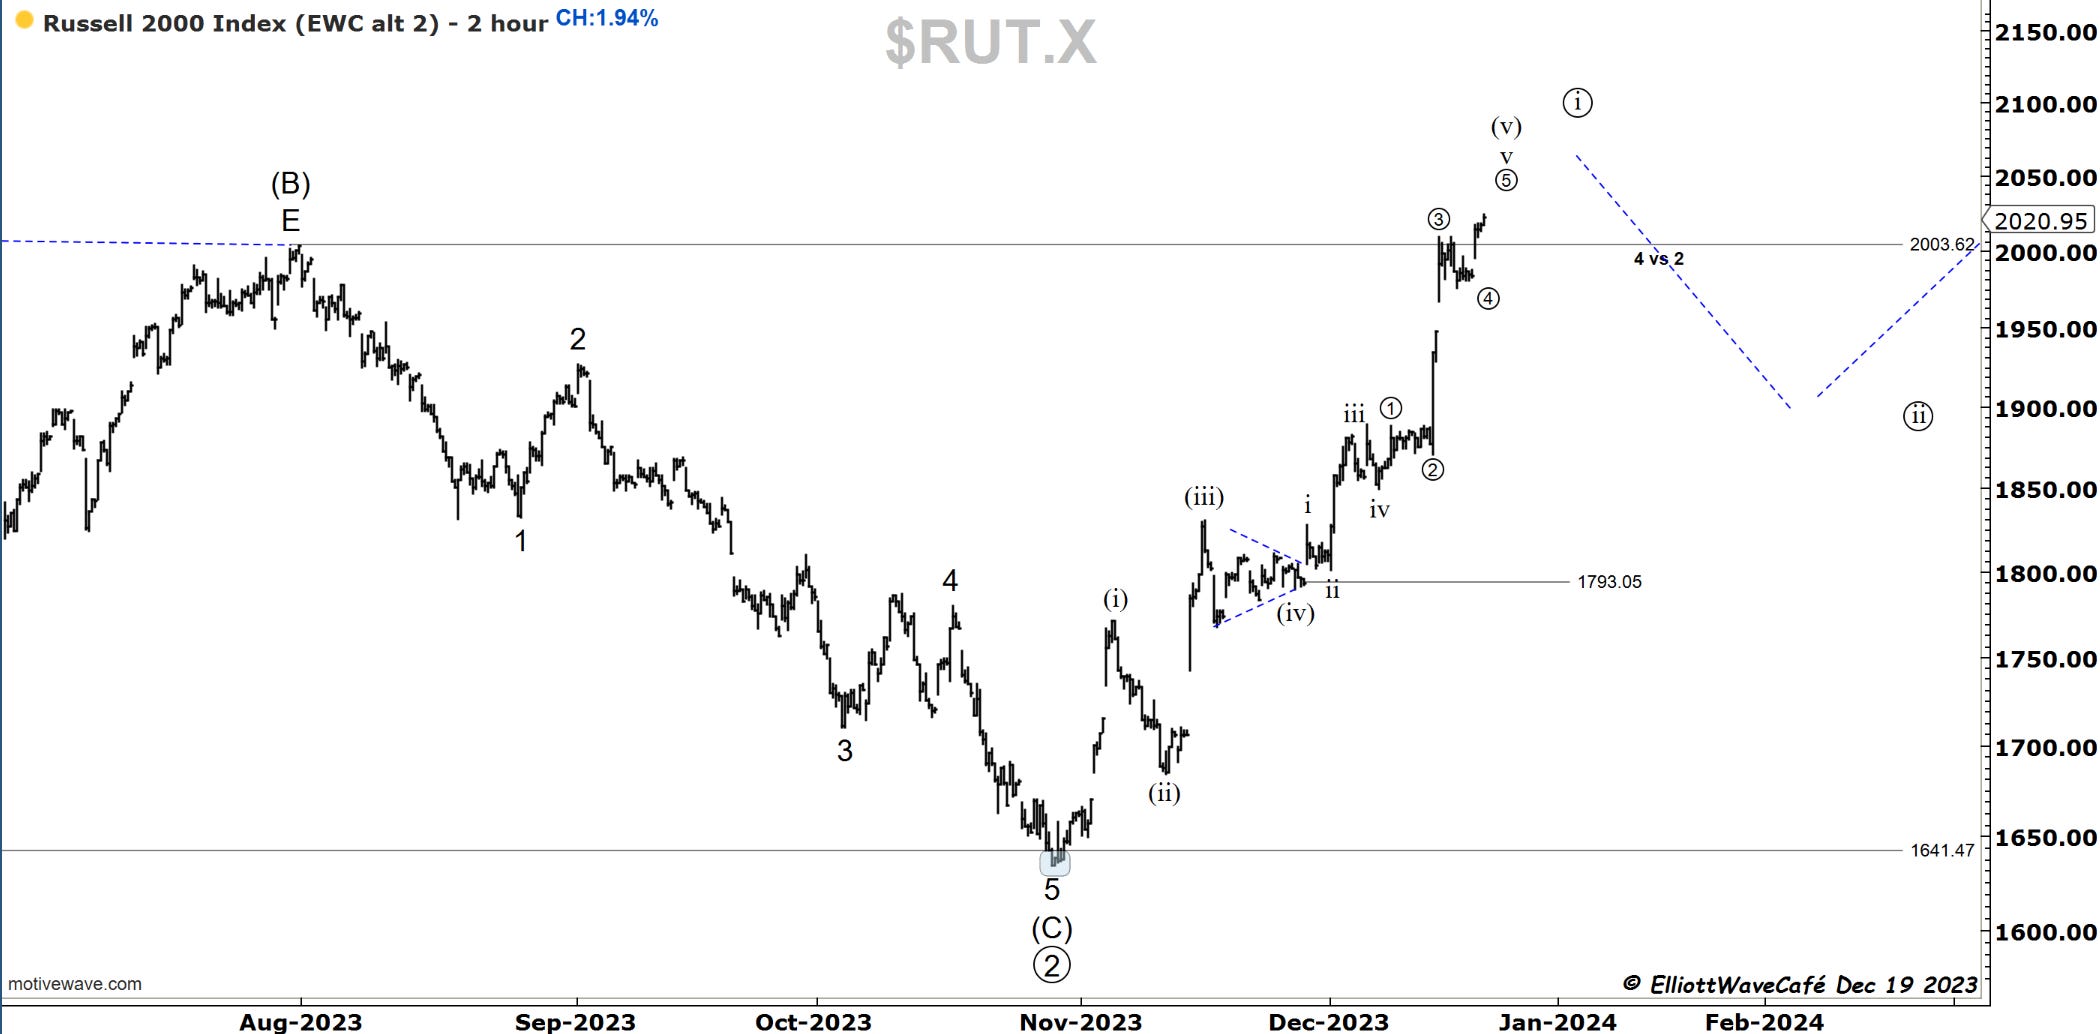
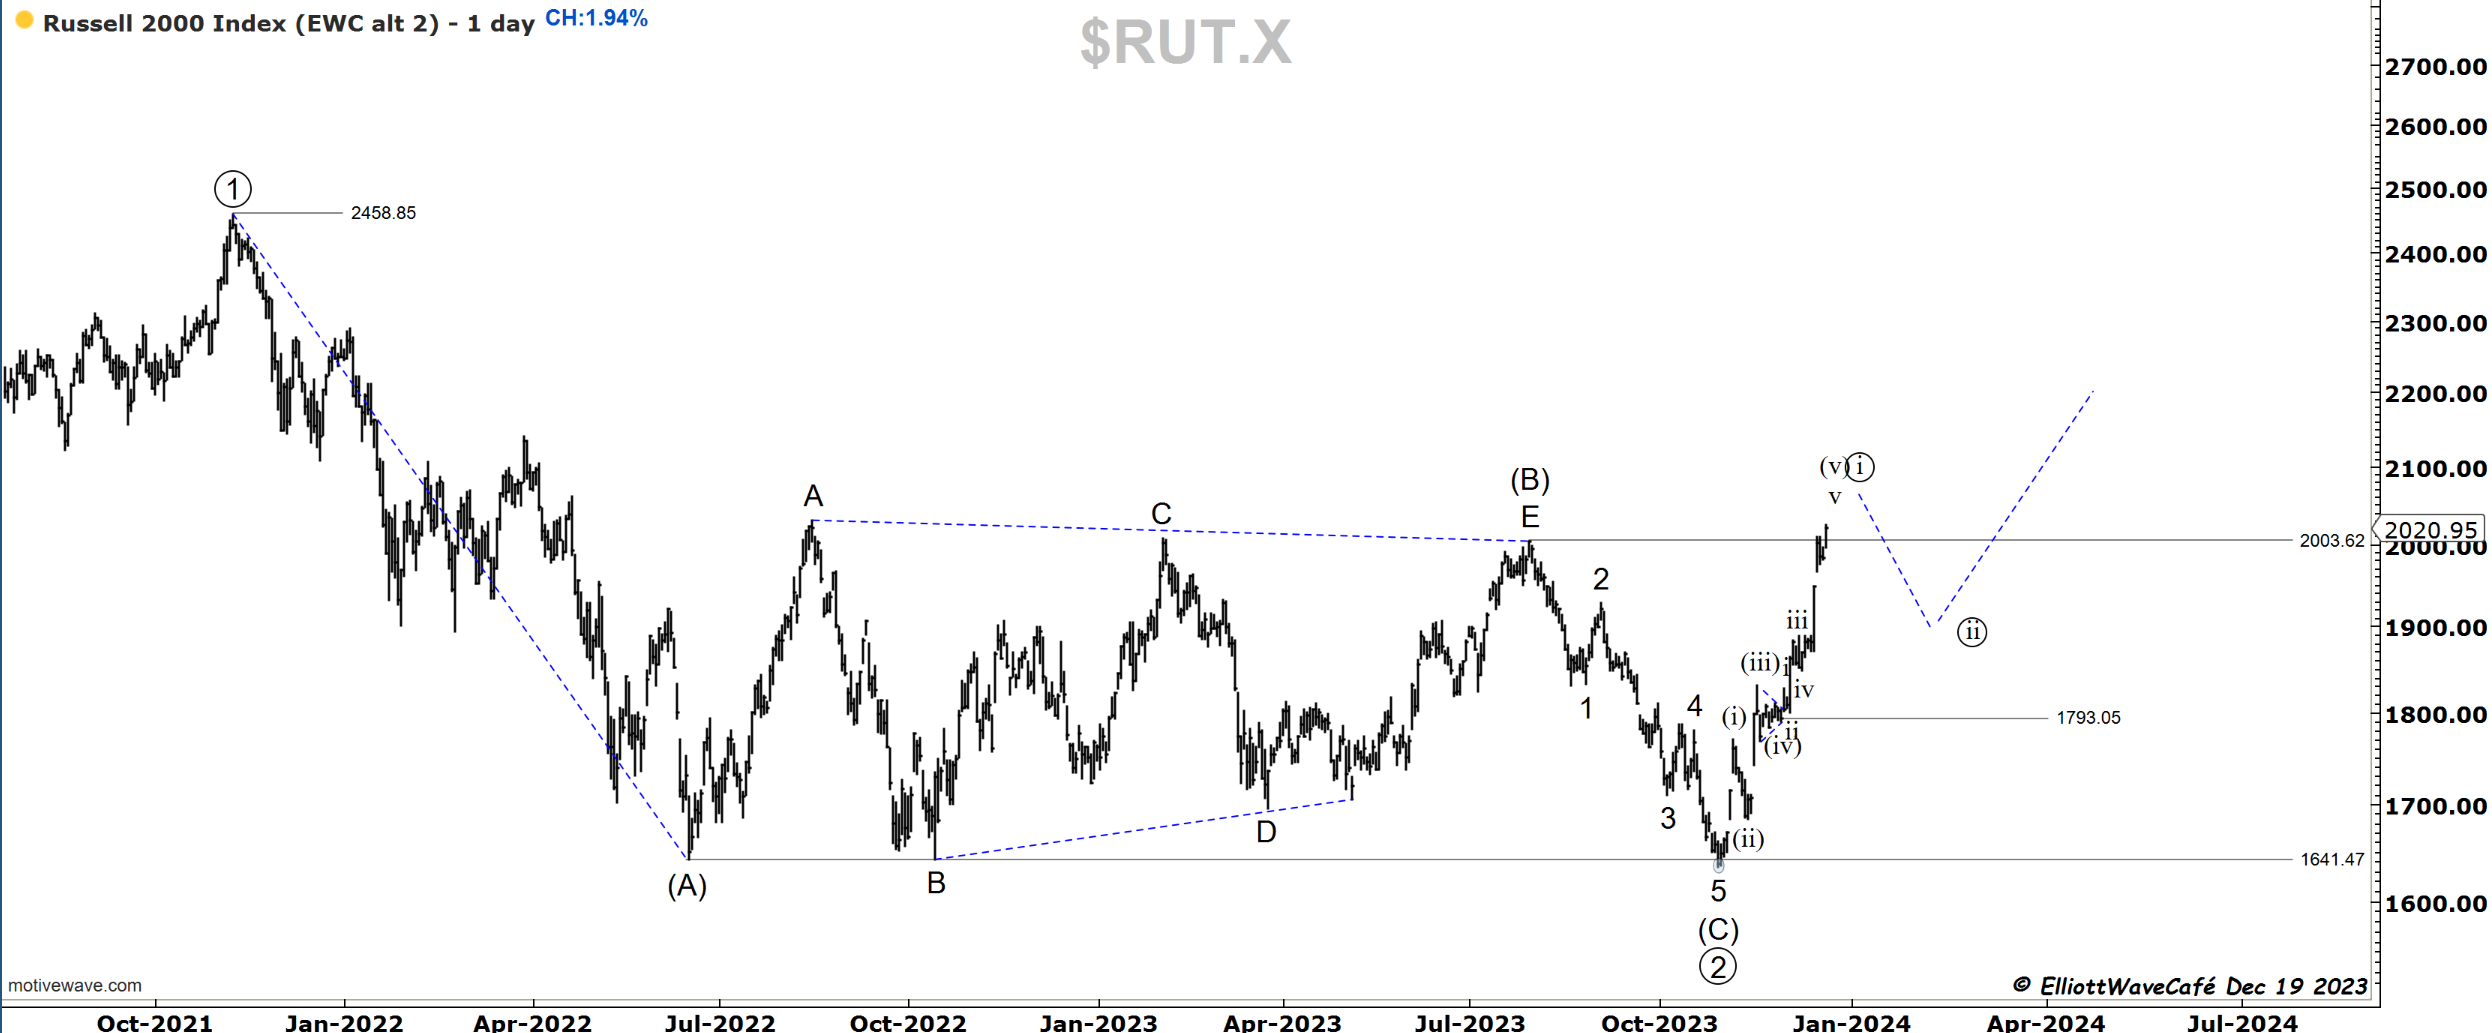
Like clockwork, as mentioned yesterday, another push higher to work wave ((5)). Everything else is unchanged. Take a look at IWM cycle work with the active 108-day cycle. Any further bullish bets here have increased risk.

Dow30
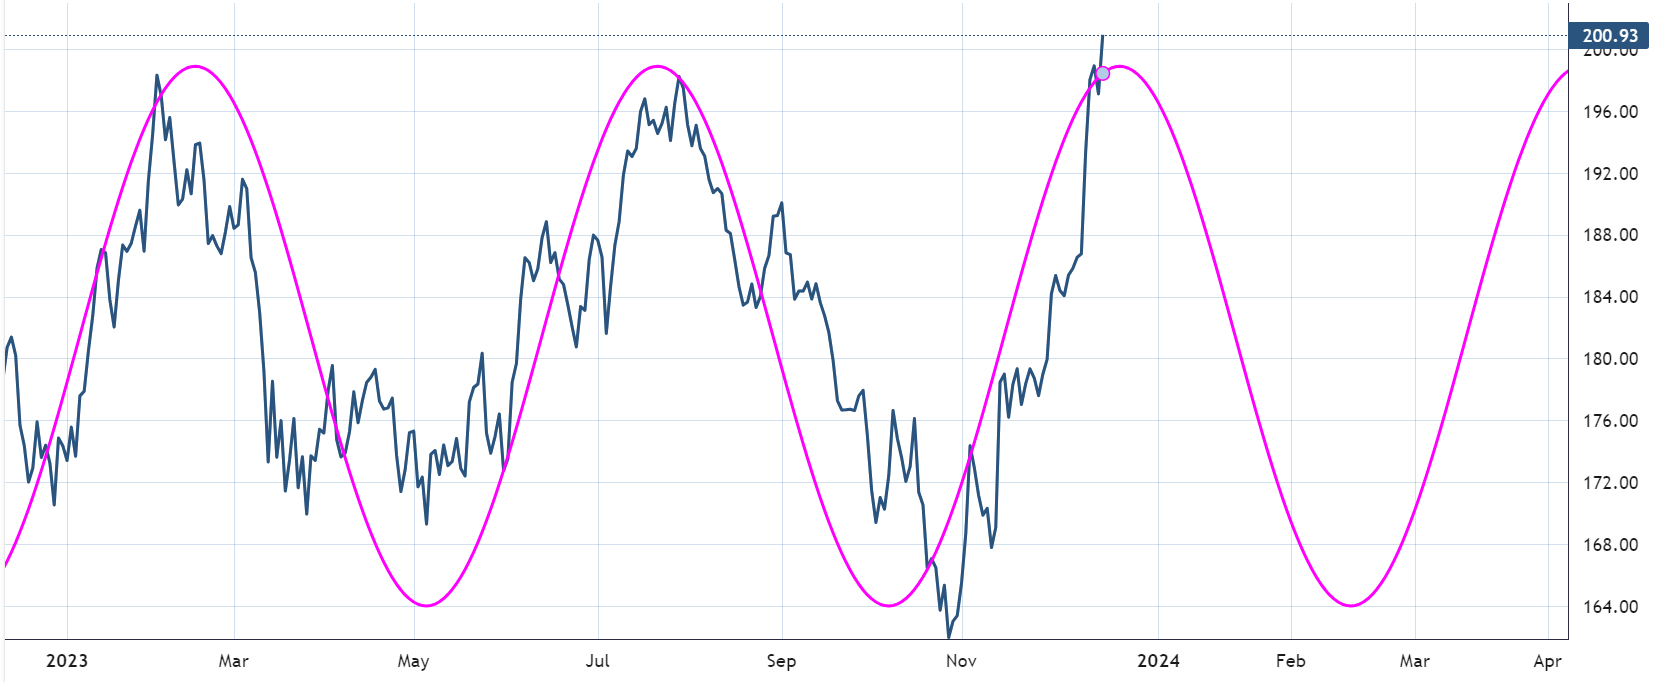
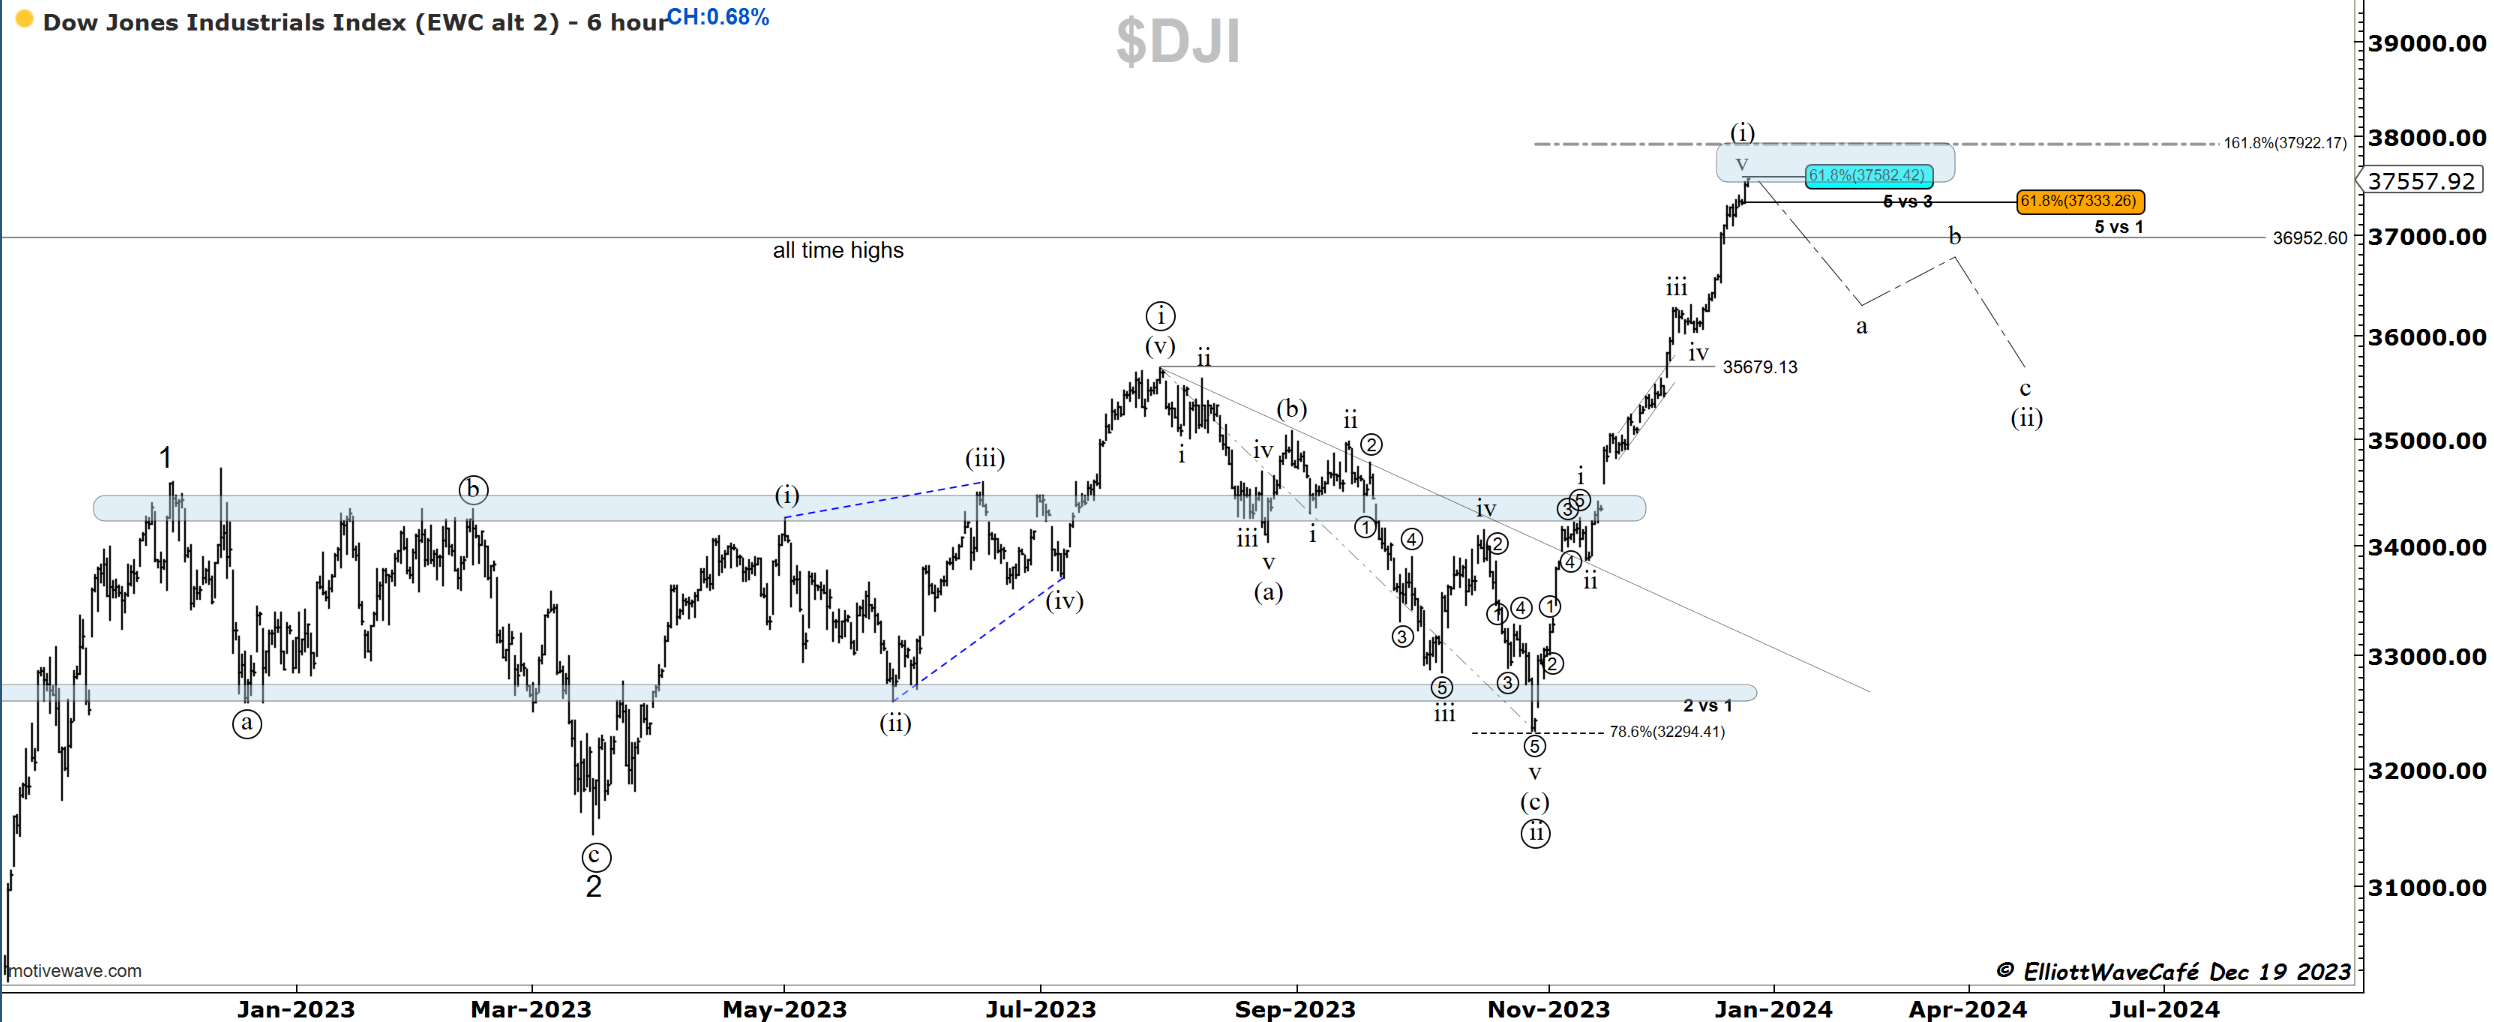
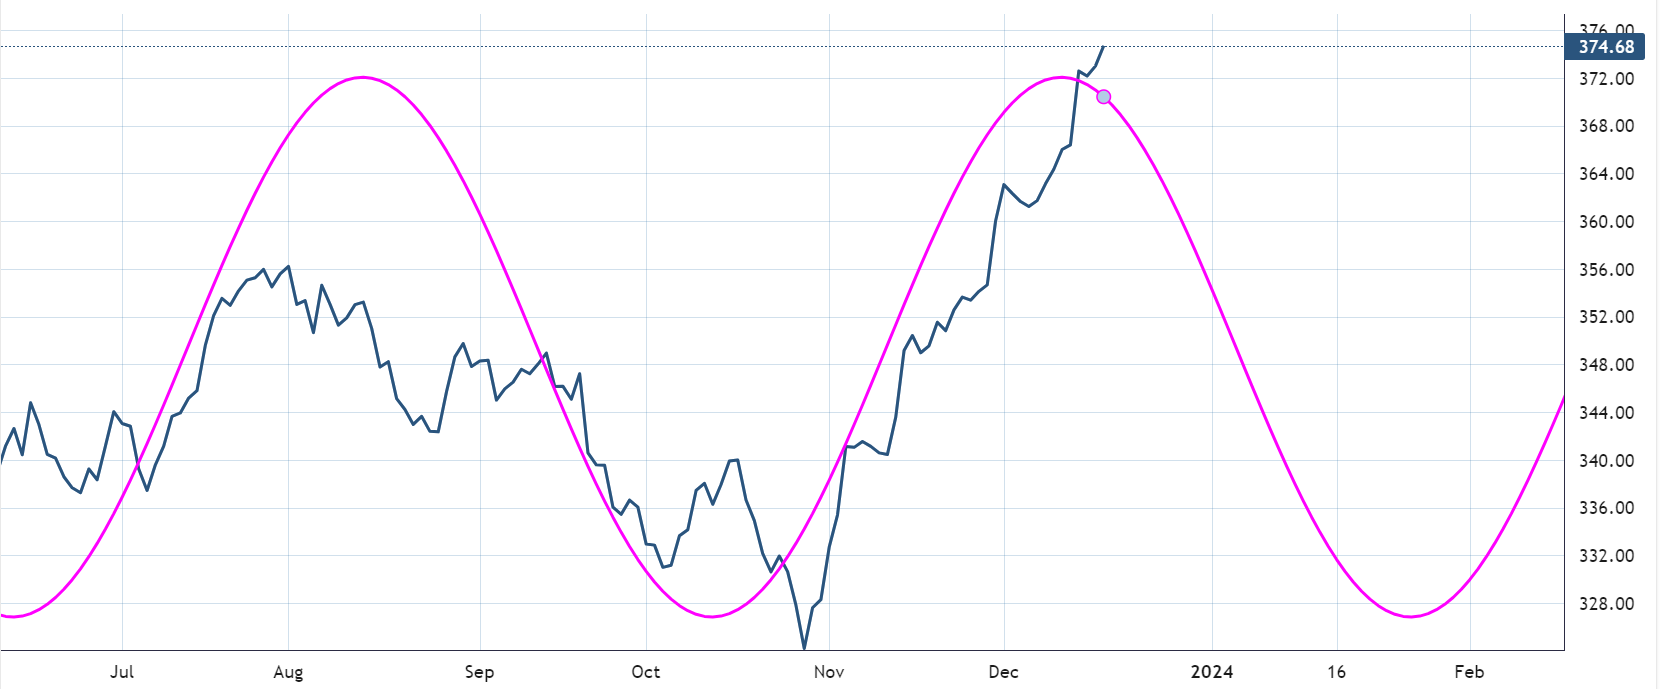
A strong confluence of fibs is sitting at current levels. Wave v measurements and a reversed fib of the decline July-Oct. 161.8% comes at 37,922. This sharp rally is about to come to an abrupt end. We will see it on the charts once it happens. The active 84-day cycle is displayed below.
US Dollar and Yields
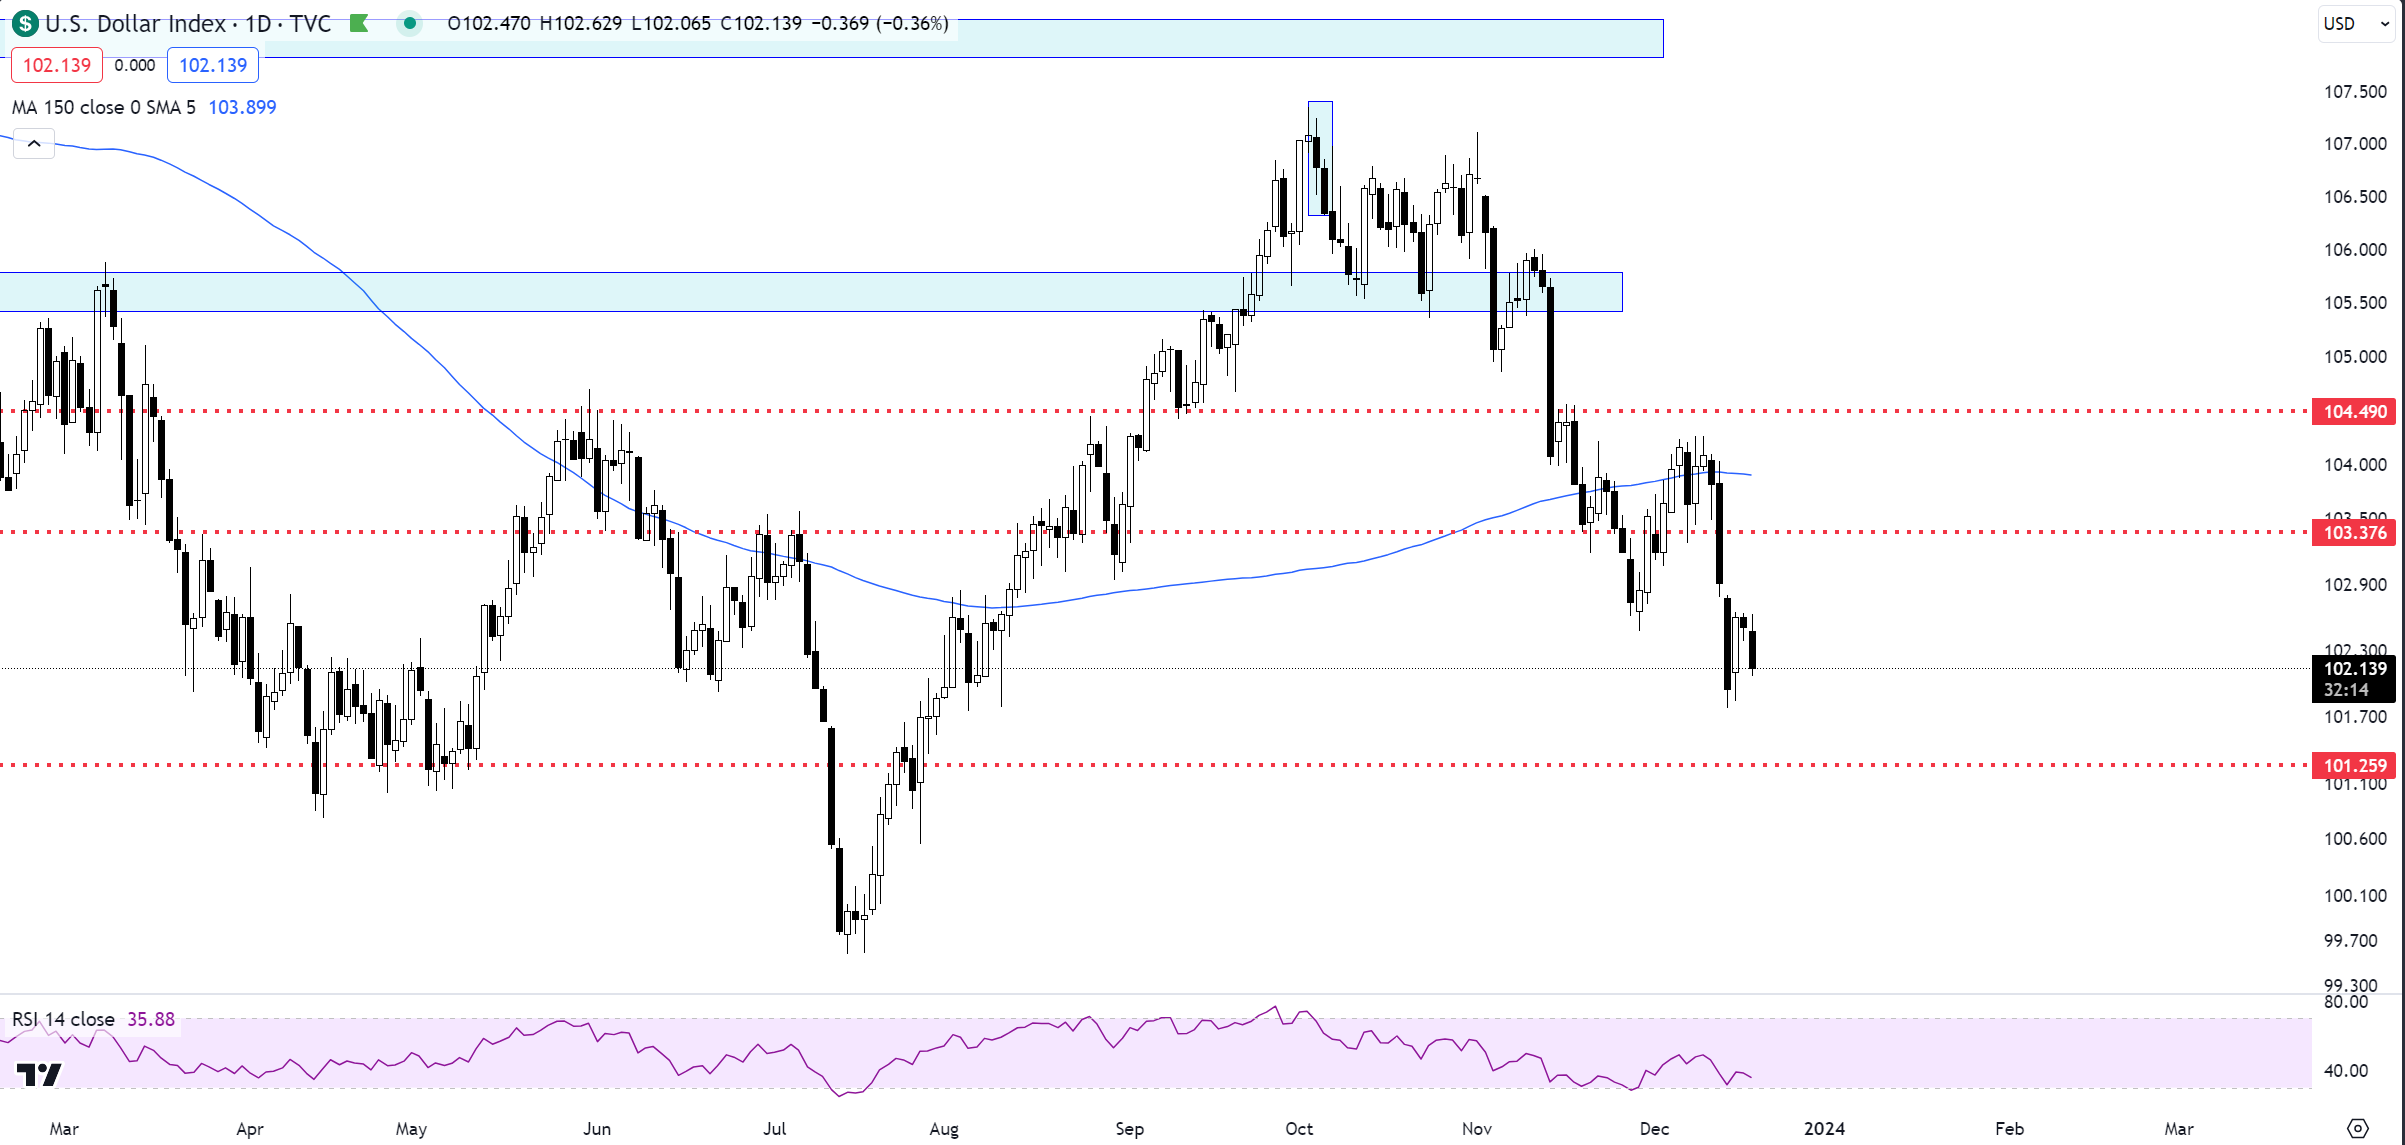
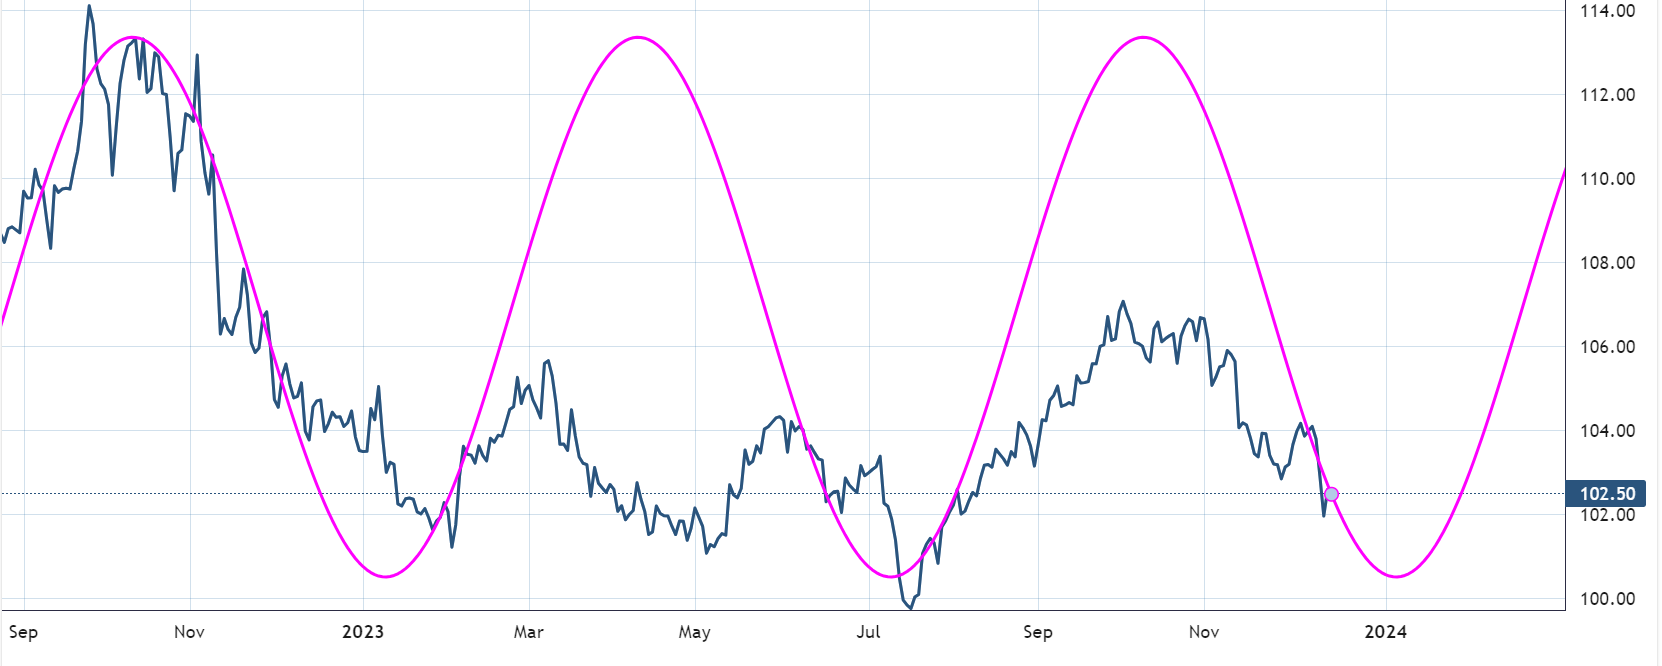
The dollar gave some back today but made no new lows. The next zone of support is near 101.25. Both cycle and price suggest that it would not be surprising if that dip happened. However, with the expected upcoming swing higher in yields, I would not make heavy bets at this stage for a dollar collapse.
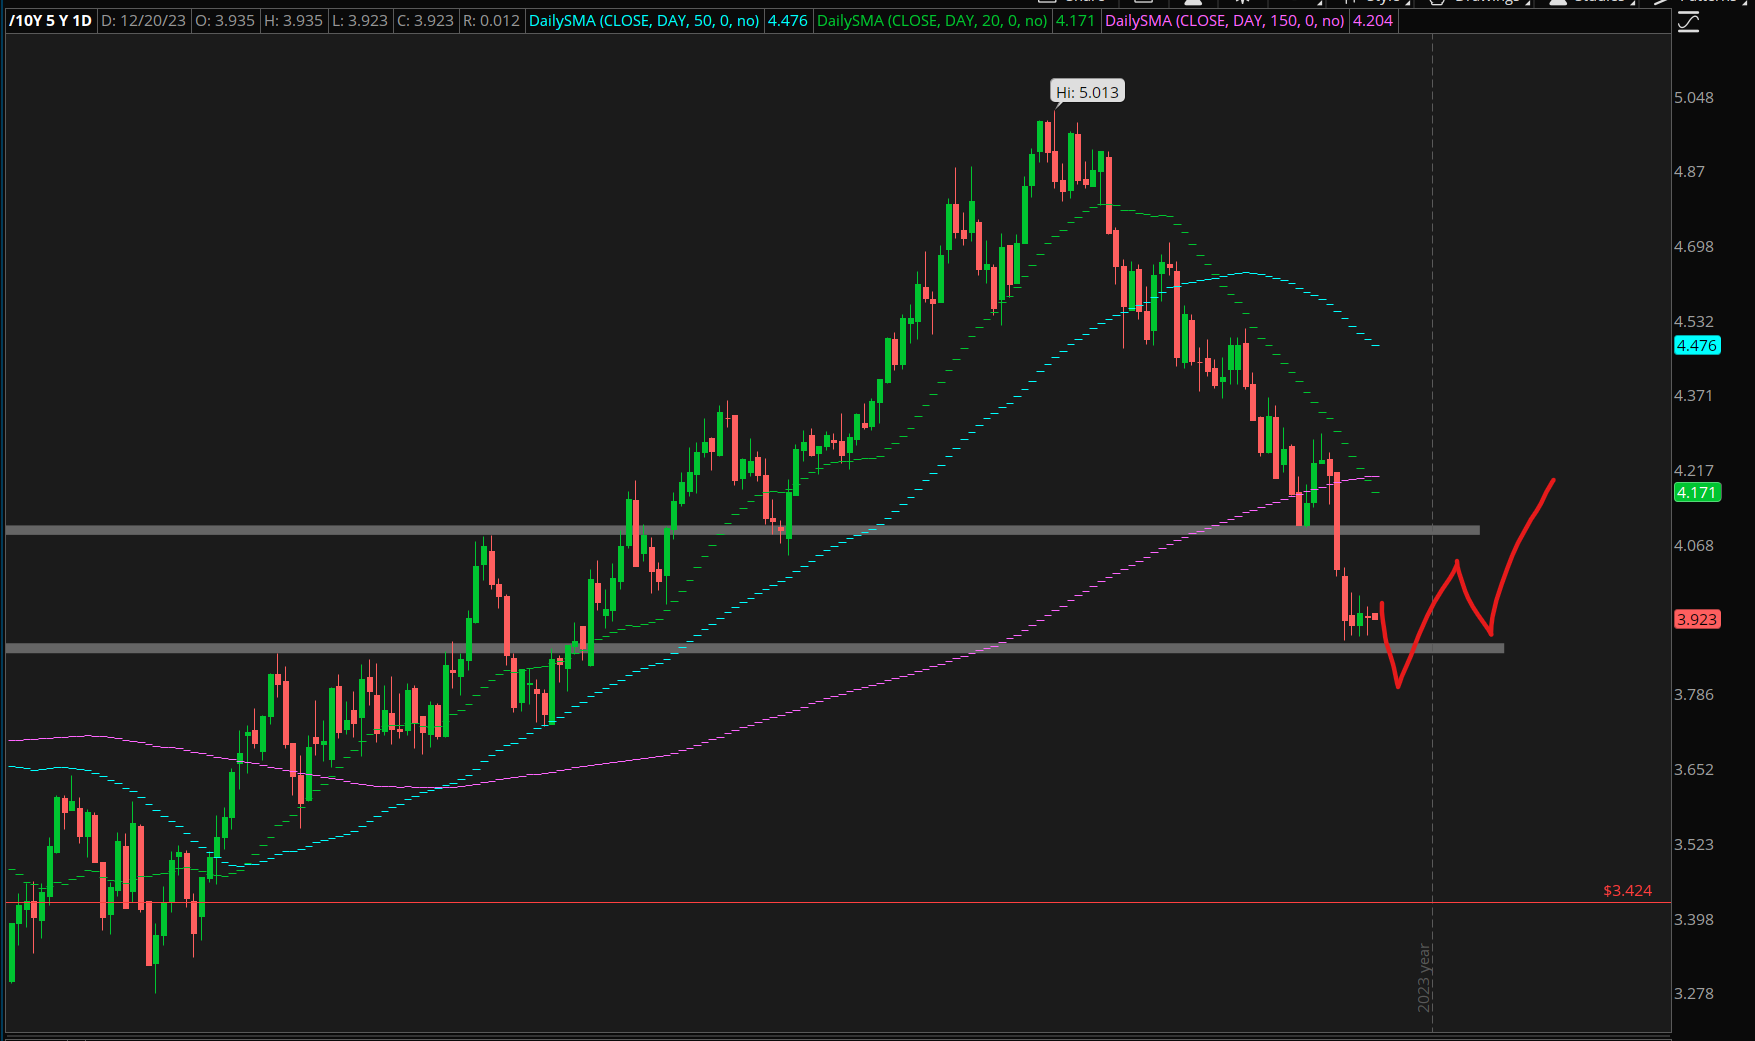
Yields decline has stabilized just above 3.87%. It will be much tougher to continue sliding from here. The market has already staged a pretty strong decline in anticipation of Fed-rate cuts. Any hint that it gets delayed could lead to a severe repricing of bonds. In my view, the risks are to the upside from current levels.
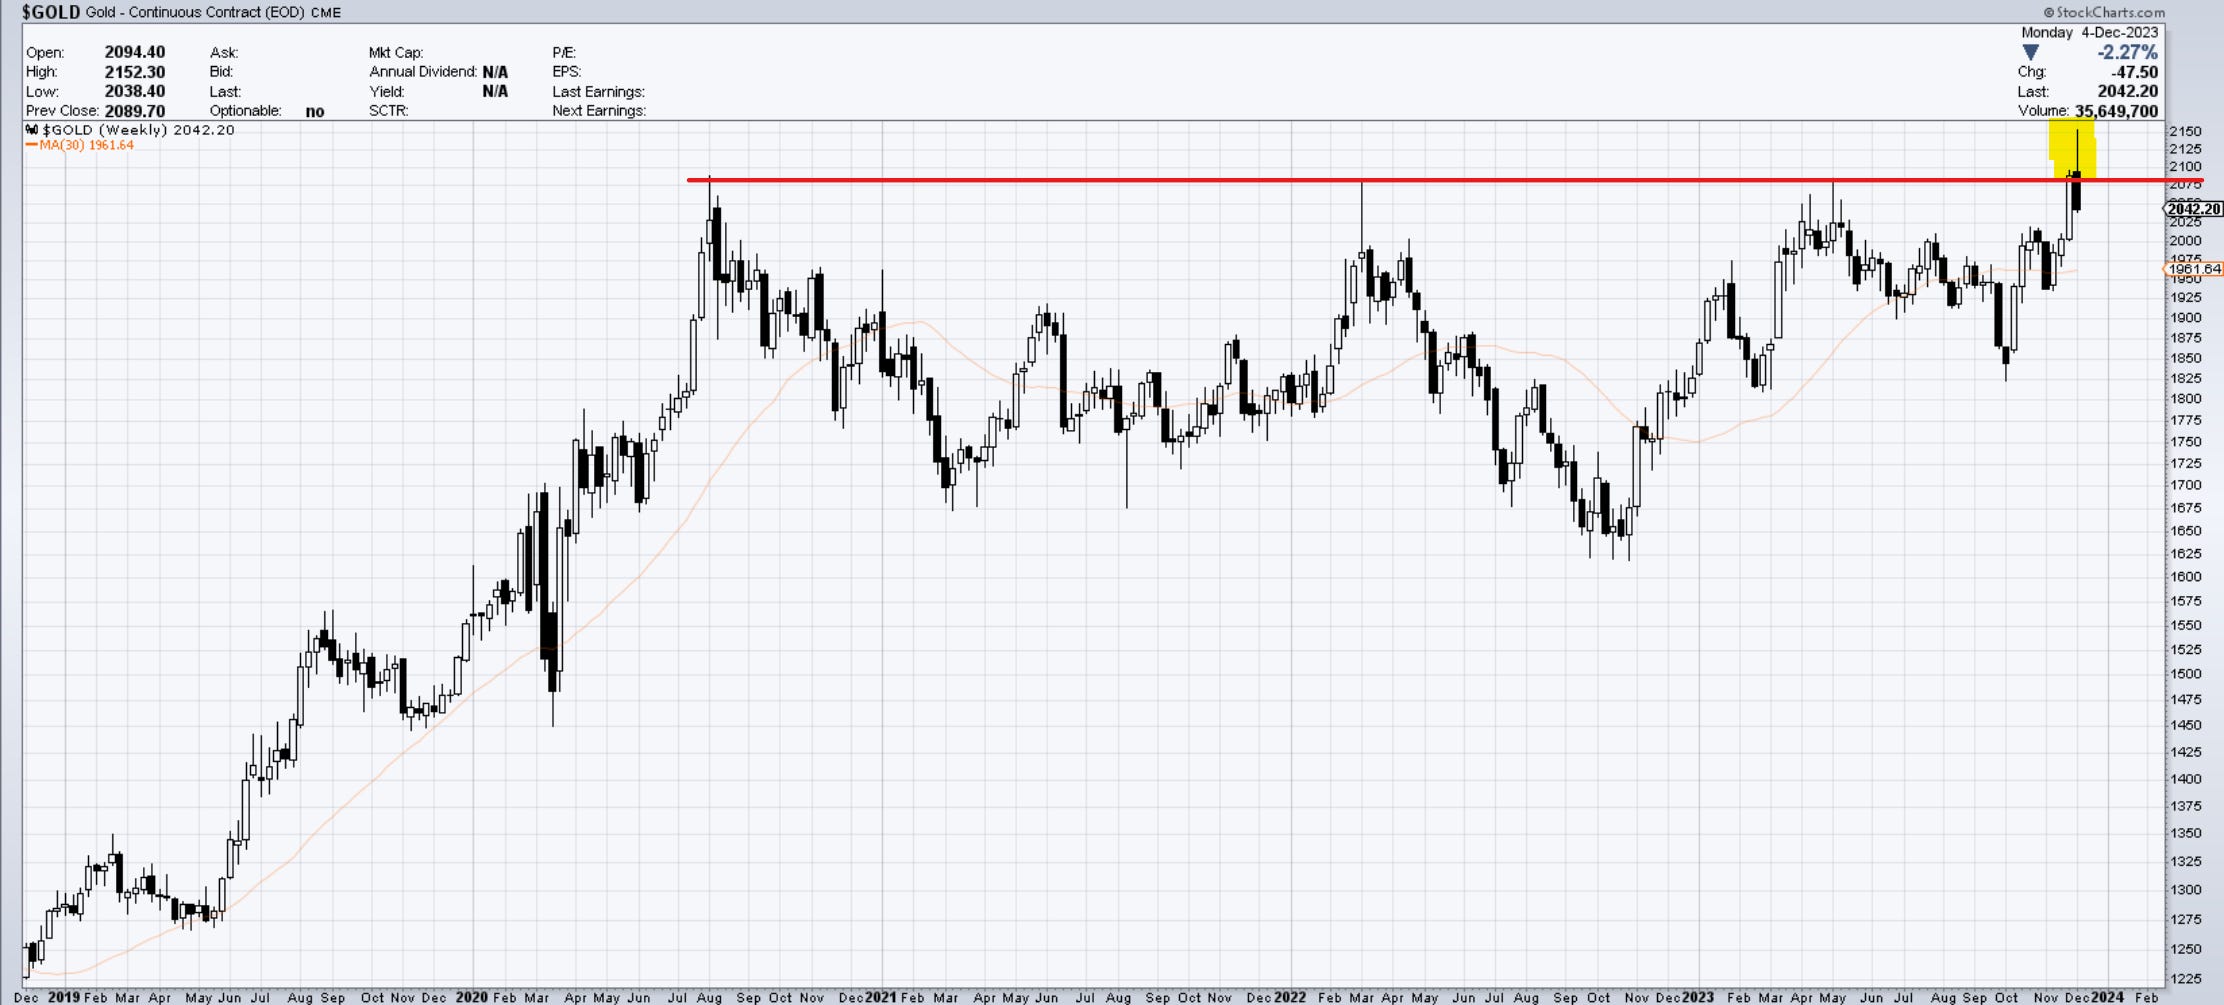
Gold
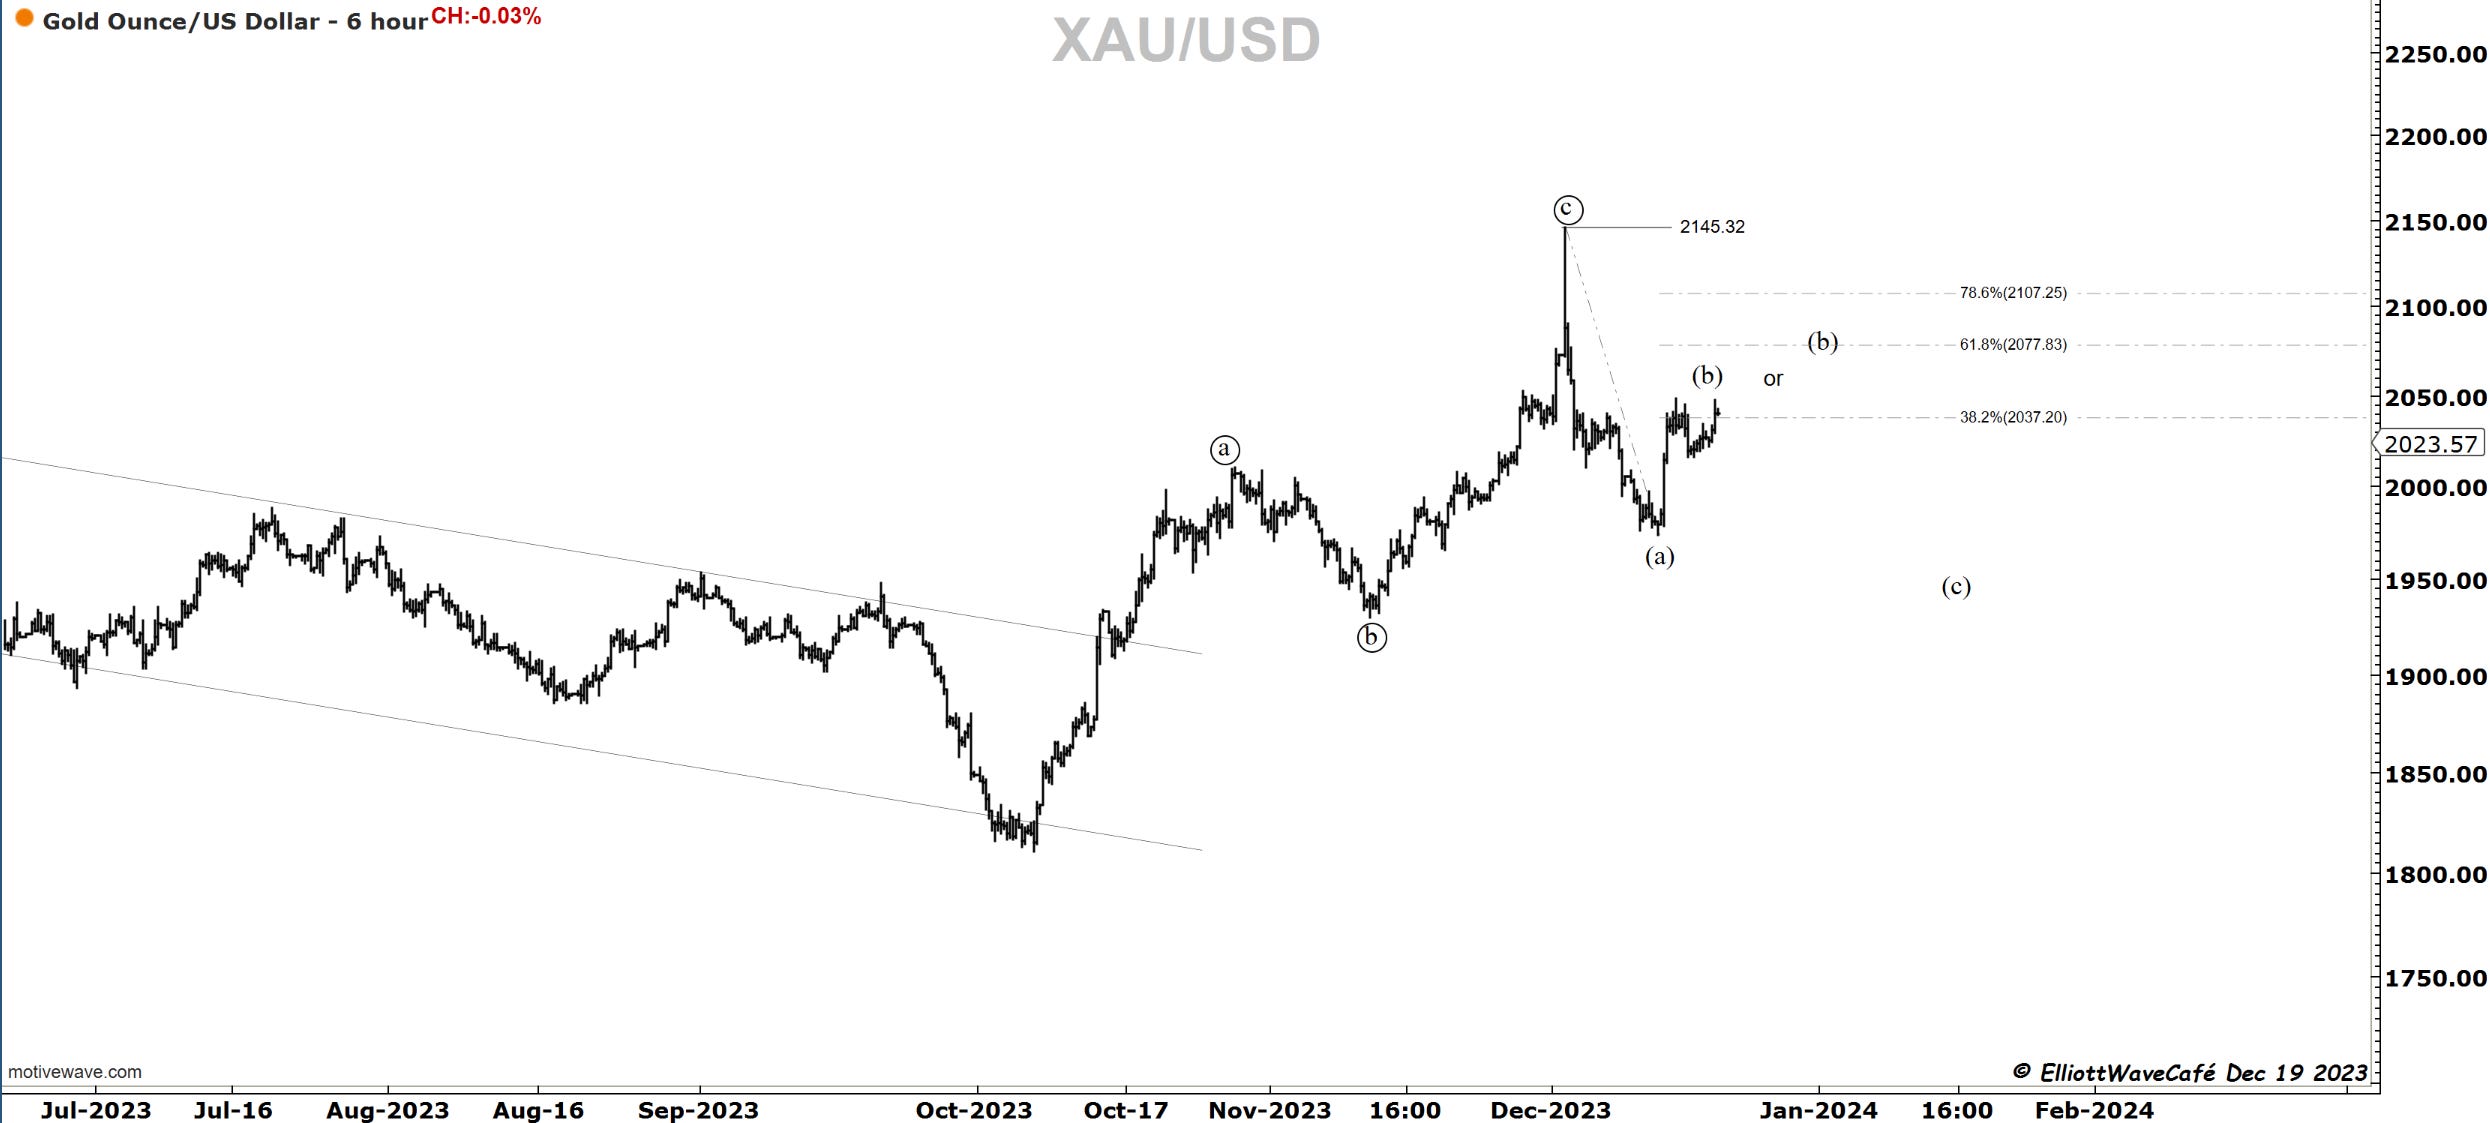
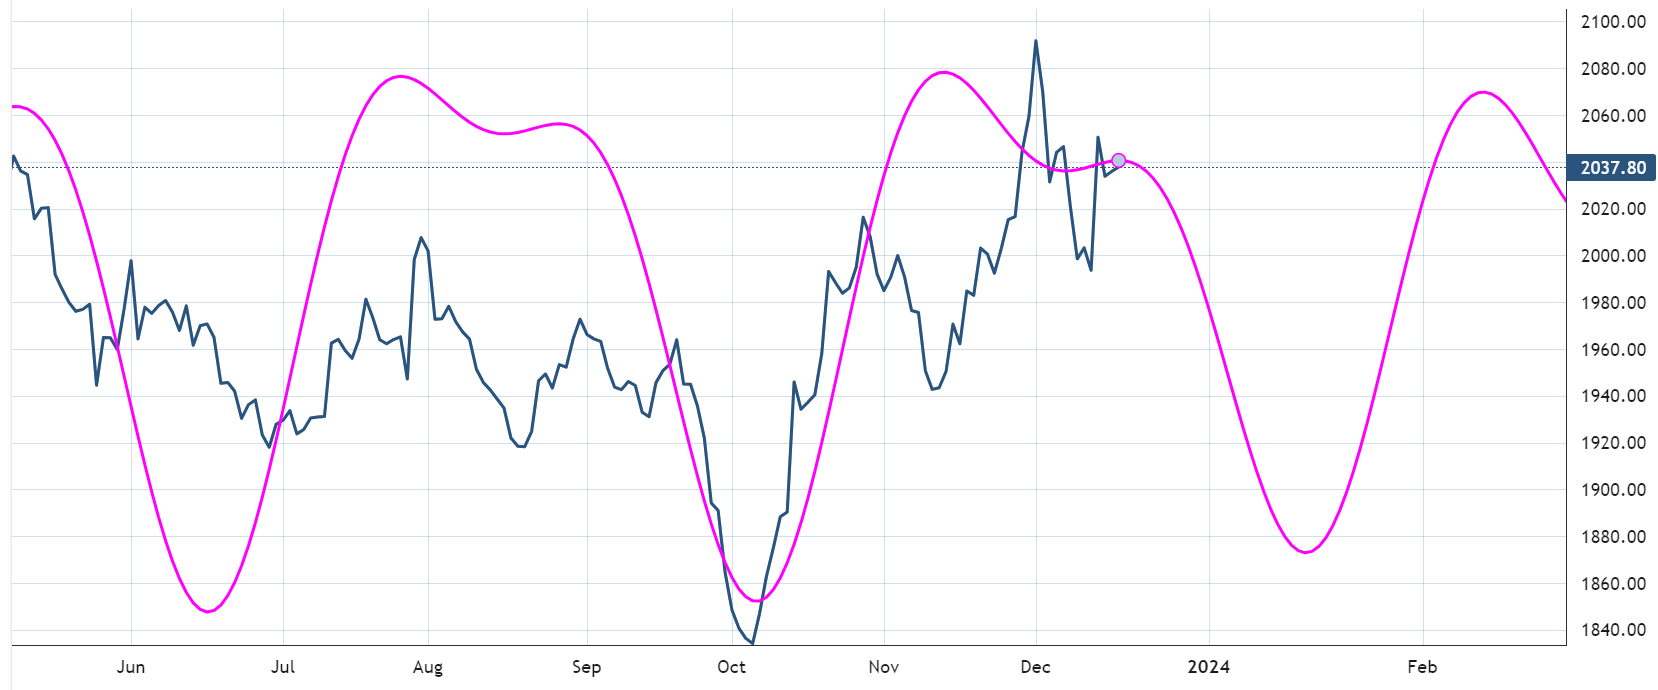
A slight rally in Gold today, but I continue to see that the conditions are not ripe for a rally above 2100.
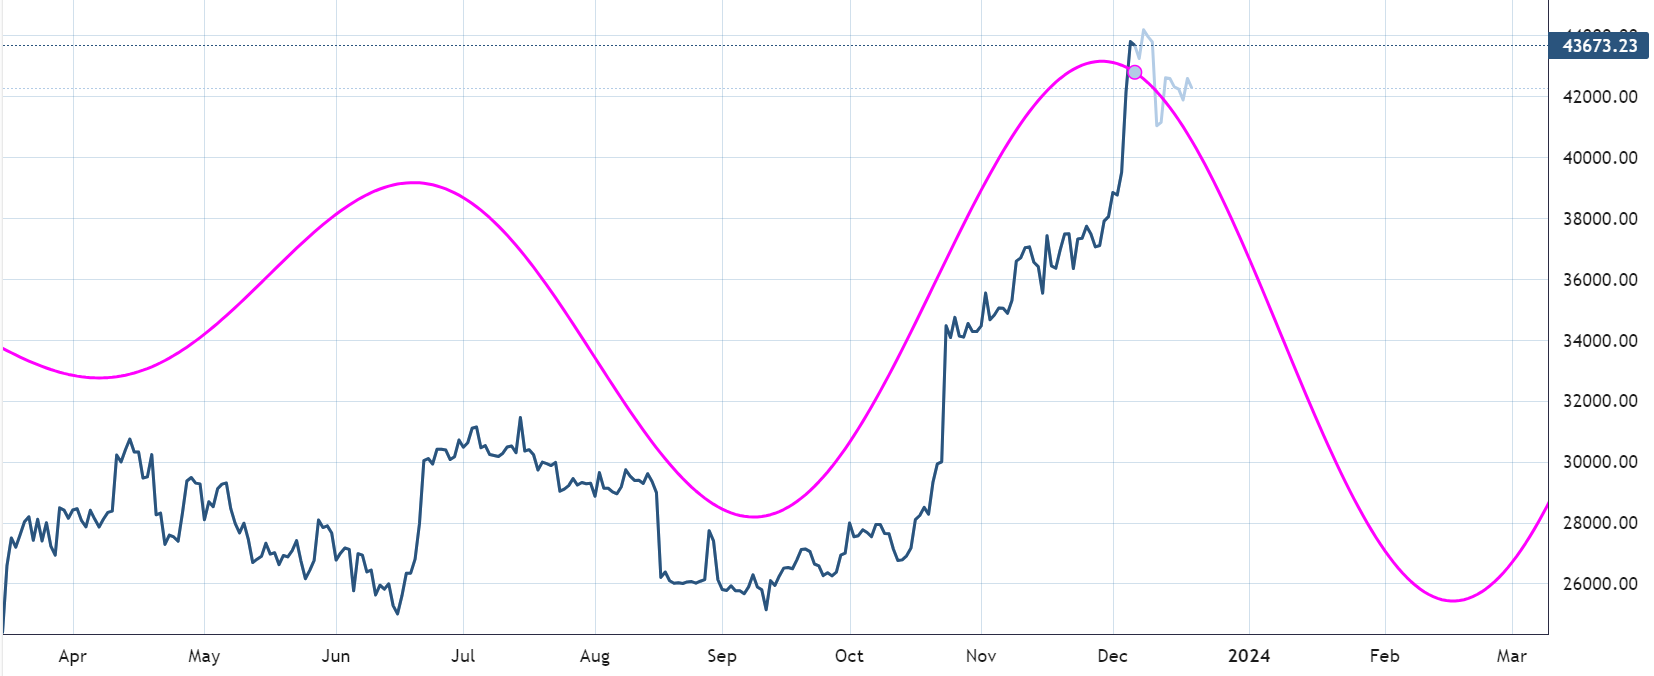
Bitcoin
The bounce got sold into as expected. Counting the corrective internals in real-time is a big guessing game at this point. The bottom line remains that as long as we are below 44k, fresh money is used better waiting. Use the current channel as direction.
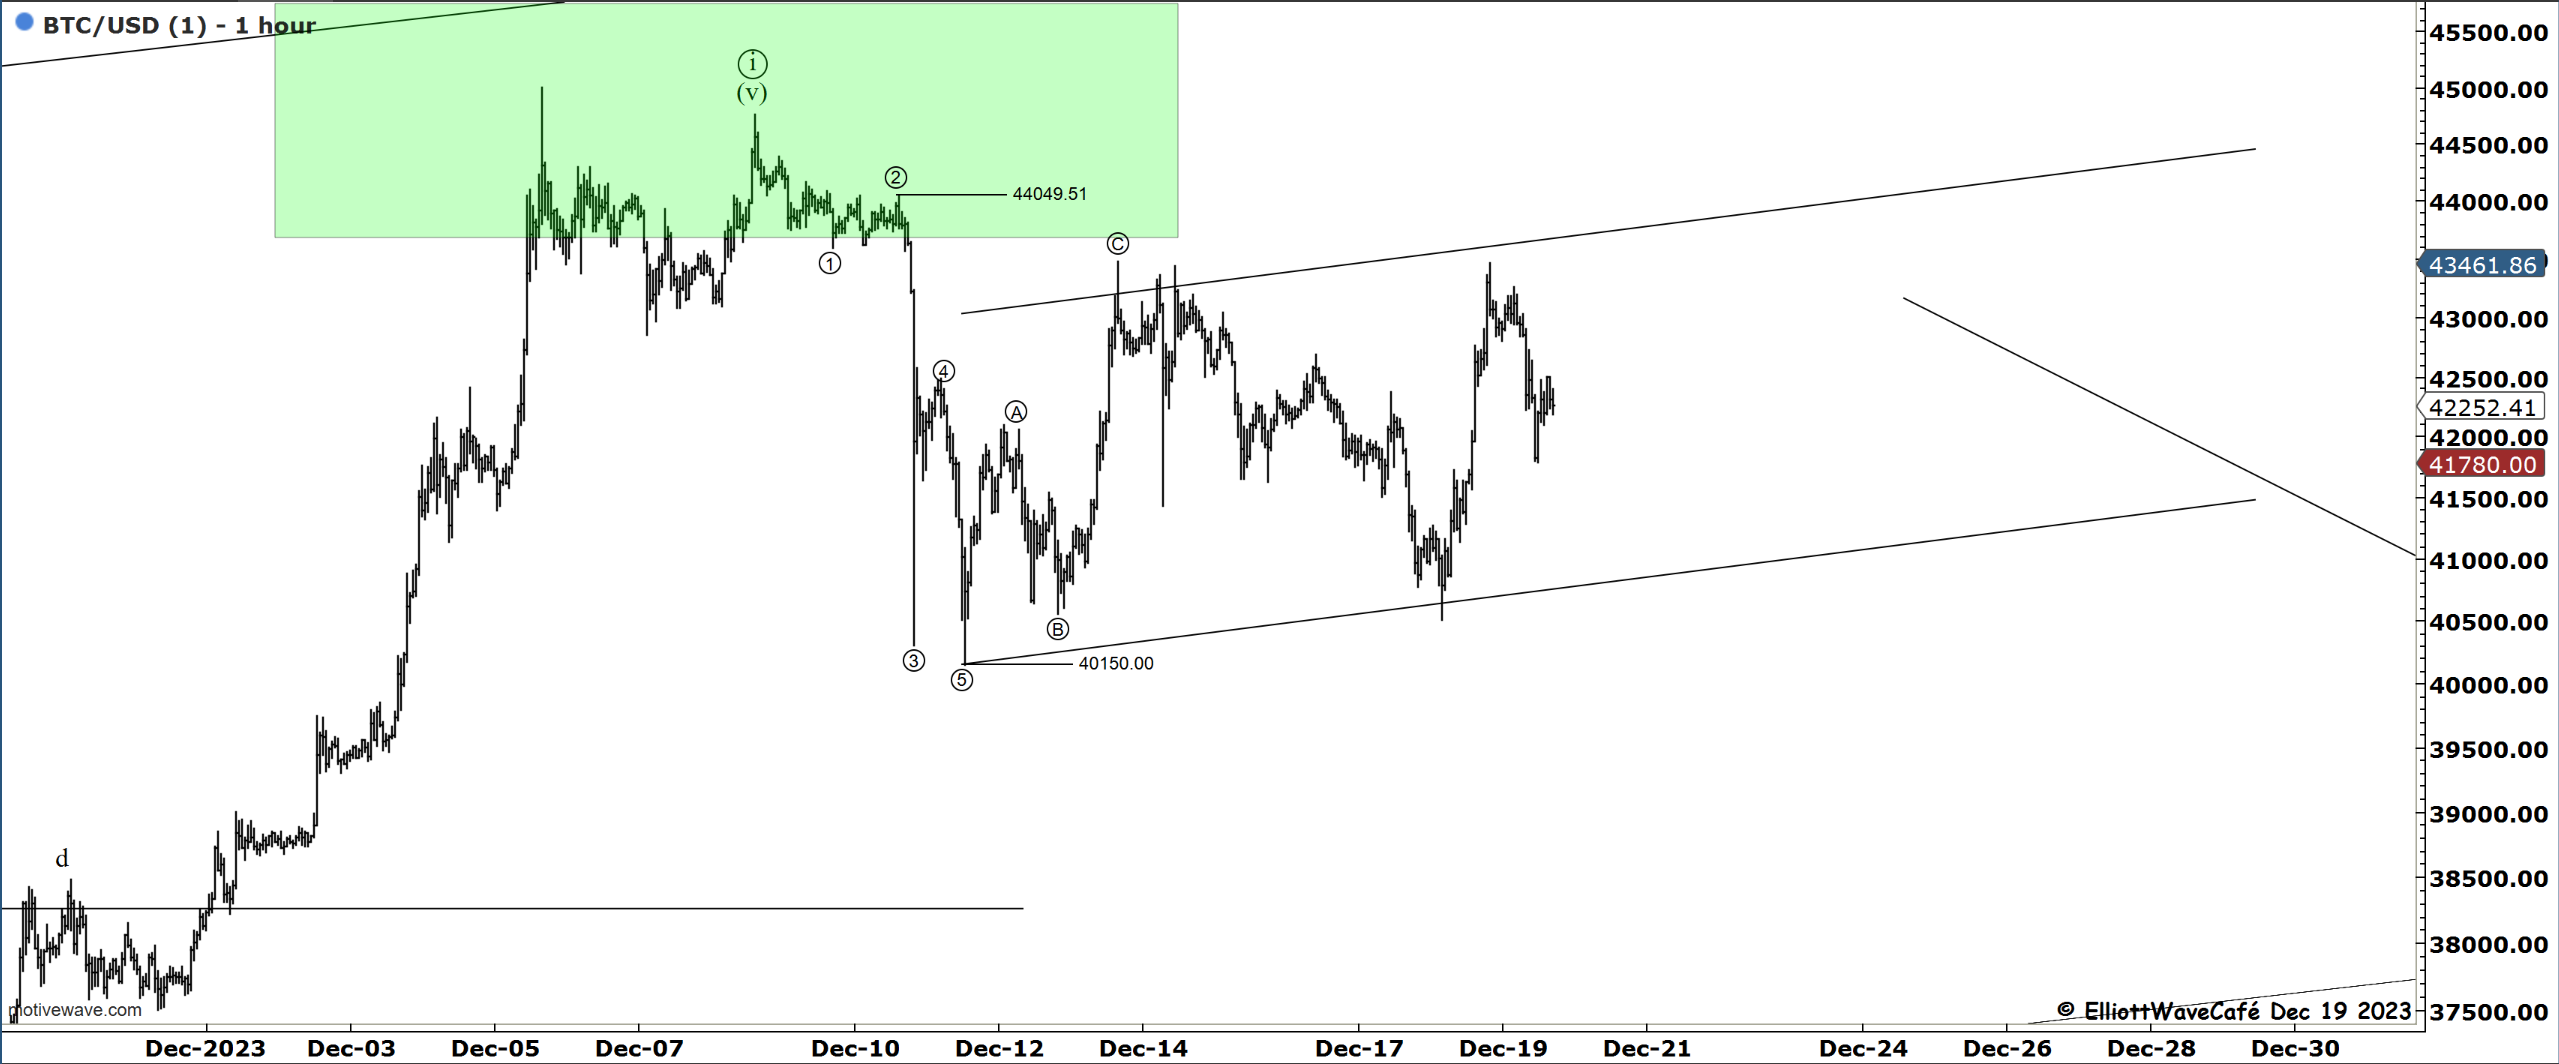
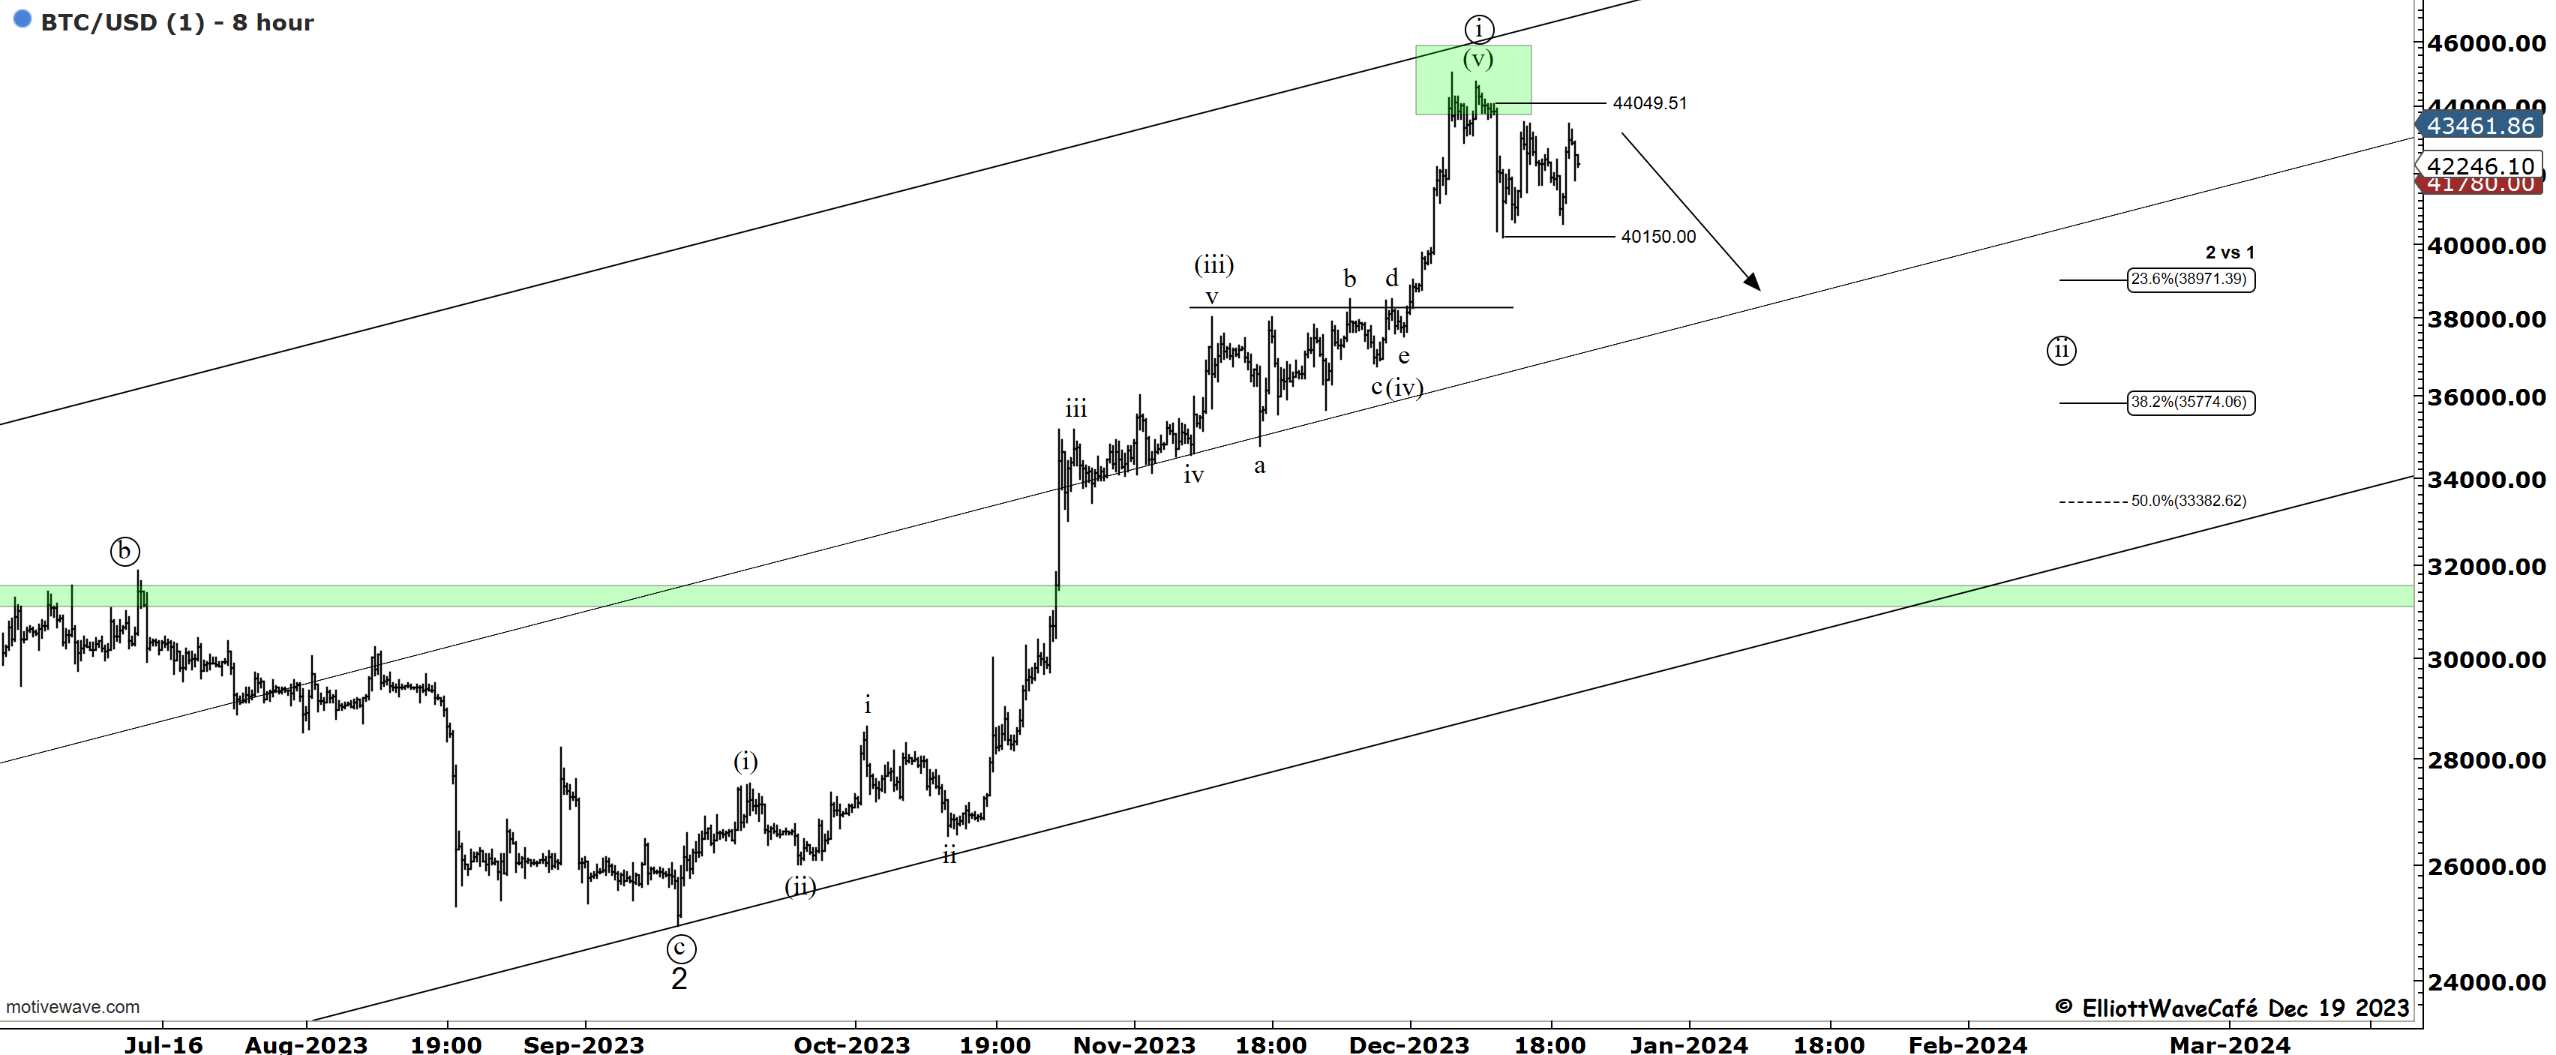
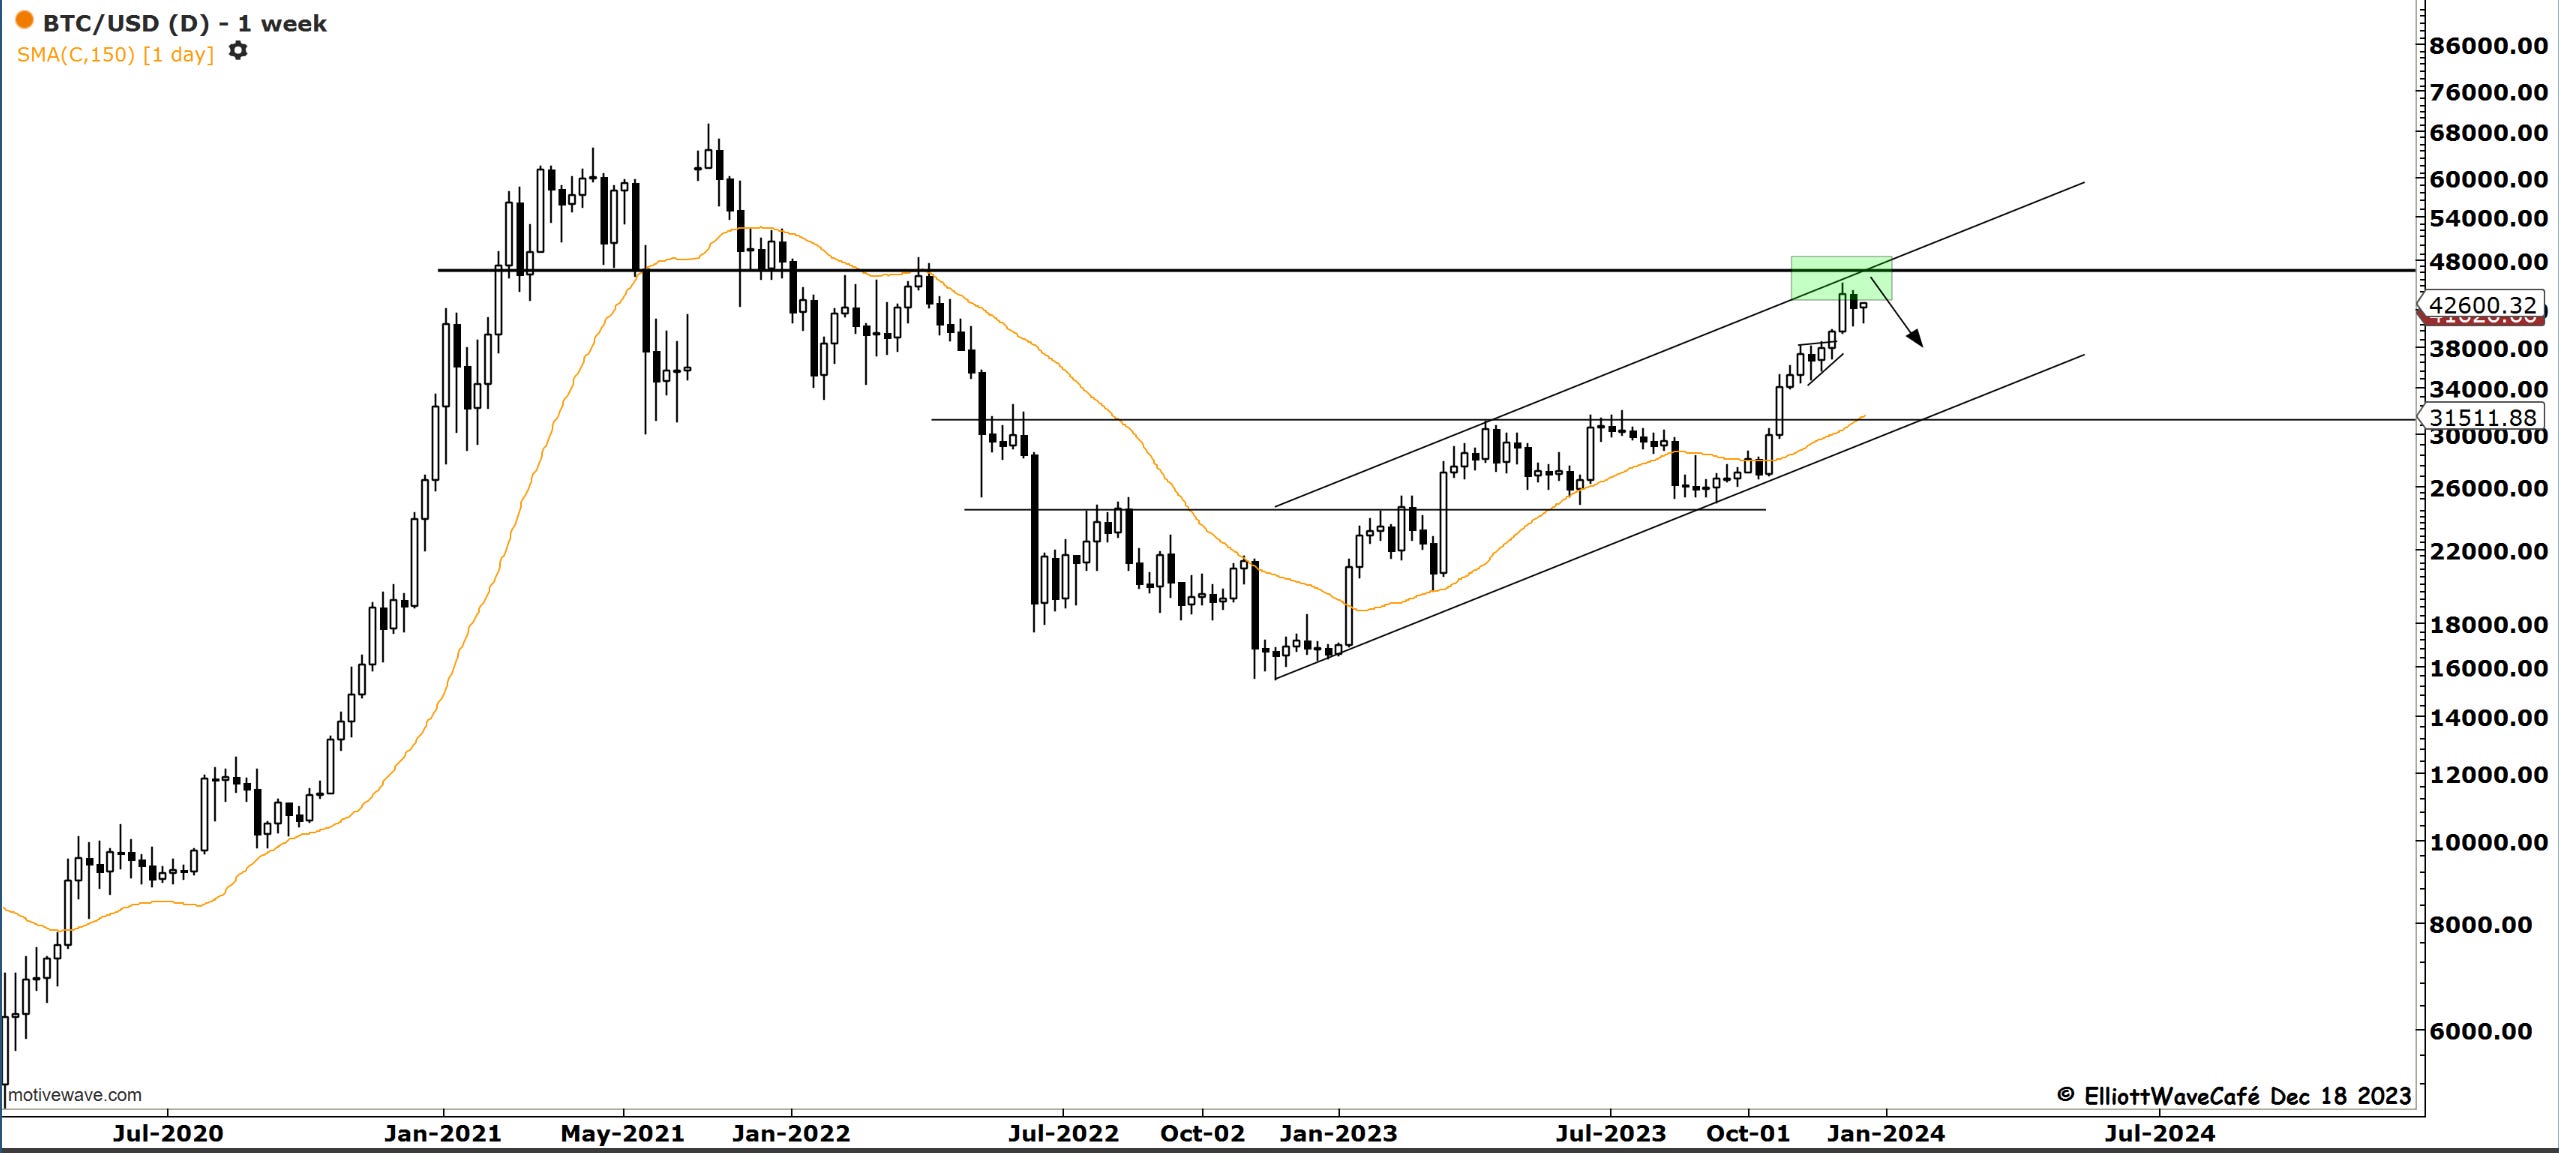
Here is the updated price action in BTC since cautioning of a likely topping cycle.
“Double shot” Daily video coming up next,
Have a great day wherever you are! - trade well, and don’t forget to subscribe and drop a like if this letter helps you in any way.
Cris
email: ewcafe@pm.me