Note: The counts on the right edge are real-time, and they are prone to adjustments as price action develops. Elliott Wave has a fluid approach, is evidence-based, and requires constant monitoring of certain thresholds.
In the counts below, this (( )) = circle on chart
SP500
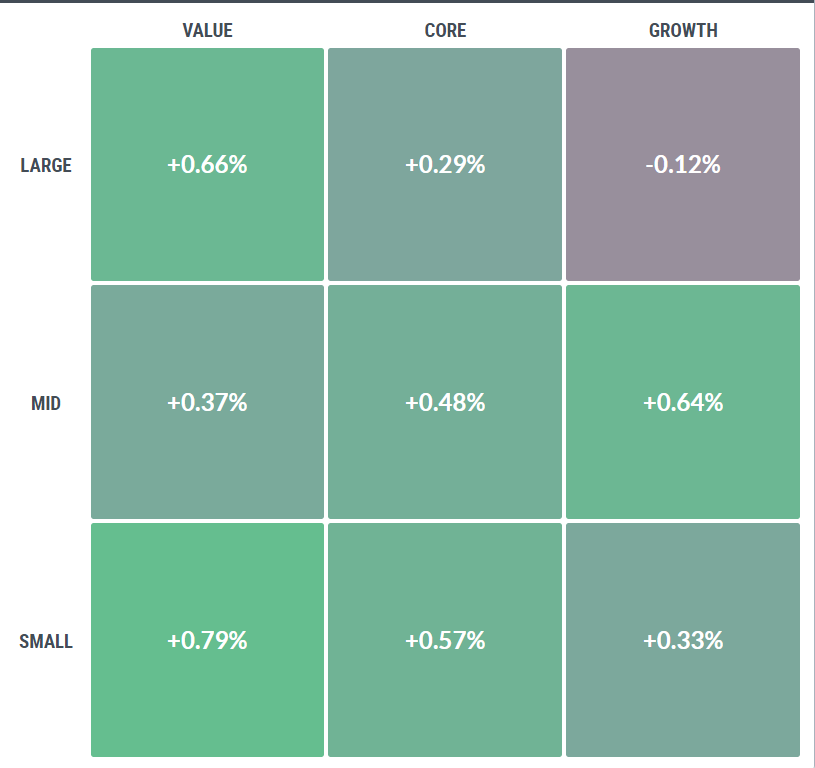
Today is the second day of prices being contained within the entire body of price action from Jan 2nd. These inside days are not necessarily bearish; they express a backing and filling of the current trends. There was a small change in what we have been used to for the past several weeks, with small caps leading the way today and tech, communication, and financials taking a back seat. Some of the large stocks responsible for over 50% of the SP500 gains have taken a pause.
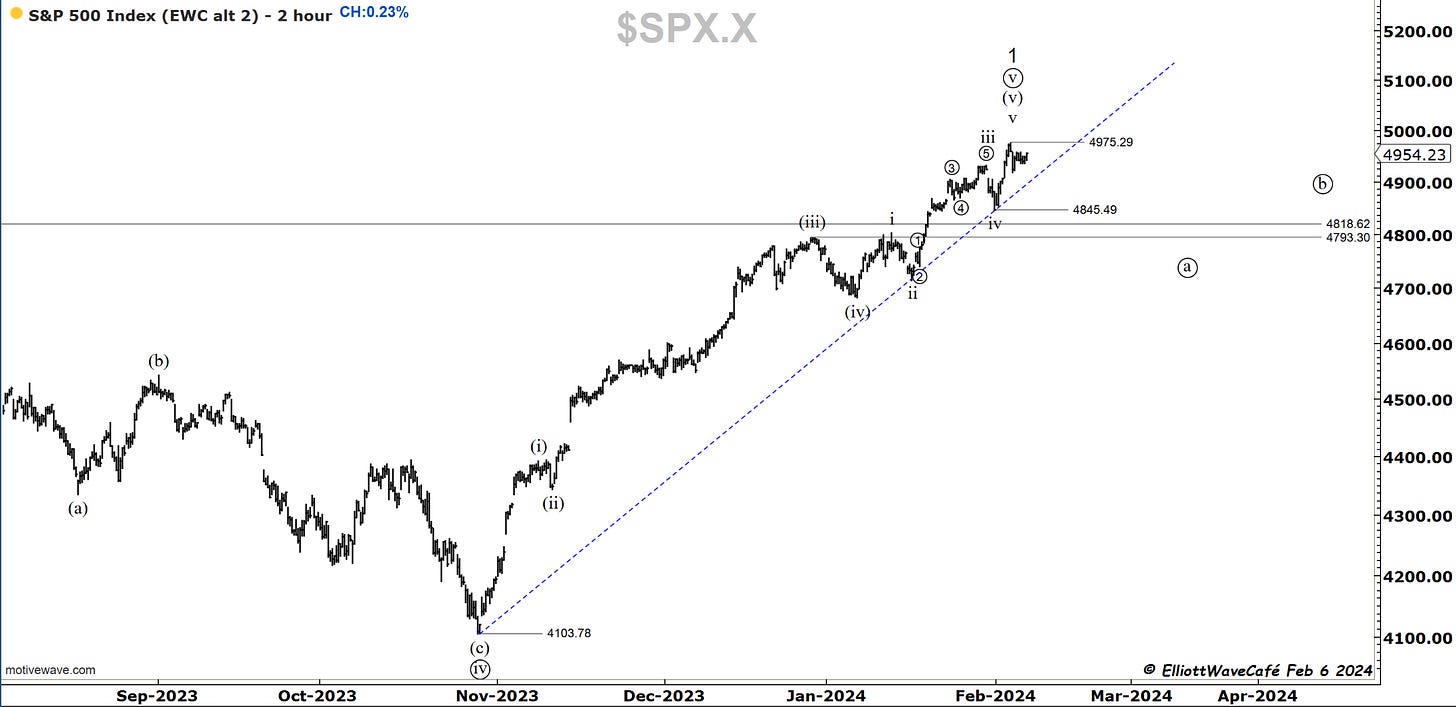
We remain in the impulsive sequence from late Oct 2023 lows. Price would have to break back below 4845 to start raising the possibility that a wave 2 pullback is taking place.
Here is the same chart with a trendline connecting lower wing points. A break from that would be another clue for “correction underway.”
A stark warning continues to come from the advance-decline line of NYSE. Refer to yesterday’s issue on the stocks > MA indicators.
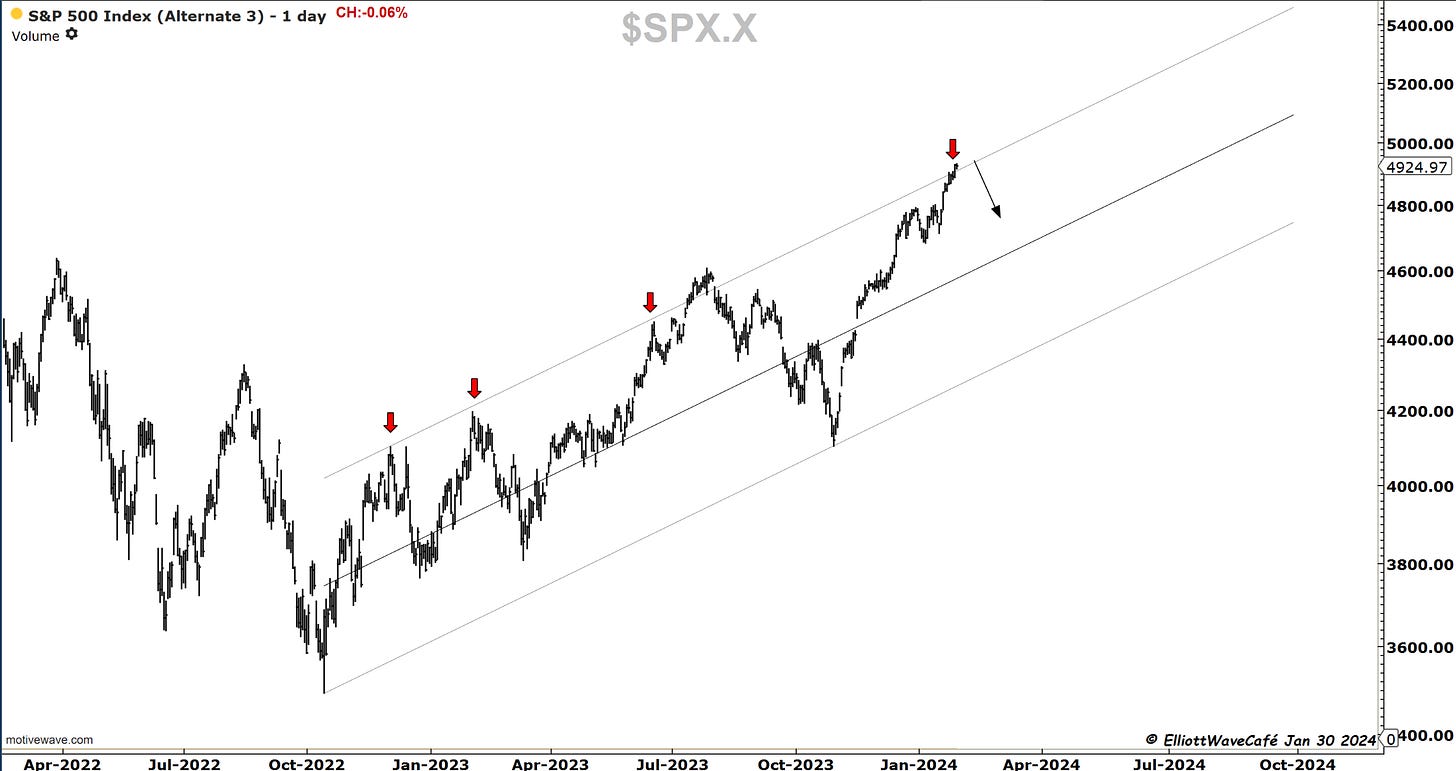
01/30 - Channels are sometimes imperfect, but just a quick glance below suggests that the odds of a pullback would be higher than the odds of a continuous breakout. At this juncture, I would continue to be a trimmer, call seller, put buyer, and straight seller.
The bottom line is that I am wary of this market and its behavior at these highs. My bet is that we will see a corrective move unfold over the next couple of months. The pure price evidence still remains inconclusive and will remain so until we break some of the key levels mentioned.
Nasdaq100
The Nasdaq was negative today in a tight-range price action due most likely to some pullbacks happening in the tech sector and the well-known large-cap names. We are quite likely in the very last stages of this advance before a 7-8% correction begins. 17k is the defense territory for the Bulls.
RUSSELL 2000
Small caps found a bid today, but unless they climb back above 2000, it is tough to be bullish on them. The more the 150-day MA slopes up, the “safer” it would be to trade with a bullish bias. It has started to curl up slightly. Overall they remain a large underperformed with -20% from the ATH in Nov 2021. A story that investment managers across the world widely follow. When will the small caps catch up? This is the question everyone asks.
Dow30
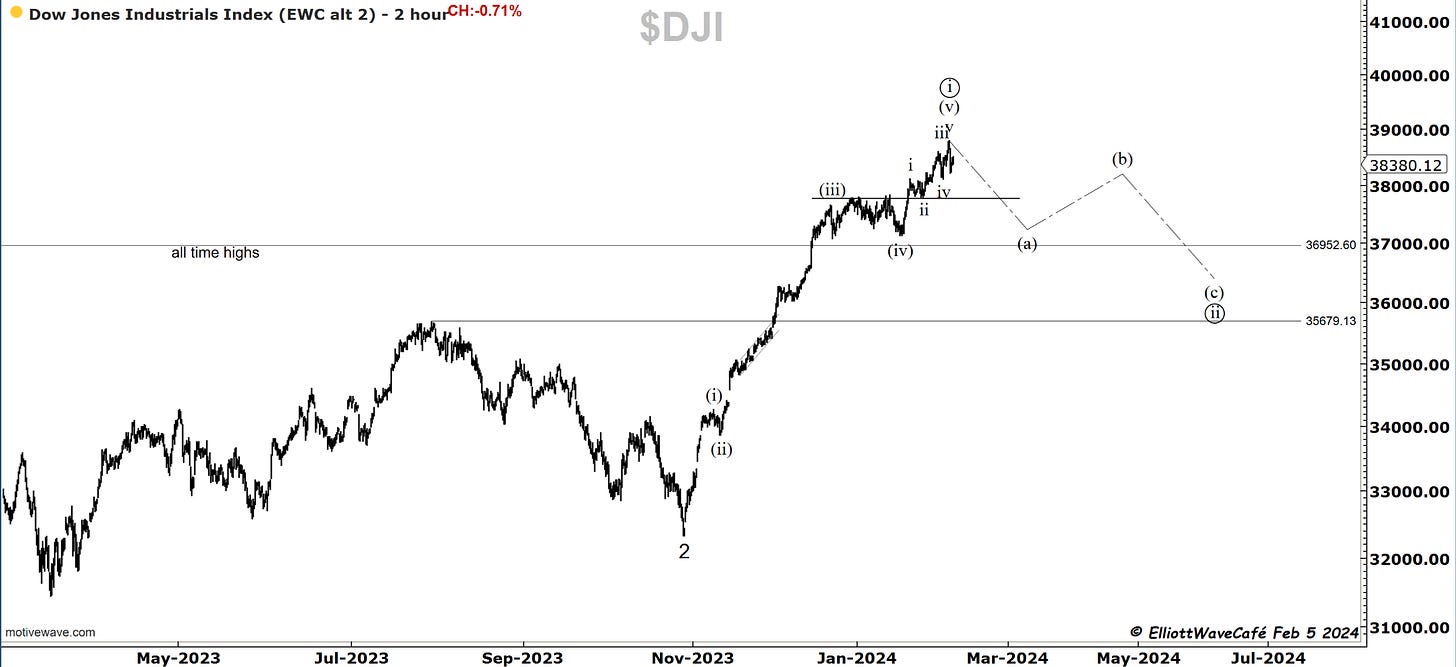
The Dow was up +0.37% today, continuing to hold near the all-time highs. It remains above the 20-day MA with a negative PPO divergence. The trend is uninterrupted at this stage. Only once below 37,800 can we say that something is cooking.
US Dollar and Yields
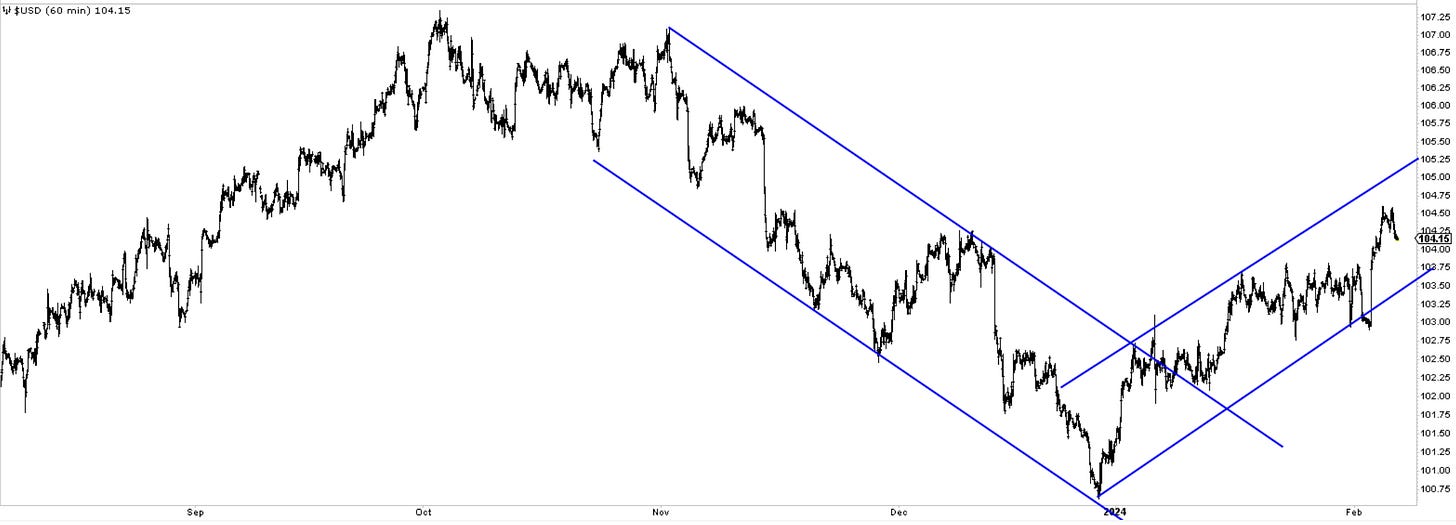
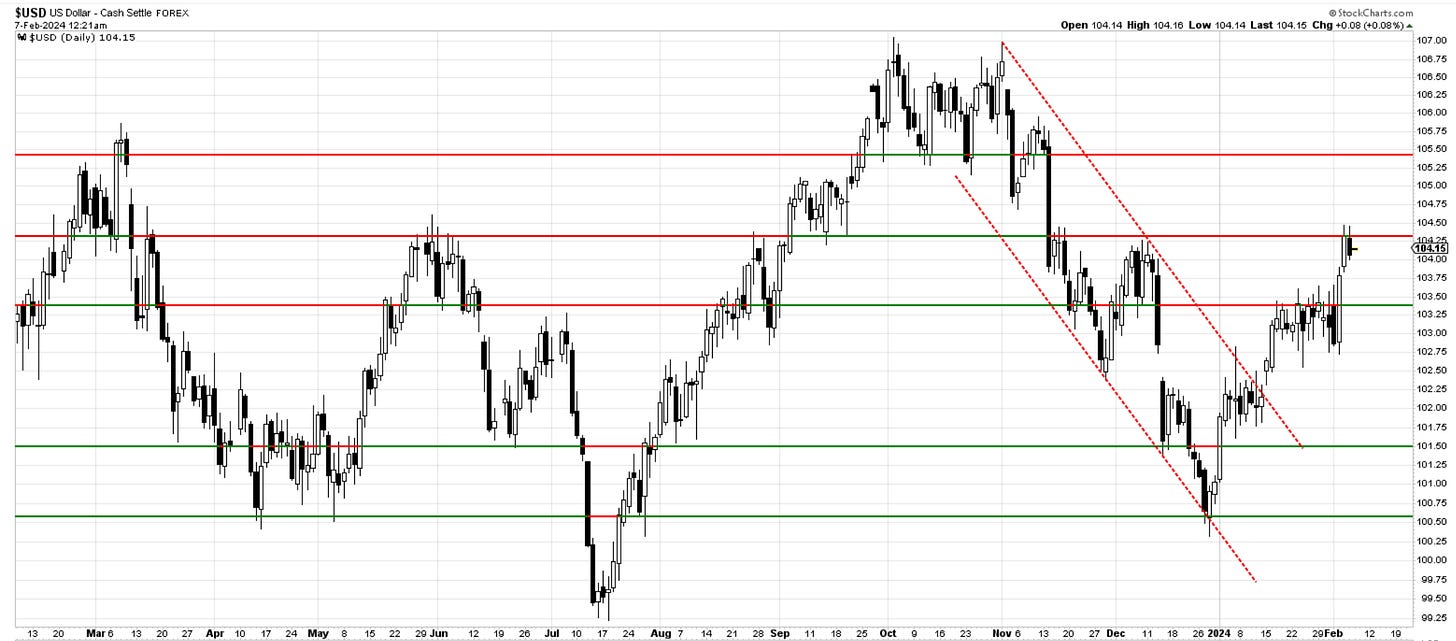
The dollar is in an uptrending channel from the lows late last year. One can count 5 waves from those lows. It would suggest we have much further to go after any pullbacks. The second chart has my daily horizontal resistance levels. Notice we are taking a well-deserved break up here. 103.50 is now support on throwbacks.
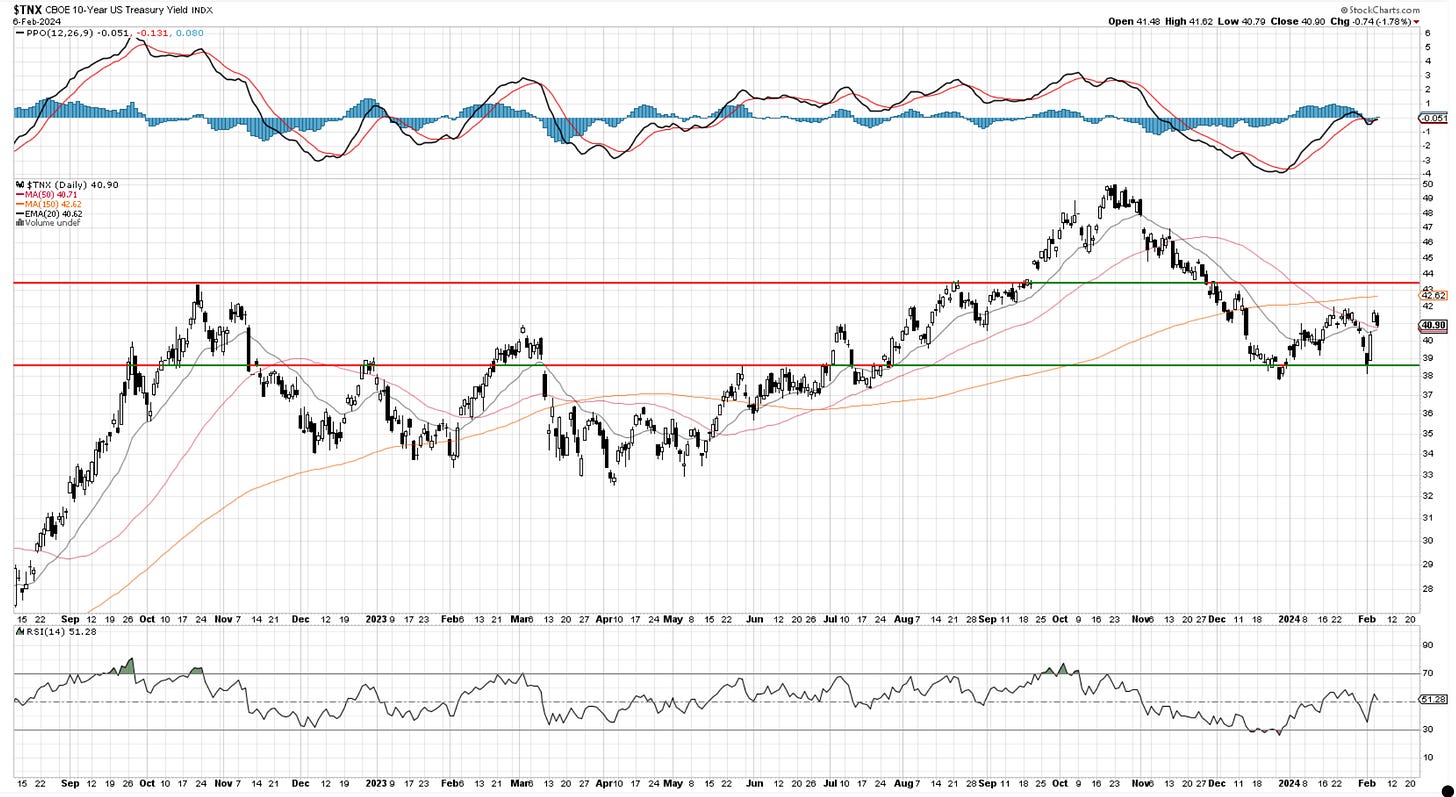
10Y Yields are rangebound, waiting for the next directional catalyst. Either Fed comments or economic data.
Have a look below at the new subscription tiers for EWCafe. Many readers have been asking me if there is a way to get only “The Daily Drip” updates for an affordable price. I would not call it affordable; I would call it dirt cheap. Thank you for supporting my work! Paid subscribers will also get my video updates until March 18th, after which they will only be available to Founding members along with the EW course.
Bitcoin
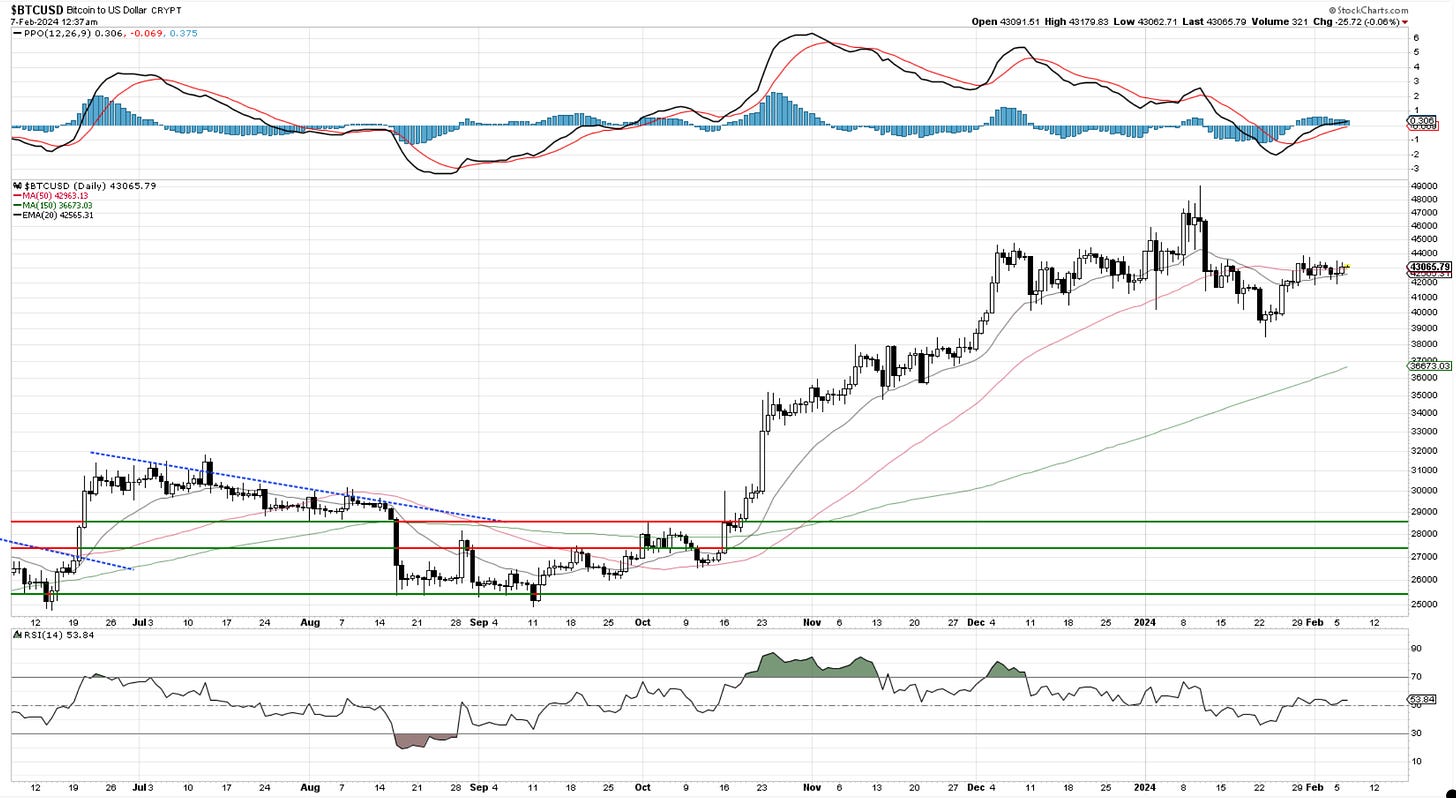
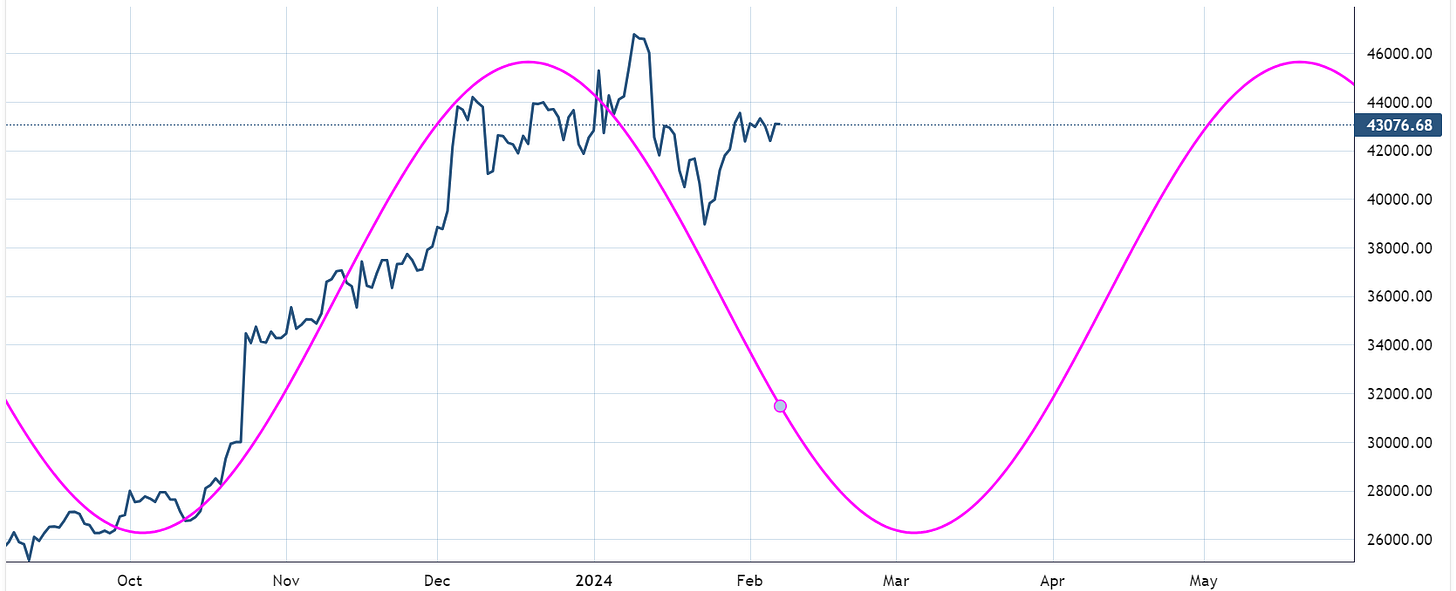
Prior BTC comments remain - price action is tight. Cycles are looking to the end of February roughly for the corrective period to end.
Posted Dec 7th below.
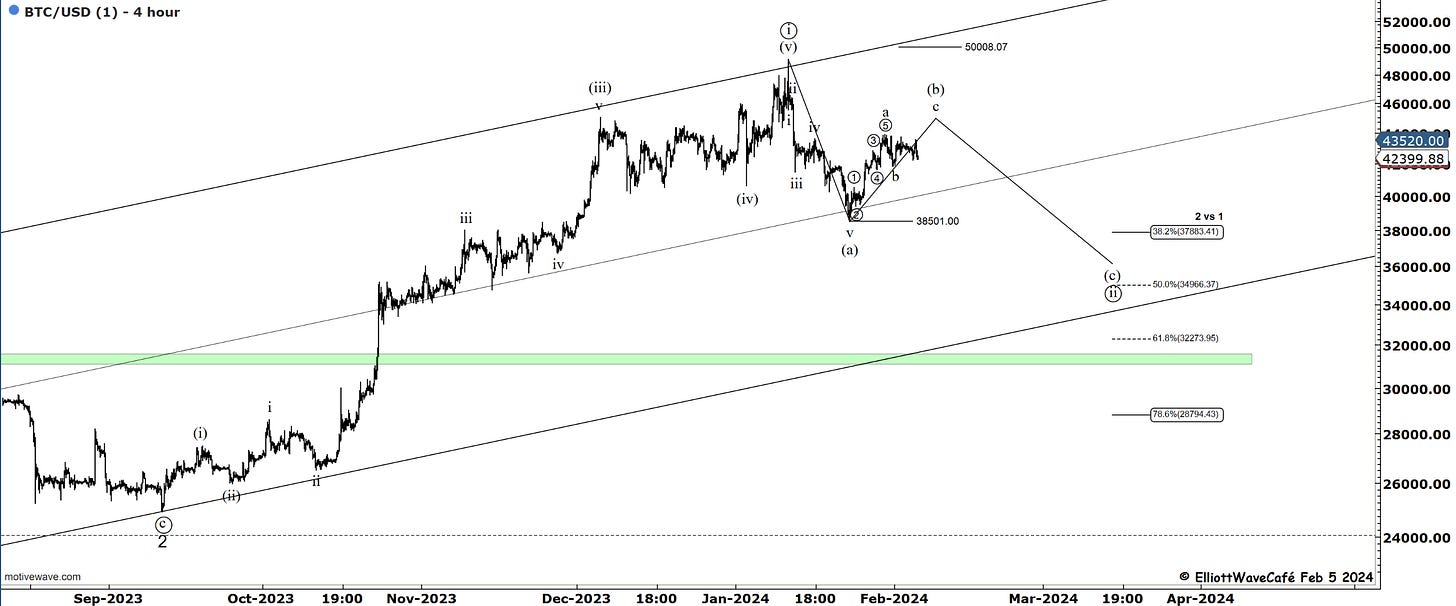
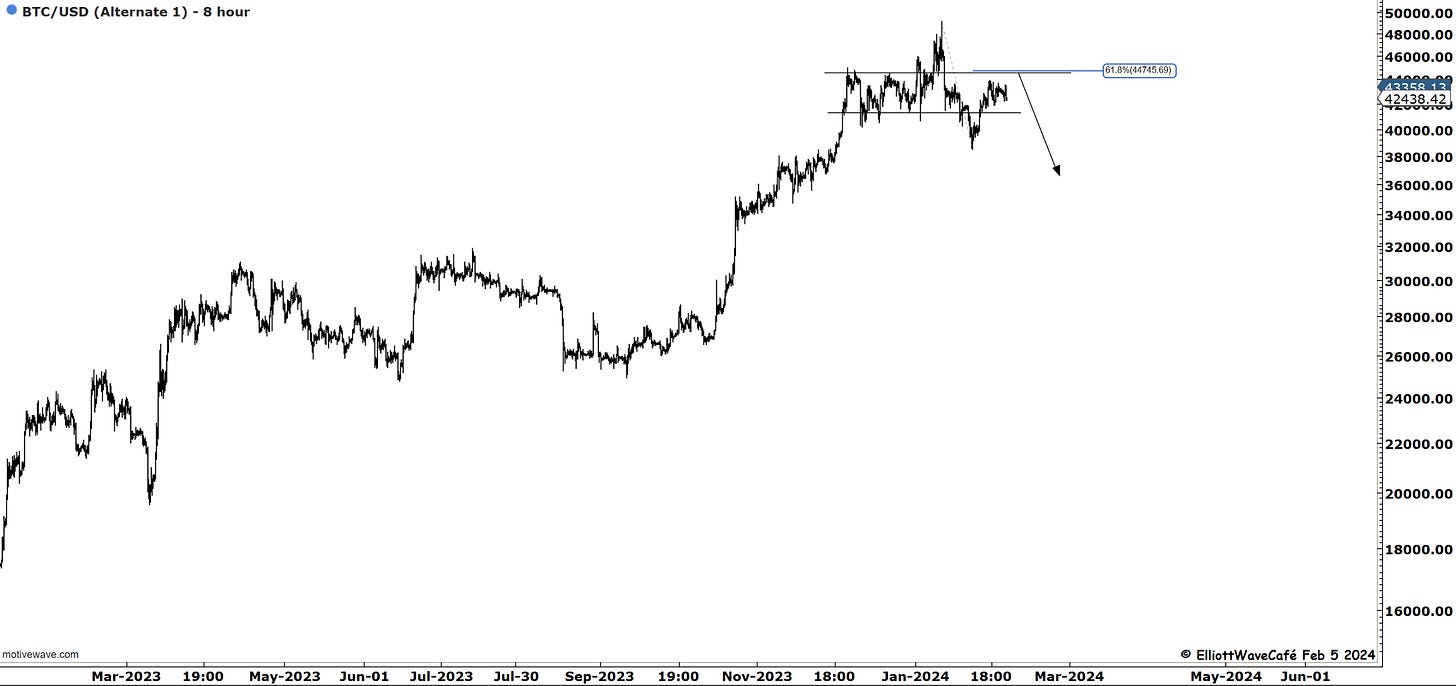
Bitcoin has had several attempts to break 43,800 but has so far been unsuccessful. I think it would make the wave structure a bit cleaner in terms of an abc if it does. I think one is right to think short below 45k and prepare bullish above.
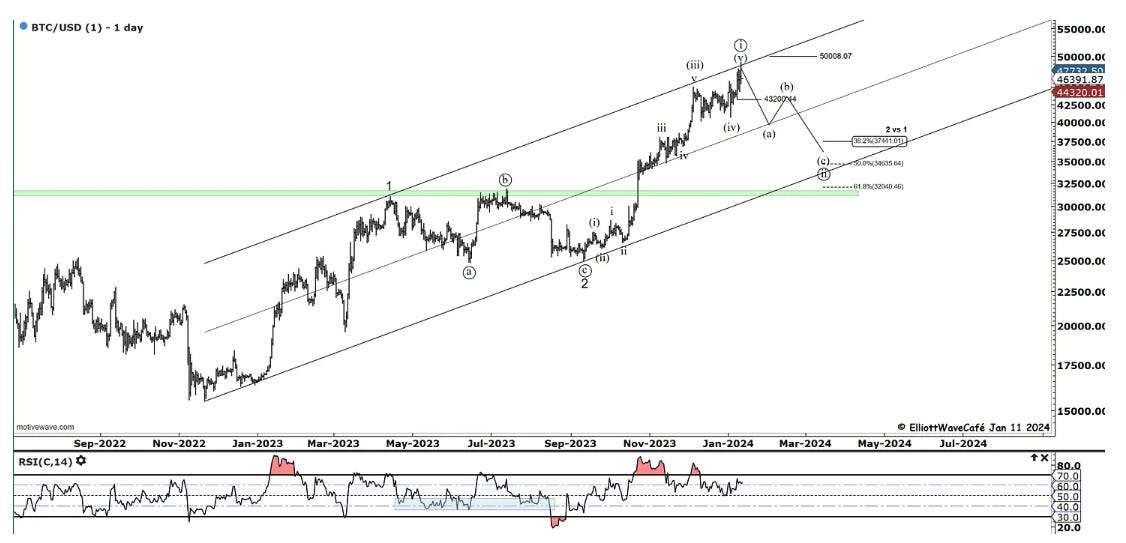
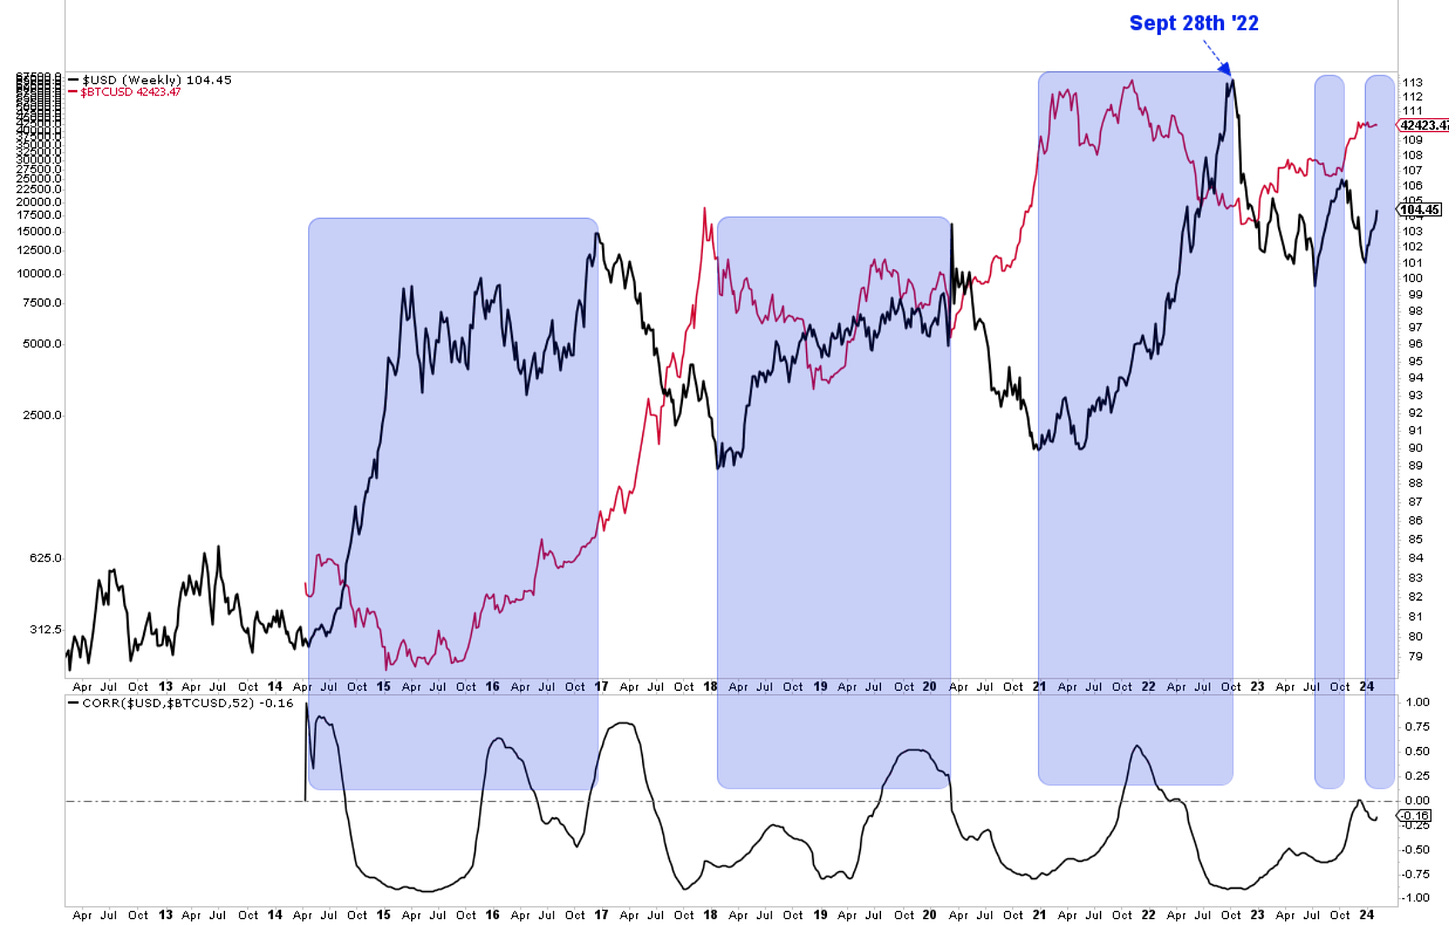
Here is the chart from Jan 11th, which we prepared ahead and at the time of ETF's launch. The second one is updated as of today and remains the main focus until enough bullish evidence creeps in to change that view. I am also thinking of a strong dollar / BTC correlation. You can see that in the last chart. Periods in blue are stronger dollar environments. Bitcoin price action has been actually lackluster since the Dollar bottomed at the end of last year.
“Double shot” Daily member video coming up next,
If you’re new to Elliott Wave or need to refresh, there is a 7-hour video course with downloadable slides under The Coarse tab on the website.
Have a great day wherever you are! - trade well, and don’t forget to subscribe and drop a like if this letter helps you in any way.
Cris
email: ewcafe@pm.me


