
The Daily Drip
Markets review, strategy and analysis
Note: The EW counts on the right edge are real-time, and they are prone to adjustments as price action develops. Elliott Wave has a fluid approach, is evidence-based, and requires constant monitoring of certain thresholds.
In the counts below, this (( )) = circle on chart
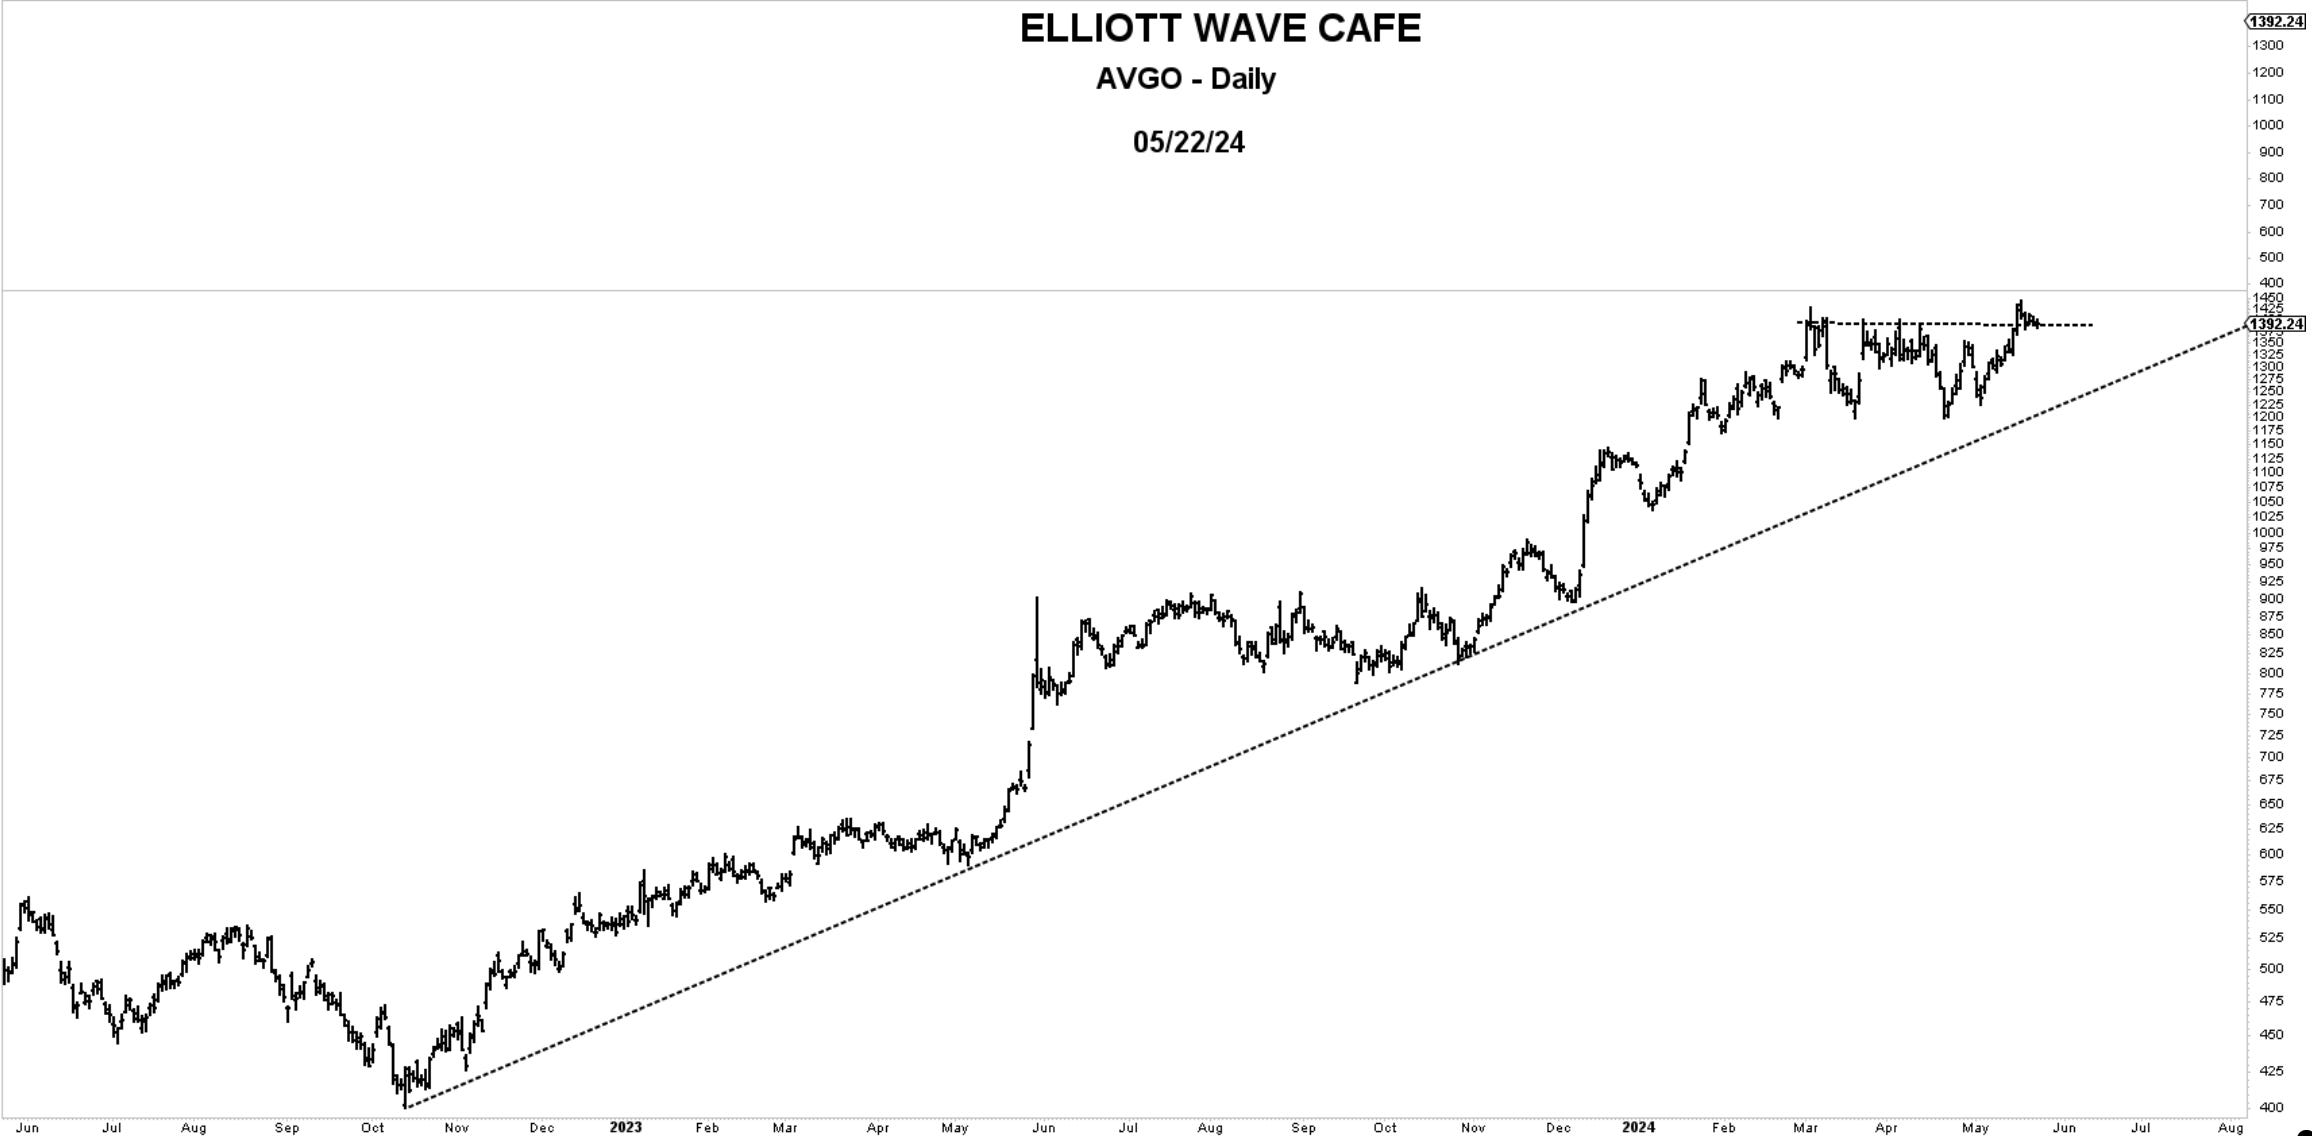
Chart of the Day—AVGO— Breakout about a week ago, followed by holding and testing of the old resistance zone. Below 1300 and I would not stick around.
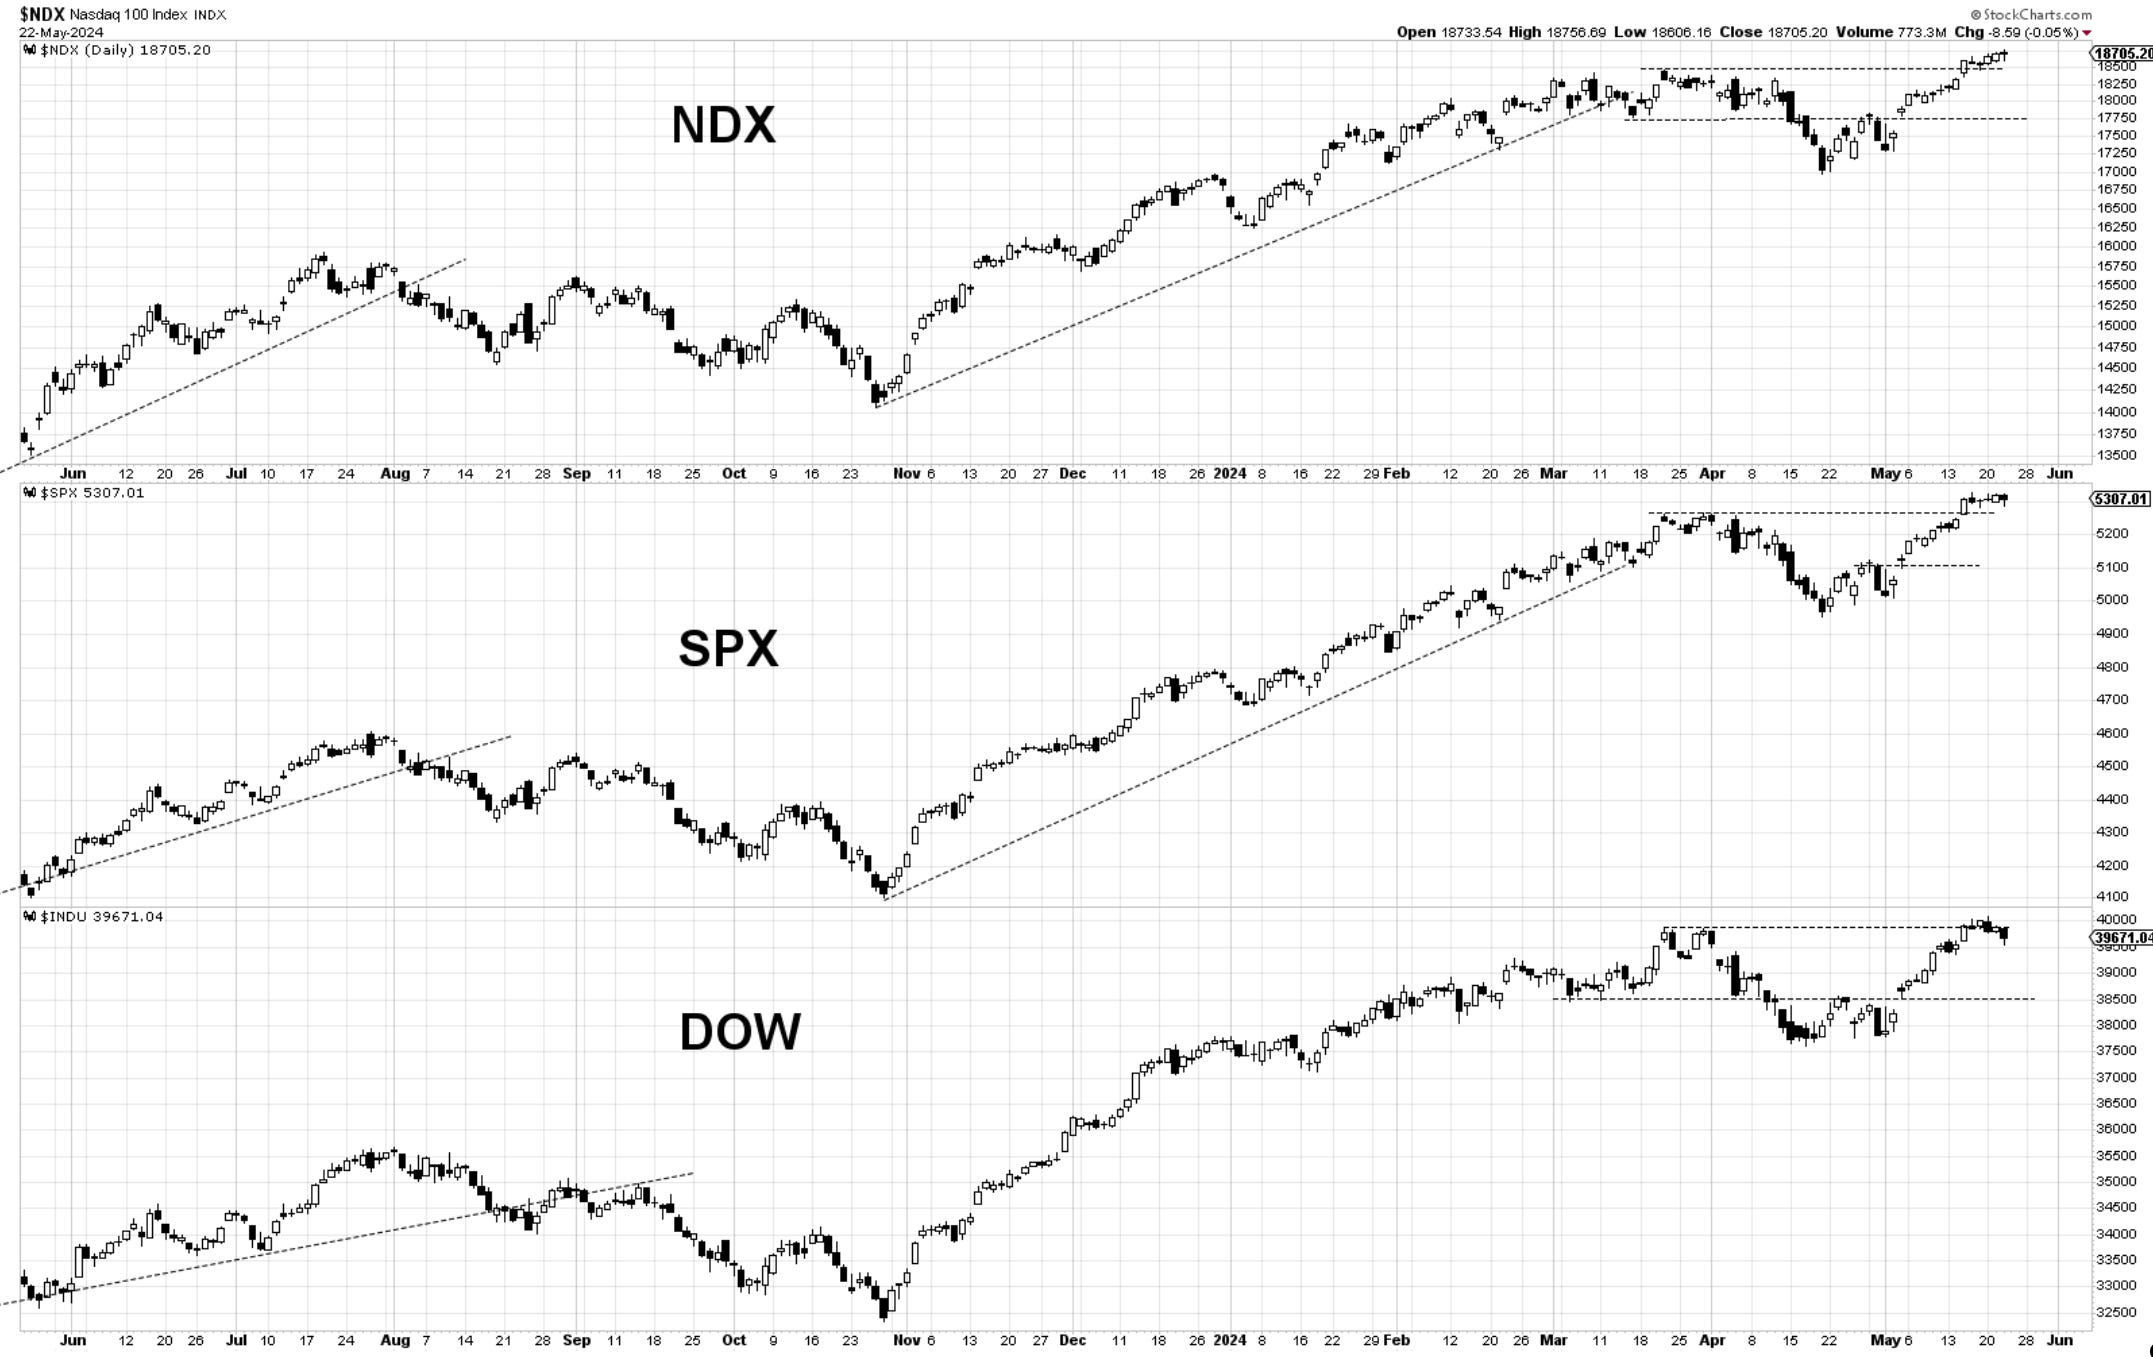
Bottom Line: The market remains in control of the bulls. Long exposure is suggested. Stocks in multiple sectors continue to act well without clear signs of extended deterioration.
Let’s now dive into charts and further analysis below… then the Double Shot daily video.
Only $8 / month for those interested and want to support these updates.
