
The Daily Drip
Core markets charts updates and commentary
Note: The counts on the right edge are real-time, and they are prone to adjustments as price action develops. Elliott Wave has a fluid approach, is evidence-based, and requires constant monitoring of certain thresholds.
In the counts below, this (( )) = circle on chart
I want to start this last letter of 2023 by wishing everyone a Happy New Year!
SP500
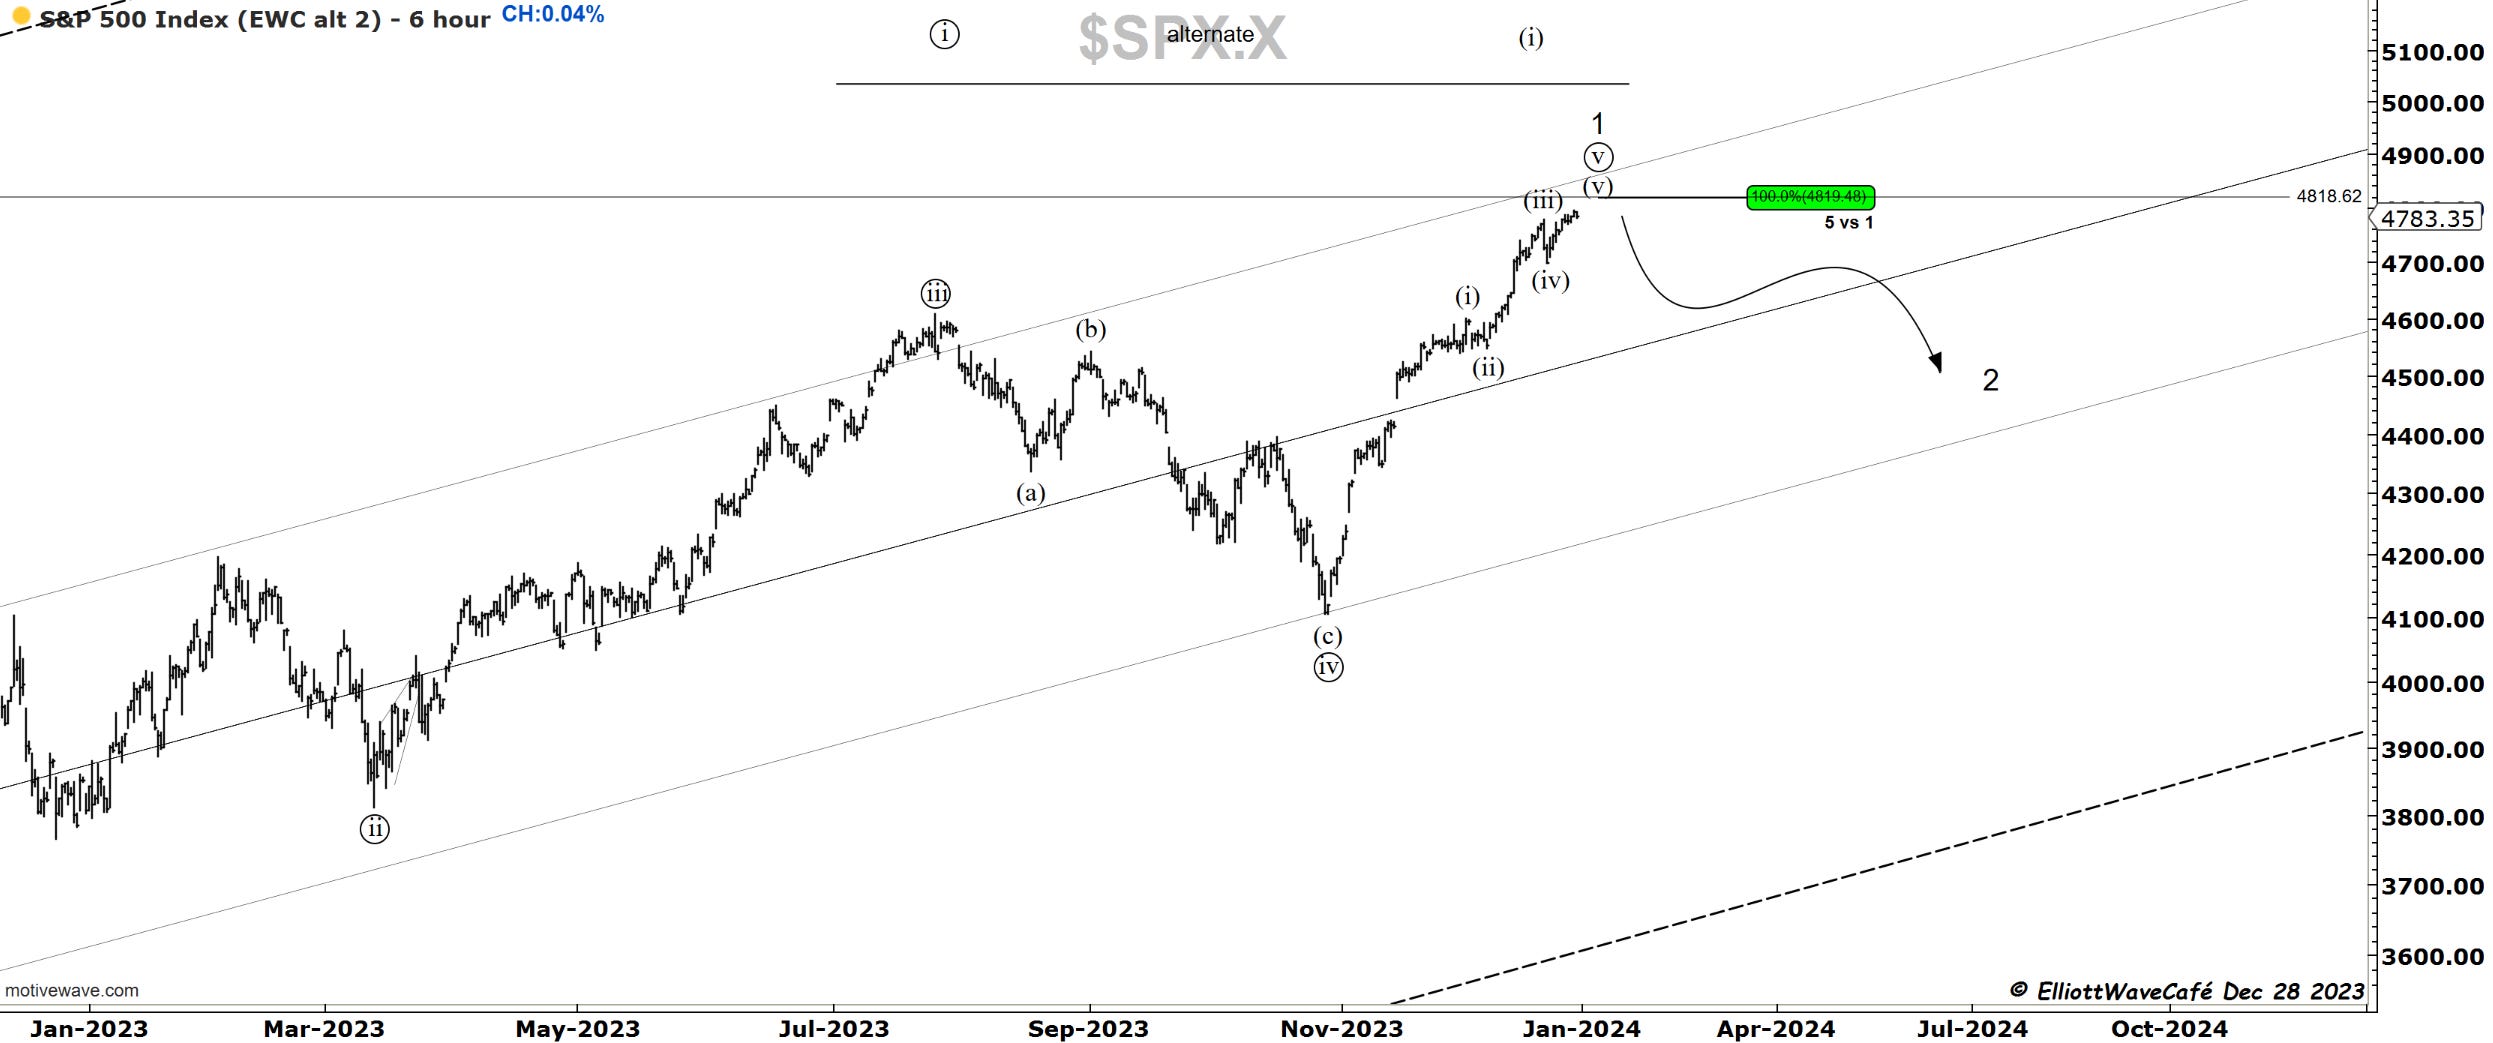
Yesterday, we took a look at some longer-term counts and cycles to offer perspective going into 2024/2025. On the smaller time frames, the price action has been almost nonexistent for the past few days. Very tight ranges. I continue to expect a sizable correction to take place as we get the new year going. Many long profits will likely be taken in January so as not to count for the tax year 2023. My initial target is near 4600 and towards the center of the channel, followed by a bounce and then another corrective leg lower. Ideally, that should set up the next strong leg upwards in wave 3 for spring or early summer.
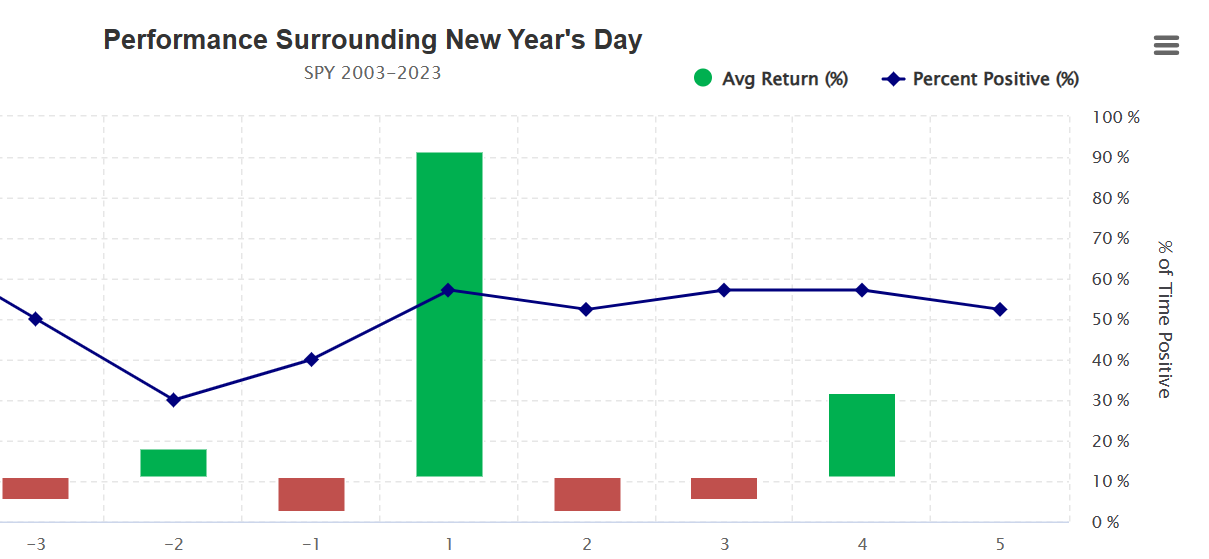
Surrounding the New Year's days, the performance is as follows. Excitement as the new year gets going, followed by a hangover.
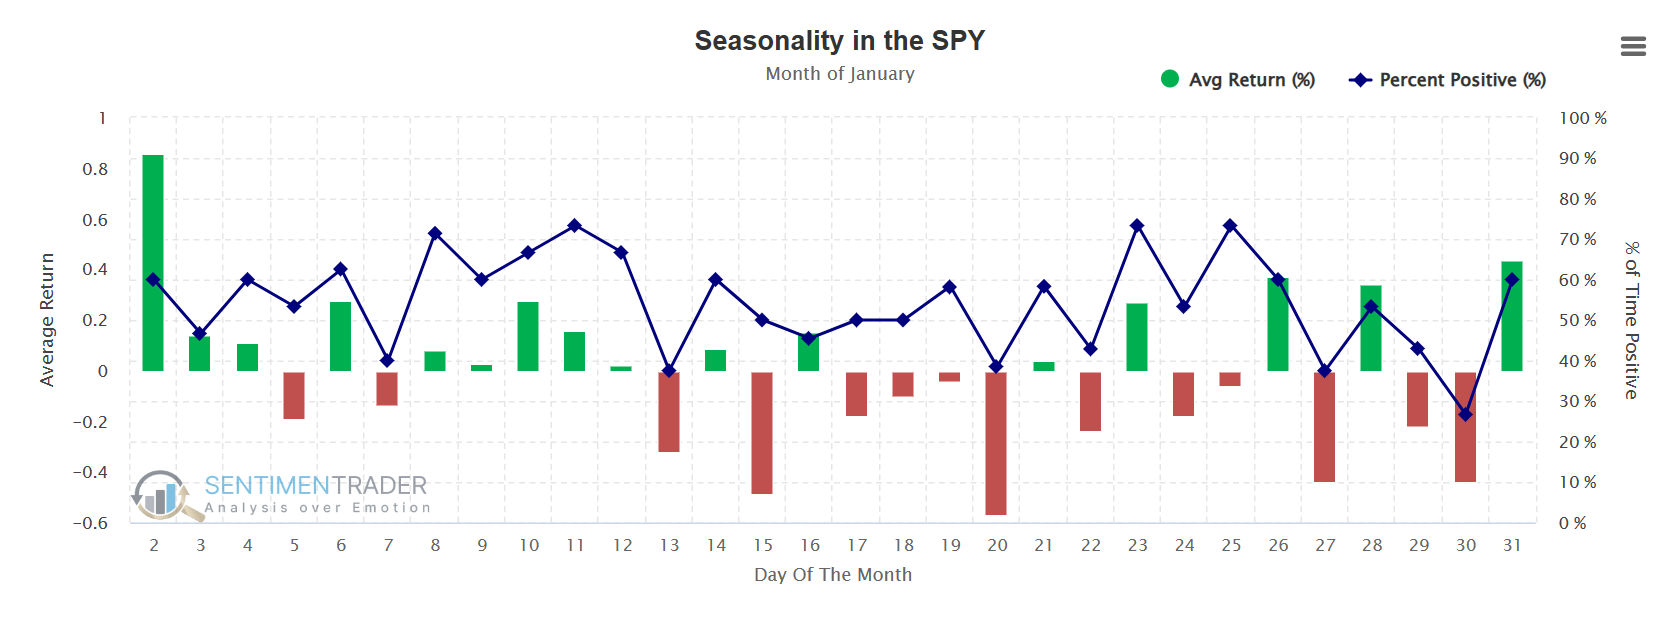
Here is the seasonality for the month of January. February is a negative month going back to whatever period one chooses. So get ready for some pullbacks.
Nasdaq100
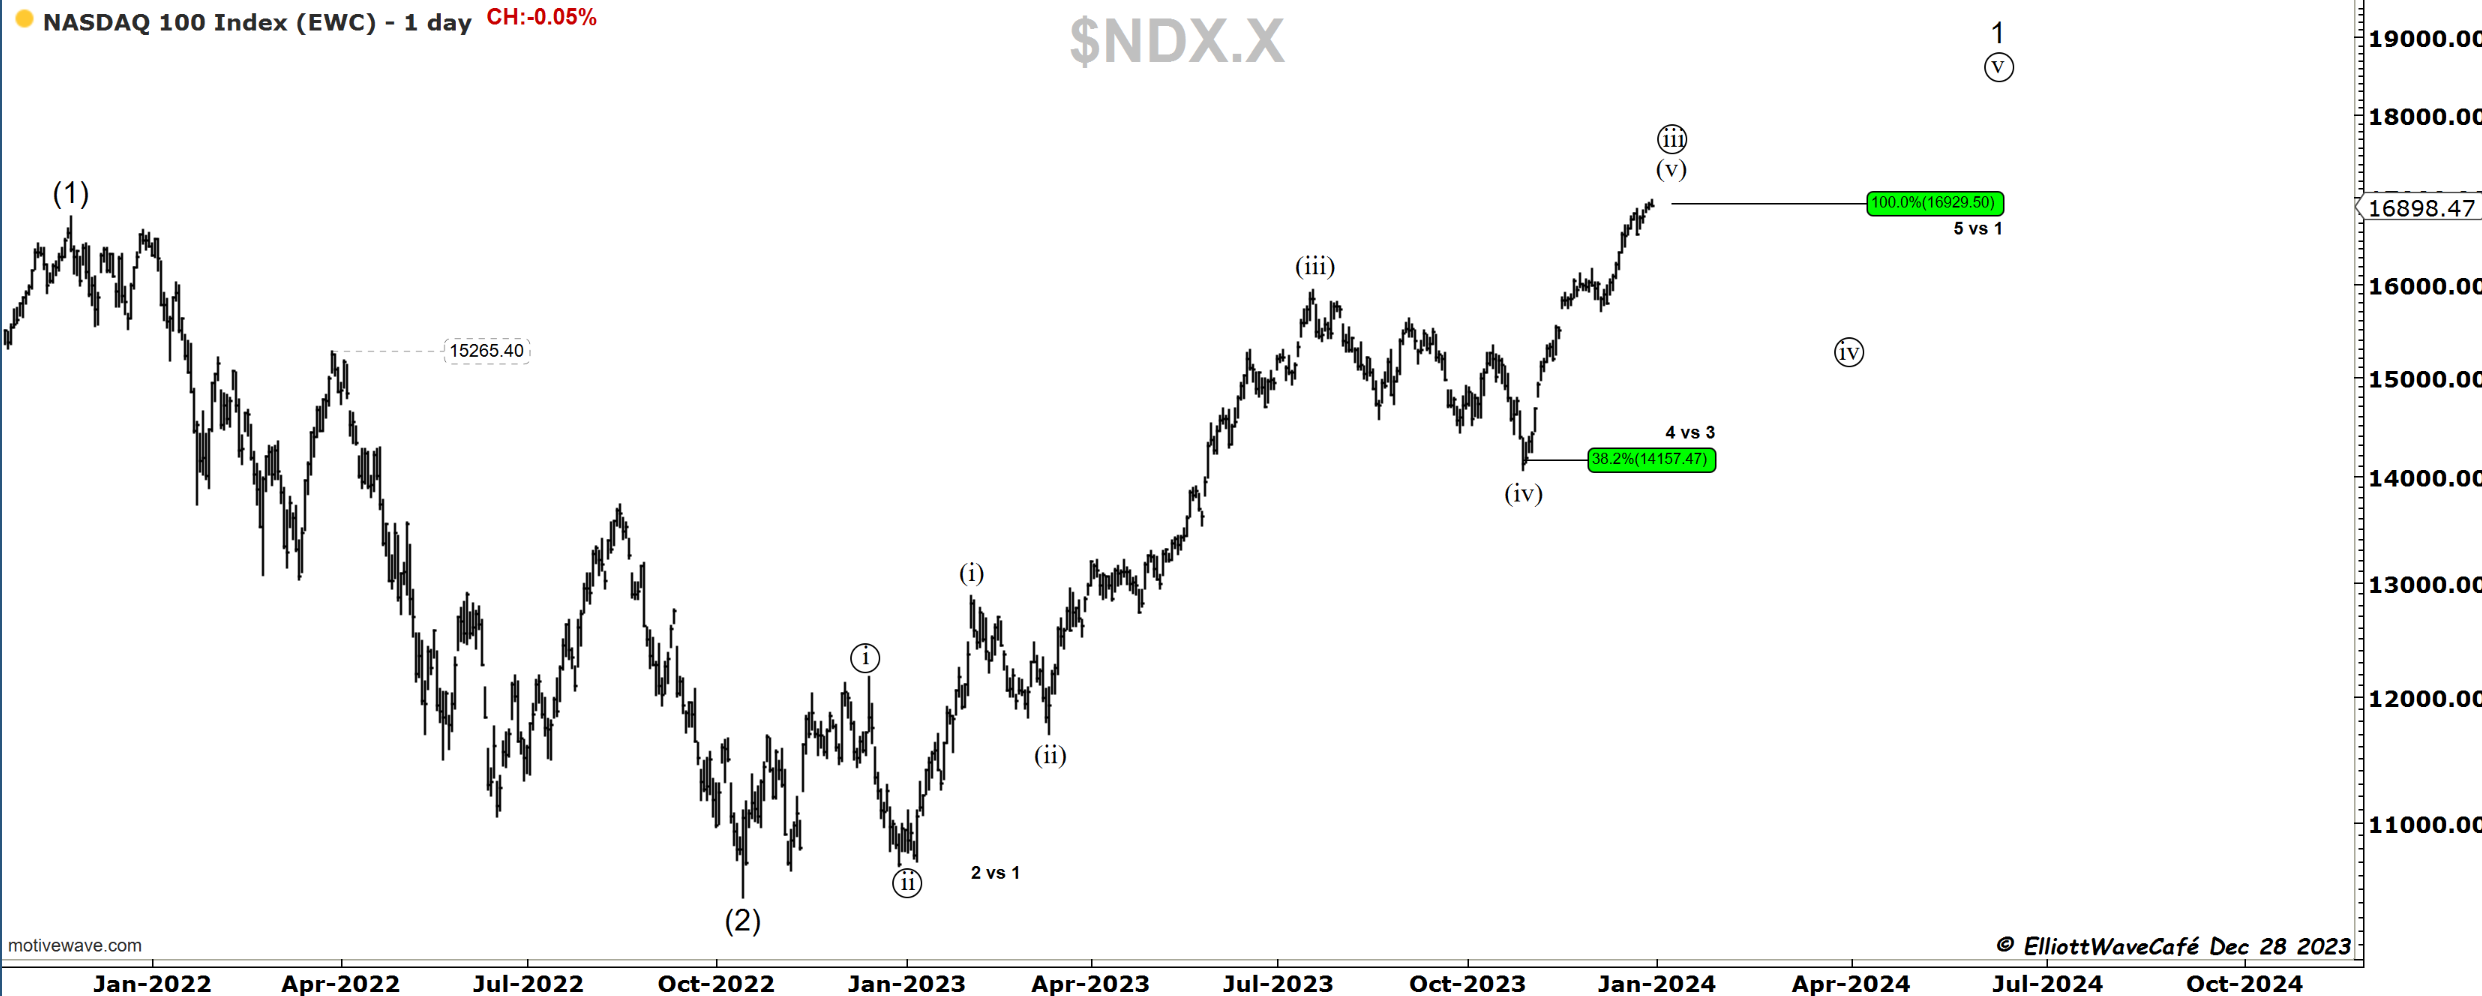
Here is the shorter-term Nasdaq with wave (iv) at 38.2% and wave (v) near completion. A wave ((iv)) at a higher degree will clean up and create a sentiment reset.
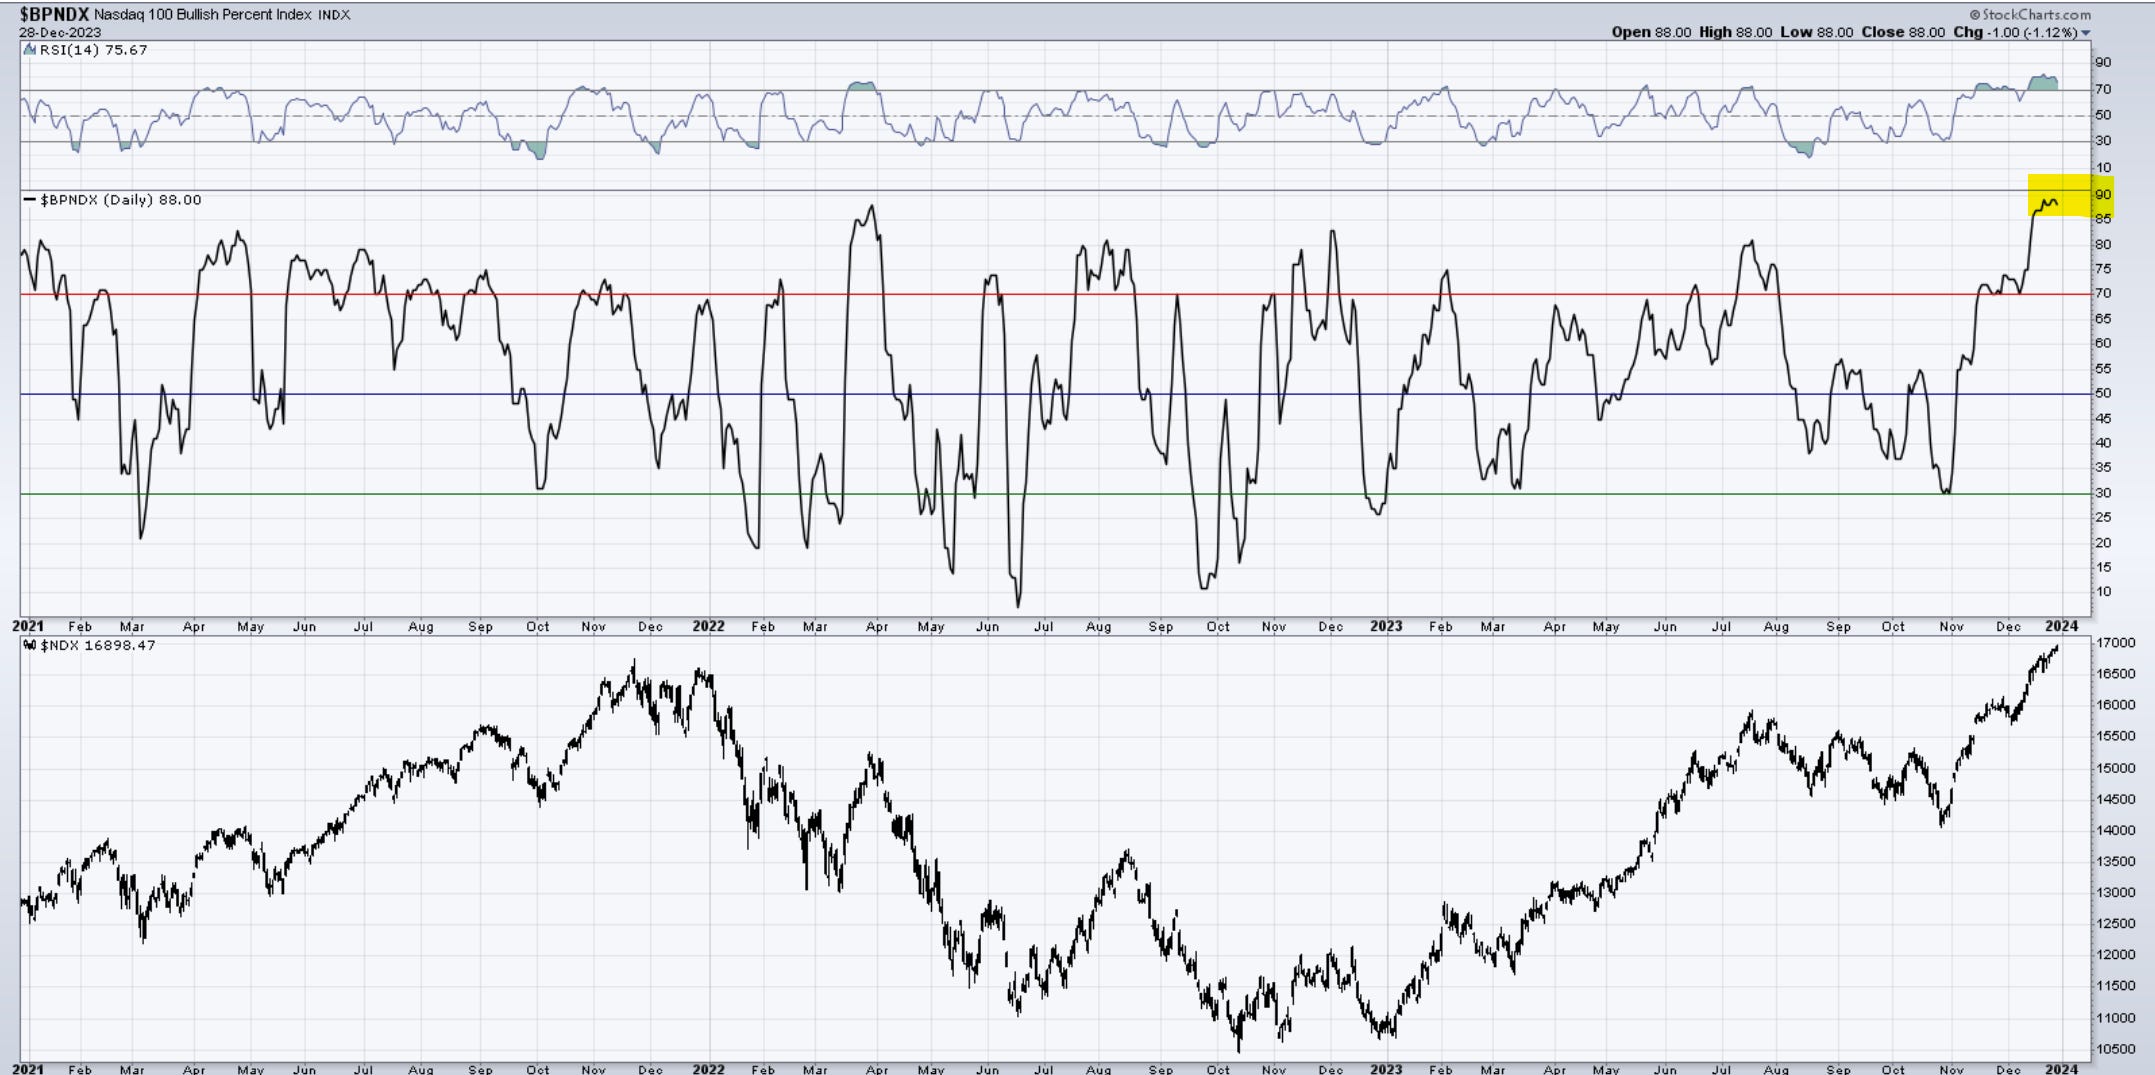
To give some perspective on how hot we are in the Nasdaq, take a look at the BPI . At 90. Not sure what the returns will be from here, but fresh money must be careful over the next two months. Some of this needs to be washed out. It does not mean a price collapse in any way, it could be a gradual pullback until we reset sentiment.
RUSSELL 2000
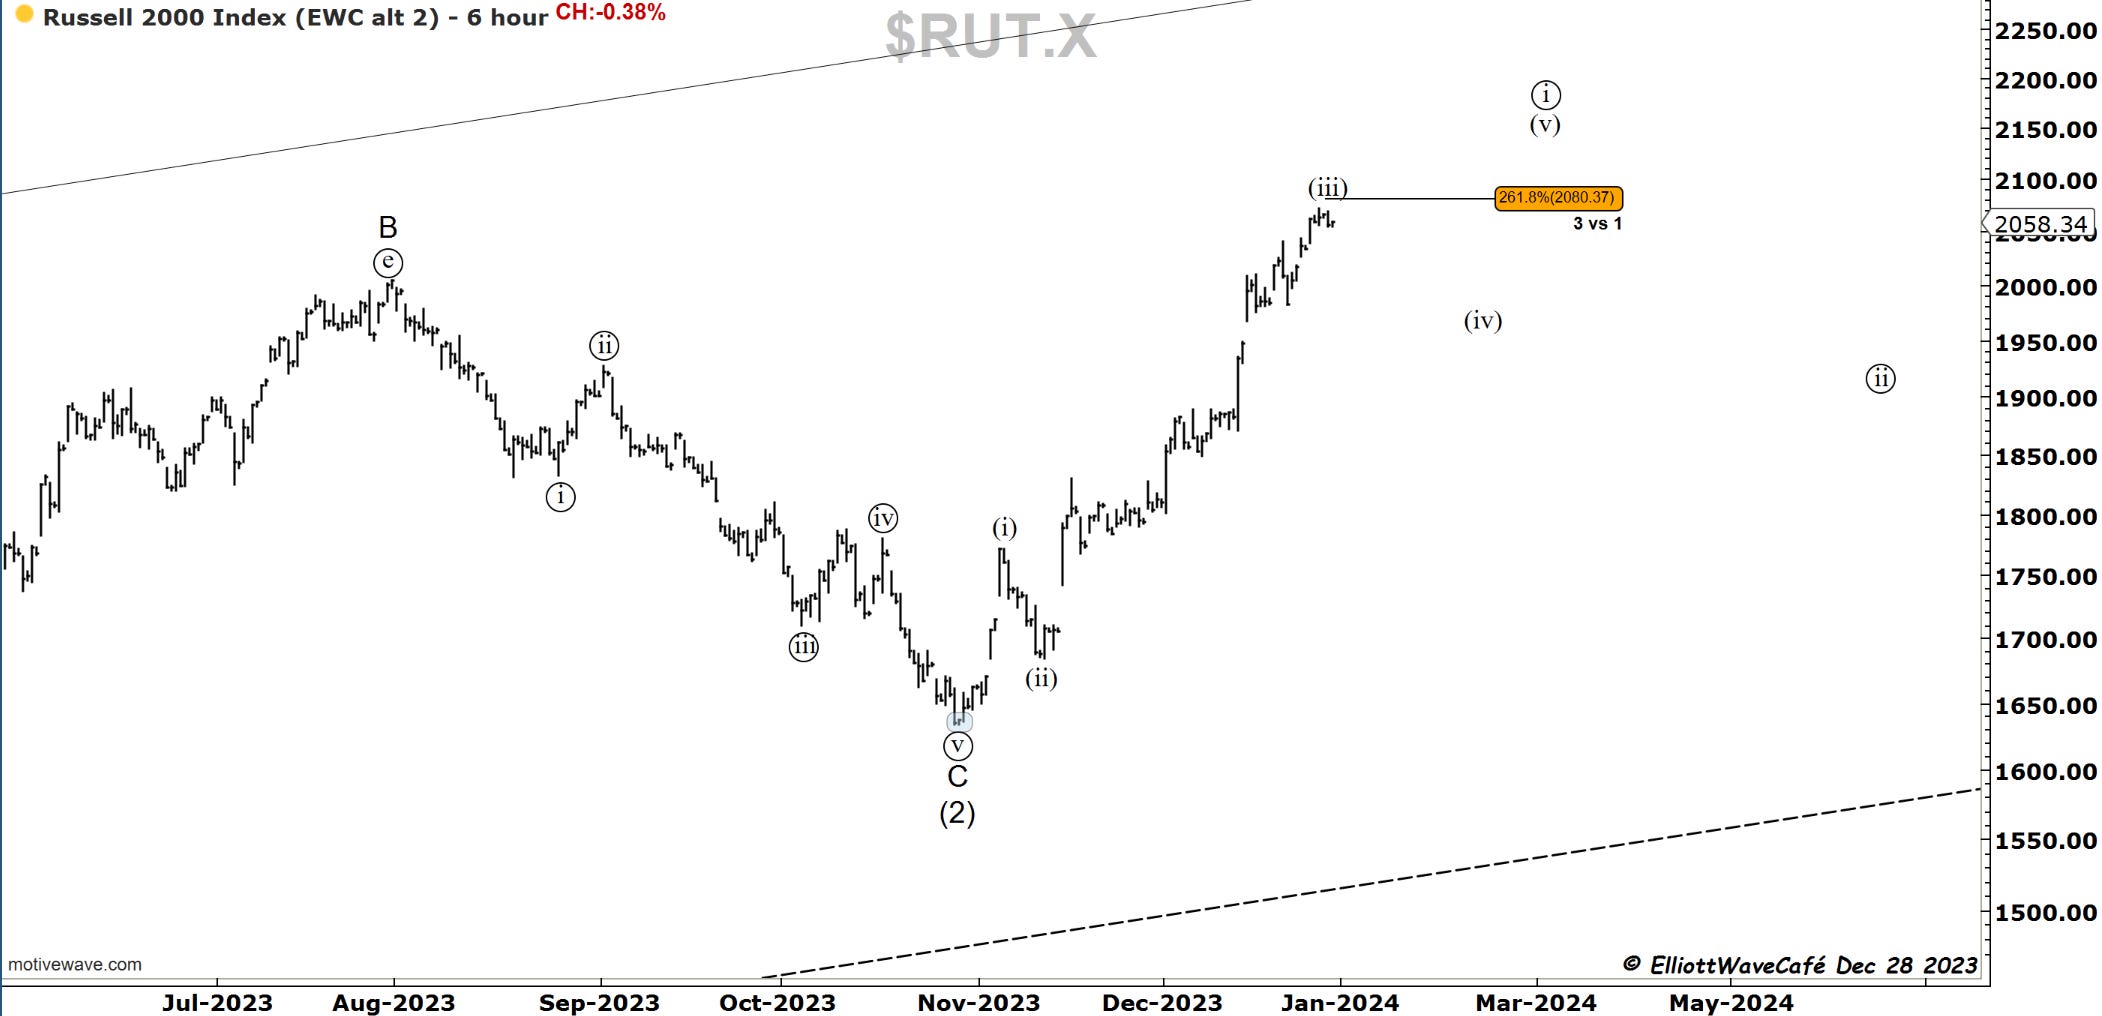
This impulsive leg has now traveled 261.8% multiple of wave (i). It’s a decent target for a 3rd wave, so expecting reactions up here is not out of the ordinary. If wave (iv) unfolds next, we will get another push in (v), followed by something a little bit deeper.

Dow30
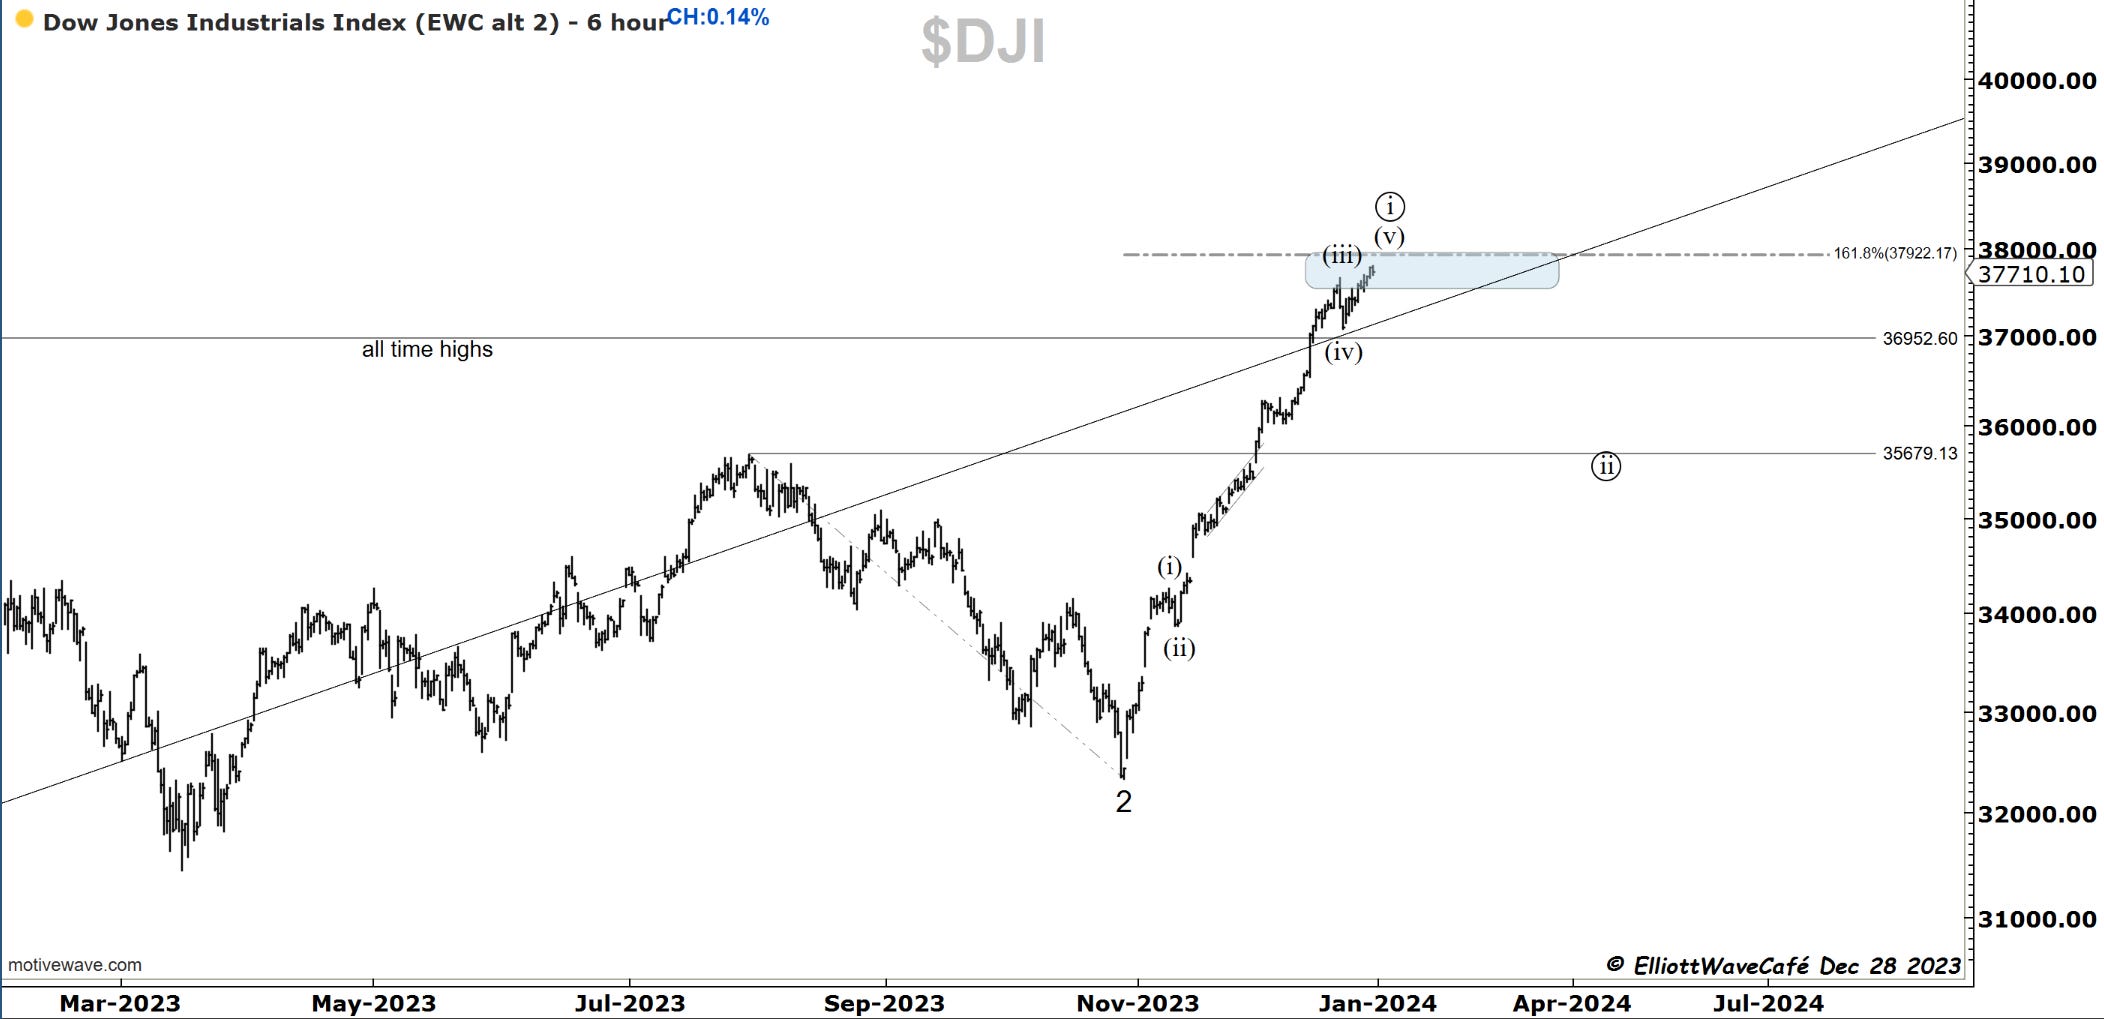
A slow, gradual move higher brings us closer to that reverse 161.8% fib of the latest decline in the summer/fall. The rsi shows a loss of momentum characteristic for the 5th wave. Once the decline starts, I would expect it to retrace towards 35,679.
US Dollar and Yields
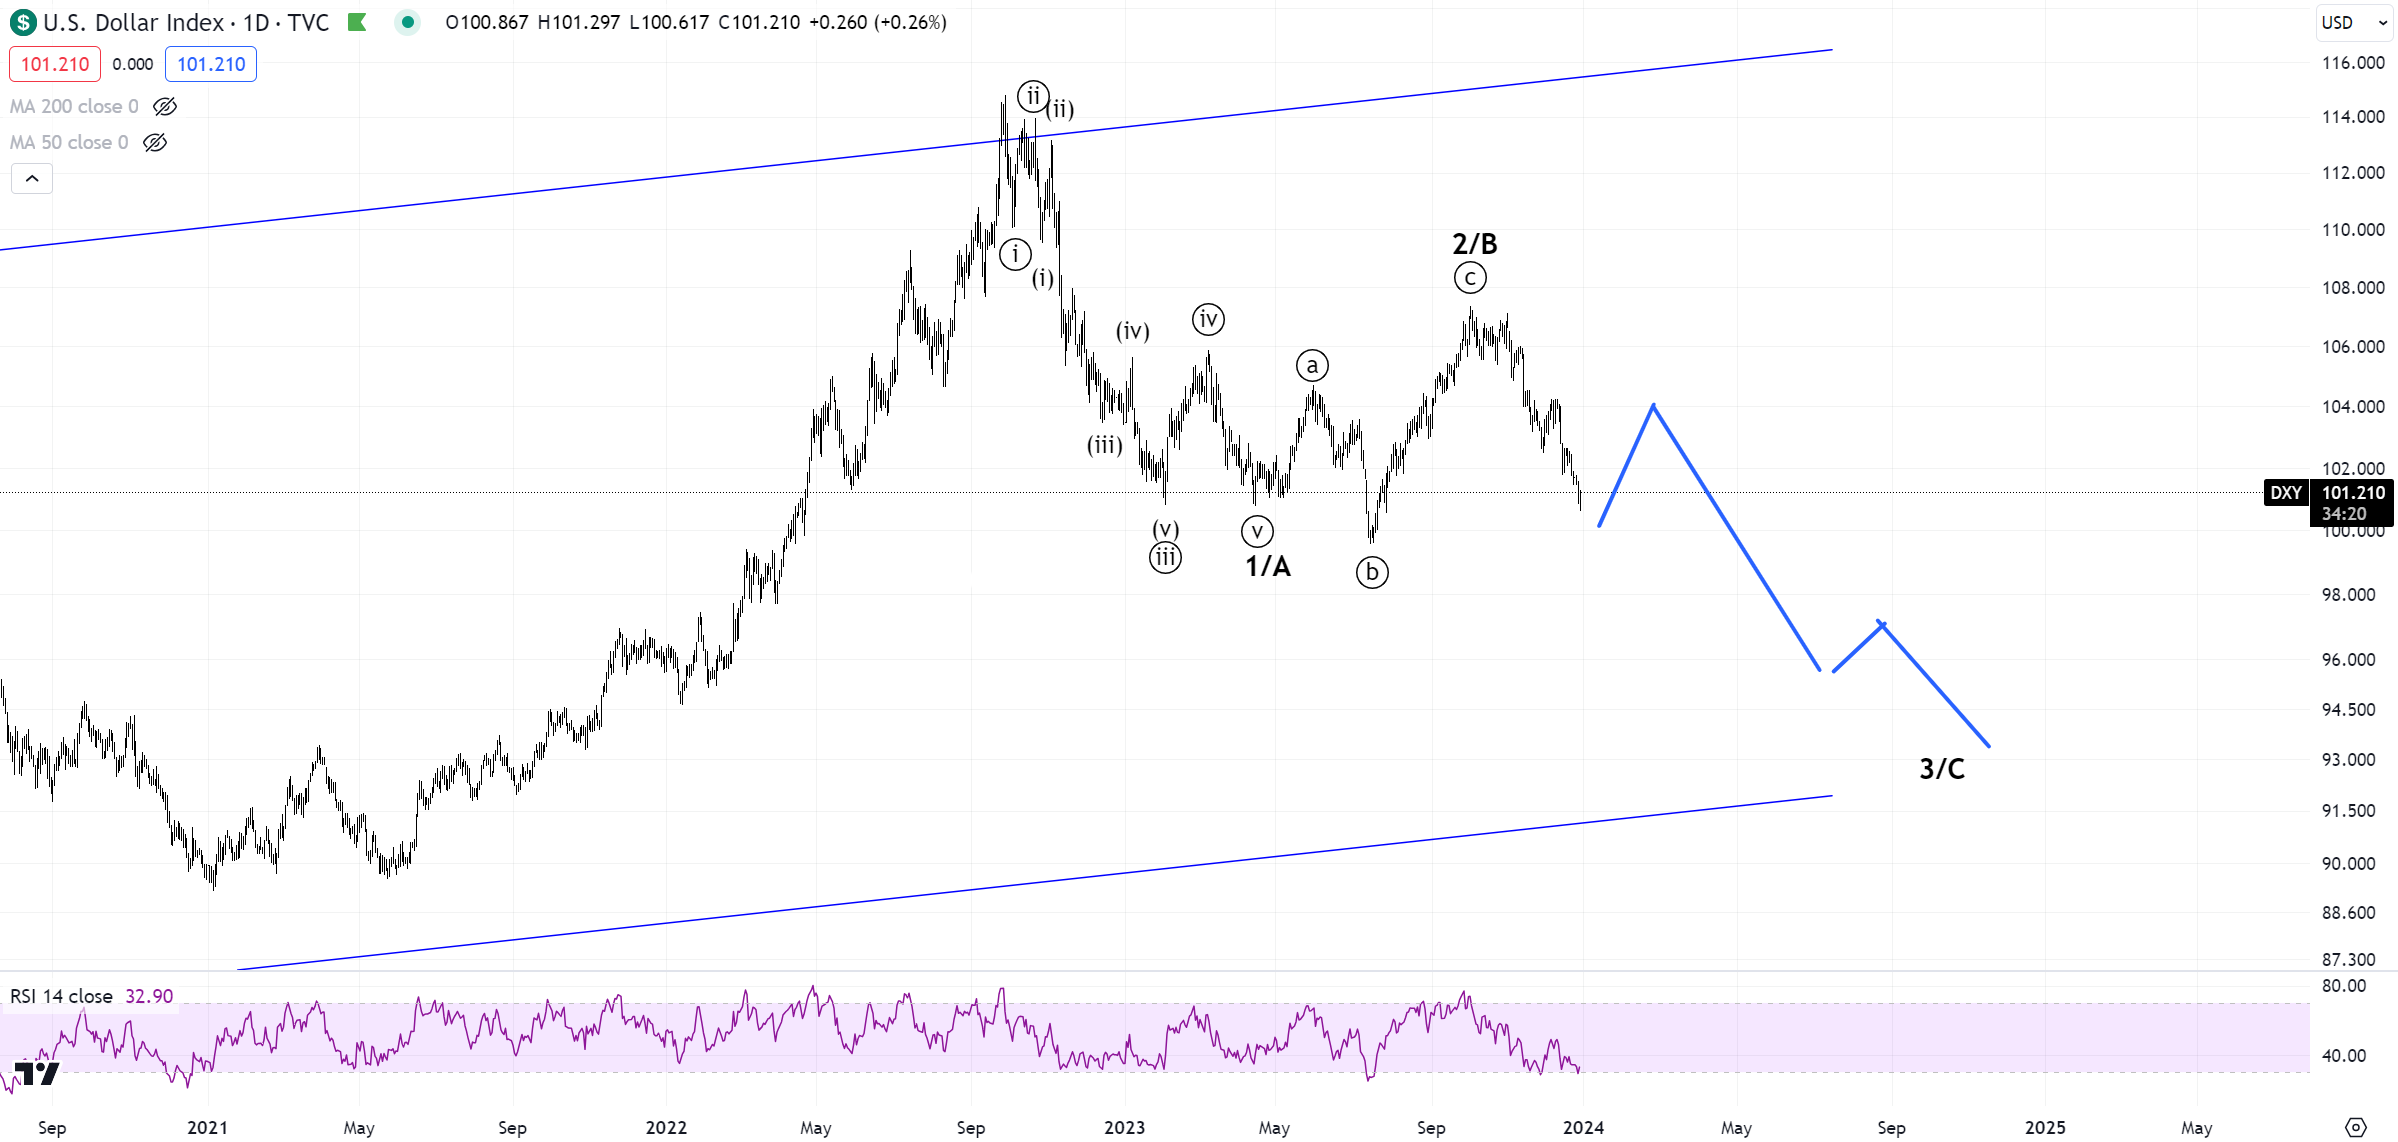
A temporary reversal in the dollar and yields is around the corner. It should coincide with the equities pullback. If the current count is correct, a stronger selloff should be taking place afterward. Below, you can see the active 130-day cycle, getting closer to a turning point.
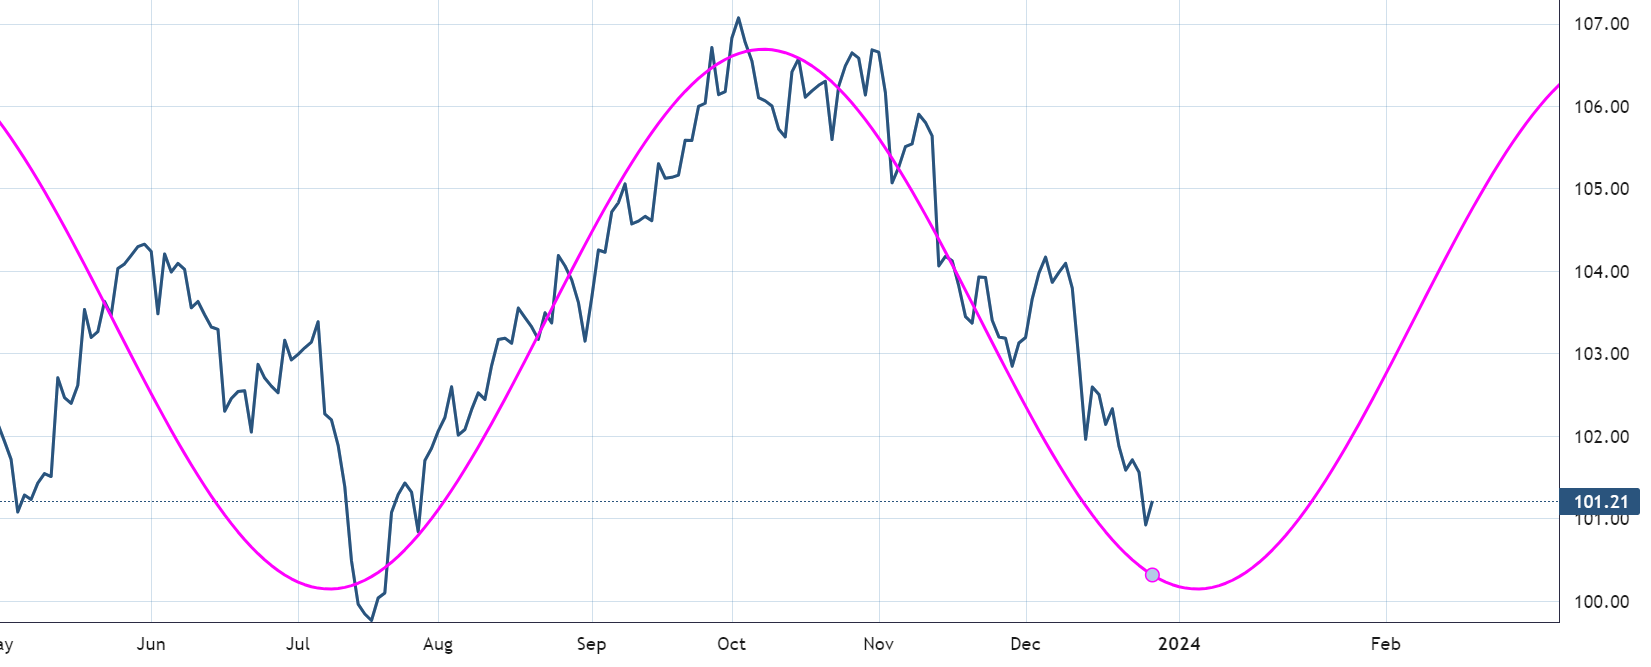
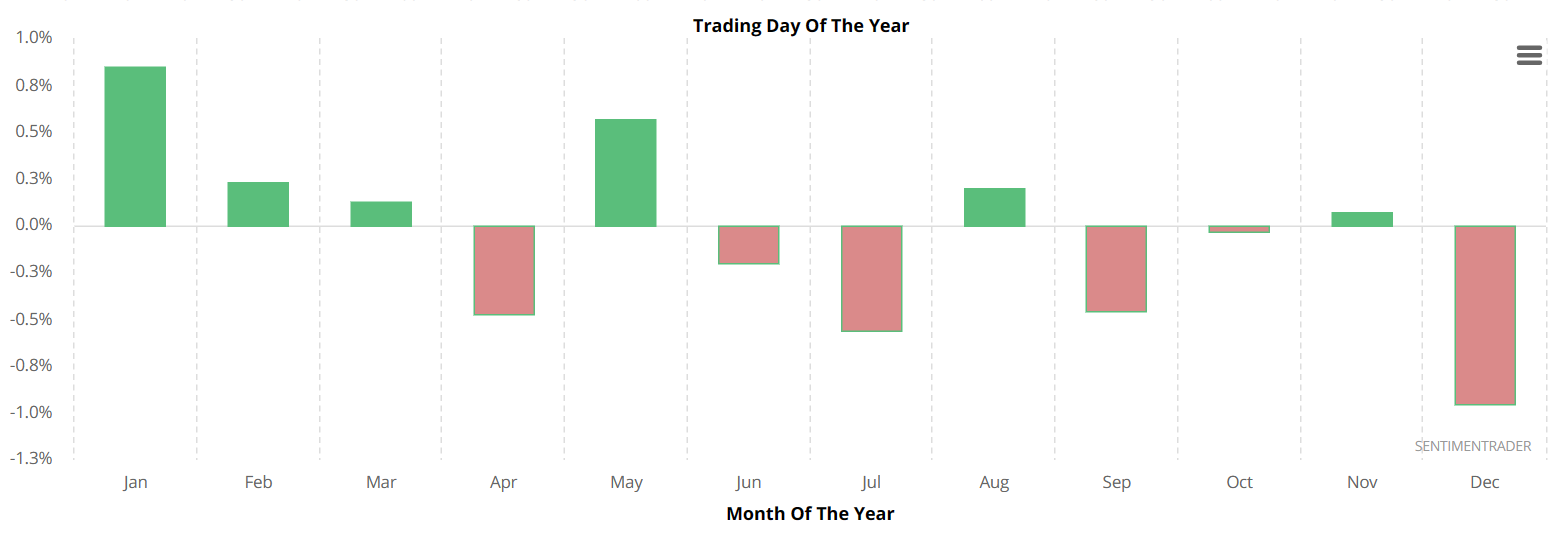
Here is the USD seasonality for the year. Take a look at the first three months.
Gold
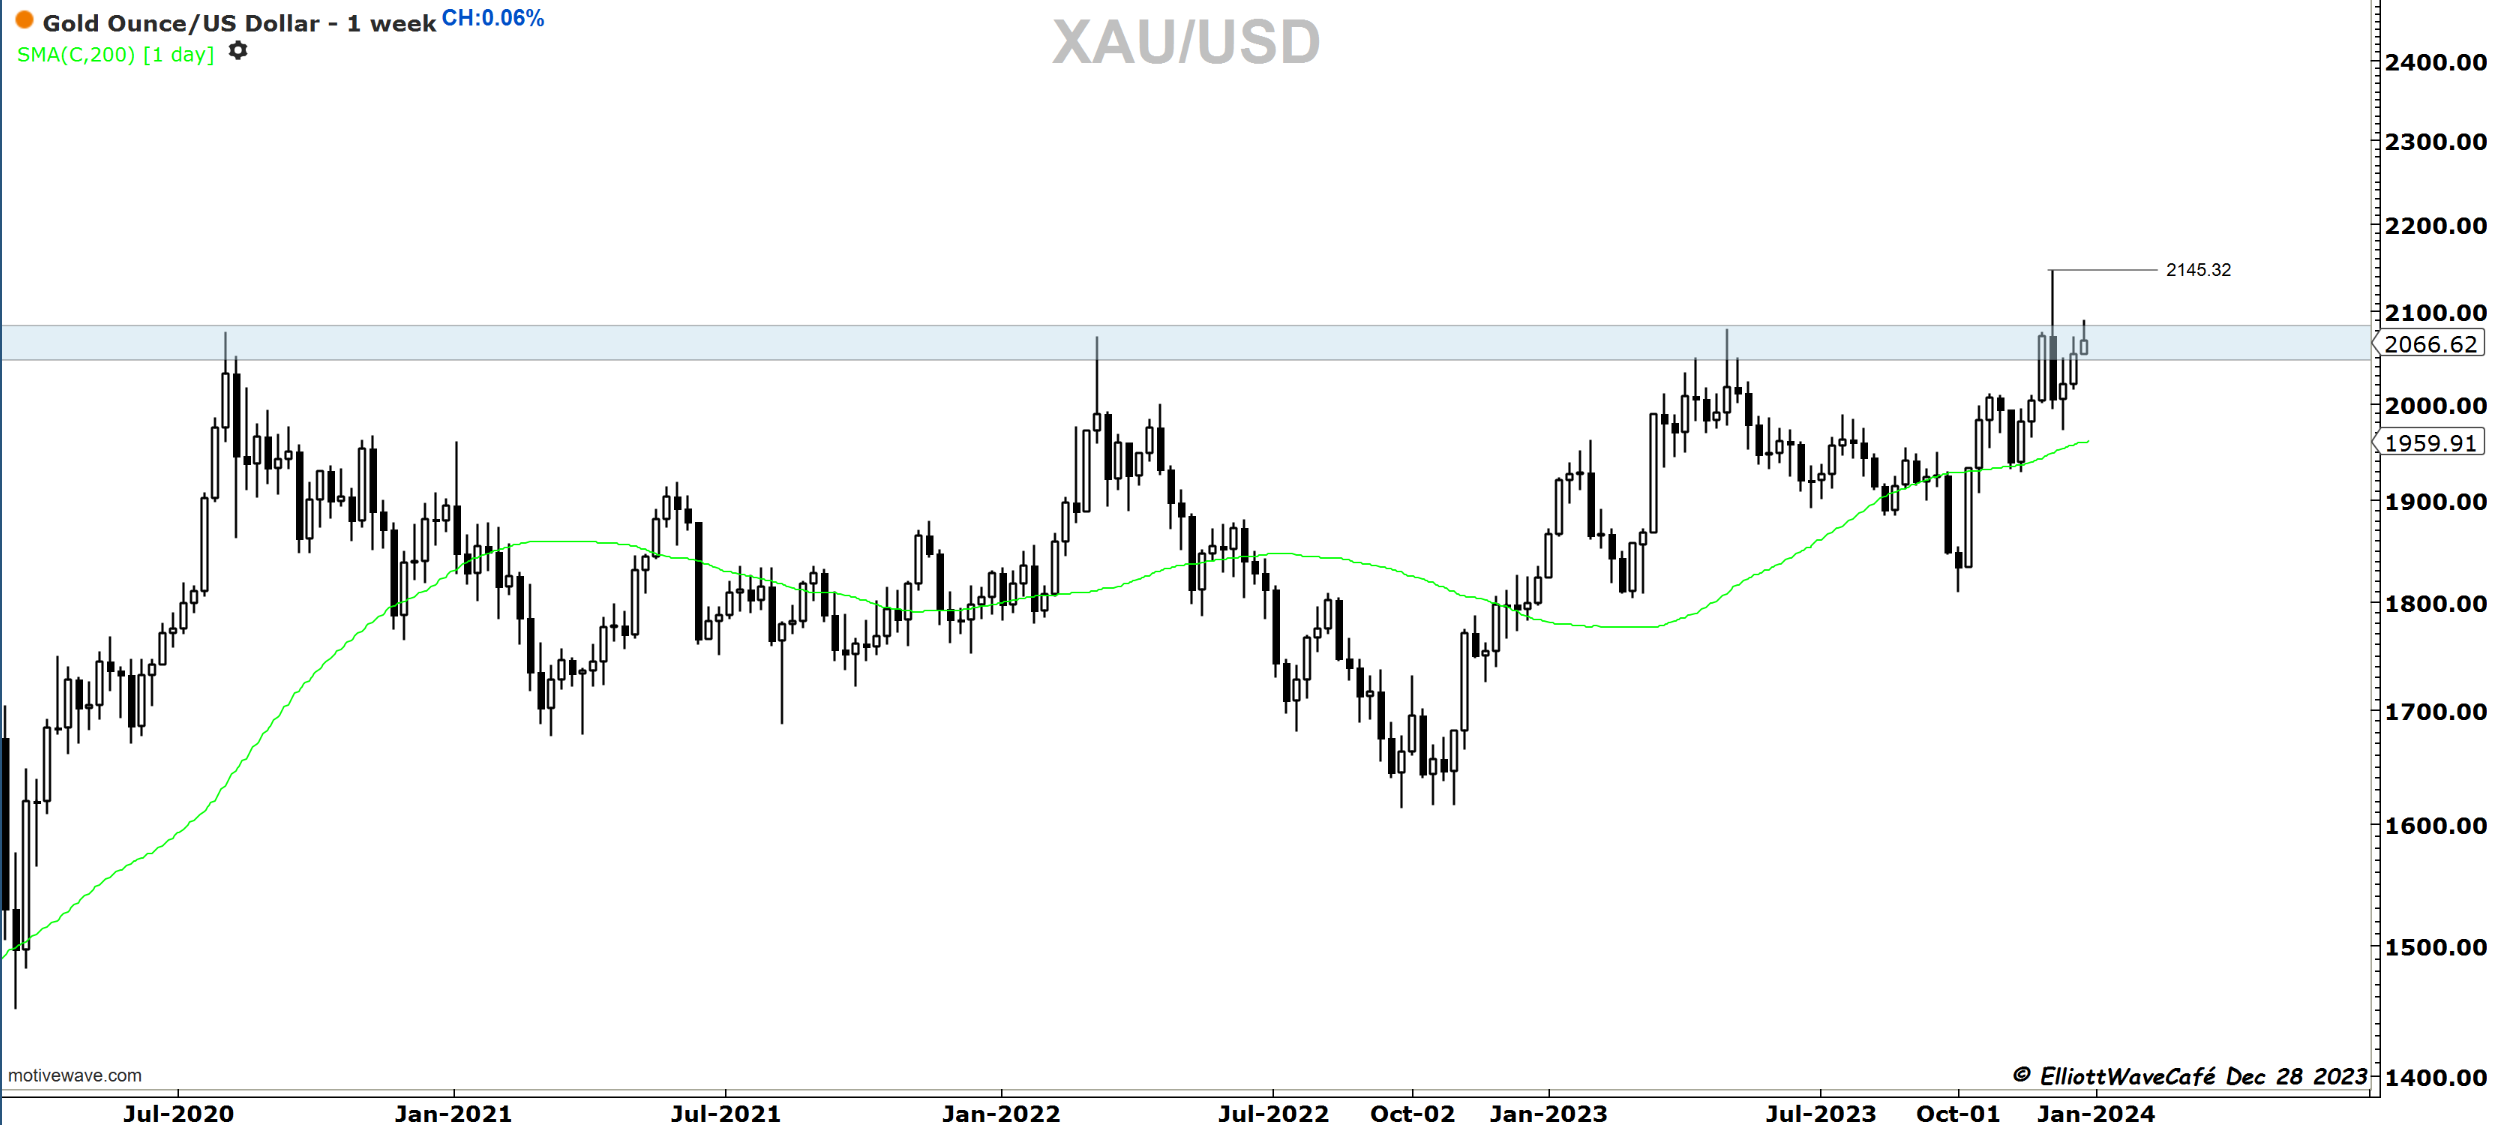
Seasonally, Gold should have a very bullish January. That’s a bit conflicting with the bullish dollar and the cycles on the daily time frames, but it’s been grinding higher, pulling back a touch more than the 61.8% of the failed breakout. I will make no recommendations, but it does look tempting for upside breakouts.
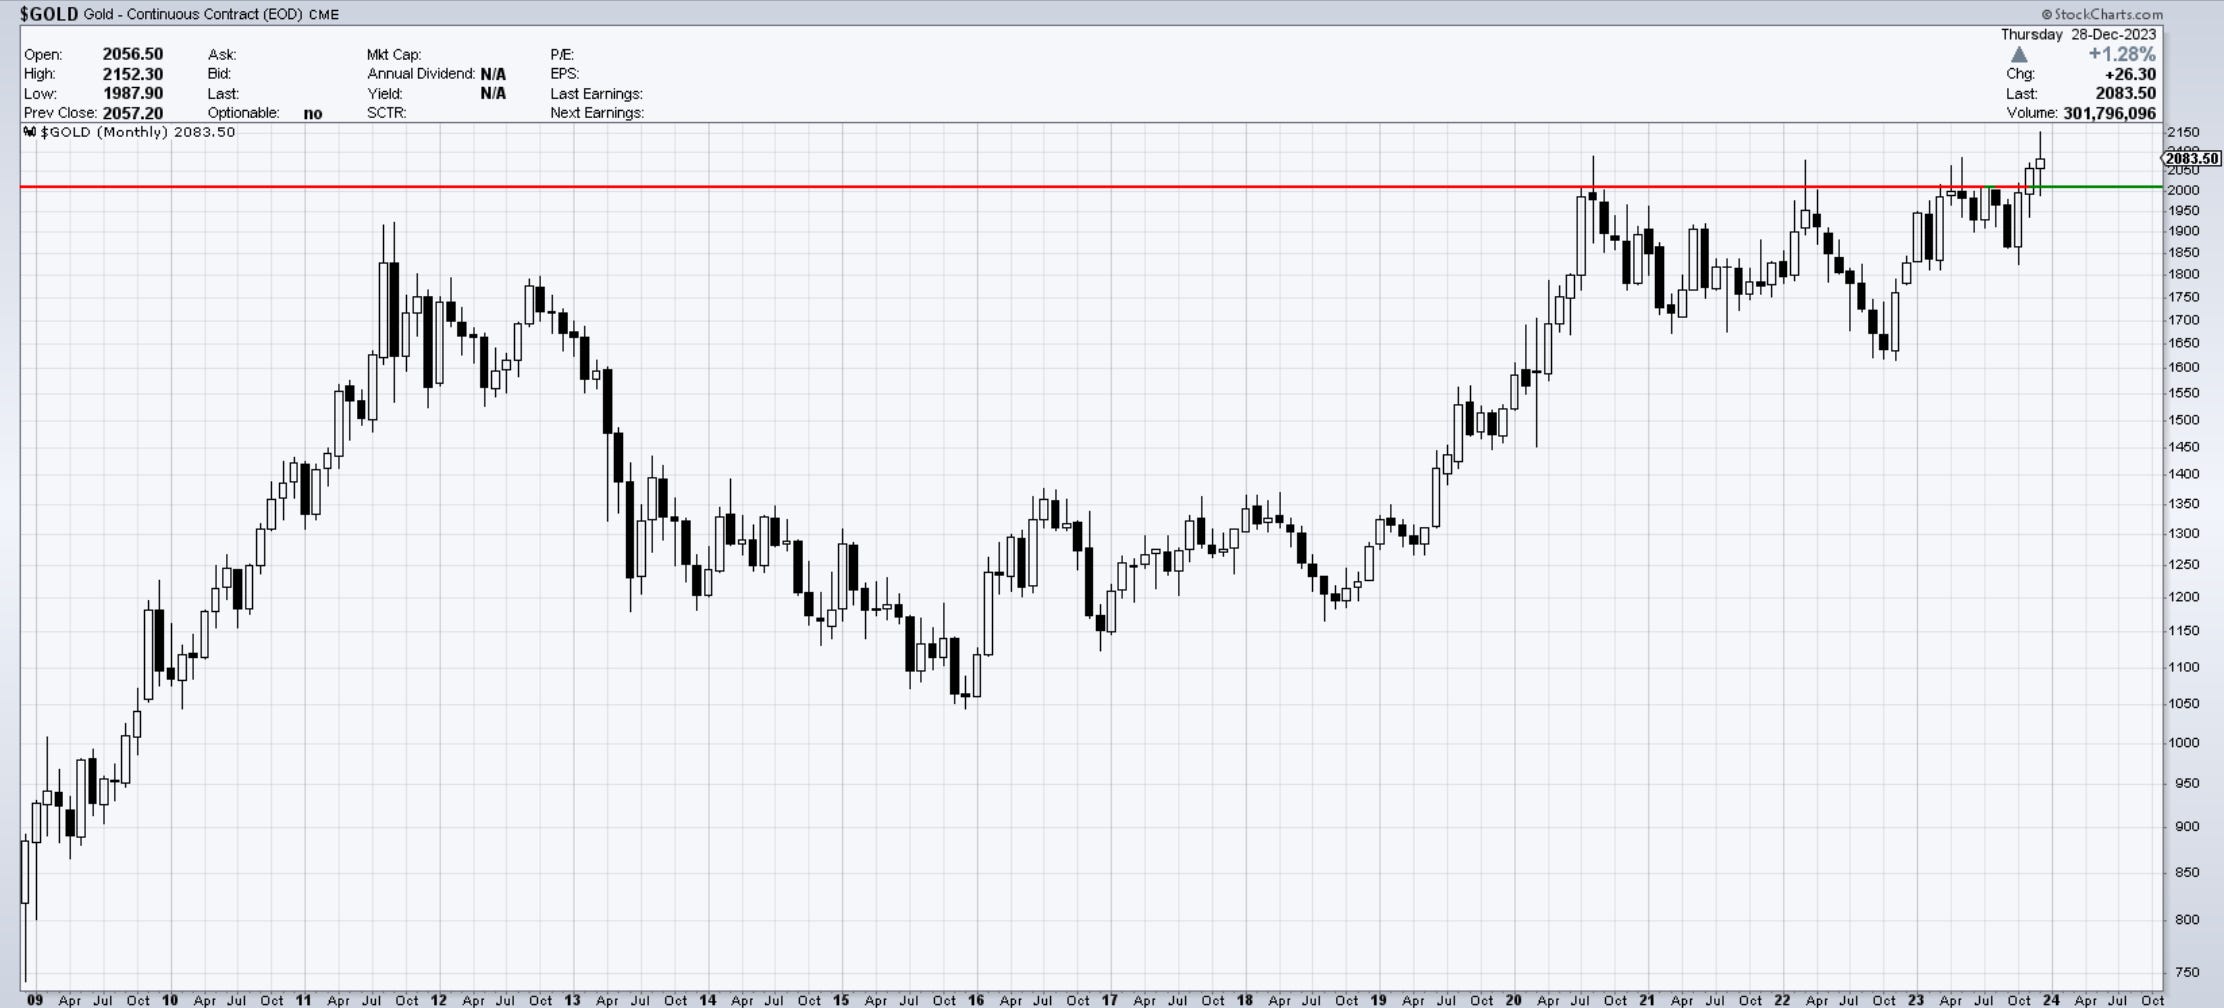
Here are the Monthly closes with one day to go. This will be the second month up here closing above prior closes, but notice has yet to close to a new ATH. With stops below 1973, this is a market worth watching in 2024.
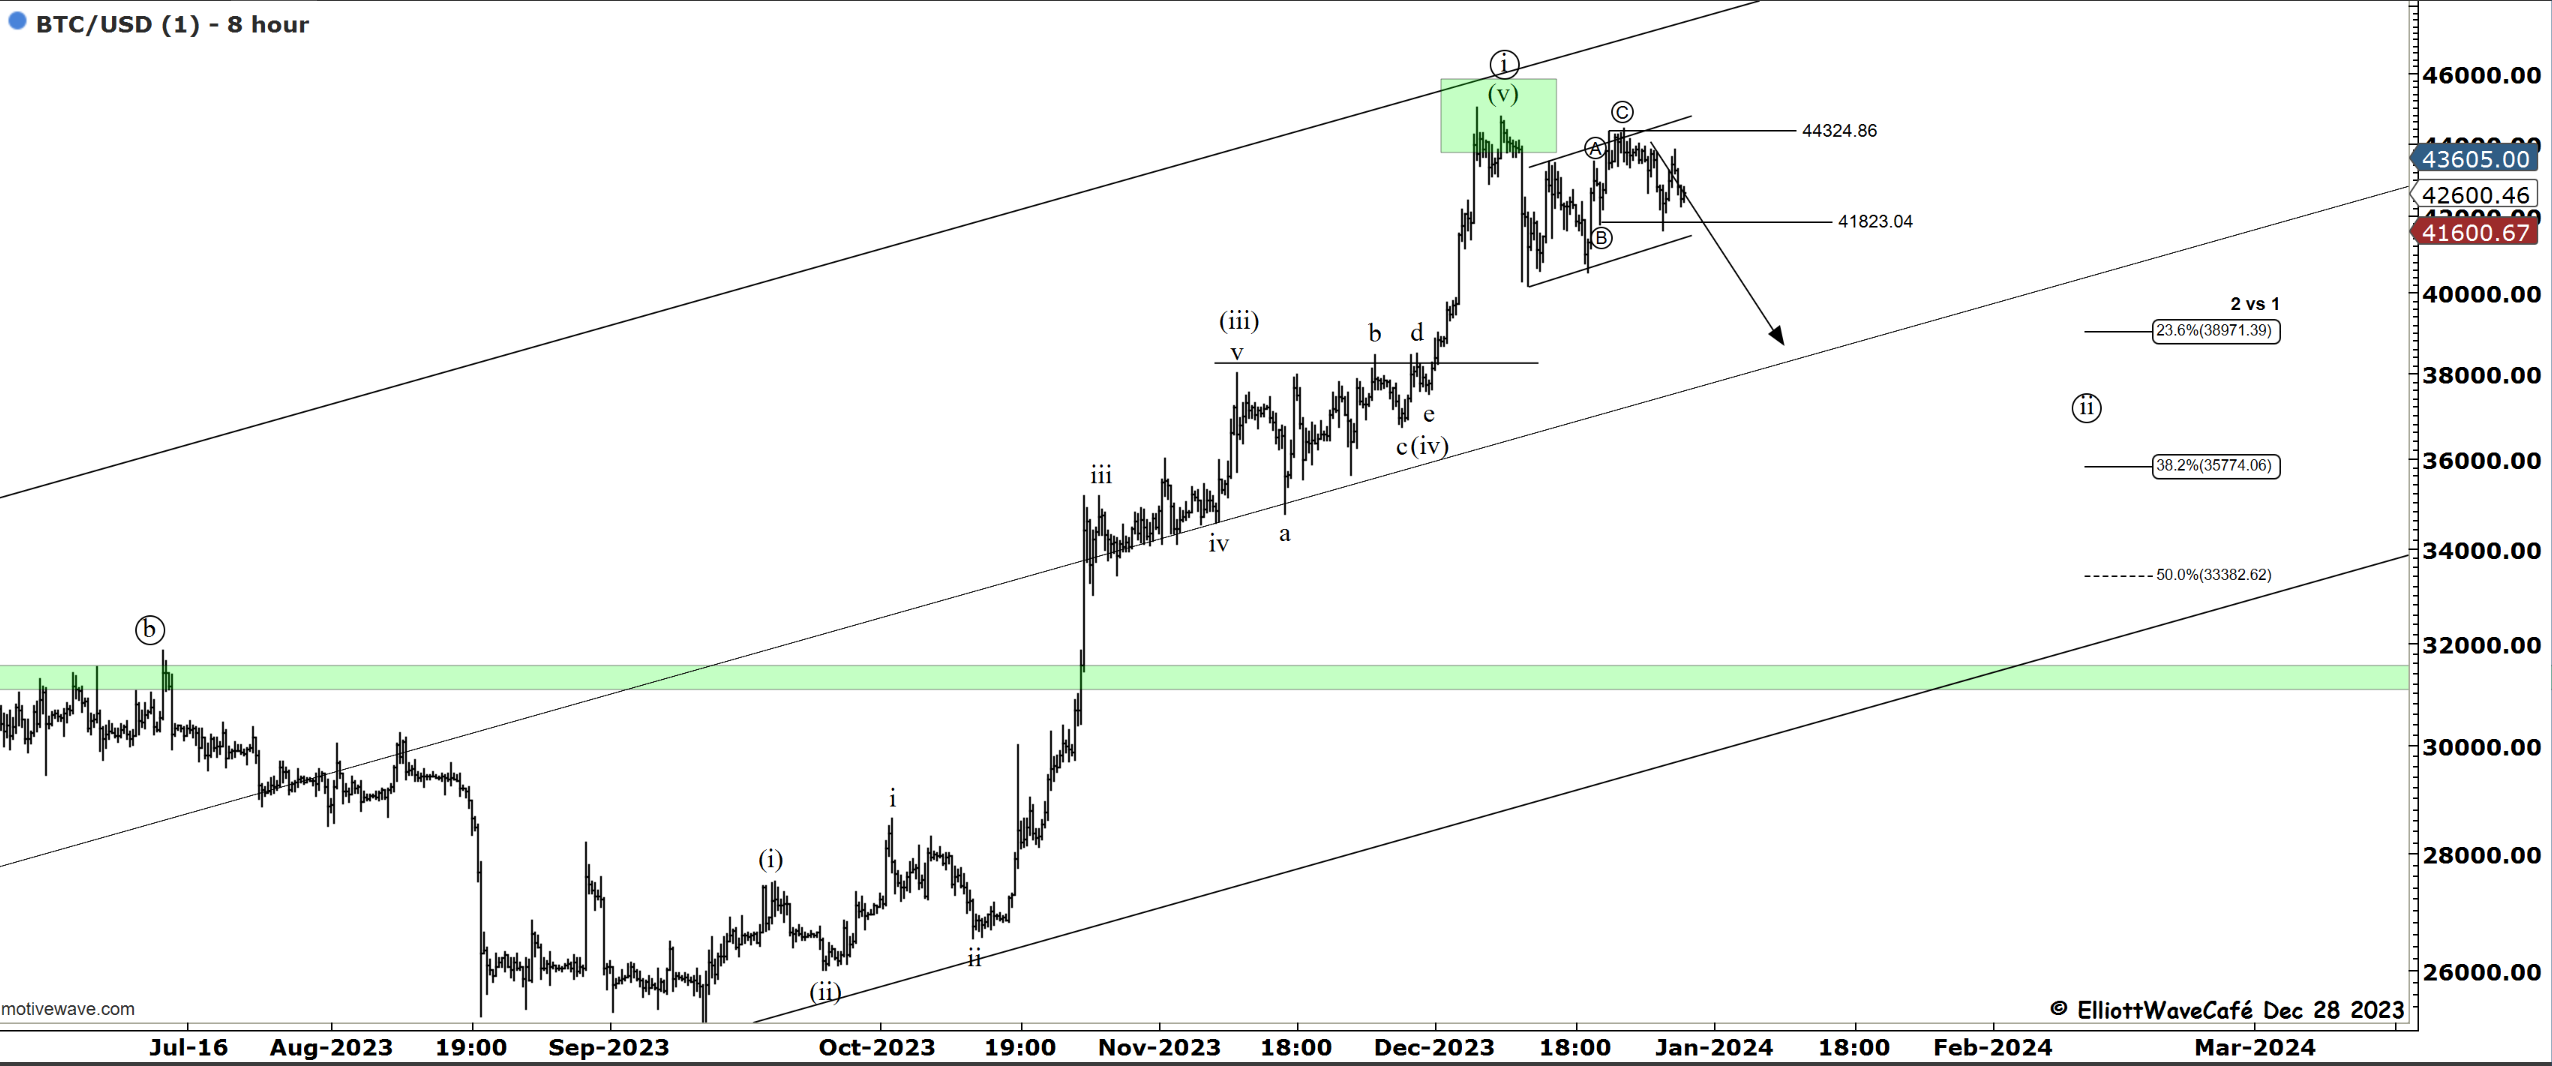
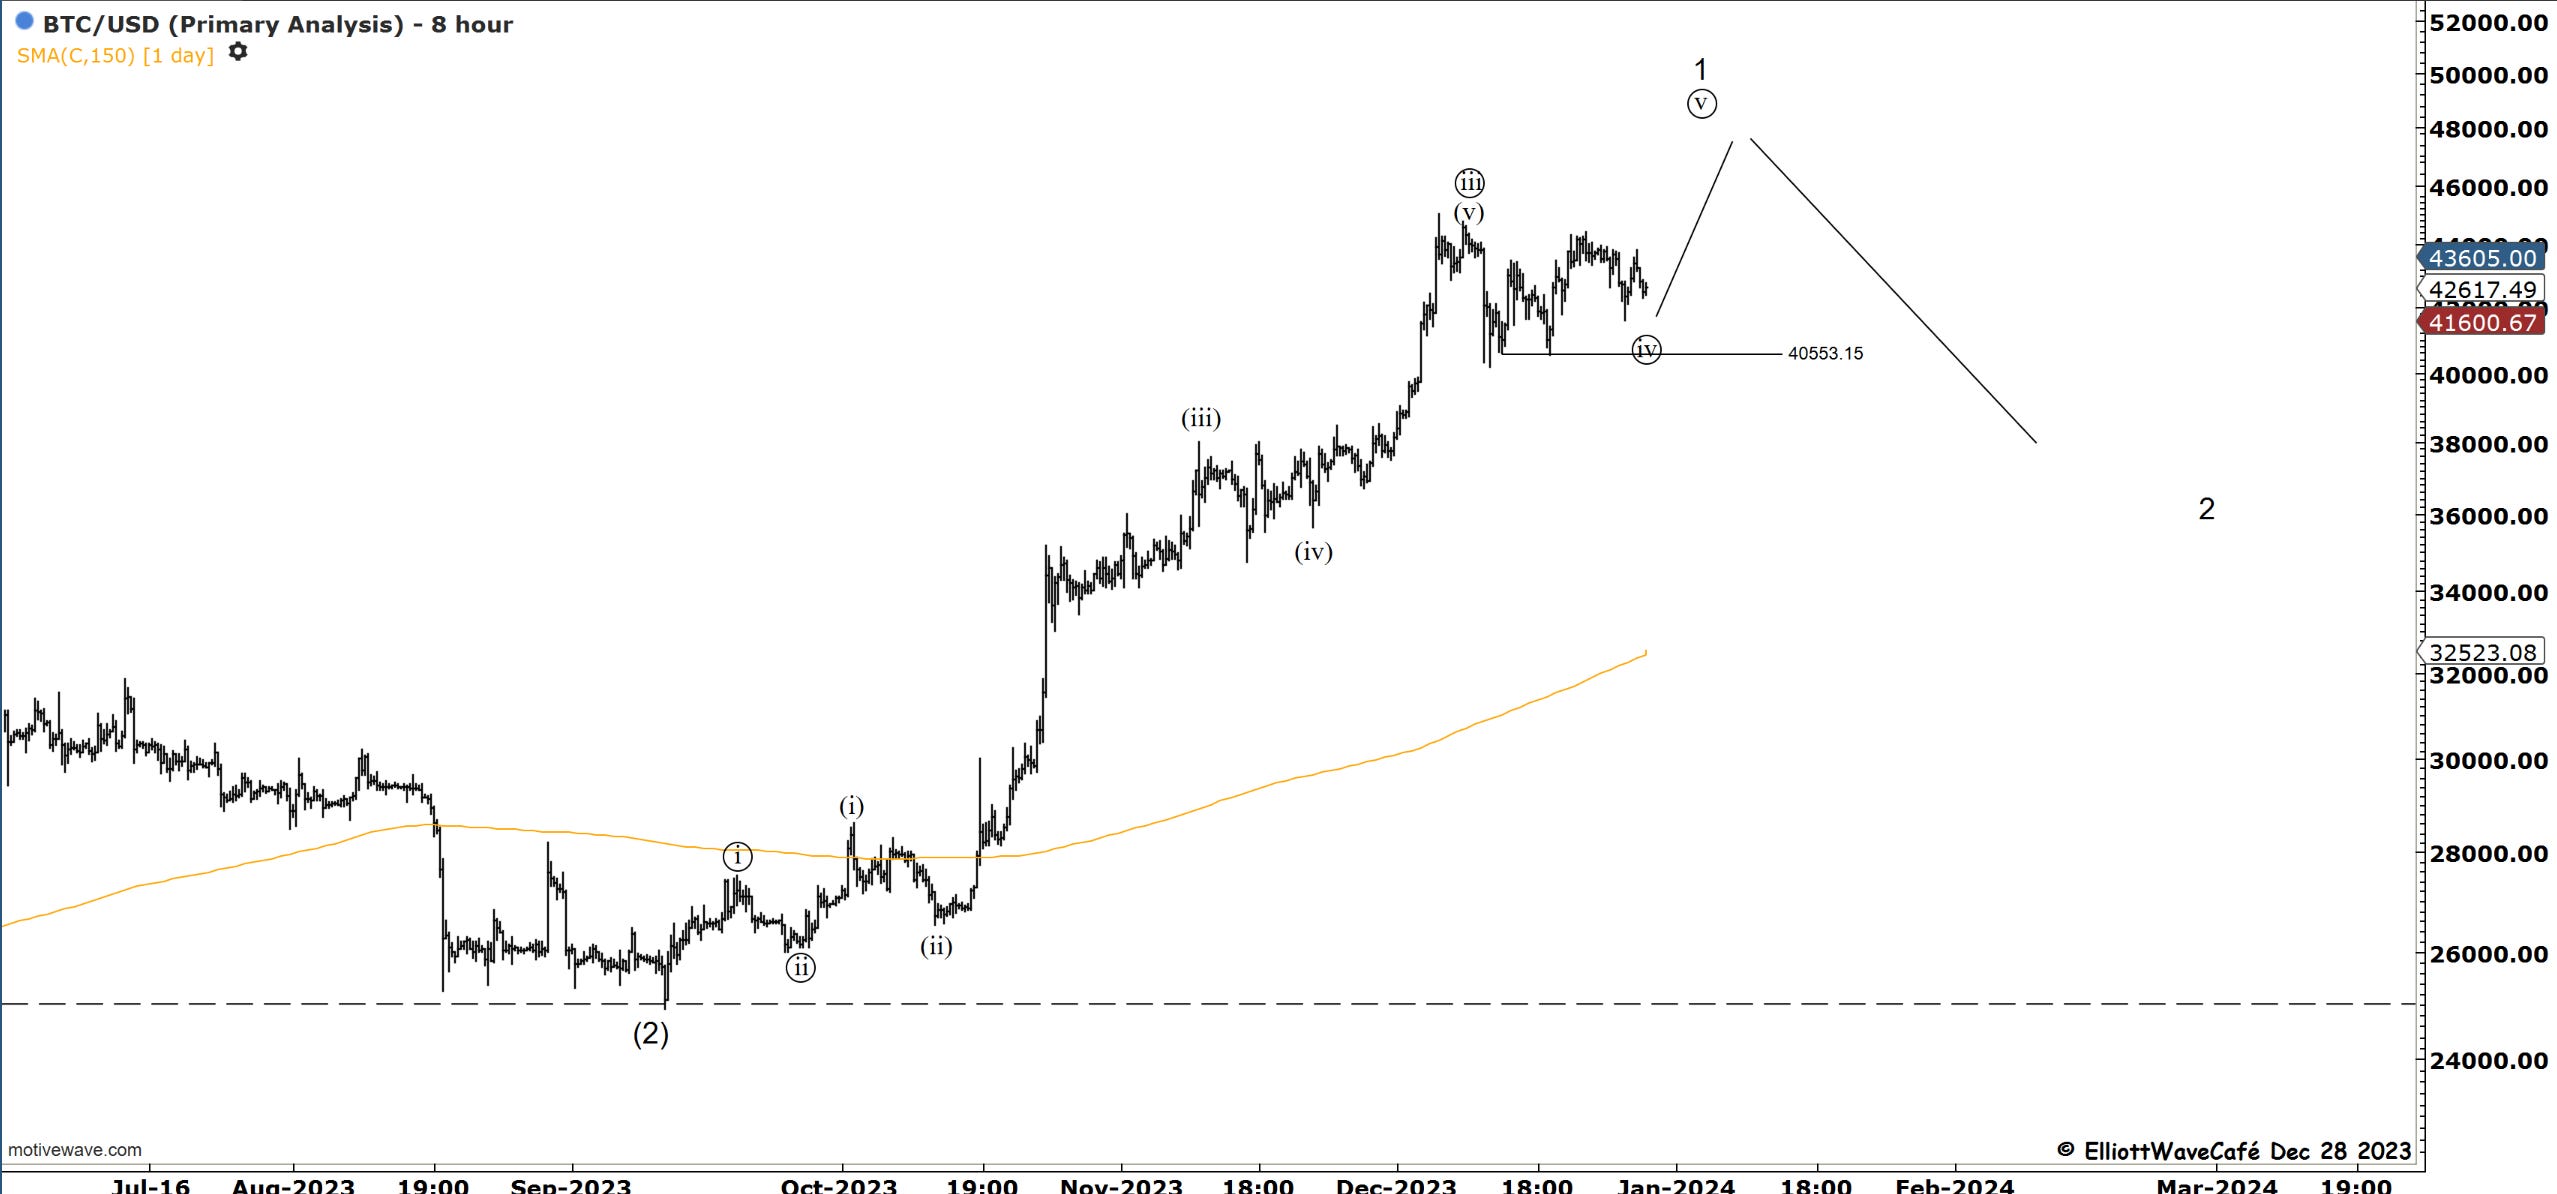
Bitcoin
We’re stuck between these two counts in BTC. A completed move, or one more push higher to complete it. Seasonally, the Month of January manifests positively until about the 7th or 8th, followed by a period of weakness for the rest of the month. A break of 44,434 will active chart two, while a break of 40,500 will focus on the first.
“Double shot” Daily member video coming up next,
If you’re new to Elliott Wave or need to refresh, there is a 7-hour video course with downloadable slides under The Coarse tab on the website.
Have a great day wherever you are! - trade well, and don’t forget to subscribe and drop a like if this letter helps you in any way.
Cris
email: ewcafe@pm.me